 Xianmang Xu
 Wen Zhang4
95% of researchers rate our articles as excellent or good
Learn more about the work of our research integrity team to safeguard the quality of each article we publish.
Find out more
ORIGINAL RESEARCH article
Front. Public Health , 10 October 2023
Sec. Environmental Health and Exposome
Volume 11 - 2023 | https://doi.org/10.3389/fpubh.2023.1250572
This article is part of the Research Topic Air Pollution as a Risk Factor Affecting Human Health and Economic Costs View all 18 articles
Aiming to investigate the health risk impact of PM2.5 pollution on a heavily populated province of China. The exposure response function was used to assess the health risk of PM2.5 pollution. Results shows that the total number of premature deaths and diseases related to PM2.5 pollution in Shandong might reach 159.8 thousand people based on the new WHO (2021) standards. The health effects of PM2.5 pollution were more severe in men than in women. Five of the 16 cities in Shandong had higher health risks caused by PM2.5 pollution, including LinYi, HeZe, JiNing, JiNan, and WeiFang. PM2.5 pollution resulted in nearly 7.4 billions dollars in healthy economic cost, which accounted for 0.57% of GDP in Shandong in 2021. HeZe, LiaoCheng, ZaoZhuang, and LinYi were the cities where the health economic loss was more than 1% of the local GDP, accounted for 1.30, 1.26, 1.08, and 1.04%. Although the more rigorous assessment criteria, the baseline concentration was lowered by 30 μg/m3 compared to our previous study, there was no significant increase in health risks and economic losses. China’s air quality improvement strategy may already be having a positive effect.
Air pollution and population health have always been hot topics in the field of environmental research (1–4). In the past decades, air pollution has caused a series of serious health hazards to people in China (5–8). As one of the main pollutants of air pollution, fine particulate matters (PM2.5) contains complex chemical components which including various toxic substances (9–11). Because of its diminutive size, PM2.5 can enter in the respiratory tract and lungs (12). Once some toxic substances enter the human bloodstream, they may increase the burden on the heart (13). Long-term exposure to high concentrations of PM2.5 will increase the health risk of the population, especially the respiratory diseases and cardiovascular diseases (14, 15). It also increases health care costs in related areas (16).
In previous studies, respiratory disease, cardiovascular disease, and lung disease were typically used as the health endpoints of health risk assessment (14–17). In some studies, asthma, acute bronchitis and chronic bronchitis are also part of the evaluation system (7, 18, 19). Some scholars use country’s air quality standards as health guidelines (20). In other studies, the World Health Organization (WHO) air quality guidelines are generally used as the baseline concentration for calculation. No matter which standard is adopted, it reflects people’s concern for environmental safety. That focus has been growing in recent years.
In March 2021, the “14th Five-Year Plan for National Economic and Social Development of the People’s Republic of China and the Outline of Long-term Goals for 2035” offered to intensify the battle against pollution and basically eliminate heavy pollution days. In October 2021, 10 ministries and commissions including the Ministry of Ecology and Environment and the governments of seven provinces (municipalities) including Shandong jointly issued the “Plan for Comprehensive Control of Air Pollution in Autumn and Winter 2021–2022.” 13 of the 16 cities in Shandong were included in the strategic control regions. In the “Action Plan for the Treatment of New Pollutants (2022)” issued by the General Office of the State Council, environmental health risk prevention has also been put at the heart of the case. Reducing the health risks and costs of PM2.5 pollution is a growing concern. As one of the most polluted areas in North China, Shandong is still facing a severe situation of air pollution prevention and control (21, 22). And the health and economic costs caused by PM2.5 pollution in Shandong should be made seriously.
As the third largest province in GDP in China, Shandong was plagued by air pollution (23). Although air quality in Shandong had been improving in recent years, heavy pollution events were still common in some cities (24–26). At present, only a few developed cites in Shandong have publicly reported the health risk of PM2.5, such as Jinan and Qingdao (27, 28). There was not any accurate data on the health cost of PM2.5 pollution for the whole Shandong Province. According to the relevant studies in key regions such as Beijing-Tianjin-Hebei, Yangtze River Delta and Pearl River Delta, the health cost of PM2.5 pollution exposure might accounts for 0.3–1.0% of the total annual GDP (18, 29–33). In 2021, the health cost caused by PM2.5 pollution in Shandong Province was preliminarily estimated to be about 3.86–12.88 billion dollars. On September 22, 2021, the WHO further improved the original air quality guidelines based on the conclusions of the current important reports by global scholars, and lowered the annual recommended level of PM2.5 from 10 μg/m3 to 5 μg/m3. The 24-h recommended level of PM2.5 was reduced from 25 μg/m3 to 15 μg/m3. The reduction in the health guideline concentration means a change in the original health risk assessment criteria for PM2.5 exposure. It also implies that the economic cost of PM2.5 exposure may have been underestimated.
In order to understand the PM2.5 health risk in Shandong Province. In this study, the health and economic effects of PM2.5 exposure in Shandong were evaluated using the new WHO guidelines as health threshold. The evaluation results were also compared with our previous study to discuss the impact of the new WHO guidelines on health risk assessment. Finally, the prevention and control strategies of air pollution in China were discussed based on the evaluation results. Therefore, this study will help clarify the health costs of PM2.5 pollution and fill the gap on the health economic effects of PM2.5 pollution in Shandong Province. It also provided scientific reference for the optimization of air pollution control strategy in China.
Shandong Province is situated in the North China Plain, on the east coast of China. It consists of 16 cities (Figure 1). It covers an area of 158,000 square kilometers and has a population of over 101.5 millions (2021). Basic data in 16 cities of Shandong Province was shown in Table 1. The annual average concentration of PM2.5 was 39 μg/m3, a year-on-year improvement of 15.2% (2021). The annual average concentration of 39 μg/m3 was well above the new health guidelines of WHO. The Ambient Air Quality Composite Index, which takes into account the concentrations of six pollutants including PM2.5, PM10, SO2, NO2, CO, and O3, is used to rank the air quality of 168 key Chinese cities. In this comprehensive index ranking of 168 key cities in China, four cities including Zibo, Liaocheng, Heze and Zaozhuang were in the bottom 20. The situation of air pollution prevention and control in Shandong province was still serious.
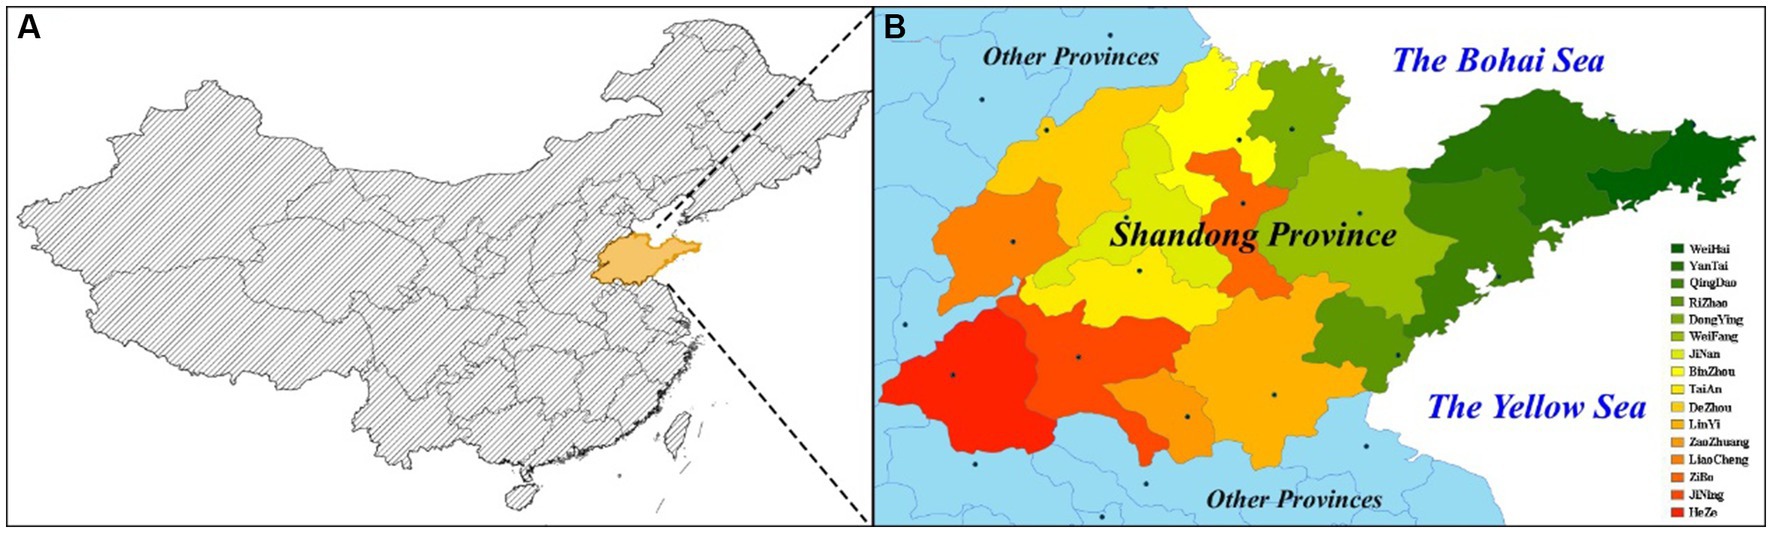
Figure 1. (A) Shandong Province within China; (B) Cities in Shandong Province.
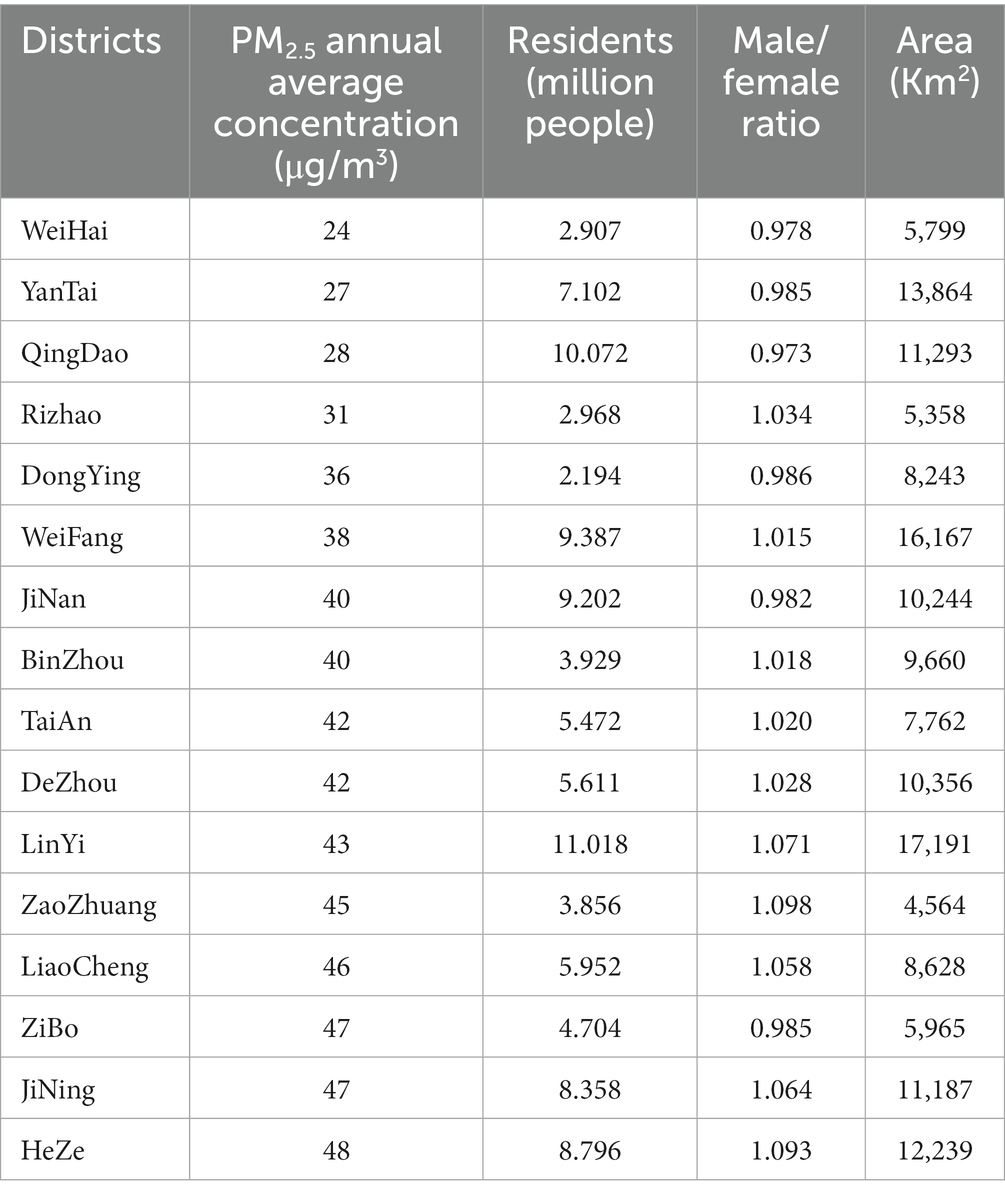
Table 1. Basic data in 16 cities of Shandong Province.
Shandong is one of the provinces with serious air pollution in north China, especially in the western part of Shandong. According to the Bulletin of Ecological Environment of Shandong Province (BEESP 2021), only four cities had PM2.5 concentrations that met the II-level National Guidance Standard, including Qingdao, Yantai, Weihai, and Rizhao. The remaining 12 cities had average annual concentrations of more than 35 μg/m3. All of the 16 cities failed to meet WHO health guideline. In this study, the PM2.5 data was obtained from the Bulletin of Ecological Environment of Shandong Province (BEESP 2021),1 Shandong Environmental Air Quality Status Report (SEAQSR 2021),2 and the Official website of Shandong Department of Ecology and Environment.3
Since population health data were difficult to obtain, the health data used in this study mainly came from the Disease and Health Status Report of Residents in Shandong Province (DHSR 2016; it can be obtained by contacting corresponding author) and the Report on Incidence and Mortality of Key Chronic Diseases in Shandong Province (RIMKCD 2018; it can be obtained by contacting corresponding author). The health cost data was obtained from the Statistical Bulletin of Health Development of Shandong Province (SBHDSP 2021).4 Population data were obtained from the Seventh National Census (SNC 2021)5 published in May 2021. This study also assessed the health risks of PM2.5 for different genders in Shandong. The Male/Female ratio was from the public security household registration statistics in Shandong Statistical Yearbook (SSY 2022).6 Area data was drawn from government portals.
To assess the health risks of PM2.5 exposure, the first step should be to correlate PM2.5 concentrations with population health. Therefore, it is a critical step to determine the exposure response coefficients used in this work. In this study, all exposure response coefficients were referenced from our earlier studies and other recent relevant studies in China (18, 27, 34–36). Table 2 presents the baseline incidence for six health endpoints in Shandong Province.
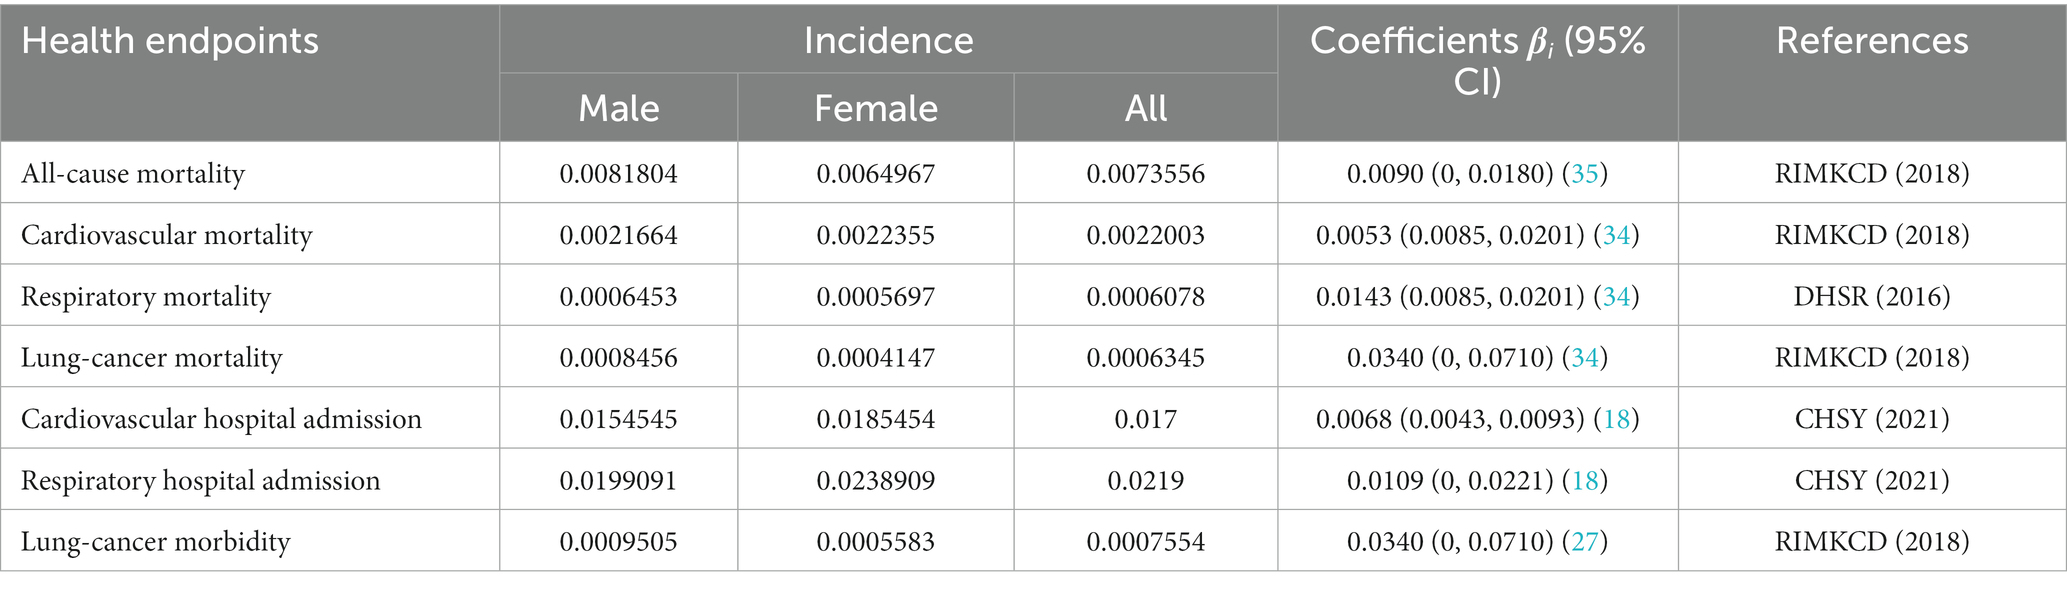
Table 2. Baseline incidences and exposure-response coefficients associated with 10 μg m−3 increment of PM2.5.
In a large population, the occurrence of disease can be regarded as a low probability event (18, 27). Therefore, its probability of occurrence should conform to the Poisson distribution (34). In this study, the health risk was calculated with the PM exposure response function which was the WHO recommended model for health effect estimation in high PM concentration area (WHO, 2006). There are four major factors in the Equations (1) and (2), which including population size, PM2.5 concentration, exposure response coefficient, and the baseline incidence of health endpoint.
Here, E0 is baseline incidence of a disease, Ei is the estimated incidence of health endpoint i under PM2.5 concentration C, C0 is the baseline concentration of PM2.5 (set as 5 μg/m3, the new WHO annual guideline concentration), C is the exposure concentration of PM2.5, βi is the exposure response coefficient. P is the population size, ∆E is for population health risks associated with PM2.5 pollution. In this study, C0 refers to the new WHO standards.
In this study, health economic losses were estimated using health risk assessment results and average disease costs. The economic effect of PM2.5 was assessed with the following equation:
where ECi is the total cost of health endpoint i; Costi is the cost per case.
Here, the health economic effect of hospitalization was estimated using the cost of illness (COI) method (7, 18, 27). Hospitalization costs were obtained from the SBHDSP 2021. Premature death cost was estimated using the method of value of statistical life (VSL) (37). VSL refers to the willingness-to-pay of patients to avoid risk of death. Since willingness-to-pay usually increases with people’s income, a adjusted equation was utilized to correct VSL in this study (27). The per capita income was obtained from Shandong Statistical Yearbook. The adjusted equation of VSL as following:
where VSLnow and VSLpast refers to current and past willingness to pay; Incomenow and Incomepast represents current and past per capita income; e is an elastic coefficient of willingness-to-pay assumed to be 0.8. In this study, VSL was adjusted twice because it lacked a reliable reference value in Shandong. Firstly, it was adjusted to get VSL2021 based on VSL2016 in Jinan. Then, it was adjusted again to get VSLShandong based on the VSLJinan in 2021.
Pollutant concentration is one of the important factors affecting health risk assessment results (38–40). High levels of PM2.5 exposure will increase the risk of some health endpoints such as respiratory, cardiovascular and lung diseases (41–43). As shown in Figure 2, the PM2.5 concentration was relatively low in the area of Shandong Peninsula. While it had a high concentration in the western area of Shandong province. Industrial distribution and regional differences, as well as unbalanced economic development, might lead to the spatial differences in PM2.5 concentration in Shandong. The PM2.5 concentrations of 16 cities in Shandong Province have been provided in Table 1. Therefore, the health effects of PM2.5 pollution were likely to be greater in the western area of Shandong province without considering the influence of population density factor. PM2.5 pollution might have great impact on the four cities including Heze, Jining, Zibo, and Liaocheng.
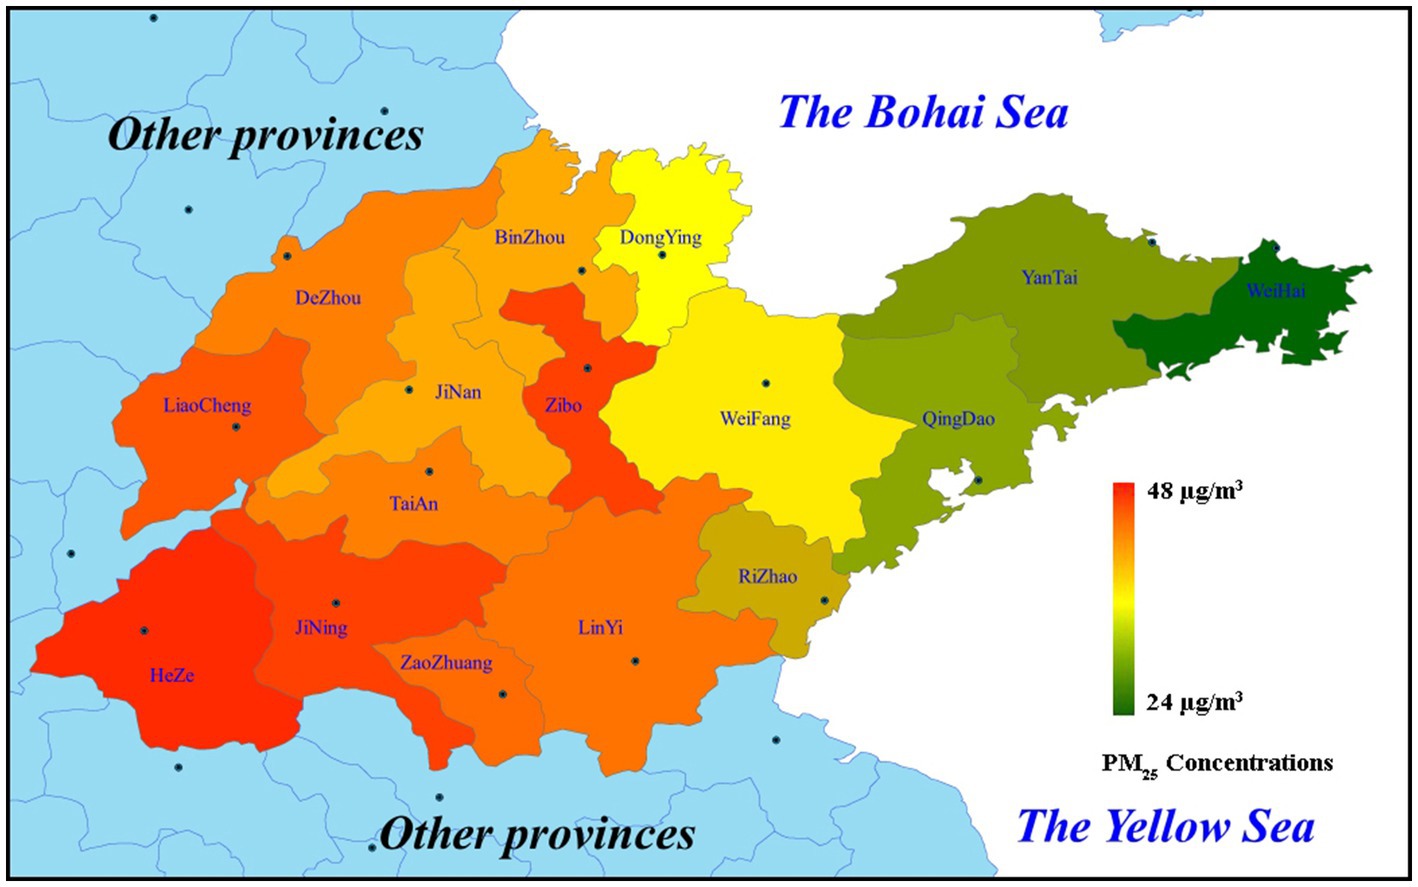
Figure 2. PM2.5 concentrations in 16 cities of Shandong Province in 2021.
As shown in Table 2, the baseline incidences of health endpoints were provided. The incidences of cardiovascular and respiratory diseases were obtained from China Health Statistics Yearbook (CHSY, 2021)7 Male/Female incidences were calculated based on the hospitalization rate of residents and the sex ratio of hospitalized patients in the national survey data in 2018. Due to the exposure-response coefficient of lung cancer morbidity cannot be obtained, its coefficient referred to lung-cancer mortality in this work.
The evaluation result showed that the premature death related to PM2.5 pollution contributed 3.16% of all-cause deaths (shown in Table 3). Among them, the proportion of male was 1.79%, and the proportion of female was 1.37%. Cardiovascular mortality, respiratory mortality, and lung-cancer mortality related to PM2.5 pollution contributed 1.85, 5.08, and 12.51%, respectively, to annual cases of these health endpoints. Cardiovascular hospital admission, respiratory hospital admission, and lung-cancer morbidity related to PM2.5 pollution contributed 2.38, 3.85, and 12.51% to yearly cases of these health endpoints. The four health endpoints related to PM2.5 pollution including all-cause mortality, respiratory mortality, lung-cancer mortality, and lung-cancer morbidity in male were higher than those in female. The contribution of cardiovascular mortality in male and female was roughly equal. The contributions of cardiovascular and respiratory hospital admission in female were higher than those in male. This result was consistent with the findings reported by Bell et al. (44) and Sang et al. (45). Bell et al. (44) pointed out that women might be more susceptible to PM2.5-related hospitalizations for some respiratory and cardiovascular causes. Sang et al. (45) suggested that global ambient PM2.5 pollution caused more premature deaths and consumption in men than in women. Therefore, PM2.5 pollution had a greater impact on respiratory mortality and lung-cancer mortality and morbidity in male. And it also made a significant contribution to all-cause premature deaths in male. While it played an import role on cardiovascular and respiratory hospital admission in female. As a whole, the health consequences of PM2.5 pollution appeared to be more severe in male than in female. For male, more attention should be paid to daily physical examination to reduce the premature death risk from diseases related to PM2.5 pollution, especially respiratory system examination including lungs and respiratory tract.
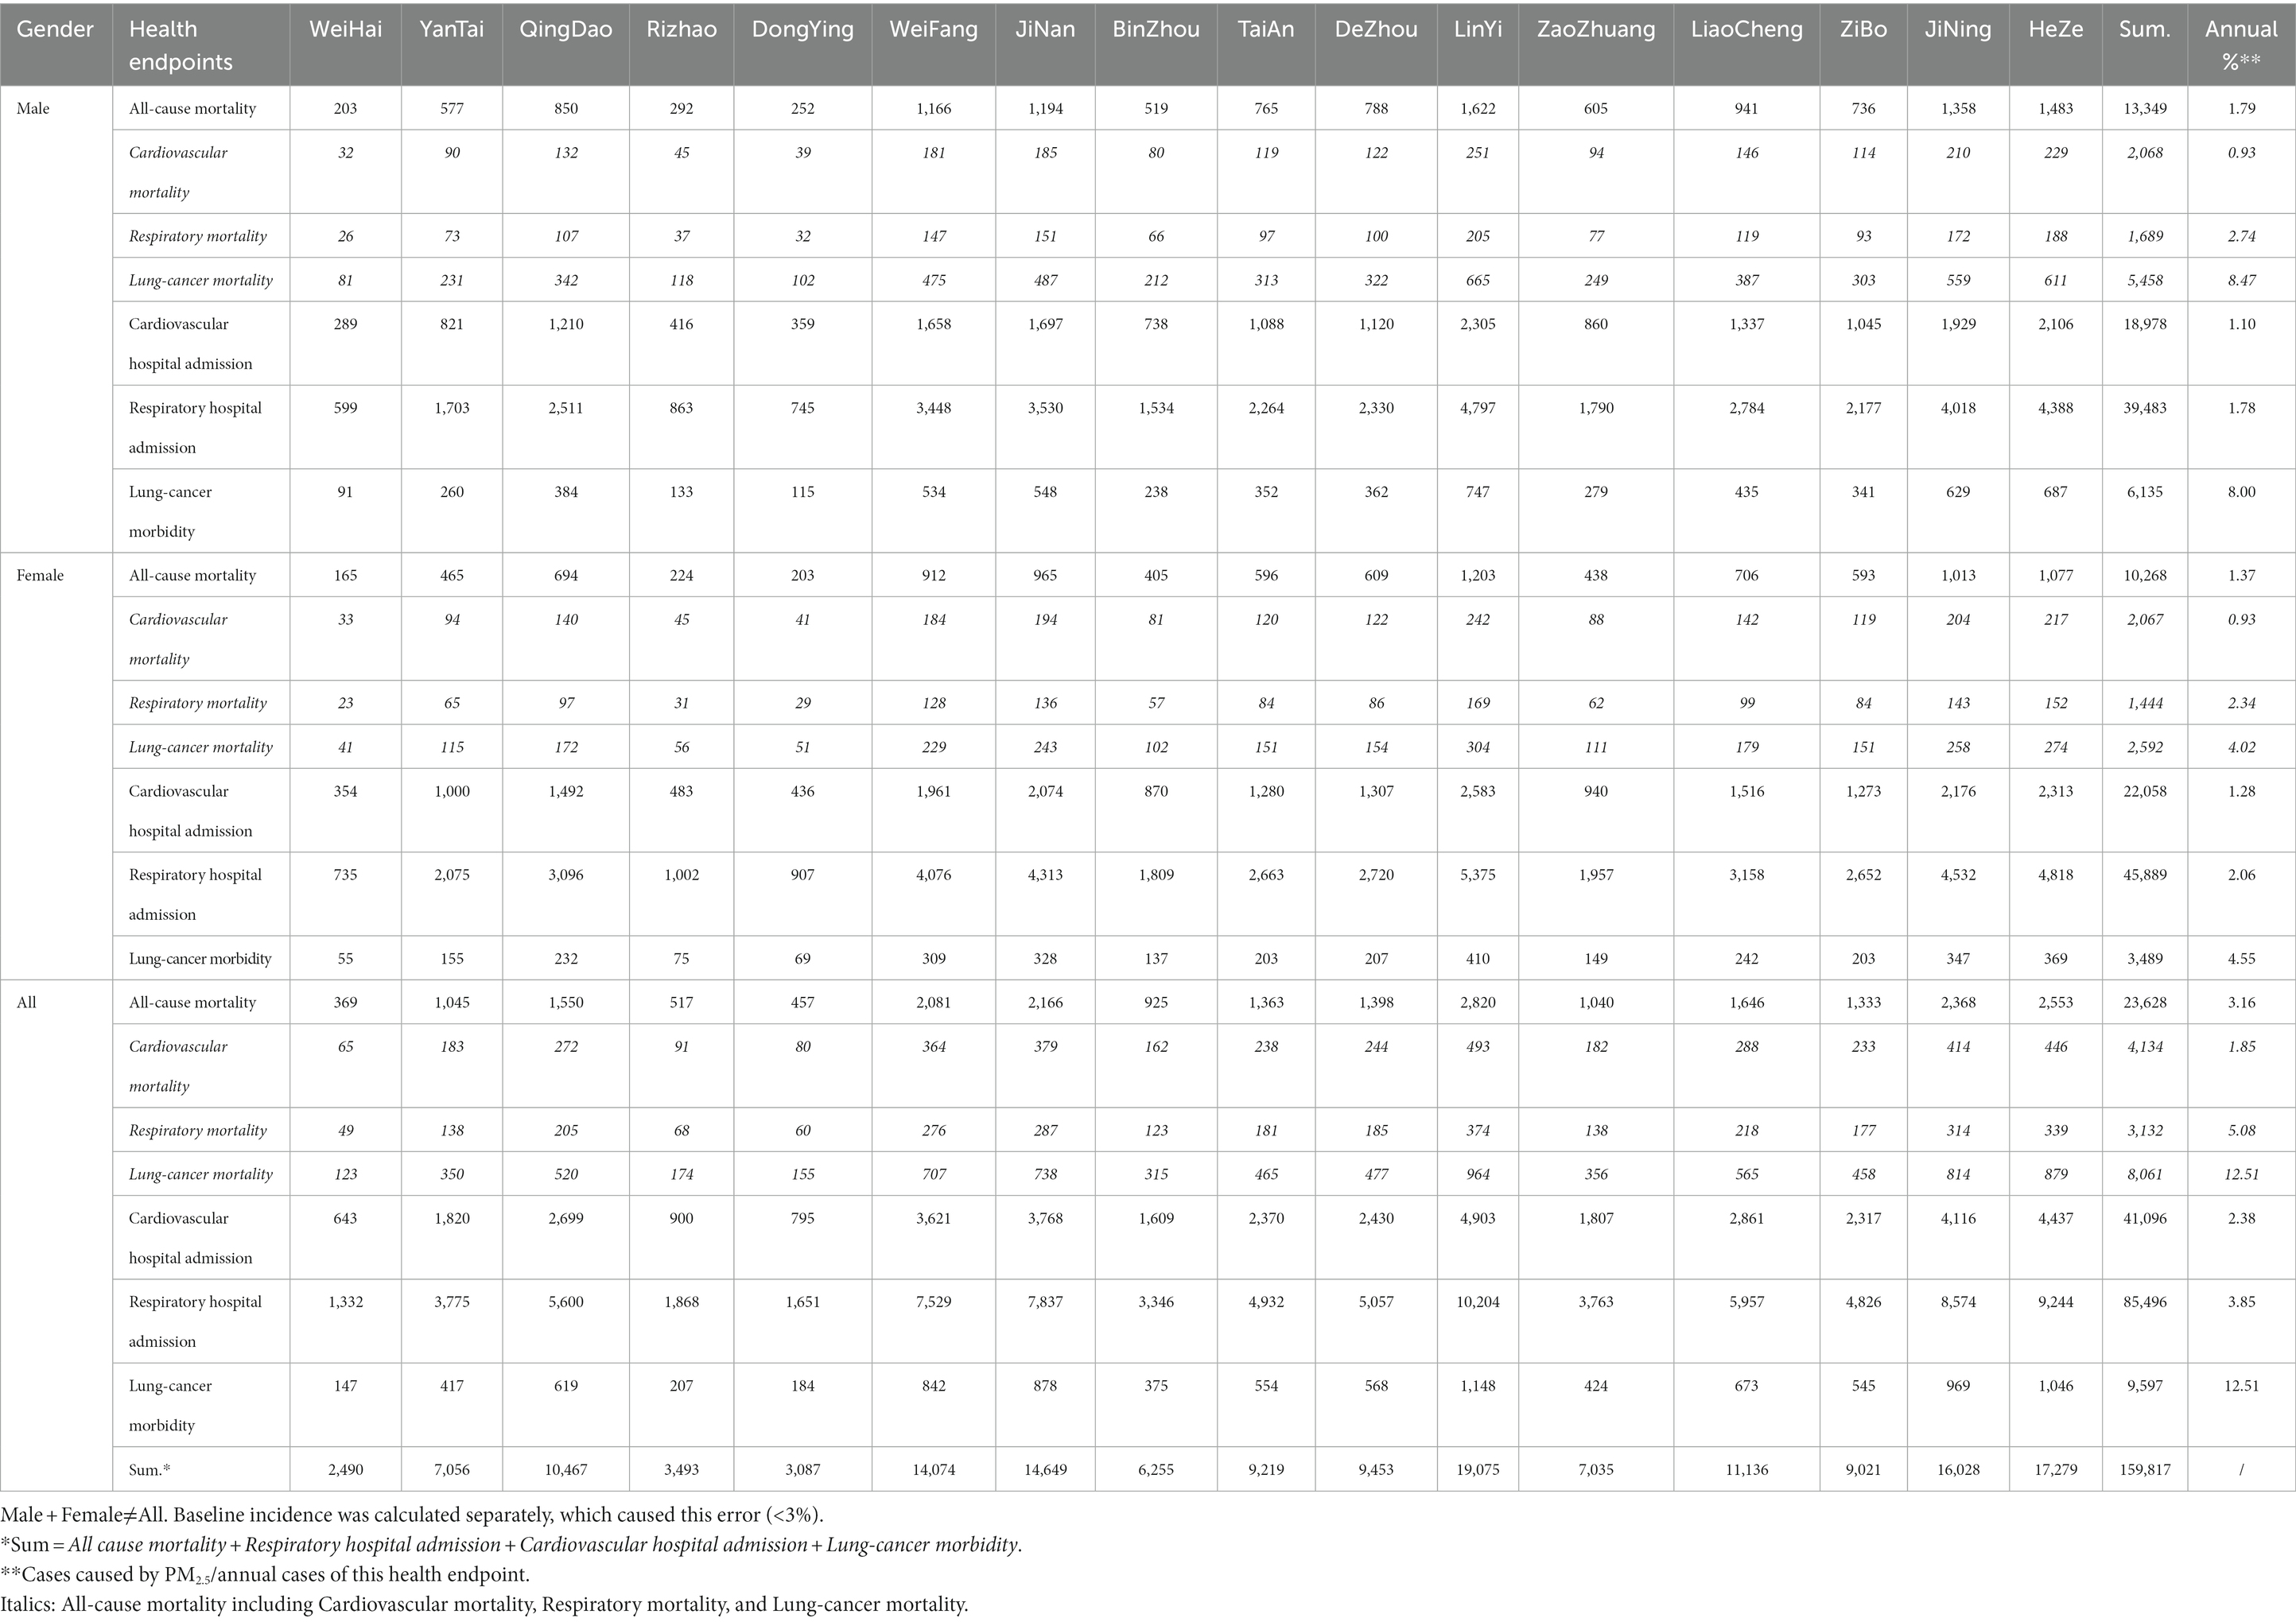
Table 3. Health effect of PM2.5 in Shandong in 2021.
Based on the evaluation results of this study, the number of premature deaths and illnesses related to PM2.5 pollution in Shandong Province reached 159,817 in 2021. Without considering population density, LinYi, HeZe, JiNing, JiNan and WeiFang had higher health risks caused by PM2.5 pollution. In each of these cities, more than 14,000 people experienced premature death or morbidity due to PM2.5 pollution. Only three cities, WeiHai, DongYing and Rizhao, were less impacted by PM2.5 pollution in terms of health risk. The number of premature deaths and illnesses affected by PM2.5 in each of these areas was less than 5,000. Therefore, further strengthening the control of PM2.5 emission will have a positive effect on population health, especially in areas with high health risks.
Health economic effect assessment is an important means to evaluate the economic burden of environmental pollution to a city (46–49). The value of statistical life (VSL) method was a common method to assess the health cost of premature death in previous studies (34). The occurrence of respiratory and cardiovascular diseases is closely related to PM pollution, which has been confirmed in many previous studies (50–54). Therefore, the hospitalization costs for respiratory and cardiovascular diseases were also assessed in addition to premature death endpoint in this study. Since the exact cost of each disease could not be obtained, the mean hospitalization cost was selected as the reference value for calculation in this work. Owing to the high mortality rate of lung-cancer, its health cost was estimated using VSL method in this study. The costs of premature death and hospitalization were shown in Table 4. Finally, the economic effect related to PM2.5 pollution was assessed based on the result of health risk assessment.
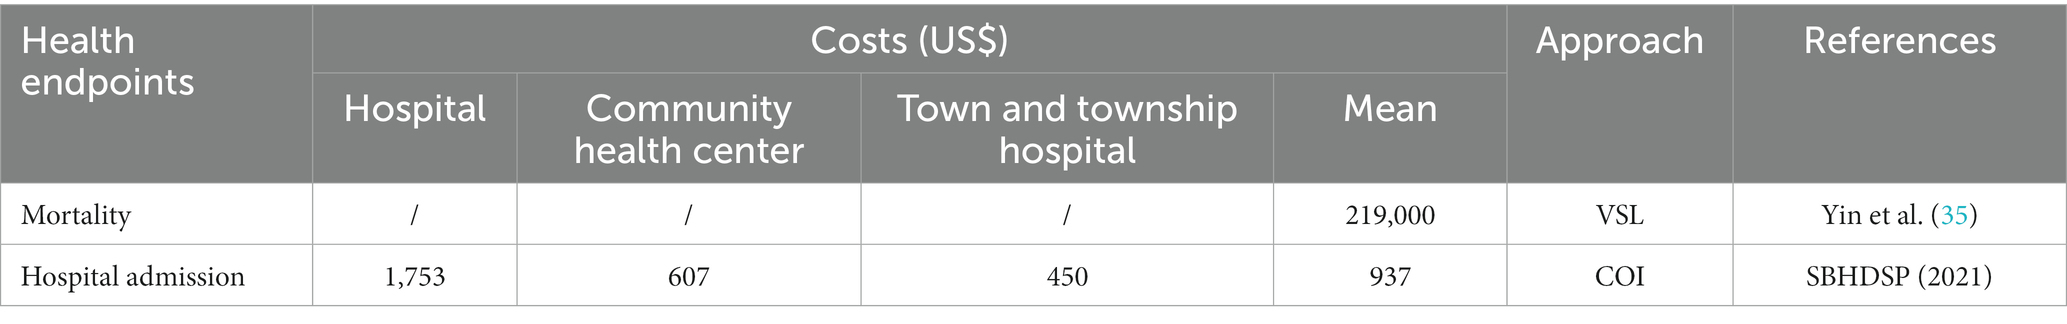
Table 4. Health cost situation.
Some scholars suggested that the health economic costs caused by PM2.5 pollution could be around 1% of GDP (7, 22). As shown in Table 5, the health economic loss of each heath endpoint related to PM2.5 pollution was estimated. It resulted in nearly 7.4 billions dollars in healthy economic cost, which accounted for 0.57% of GDP in Shandong in 2021. This result was basically consistent with our previous study in Beijing. It accounted for 0.87, 0.54, and 0.45% of GDP in Beijing during 2014–2016, respectively (34). The percentage of health economic loss in GDP was lower than other long-term exposure studies in China (18, 27, 35). It may be due to the failure to account for outpatient costs, such as asthma, acute bronchitis and chronic bronchitis. In addition, the reduction of air pollution in China may also be a factor in the falling economic costs of health (34, 55, 56).
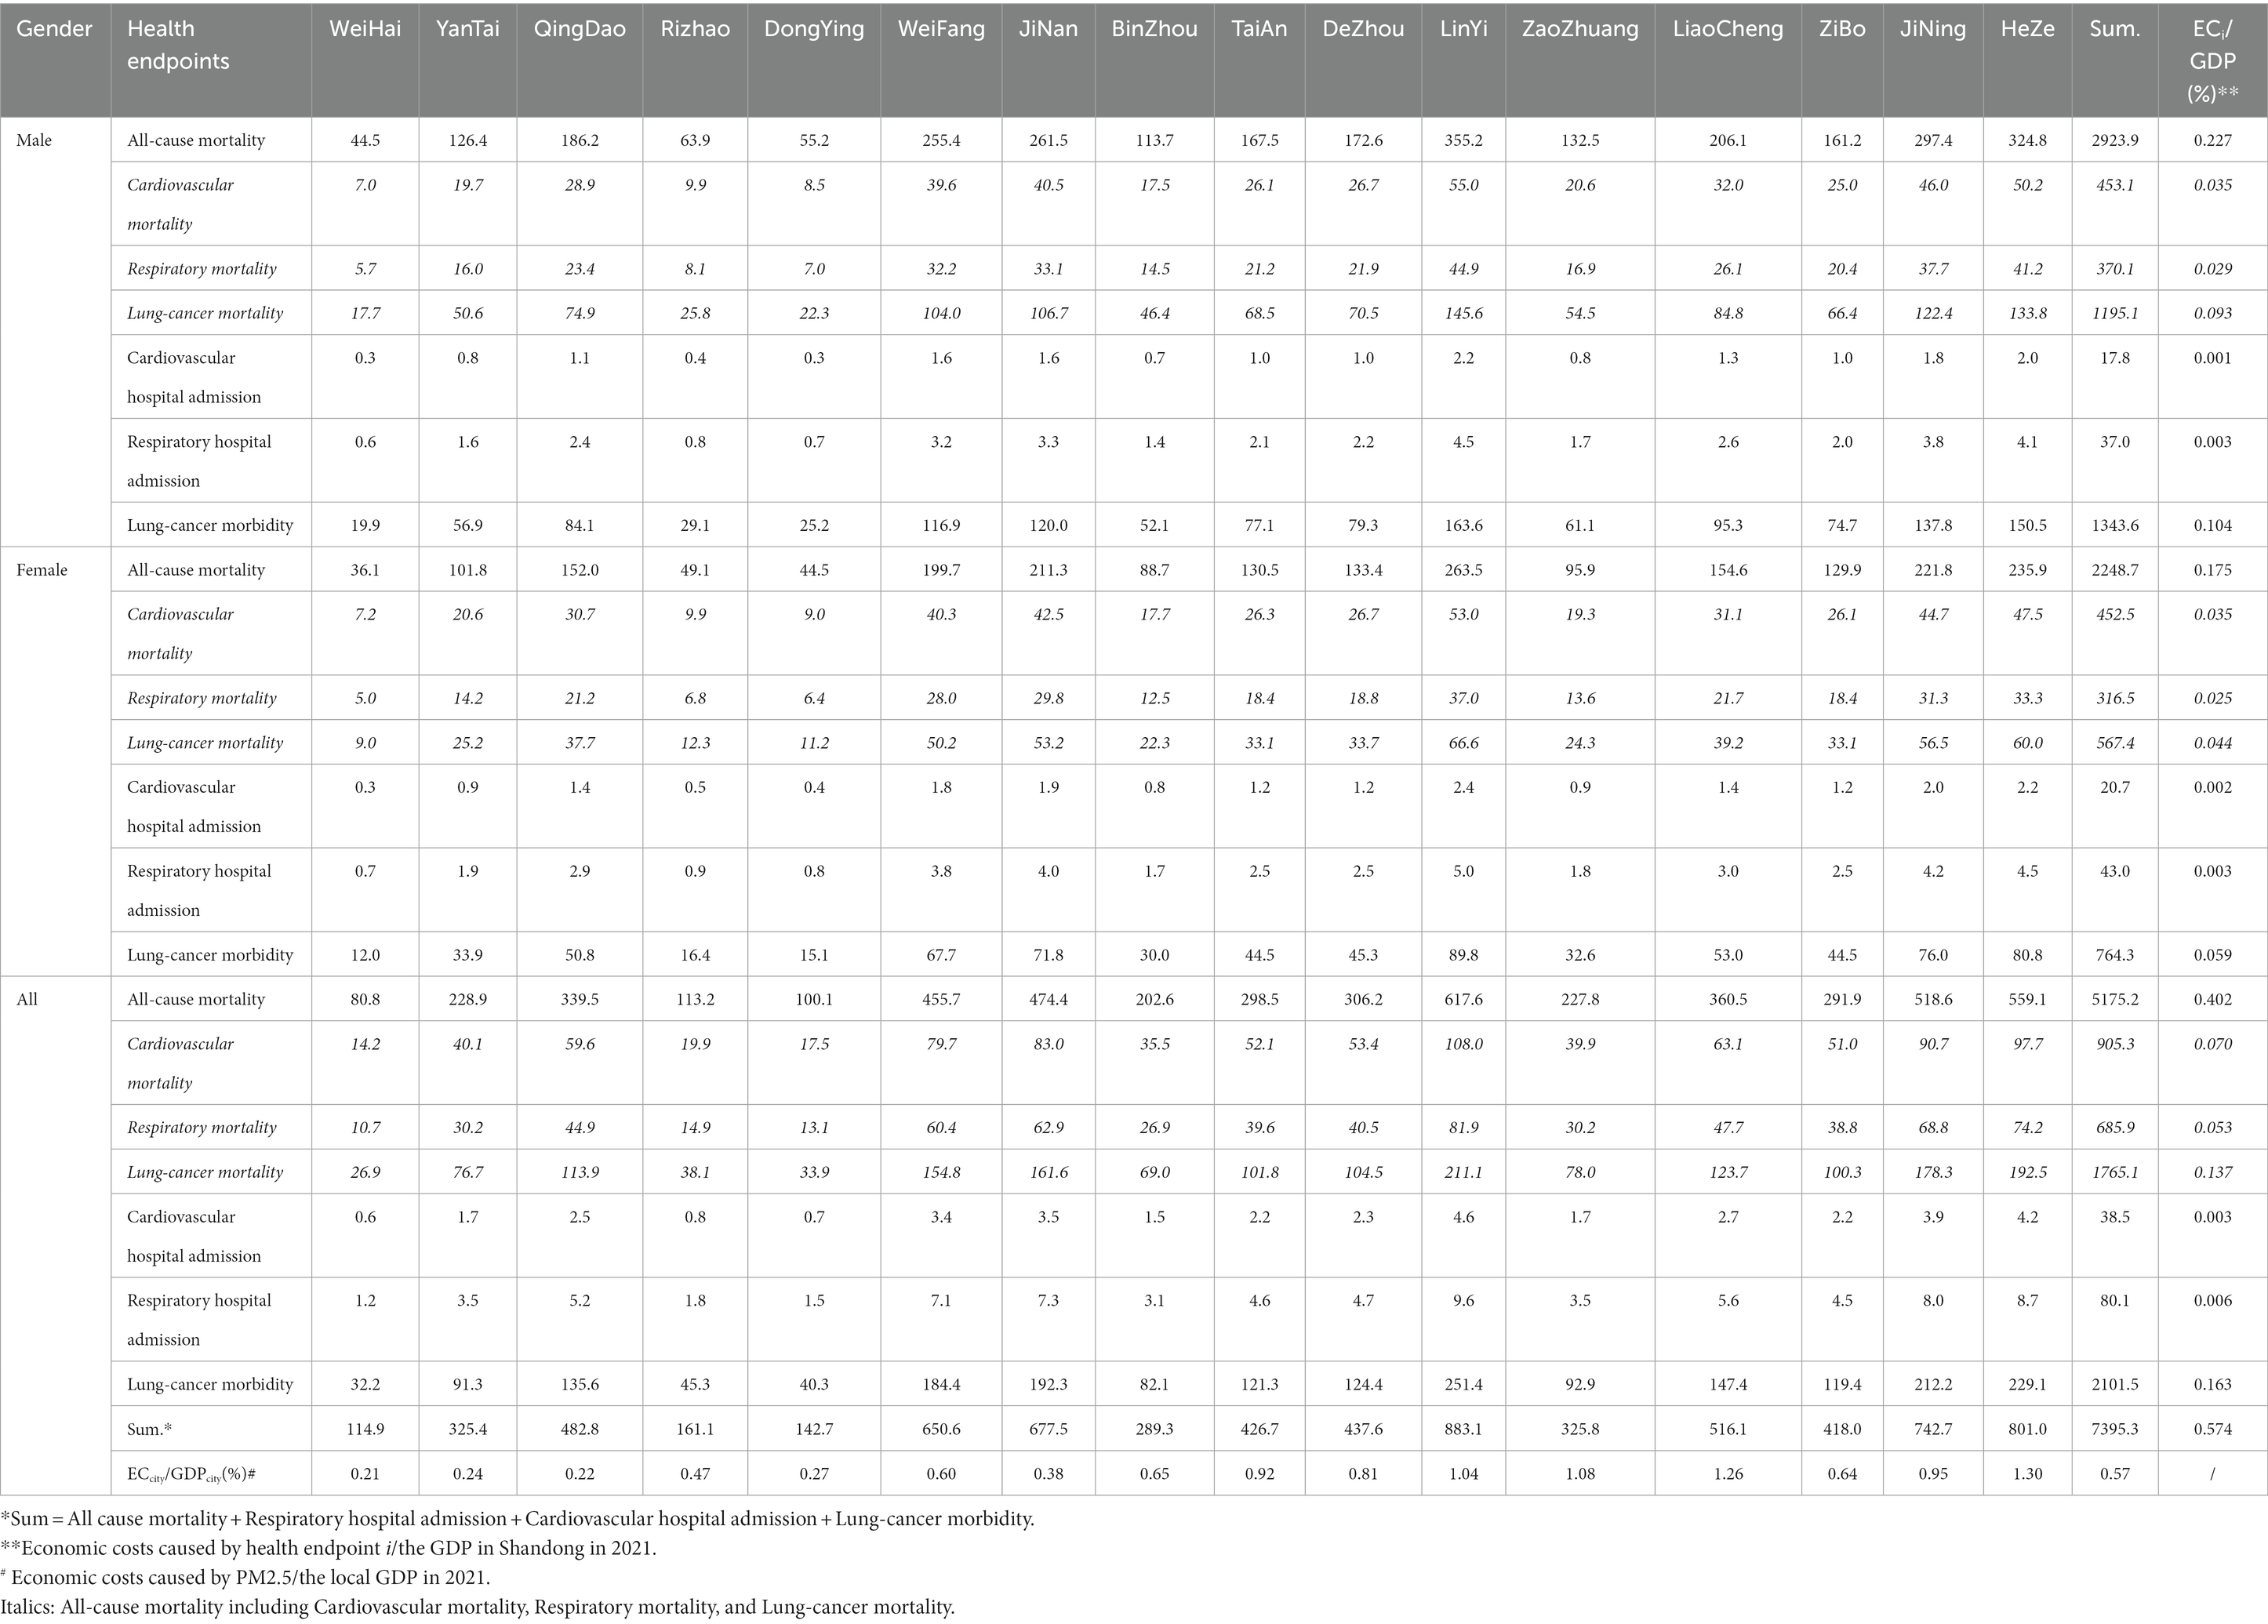
Table 5. Health economic effect of PM2.5 exposure in Shandong in 2021 (million US$).
Overall, the health economic effects were higher for male than for female in Shandong. The health economic costs of male and female accounted for 0.336 and 0.239% of GDP, respectively. In terms of the health effects in cities, LinYi, HeZe, JiNing, JiNan, WeiFang, and LiaoCheng were the cities where the health economic cost was more than 500 millions. For the proportion of health economic cost, HeZe, LiaoCheng, ZaoZhuang, and LinYi were the cities where it was more than 1% of GDP, accounted for 1.30, 1.26, 1.08, and 1.04% of the GDP in local areas. On the whole, the economic cost of health in highly polluted and densely populated areas in Shandong was higher than that in other cities. It also led to a heavier fiscal burden for these areas.
Since the publication of the WHO Air Quality Guidelines - Global Update 2005 (AQG2005), it has had a positive impact on air pollution control policies around the world (57, 58). AQG2005 provided the first globally referenced framework for air pollution control targets and established transitional targets based on the potential risk of death from long-term exposure to each pollutant (59–61). It was then adopted by many highly polluted regions and countries as progressive targets for the gradual reduction of air pollution (62). China also updated its Air Quality Standards in 2012, and included PM2.5 and O3 in monitoring projects for the first time (63). With the progress of science, the monitoring capabilities of environmental and health and the level of exposure and risk assessment had gradually improved (64). It led a significant increase in scientific evidence of the health hazards of air pollution (65, 66). Finally, WHO updated the AQG again in September 2021 on the basis of comprehensive analysis and scientific assessment of the literature and results over the past 15 years. Air quality standards have become more stringent.
As air quality standards have been ever more stringent, PM2.5 health guideline has also been changed and further reduced. Population health risks and economic effects assessed based on the new WHO standards should be higher than that using the previous air quality standards. However, the increase of health risks and economic costs related to PM2.5 pollution was not very significant compared with our previous study. Considering these differences in population, economy, and environment, making a direct comparison between Shandong and Beijing may not be entirely appropriate. The total health effects and economic losses caused by PM2.5 pollution may vary greatly in the two regions. Therefore, in order to reduce the uncertain impact of these factors, this study only compared the proportion of PM2.5 pollution-related health endpoints and the proportion of economic loss in local GDP between the two regions. Finally, whether it was the proportion of affected population or the proportion of health economic costs, the results of this study were comparable to our previous assessment of Beijing in 2015 (34). In our previous study of Beijing, it was the Class II limit values of the National Ambient Air Quality Standard (35 μg/m3) that used as the baseline concentration to complete the health risk assessment work. It was a full 30 μg/m3 higher than the baseline concentration used in this study. The fact that the health and economic effects related to PM2.5 did not increase significantly under the stricter standards can only be attributed to the possibility that China’s air pollution control measures were having a positive effect. The annual PM2.5 concentration assessed in this study should be at least 30 μg/m3 lower than that in Beijing in 2015. In fact, the PM2.5 concentration in Beijing was 80.6 μg/m3 in 2015, while it was 39 μg/m3 in Shandong in 2021. Therefore, with the positive effect of China’s air pollution control measures, the nationwide decrease in PM2.5 concentration was the main reason why the health and economic effects related to PM2.5 pollution had not increased substantially in this study. China’s air quality improvement strategy had started to pay off, which was confirmed in this study from the perspective of health risk assessment.
Although the results of this study were mainly based on the analysis of PM2.5 pollution in Shandong Province, they still provided side evidence for the positive effects of air quality improvement strategies in China. In the follow-up studies, strengthening regional difference analysis and long-term assessment may be more valuable for evaluating China’s air quality prevention and control strategies. In addition, how to tailor the prevention and control strategies of different regions according to the health risks of regional populations should also attract the attention of decision-making departments. Reducing population health risks should be the ultimate goal of improving air quality.
In this study, the exposure response function was used to assess the health risks of PM2.5 pollution in Shandong Province. The cost of illness (COI) method and value of statistical life (VSL) method were used to estimate the health economic losses associated with PM2.5 pollution. The new WHO (2021) Health Guidelines were used as the PM2.5 baseline concentration in this study. The health risks and economic effects of PM2.5 exposure in 16 cities in Shandong Province were assessed separately. Results showed that despite a 30 μg/m3 reduction in PM2.5 baseline concentration compared to our previous study, there was no significant increase in health risks and economic losses. About 159.8 thousand people died or became ill prematurely due to PM2.5 pollution, which caused a health economic loss of about 7.4 billion dollars in Shandong. The health economic cost accounted for about 0.57% of GDP in Shandong in 2021. It was similar to our previous assessment of the economic effects of PM2.5 pollution in Beijing in 2015. Therefore, under the more stringent criteria, there was no qualitative change in the assessment of health risks and economic losses, which proved that China’s air pollution prevention and control strategy might already be having a positive effect.
The original contributions presented in the study are included in the article/supplementary material, further inquiries can be directed to the corresponding authors.
XX: Writing – review and editing, Conceptualization, Methodology, Project administration. WZ: Writing – review and editing. XS: Review and editing. ZS: Writing – review and editing, Formal Analysis. WC: Review and editing. YW: Writing – review and editing. HM: Writing – review and editing. TL: Writing – review and editing. ZW: Review and editing. All authors contributed to the article and approved the submitted version.
This work was funded by Opening Project of Shanghai Key Laboratory of Atmospheric Particle Pollution and Prevention (LAP3) (no. FDLAP21001); Shandong Provincial Natural Science Foundation (no. ZR2023QB037); Key R&D Program of Shandong Province, China (No. ZR2022QB144); Pilot project of integration of science, education and production of Qilu University of Technology (Shandong Academy of Sciences) (nos. 2022PX038, 2022GH020); Project of Shandong Society for Environmental (no. 202213); the National Research Program for key issues in air pollution control (no. DQGG202123).
The authors declare that the research was conducted in the absence of any commercial or financial relationships that could be construed as a potential conflict of interest.
All claims expressed in this article are solely those of the authors and do not necessarily represent those of their affiliated organizations, or those of the publisher, the editors and the reviewers. Any product that may be evaluated in this article, or claim that may be made by its manufacturer, is not guaranteed or endorsed by the publisher.
1. ^http://xxgk.sdein.gov.cn/xxgkml/hjzkgb/202206/P020220607364593369389.pdf
2. ^http://www.shandong.gov.cn/art/2022/1/24/art_305267_10331968.html?xxgkhide=1
3. ^http://sthj.shandong.gov.cn/zwgk/sqcspm/
4. ^http://www.shandong.gov.cn/art/2023/1/10/art_305258_10333917.html
5. ^http://tjj.shandong.gov.cn/art/2021/5/21/art_156112_10287516.html
6. ^http://tjj.shandong.gov.cn/tjnj/nj2022/zk/zk/indexch.htm
1. Kumar, P, Druckman, A, Gallagher, J, Gatersleben, B, Allison, S, Eisenman, TS, et al. The nexus between air pollution, green infrastructure and human health. Environ Int. (2019) 133:105181. doi: 10.1016/j.envint.2019.105181
2. Klepac, P, Locatelli, I, Korosec, S, Kunzli, N, and Kukec, A. Ambient air pollution and pregnancy outcomes: a comprehensive review and identification of environmental public health challenges. Environ Res. (2018) 167:144–59. doi: 10.1016/.envres.2018.07.008
3. Chen, FL, and Chen, ZF. Cost of economic growth: air pollution and health expenditure. Sci Total Environ. (2021) 755:142543. doi: 10.1016/j.scitotenv.2020.142543
4. Tainio, M, Andersen, ZJ, Nieuwenhuijsen, MJ, Hu, L, de Nazelle, A, An, RP, et al. Air pollution, physical activity and health: a mapping review of the evidence. Environ Int. (2021) 147:105954. doi: 10.1016/j.envint.2020.105954
5. Gao, JH, Woodward, A, Vardoulakis, S, Kovats, S, Wilkinson, P, Li, LP, et al. Haze, public health and mitigation measures in China: a review of the current evidence for further policy response. Sci Total Environ. (2017) 578:148–57. doi: 10.1016/j.scitotenv.2016.10.231
6. Cai, M, Lin, XJ, Wang, XJ, Zhang, SY, Qian, ZMM, McMillin, SE, et al. Ambient particulate matter pollution of different sizes associated with recurrent stroke hospitalization in China: a cohort study of 1.07 million stroke patients. Sci Total Environ. (2023) 856:159104. doi: 10.1016/j.scitotenv.2022.159104
7. Maji, KJ, Ye, WF, Arora, M, and Nagendra, SMS. PM2.5-related health and economic loss assessment for 338 Chinese cities. Environ Int. (2018) 121:392–403. doi: 10.1016/j.envint.2018.09.024
8. Li, TT, Zhang, Y, Wang, JN, Xu, DD, Yin, ZX, Chen, HS, et al. All-cause mortality risk associated with long-term exposure to ambient PM2.5 in China: a cohort study. Lancet Public Health. (2018) 3:E470–7. doi: 10.1016/S2468-2667(18)30144-0
9. Zhang, Q, Xu, EG, Li, JN, Chen, QQ, Ma, LP, Zeng, EY, et al. A review of microplastics in Table salt, drinking water, and air: direct human exposure. Environ Sci Technol. (2020) 54:3740–51. doi: 10.1021/acs.est.9b04535
10. Feng, SL, Gao, D, Liao, F, Zhou, FR, and Wang, XM. The health effects of ambient PM2.5 and potential mechanisms. Ecotox Environ Safe. (2016) 128:67–74. doi: 10.1016/j.ecoenv.2016.01.030
11. Cao, C, Jiang, WJ, Wang, BY, Fang, JH, Lang, JD, Tian, G, et al. Inhalable microorganisms in Beijing's PM2.5 and PM10 pollutants during a severe smog event. Environ Sci Technol. (2014) 48:1499–507. doi: 10.1021/es4048472
12. Han, X, Liu, YQ, Gao, H, Ma, JM, Mao, XX, Wang, YT, et al. Forecasting PM2.5 induced male lung cancer morbidity in China using satellite retrieved PM2.5 and spatial analysis. Sci Total Environ. (2017) 607-608:1009–17. doi: 10.1016/j.scitotenv.2017.07.061
13. Yusuf, S, Joseph, P, Rangarajan, S, Islam, S, Mente, A, Hystad, P, et al. Modifiable risk factors, cardiovascular disease, and mortality in 155 722 individuals from 21 high-income, middle-income, and low-income countries (PURE): a prospective cohort study. Lancet. (2020) 395:795–808. doi: 10.1016/S0140-6736(19)32008-2
14. Burnett, R, Chen, H, Szyszkowicz, M, Fann, N, Hubbell, B, Pope, CA, et al. Global estimates of mortality associated with long-term exposure to outdoor fine particulate matter. Proc Natl Acad Sci U S A. (2018) 115:9592–7. doi: 10.1073/pnas.1803222115
15. Guo, C, Zhang, ZL, Lau, AKH, Lin, CQ, Chuang, YC, Chan, J, et al. Effect of long-term exposure to fine particulate matter on lung function decline and risk of chronic obstructive pulmonary disease in Taiwan: a longitudinal, cohort study. Lancet Planet Health. (2018) 2:E114–25. doi: 10.1016/S2542-5196(18)30028-7
16. Song, CB, He, JJ, Wu, L, Jin, TS, Chen, X, Li, RP, et al. Health burden attributable to ambient PM2.5 in China. Environ Pollut. (2017) 223:575–86. doi: 10.1016/j.envpol.2017.01.060
17. Pun, VC, Kazemiparkouhi, F, Manjourides, J, and Suh, HH. Long-term PM2.5 exposure and respiratory, Cancer, and cardiovascular mortality in older US adults. Am J Epidemiol. (2017) 186:961–9. doi: 10.1093/aje/kwx166
18. Xu, XM, Zhang, HF, Chen, JM, Li, Q, Wang, XF, Wang, WX, et al. Six sources mainly contributing to the haze episodes and health risk assessment of PM2.5 at Beijing suburb in winter 2016. Ecotoxicol Environ Safety. (2018) 166:146–56. doi: 10.1016/j.ecoenv.2018.09.069
19. Kuerban, M, Waili, Y, Fan, F, Liu, Y, Qin, W, Dore, AJ, et al. Spatio-temporal patterns of air pollution in China from 2015 to 2018 and implications for health risks. Environ Pollut. (2020) 258:113659. doi: 10.1016/j.envpol.2019.113659
20. Amnuaylojaroen, T, Parasin, N, and Limsakul, A. Health risk assessment of exposure near-future PM2.5 in northern Thailand. Air Qual Atmos. Health. (2022) 15:1963–79. doi: 10.1007/s11869-022-01231-x
21. Wang, T, Xue, LK, Brimblecombe, P, Lam, YF, Li, L, and Zhang, L. Ozone pollution in China: a review of concentrations, meteorological influences, chemical precursors, and effects. Sci Total Environ. (2017) 575:1582–96. doi: 10.1016/j.scitotenv.2016.10.081
22. Xie, Y, Dai, HC, Dong, HJ, Hanaoka, T, and Masui, T. Economic impacts from PM2.5 pollution-related health effects in China: a provincial-level analysis. Environ Sci Technol. (2016) 50:4836–43. doi: 10.1021/acs.est.5b05576
23. Fu, X, Wang, T, Gao, J, Wang, P, Liu, YM, Wang, SX, et al. Persistent heavy winter nitrate pollution driven by increased photochemical oxidants in northern China. Environ Sci Technol. (2020) 54:3881–9. doi: 10.1021/acs.est.9b07248
24. Wei, M, Liu, HF, Chen, JM, Xu, CH, Li, J, Xu, PJ, et al. Effects of aerosol pollution on PM2.5-associated bacteria in typical inland and coastal cities of northern China during the winter heating season. Environ Pollut. (2020) 262:114188. doi: 10.1016/j.envpol.2020.114188
25. Cui, LL, Zhou, JW, Peng, XM, Ruan, SM, and Zhang, Y. Analyses of air pollution control measures and co-benefits in the heavily air-polluted Jinan city of China, 2013-2017. Sci Rep. (2020) 10:5423. doi: 10.1038/s41598-020-62475-0
26. Wang, ZS, Yan, JY, Zhang, PZ, Li, ZG, Guo, C, Wu, K, et al. Chemical characterization, source apportionment, and health risk assessment of PM2.5 in a typical industrial region in North China. Environ Sci Pollut Res. (2022) 29:71696–708. doi: 10.1007/s11356-022-19843-2
27. Xu, XM, Zhang, W, Zhu, C, Li, JR, Yuan, WP, and Lv, JL. Regional sources and the economic cost assessment of PM2.5 in Ji'nan, eastern China. Atmos Pollut Res. (2021) 12:386–94. doi: 10.1016/j.apr.2020.11.019
28. Ji, YH, Liu, B, Song, J, Pan, RB, Cheng, J, Wang, H, et al. Short-term effects and economic burden assessment of ambient air pollution on hospitalizations for schizophrenia. Environ Sci Pollut Res. (2022) 29:45449–60. doi: 10.1007/s11356-022-19026-z
29. Zhang, X, Jin, YN, Dai, HC, Xie, Y, and Zhang, SQ. Health and economic benefits of cleaner residential heating in the Beijing-Tianjin-Hebei region in China. J Environ Sci. (2019) 127:165–78. doi: 10.1016/j.enpol.2018.12.008
30. Zhao, B, Zheng, HT, Wang, SX, Smith, KR, Lu, X, Aunan, K, et al. Change in household fuels dominates the decrease in PM2.5 exposure and premature mortality in China in 2005-2015. Proc Natl Acad Sci U S A. (2018) 115:12401–6. doi: 10.1073/pnas.1812955115
31. Dong, ZX, Xing, J, Zhang, FF, Wang, SX, Ding, D, Wang, HL, et al. Synergetic PM2.5 and O3 control strategy for the Yangtze River Delta, China. J Environ Sci. (2023) 123:281–91. doi: 10.1016/j.jes.2022.04.008
32. Wu, R, Dai, HC, Geng, Y, Xie, Y, Masui, T, Liu, ZQ, et al. Economic impacts from PM2.5 pollution-related health effects: a case study in Shanghai. Environ Sci Technol. (2017) 51:5035–42. doi: 10.1021/acs.est.7b00026
33. Maji, KJ, Dikshit, AK, Arora, M, and Deshpande, A. Estimating premature mortality attributable to PM2.5 exposure and benefit of air pollution control policies in China for 2020. Sci Total Environ. (2018) 612:683–93. doi: 10.1016/j.scitotenv.2017.08.254
34. Xu, XM, Zhang, W, Zhu, C, Li, JR, Wang, J, Li, PC, et al. Health risk and external costs assessment of PM2.5 in Beijing during the "five-year clean air action plan". Atmos Pollut Res. (2021) 12:101089. doi: 10.1016/j.apr.2021.101089
35. Yin, H, Pizzol, M, and Xu, L. External costs of PM2.5 pollution in Beijing, China: uncertainty analysis of multiple health impacts and costs. Environ Pollut. (2017) 226:356–69. doi: 10.1016/j.envpol.2017.02.029
36. Fan, F, Lei, Y, and Li, L. Health damage assessment of particulate matter pollution in Jing-Jin-Ji region of China. Environ Sci Pollut Res. (2019) 26:7883–95. doi: 10.1007/s11356-018-04116-8
37. Xie, Y, Dai, HC, Zhang, YX, Wu, YZ, Hanaoka, T, and Masui, T. Comparison of health and economic impacts of PM2.5 and ozone pollution in China. Environ Int. (2019) 130:104881. doi: 10.1016/j.envint.2019.05.075
38. Yin, H, Xu, L, and Cai, Y. Monetary valuation of PM10-related health risks in Beijing China: the necessity for PM10 pollution indemnity. Int J Environ Res Publ Health. (2015) 12:9967–87. doi: 10.3390/ijerph120809967
39. Yin, X, Wang, L, Yu, X, Du, S, Zhang, H, and Zhang, Z. Arsenic accumulation and speciation of PM2.5 and relevant health risk assessment in Ji'nan, China. Pol J Environ Stud. (2017) 26:949–54. doi: 10.15244/pjoes/66714
40. Liu, J, Han, YQ, Tang, X, Zhu, J, and Zhu, T. Estimating adult mortality attributable to PM2.5 exposure in China with assimilated PM2.5 concentrations based on a ground monitoring network. Sci Total Environ. (2016) 568:1253–62. doi: 10.1016/j.scitotenv.2016.05.165
41. Fiordelisi, A, Piscitelli, P, Trimarco, B, Coscioni, E, Iaccarino, G, and Sorriento, D. The mechanisms of air pollution and particulate matter in cardiovascular diseases. Heart Fail Rev. (2017) 22:337–47. doi: 10.1007/s10741-017-9606-7
42. Kloog, I, Ridgway, B, Koutrakis, P, Coull, BA, and Schwartz, JD. Long- and short-term exposure to PM2.5 and mortality: using novel exposure models. Epidemiology. (2013) 24:555–61. doi: 10.1097/EDE.0b013e318294beaa
43. Sinharay, R, Gong, JC, Barratt, B, Ohman-Strickland, P, Ernst, S, Kelly, FJ, et al. Respiratory and cardiovascular responses to walking down a traffic-polluted road compared with walking in a traffic-free area in participants aged 60 years and older with chronic lung or heart disease and age-matched healthy controls: a randomised, crossover study. Lancet. (2018) 391:339–49. doi: 10.1016/S0140-6736(17)32643-0
44. Bell, ML, Son, JY, Peng, RD, Wang, Y, and Dominici, F. Brief report: ambient PM2.5 and risk of hospital admissions. Epidemiology. (2015) 26:575–9. doi: 10.1097/EDE.0000000000000310
45. Sang, S, Chu, C, Zhang, T, Chen, H, and Yang, X. The global burden of disease attributable to ambient fine particulate matter in 204 countries and territories, 1990-2019: a systematic analysis of the global burden of disease study 2019. Ecotoxicol Environ Saf. (2022) 238:113588. doi: 10.1016/j.ecoenv.2022.113588
46. Pandey, A, Brauer, M, Cropper, ML, Balakrishnan, K, Mathur, P, Dey, S, et al. Health and economic impact of air pollution in the states of India: the global burden of disease study 2019. Lancet Planet Health. (2021) 5:E25–38. doi: 10.1016/S2542-5196(20)30298-9
47. Gakidou, E, Afshin, A, Abajobir, AA, Abate, KH, Abbafati, C, Abbas, KM, et al. Global, regional, and national comparative risk assessment of 84 behavioural, environmental and occupational, and metabolic risks or clusters of risks, 1990-2016: a systematic analysis for the global burden of disease study 2016. Lancet. (2017) 390:1345–422. doi: 10.1016/S0140-6736(17)32366-8
48. Tang, R, Zhao, J, Liu, YF, Huang, X, Zhang, YX, Zhou, DR, et al. Air quality and health co-benefits of China's carbon dioxide emissions peaking before 2030. Nat Commun. (2022) 13:1008. doi: 10.1038/s41467-022-28672-3
49. Hammitt, JK, Morfeld, P, Tuomisto, JT, and Erren, TC. Premature deaths, statistical lives, and years of life lost: identification, quantification, and valuation of mortality risks. Risk Anal. (2020) 40:674–95. doi: 10.1111/risa.13427
50. Deng, XB, Zhang, F, Rui, W, Long, F, Wang, LJ, Feng, ZH, et al. PM2.5-induced oxidative stress triggers autophagy in human lung epithelial A549 cells. Toxicol In Vitro. (2013) 27:1762–70. doi: 10.1016/j.tiv.2013.05.004
51. Pui, DYH, Chen, SC, and Zuo, ZL. PM2.5 in China: measurements, sources, visibility and health effects, and mitigation. Particuology. (2014) 13:1–26. doi: 10.1016/j.partic.2013.11.001
52. Zhang, Y, Shuai, CY, Bian, J, Chen, X, Wu, Y, and Shen, LY. Socioeconomic factors of PM2.5 concentrations in 152 Chinese cities: decomposition analysis using LMDI. J Clean Prod. (2019) 218:96–107. doi: 10.1016/j.jclepro.2019.01.322
53. Hoek, G, Krishnan, RM, Beelen, R, Peters, A, Ostro, B, Brunekreef, B, et al. Long-term air pollution exposure and cardio- respiratory mortality: a review. Environ Health. (2013) 12:43. doi: 10.1186/1476-069X-12-43
54. Atkinson, RW, Kang, S, Anderson, HR, Mills, IC, and Walton, HA. Epidemiological time series studies of PM2.5 and daily mortality and hospital admissions: a systematic review and meta-analysis. Thorax. (2014) 69:660–5. doi: 10.1136/thoraxjnl-2013-204492
55. Han, CL, Xu, RB, Ye, TT, Xie, Y, Zhao, Y, Liu, HY, et al. Mortality burden due to long-term exposure to ambient PM2.5 above the new WHO air quality guideline based on 296 cities in China. Environ Int. (2022) 166:107331. doi: 10.1016/j.envint.2022.107331
56. Yin, P, Brauer, M, Cohen, AJ, Wang, HD, Li, J, Burnett, RT, et al. The effect of air pollution on deaths, disease burden, and life expectancy across China and its provinces, 1990-2017: an analysis for the global burden of disease study 2017. Lancet Planet Health. (2020) 4:E386–98. doi: 10.1016/S2542-5196(20)30161-3
57. Nielsen, GD, Larsen, ST, and Wolkoff, P. Re-evaluation of the WHO (2010) formaldehyde indoor air quality guideline for cancer risk assessment. Arch Toxicol. (2017) 91:35–61. doi: 10.1007/s00204-016-1733-8
58. Cheng, J, Tong, D, Zhang, Q, Liu, Y, Lei, Y, Yan, G, et al. Pathways of China's PM2.5 air quality 2015-2060 in the context of carbon neutrality. Natl Sci Rev. (2021) 8:nwab078. doi: 10.1093/nsr/nwab078
59. Shaddick, G, Thomas, ML, Mudu, P, Ruggeri, G, and Gumy, S. Half the world's population are exposed to increasing air pollution. NPJ Clim Atmos Sci. (2020) 3:23. doi: 10.1038/s41612-020-0124-2
60. Shang, Y, Sun, ZW, Cao, JJ, Wang, XM, Zhong, LJ, Bi, XH, et al. Systematic review of Chinese studies of short-term exposure to air pollution and daily mortality. Environ Int. (2013) 54:100–11. doi: 10.1016/j.envint.2013.01.010
61. Zhang, Q, Zheng, YX, Tong, D, Shao, M, Wang, SX, Zhang, YH, et al. Drivers of improved PM2.5 air quality in China from 2013 to 2017. P Natl Acad Sci USA. (2019) 116:24463–9. doi: 10.1073/pnas.1907956116
62. Shi, XR, Zheng, YX, Lei, Y, Xue, WB, Yan, G, Liu, X, et al. Air quality benefits of achieving carbon neutrality in China. Sci Total Environ. (2021) 795:148784. doi: 10.1016/j.scitotenv.2021.148784
63. Dai, HB, Zhu, J, Liao, H, Li, JD, Liang, MX, Yang, Y, et al. Co-occurrence of ozone and PM2.5 pollution in the Yangtze River Delta over 2013-2019: spatiotemporal distribution and meteorological conditions. Atmos Res. (2020) 249:105363. doi: 10.1016/j.atmosres.2020.105363
64. Sicard, P, Agathokleous, E, Anenberg, SC, De Marco, A, Paoletti, E, and Calatayud, V. Trends in urban air pollution over the last two decades: a global perspective. Sci Total Environ. (2023) 858:160064. doi: 10.1016/j.scitotenv.2022.160064
65. Yang, BY, Fan, SJ, Thiering, E, Seissler, J, Nowak, D, Dong, GH, et al. Ambient air pollution and diabetes: a systematic review and meta-analysis. Environ Res. (2020) 180:108817. doi: 10.1016/j.envres.2019.108817
Keywords: health risk, economic loss, PM2.5 pollution, exposure, prevention and control strategies
Citation: Xu X, Zhang W, Shi X, Su Z, Cheng W, Wei Y, Ma H, Li T and Wang Z (2023) China’s air quality improvement strategy may already be having a positive effect: evidence based on health risk assessment. Front. Public Health. 11:1250572. doi: 10.3389/fpubh.2023.1250572
Edited by:
Ghulam Mujtaba Kayani, Hubei University of Economics, ChinaReviewed by:
Manthar Ali Mallah, Zhengzhou University, ChinaCopyright © 2023 Xu, Zhang, Shi, Su, Cheng, Wei, Ma, Li and Wang. This is an open-access article distributed under the terms of the Creative Commons Attribution License (CC BY). The use, distribution or reproduction in other forums is permitted, provided the original author(s) and the copyright owner(s) are credited and that the original publication in this journal is cited, in accordance with accepted academic practice. No use, distribution or reproduction is permitted which does not comply with these terms.
*Correspondence: Xianmang Xu, eHV4aWFubWFuZzE2OEBxbHUuZWR1LmNu; Zhenhua Wang, d2FuZ3poaEBxbHUuZWR1LmNu
Disclaimer: All claims expressed in this article are solely those of the authors and do not necessarily represent those of their affiliated organizations, or those of the publisher, the editors and the reviewers. Any product that may be evaluated in this article or claim that may be made by its manufacturer is not guaranteed or endorsed by the publisher.
Research integrity at Frontiers
Learn more about the work of our research integrity team to safeguard the quality of each article we publish.