 Yi Gao1,2,3†
 Yiwen Zhang4†
 Chengguang Hu3
 Pengyuan He5Jian Fu2Feng Lin2Kehui Liu6Xianxian Fu7Rui Liu8
 Jiarun Sun1
 Feng Chen9*
 Wei Yang4*
 Yuanping Zhou1,3*
- 1Department of Infectious Disease and Hepatology Unit, Nanfang Hospital, Southern Medical University, Guangzhou, China
- 2Department of Infectious Disease, Hainan General Hospital, Hainan Medical University, Haikou, China
- 3Department of Gastroenterology, Nanfang Hospital, Southern Medical University, Guangzhou, China
- 4School of Biomedical Engineering, Southern Medical University, Guangzhou, China
- 5Department of Infectious Disease, The Fifth Affiliated Hospital, Sun Yat-sen University, Zhuhai, China
- 6Department of Radiology, Haikou Municipal People's Hospital and Central South University Xiangya Medical College Affiliated Hospital, Haikou, China
- 7Clinical Lab, Haikou Municipal People's Hospital and Central South University Xiangya Medical College Affiliated Hospital, Haikou, China
- 8Department of Infectious Disease, The Second Affiliated Hospital, Hainan Medical University, Haikou, China
- 9Department of Radiology, Hainan General Hospital, Hainan Medical University, Haikou, China
Introduction: This study aimed to develop and assess a deep-learning model based on CT images for distinguishing infectivity in patients with pulmonary tuberculosis (PTB).
Methods: We labeled all 925 patients from four centers with weak and strong infectivity based on multiple sputum smears within a month for our deep-learning model named TBINet's training. We compared TBINet's performance in identifying infectious patients to that of the conventional 3D ResNet model. For model explainability, we used gradient-weighted class activation mapping (Grad-CAM) technology to identify the site of lesion activation in the CT images.
Results: The TBINet model demonstrated superior performance with an area under the curve (AUC) of 0.819 and 0.753 on the validation and external test sets, respectively, compared to existing deep learning methods. Furthermore, using Grad-CAM, we observed that CT images with higher levels of consolidation, voids, upper lobe involvement, and enlarged lymph nodes were more likely to come from patients with highly infectious forms of PTB.
Conclusion: Our study proves the feasibility of using CT images to identify the infectivity of PTB patients based on the deep learning method.
Introduction
Tuberculosis (TB) is a chronic infectious disease primarily caused by Mycobacterium tuberculosis (Mtb) (1) and remains the leading infectious reason of death worldwide. Since Mtb is primarily transmitted through respiratory droplets [e.g., coughing, sneezing, speaking, singing (2, 3), and even deep exhalations (4)], pulmonary tuberculosis (PTB) is the most common form of TB. However, despite the crucial importance of rapidly identifying the infectivity of PTB patients for the prevention and control of TB, it remains a task to date.
Etiological examinations are commonly employed to determine the infectivity of tuberculosis patients, yet in China, only 37% of PTB patients receive bacteriological evidence (5). Clinical routine sputum acid-fast bacilli smear (we refer to it as “sputum smear” in the following text) is relatively quick but has poor repeatability and a low single detection rate, often necessitating repeat testing for PTB patients. Sputum culture examination takes 2–6 weeks, and polymerase chain reaction (PCR) tests for Mtb may yield false positives and are costly (6). Moreover, traditional methods for assessing the infectivity of PTB patients rely on the quality of sputum samples, which can be influenced by the operator's skill and the patient's condition. Therefore, there is an urgent need for a rapid, reliable, and objective method to determine the infectivity of PTB patients. CT imaging plays an essential role in analyzing and diagnosing PTB patients (7). Research has also shown that imaging findings are often associated with positive sputum smear results in PTB patients (8–10).
Deep learning is a highly versatile tool widely employed for diagnosing and predicting a wide range of diseases. In the field of PTB analysis, Li et al. (11) combined autoencoder and convolutional neural network (CNN) to proposed a new model called AECNN for abnormal classification of TB. Tian et al. (12) proposes a lightweight classification network based on a combination of transformer and CNN for the classification of TB cases from lung CT. Besides, some studies have used deep learning models for identification of drug-resistant and non-drug-resistant Mtb (13), detection of Mtb and Nontuberculous Mycobacterium infections (14), and rapid screening of patients with active PTB (15–17). However, few studies focused on the detection of the infectivity of PTB patients, which is crucial for PTB prevention and control.
In this study, we present a PTB infectivity identification model, named TBINet, which utilizes a 2D projection-based CNN to detect individuals with contagious PTB.
Methods
Patients and dataset
We retrospectively collected data from patients diagnosed with PTB who were admitted to four hospitals from January 2010 to December 2021. As sputum smear result is associated with the infectivity of PTB (18), we used sputum smear result to assess infectivity. According to the sputum tuberculosis smear interpretation criteria in the WS 288-2017 (19), the sputum smear result was categorized into six grades from low to high: negative (–), weakly positive (±), positive (+), positive (2+), positive (3+), and positive (4+). A negative result (–) indicates the absence of acid-fast bacilli in 50 consecutive microscopic fields. A weakly positive result (±) indicates the presence of 1–9 acid-fast bacilli in 50 microscopic fields. The positive (+) category refers to 10–49 acid-fast bacilli found in 50 microscopic fields. positive (2+) indicates 1–9 acid-fast bacilli found in each microscopic field, and positive (3+) indicates 10–99 acid-fast bacilli found in each microscopic field. The positive (4+) indicates more than 100 acid-fast bacilli found in each microscopic field. The report for positive (2+) should be based on the observation of a minimum of 50 fields, while for positive (3+) and higher positive results, a minimum of 20 fields should be observed.
We defined the negative group as having three or more negative sputum smear results within a month, and no positive results within the next 3 months, and this indicates weak infectivity. The positive group was defined as having at least one-time positive sputum smear results within a month, indicating relatively strong infectivity. We selected the highest number of multiple sputum smear results for each person in the positive group as the grading criterion. The National Health Commission of the People's Republic of China's diagnostic standards for PTB served as the foundation for the diagnosis of PTB (WS 288-2017) (19). After the patients were grouped according to the sputum smear results, chest CT images of the patients in DICOM format were collected and matched. The interval between sputum smear tests and CT image acquisition was <30 days, and patients with unclear PTB diagnoses or poor-quality lung CT images were excluded.
Figure 1 displays a detailed flowchart of the procedure for gathering data. We included one CT scan image from each patient, totalling 925 CT scan images. Of these, 591 images were split for training, with 118 images set aside as a validation set for model parameter selection. The remaining 334 images were used for testing. Hospital 1 provided the images for the training and validation sets. Hospitals 2, 3, and 4 provided the images for the external test set.
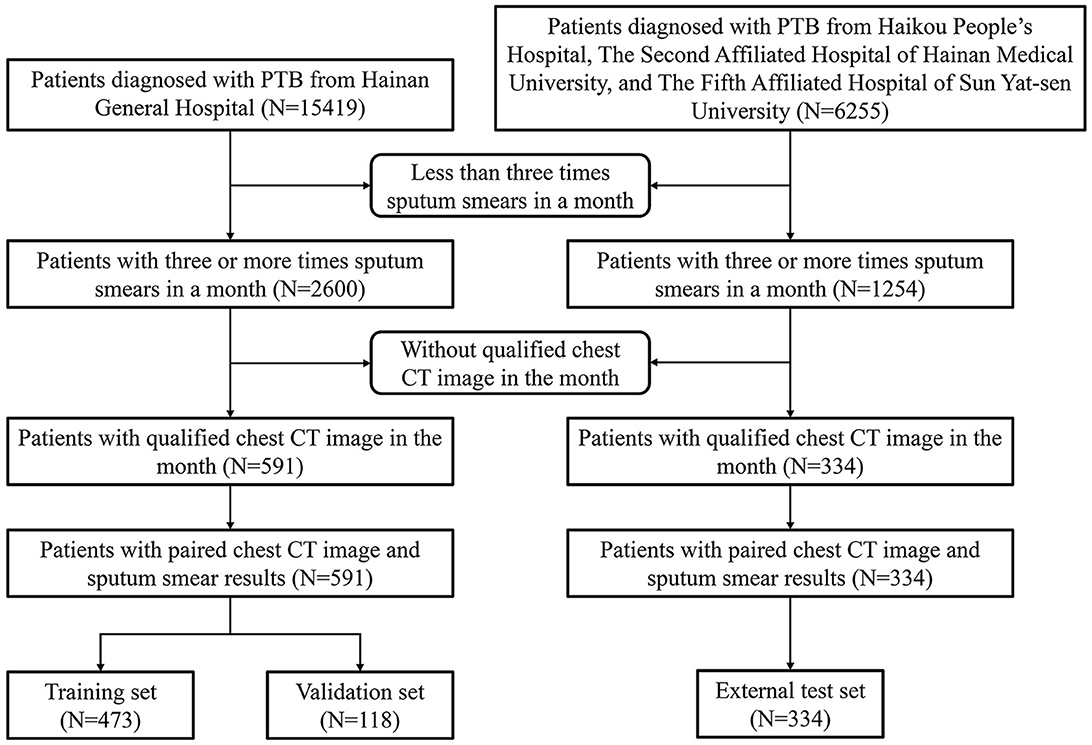
Figure 1. Clinical data screening process and composition.
Data collection
The patients were positioned prone and instructed to inhale and hold their breath as much as possible during the lung field scan. The visual field was adjusted to fit the size of each patient. All patients were scanned using spiral CT scanners following the same protocol. The CT images have an in-plane pixel spacing of 5 mm, an in-plane resolution of 512 × 512, and the number of slices ranges from 47 to 70. All CT data were converted from the original DICOM format to the NIFTI format to ensure data desensitization.
Lung segmentation
Figure 2 shows the overview of our PTB infectious distinguish method. The first step is lung segmentation. Considering that contagious PTB occurs in the lung parenchyma, lung region segmentation can make the model focus on the lung without interference from other areas, thus reducing the difficulty of the analysis. Lungmask (20) is an open-source lung segmentation model based on deep learning, which is used to perform automatic segmentation of lungs on 3D CT images.
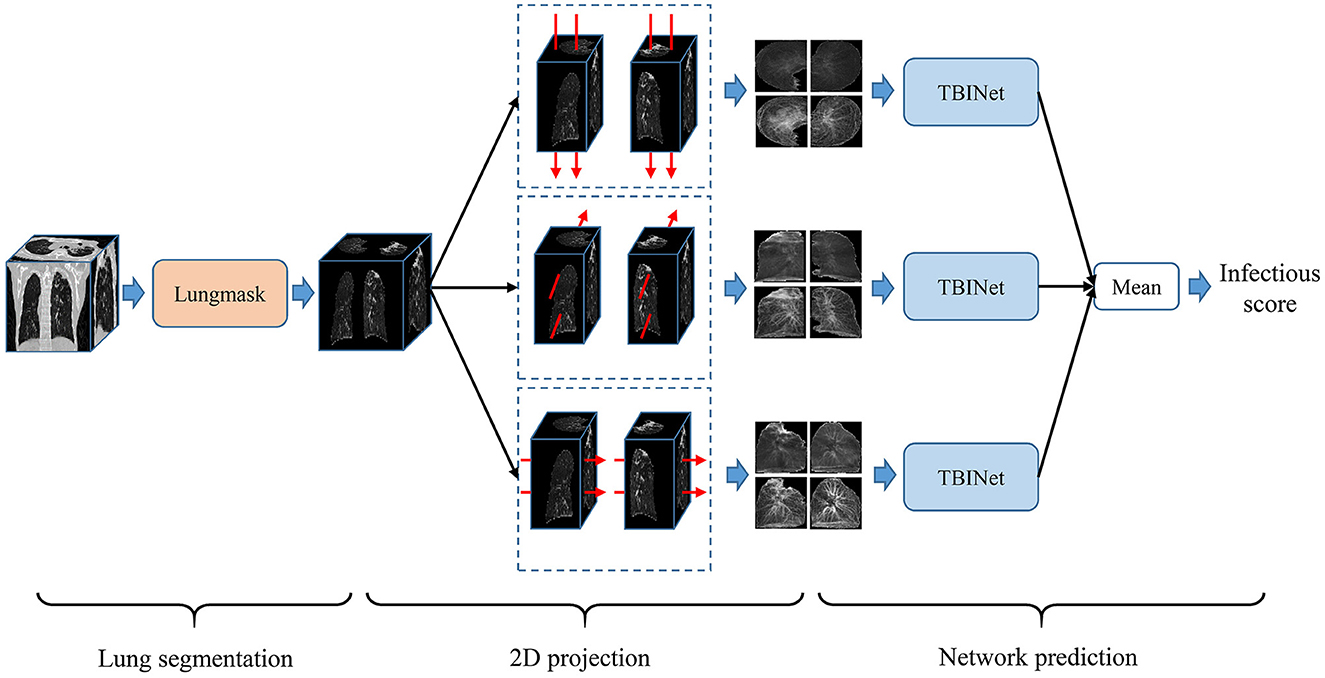
Figure 2. Overview of our proposed infectious PTB infectious scoring method.
2D projection
Based on the segmented lung mask, a CT image is divided into left and right lung images. Then the left and right lung images are projected from three sides, that is, the mean and standard deviation of pixels in three directions are calculated. Finally, the images of all planes are scaled to a uniform size, as shown in Figure 3. The advantage of projecting 3D images to 2D images is that the 2D CNN can be used to analyze these data. Compared with 3D CNN, 2D CNN is lighter and easier to train. Besides, 2D projection increases the number of samples, because a 3D CT image is converted into three 2D projection samples in different directions, which can alleviate the over-fitting of our model.
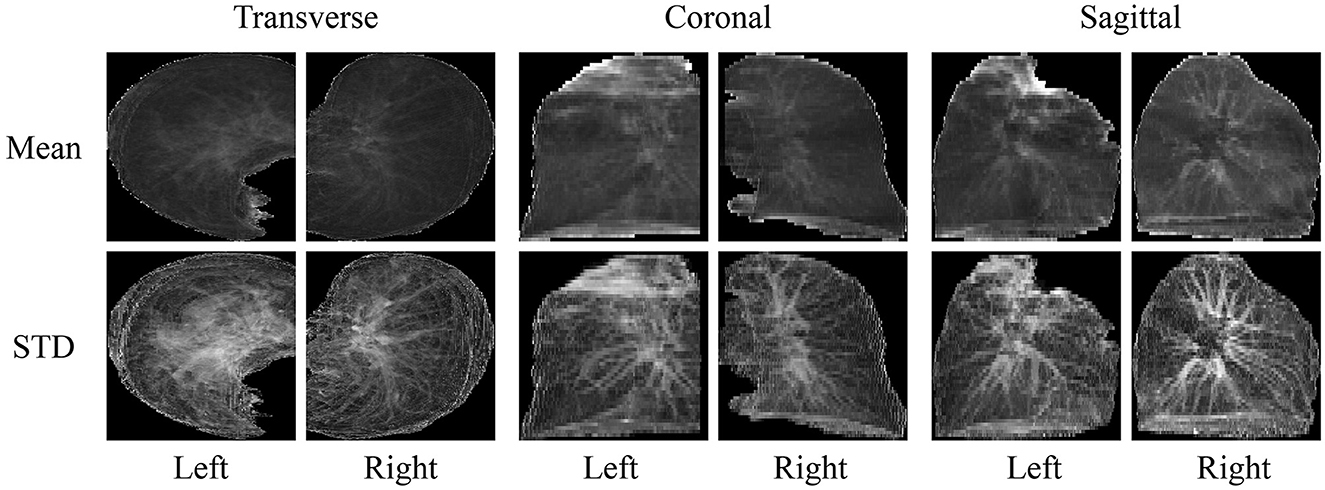
Figure 3. 2D projection results generated from 3D masked CT.
Network construction
In this study, we proposed a PTB infectious convolutional neural network (CNN) which can be called TBINet for rapid identification of contagious people with PTB. As shown in Figure 4, the TBINet contains two ResNet (21) backbones used to extract the features of left and right lung projection images, respectively. The details of the ResNet backbone are also shown in Figure 4, which consists of convolution (Conv) layers, batch normalization (BN) layers, rectified linear units (ReLU), residual blocks, max pool layer, and adaptive avgpool layer. Then the extracted left and right lung features are fused by maximum operation. Finally, the fused features pass through a full connection layer to get the final infectious prediction score. The prediction score is a value between 0 and 1. All the prediction scores can be divided into two groups by setting the cut-off value, with those above the cut-off value being positive and those below being negative.
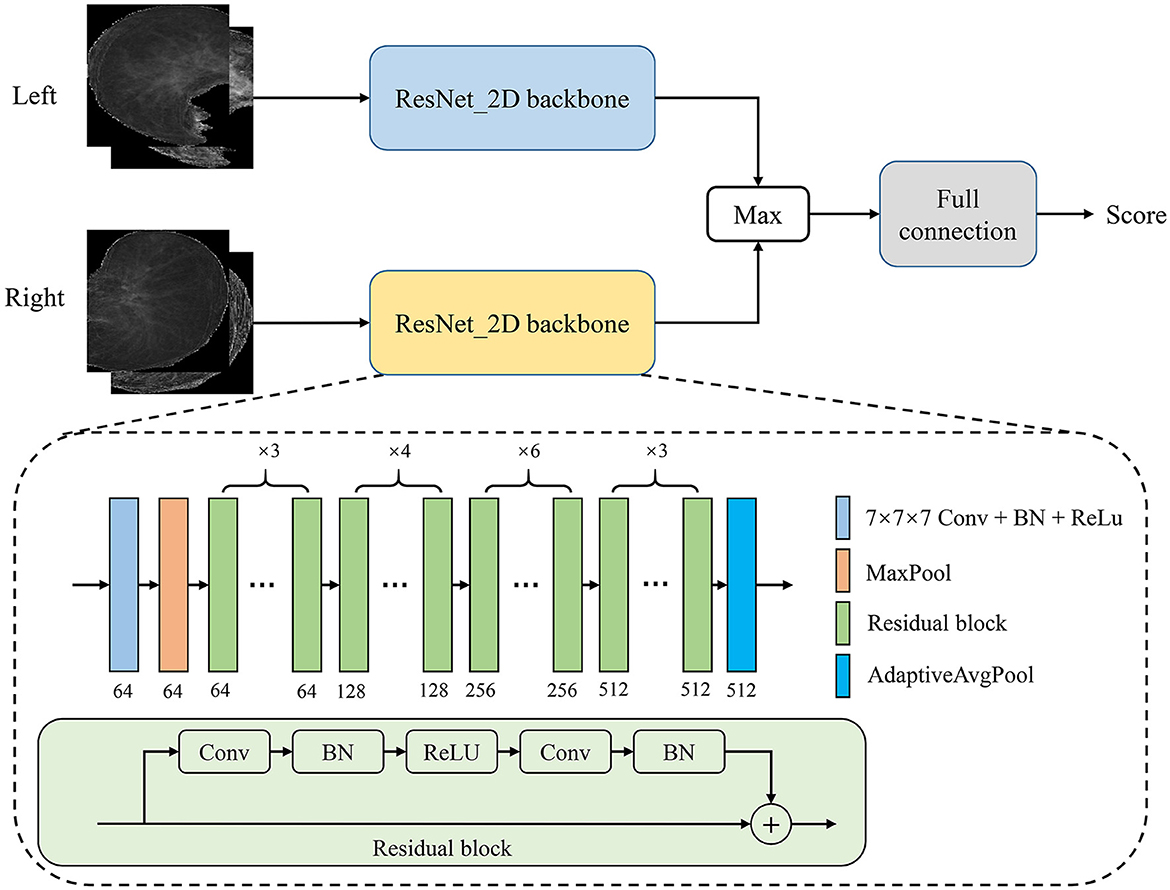
Figure 4. Framework of our proposed TBINet.
Network optimization
A loss function is typically necessary for CNN optimization. For TBINet optimization, we employ a binary cross-entropy loss function, which is specified as follows:
Where N is the number of samples, yi is the label of the sample i, and pi is the score of the sample i predicted by our TBINet.
The following describes a few implementation specifics. Our model was trained for 300 epochs using the Adam (22) optimizer and a step-decay learning rate. The learning rate was 0.0001 at the beginning. Some straightforward online data augmentation techniques were applied to the training set to reduce overfitting, such as random flipping, rotating, and zooming.
Model evaluation
The dataset was split into three sets: a training set, which was used to train the TBINet; a validation set, which was used for model parameter selection; and an external test set, which was used to evaluate the generalization ability of our model. We contrast our TBINet with the existing deep learning-based PTB classification methods, including 3D ResNet (14), AECNN (11), and LightCN (12), to demonstrate the advantages of our approach. The area under the receiver-operating-characteristic curve (AUC), accuracy, sensitivity, specificity, precision, and F1 score were calculated for these models to be evaluated and compared in the validation and external test set. The confusion matrices were also computed to display the prediction results of all compared methods.
Statistical analysis
The age difference was compared using the t-test, and gender was evaluated using the Chi-square test. The 95% confidence interval (CI) of the AUC metric was calculated for model evaluation.
SPSS statistical software version 26.0 (IBM Corp., Armonk, NY) and Python software version 3.6.6 (Python Software Foundation, Wilmington, DE, USA) were used for all analyses and model construction. All statistical tests were 2-sided, and P < 0.05 were considered to be statistically significant.
Results
Patients characteristics
This study included images from 925 in-patients. Both the training and validation sets were obtained from Hospital 1 (Table 1), whereas the external testing dataset was collected from Hospitals 2–4. There were 721 (77.9%) males and 204 (22.1%) females with a mean age of 50.6 ± 17.3 years. The ratio of positive to negative was 1.92, and training, validation, and testing sets were set at 51.1, 12.8, and 36.1% of the full set, respectively. There were no significant differences in the sex ratio between positive and negative groups (P = 0.432) and age (P = 0.192; see Table 2).

Table 1. Characteristics of patients at each hospital.
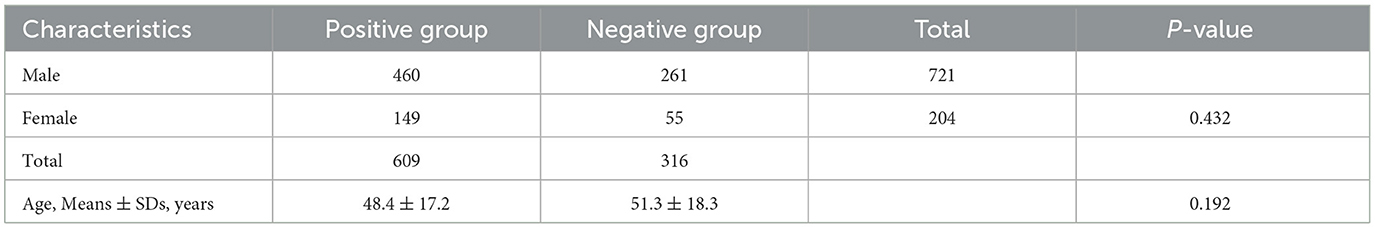
Table 2. Age and sex comparison between positive and negative groups.
Performance of the TBINet
Figure 5 shows the receiver-operating-characteristic curves (ROCs) of all compared methods. The 3D ResNet achieves the highest AUC (0.928) on the training set, but a lower AUC on the validation (0.796) and external test set (0.714), which indicates that it has serious over-fitting. Our TBINet achieves the best performance on the validation and external test sets with AUC of 0.817 and 0.754, respectively, which shows the superior generalization ability of our model. The detailed comparisons of AUC, accuracy, sensitivity, specificity, precision, and F1 score on the validation and external test sets are listed in Tables 3, 4, respectively. The results show that the proposed TBINet achieves the best performance with all metrics on the validation and external test set. As shown in Figure 6, the confusion matrices also show the predictions of the TBINet have fewer false positives and false negatives.
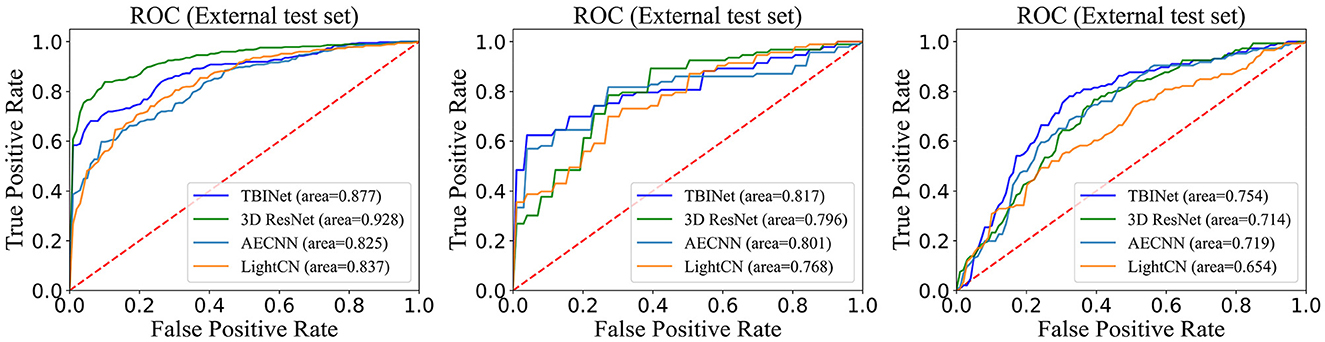
Figure 5. Receiver-operating-characteristic curves on the training, validation, and external test.
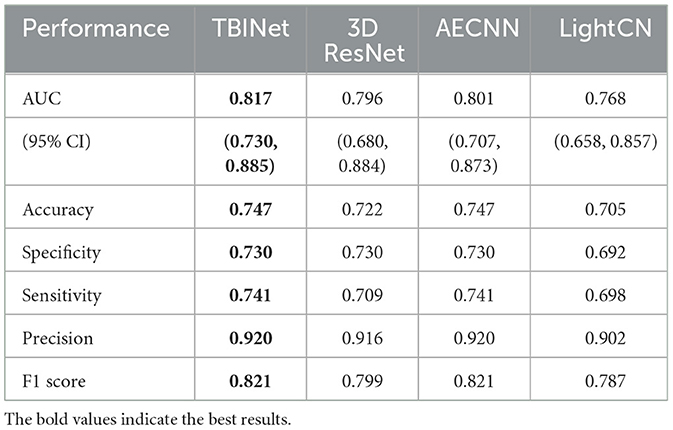
Table 3. Performance comparison of all methods on the validation set.
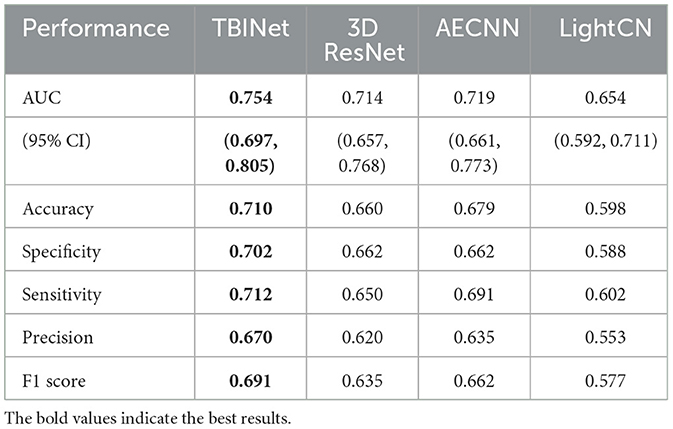
Table 4. Performance comparison of all methods on the external test set.
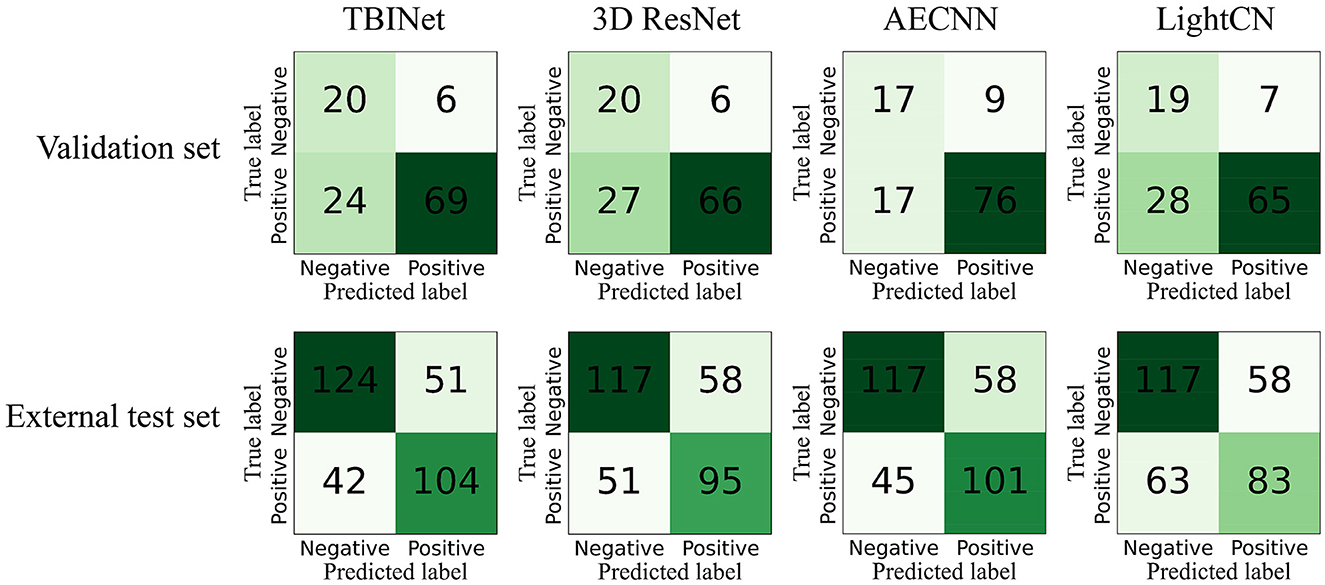
Figure 6. TBINet and 3D ResNet confusion matrices.
Model explainability
Gradient weighted class activation mapping (Grad-CAM) is a commonly used tool for CNN explainability. It uses gradients of a specific target that flow through the convolutional network to localize and highlight regions of the target in the image. Grad-CAM can reveal the areas of the image that the model relies on to make positive or negative predictions. Figure 7 presents some examples of Grad-CAM in action on our TBINet model.
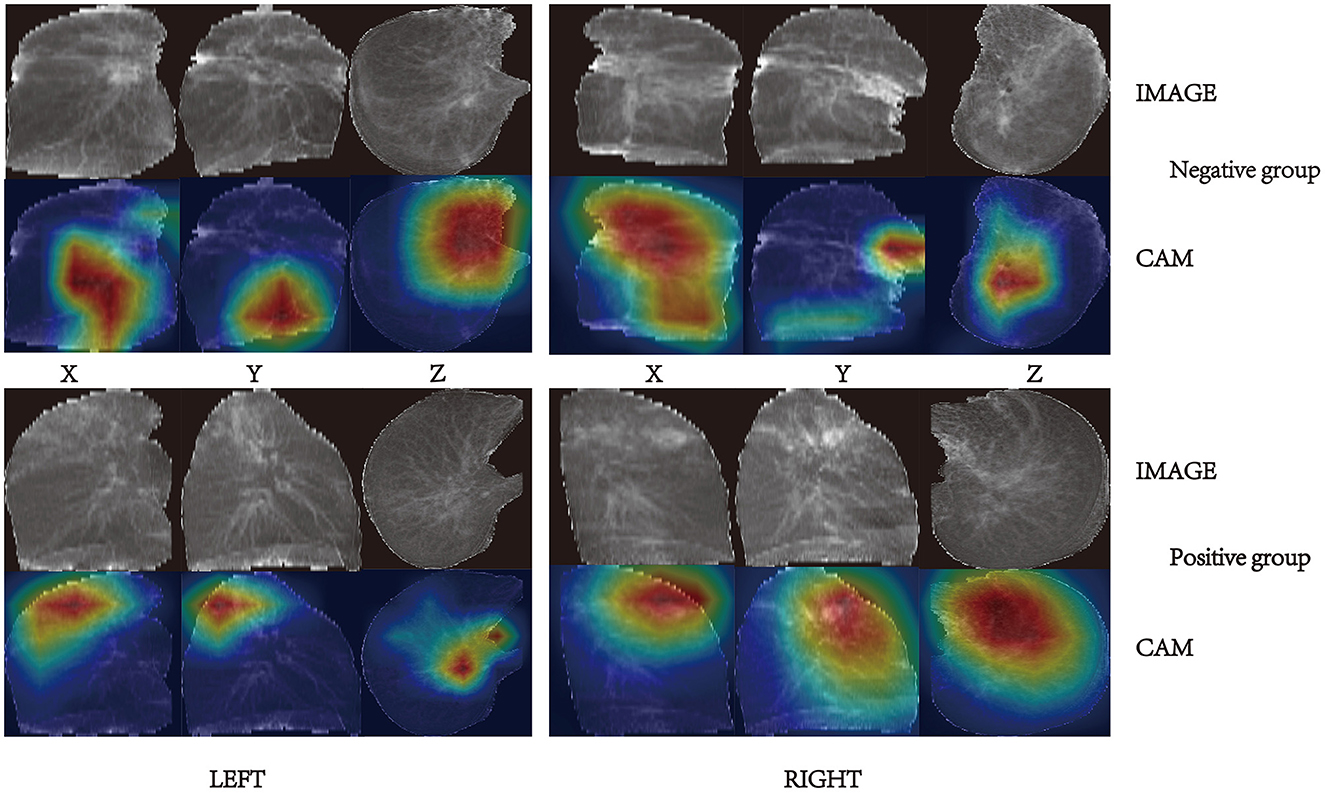
Figure 7. Lesion sites that the models focus on shown by Grad-CAM.
By observing and analyzing the image areas activated by Grad-CAM, we discovered: in the negative group with weak infectivity, the lesions were characterized by fibrous proliferation foci, bronchiectasis, pleural thickening, stretching, and adhesion, with a few cases exhibiting cavities; in the positive group with strong infectivity, the lesions were primarily characterized by exudate, and some cases exhibited caseous pneumonia, accompanied by cavity formation. These findings are consistent with the pathological features of pulmonary tuberculosis (PTB) (22).
Discussion
This study aimed to develop a convenient tool for identifying contagious PTB cases, to aid in the prevention and management of tuberculosis. Deep learning methods have recently shown great promise in disease diagnosis and prediction (23–26). Several CNN-based deep learning models have been proposed for TB analysis (17, 27–35). However, few studies have focused on the development of an identification model for PTB infectivity. Furthermore, previous studies have typically relied on etiological specimens to determine the infectivity of PTB patients rather than imaging (36). However, the collection of sputum is often not as convenient and standardized. Therefore, we propose the TBINet, a deep-learning model that utilizes CT images to identify contagious individuals with PTB. Our study demonstrates that the infectivity of PTB patients can be accurately reflected in chest CT images.
To minimize the errors in the label, we defined strict criteria for the inclusion of positive and negative groups. Patients who were included in the negative group need to have three or more records of negative sputum smear results in a month. Previous studies have suggested that having three or more negative smears is sufficient to lift isolation (10). For all enrolled individuals, the time interval between CT scanning and sputum smear testing should not exceed 1 month. To verify the generalization ability, we evaluated our model on an independent external test set composed of data from three hospitals.
Our TBINet uses 2D projection images of CT scans as inputs, reducing the input data's dimensionality. This allows for the use of a lightweight model for image classification tasks, which has better stability and requires fewer graphics processing units (GPUs) (37). Also, this reduces the overfitting of our model compared to 3D ResNet, as shown in Figure 5. While AECNN and LightCN employed 2D neural networks, they analyzed CT images on a single slice, limiting their utilization of 3D spatial information. In contrast, the projection image fed into our TBINet retained 3D information to a degree, and we took into account projections from three directions. During the testing phase, we utilized three TBINet models with shared weights to predict three 2D projection samples from different directions of a CT scan. We then used the mean of their scores as the final result, ensuring that the prediction results of our model were based on comprehensive analysis from multiple angles. According to the 2014 WHO meeting report, a screening test for PTB should have a specificity of over 70% (6, 38, 39). As the output of our model is a score, we suggest setting the cut-off value at 0.64 to maintain a sensitivity of 71.2%.
Previous studies often required each image's region of interest (ROI) for model prediction. However, this process is subjective and requires more workforce (40). In contrast, our model does not require manual ROI, making it convenient, objective, and cheap in the modeling phase. Grad-CAM was used to show the focused areas of our TBINet for explainability. By observing these areas, we found that CT images with more consolidation, voids, upper lobe involvement, and enlarged lymph nodes tended to be in the positive group, which aligns with previous research (9, 10).
CT findings are correlated with the sputum smear results (41). Caseous necrosis and airway lesions form the pathological basis for sputum tuberculosis smear-positive (42). Caseous necrosis, often presenting as consolidations and cavities, can occur when there is an increased number of Mtb (43). Ground-glass opacities and blurred margins are indicative of inflammatory and exudative changes (44), suggesting that the lesions are in the progressive stage, which is related to the host immune response triggered by Mtb replication. Mtb tends to replicate more readily in oxygen-rich areas (43), which can explain why upper lobe involvement is more common in the positive group.
Our study has some limitations. First, our model is unable to determine whether the bacteria discharged by PTB patients were alive or dead, which may require further investigation. Second, although our negative group was labeled based on continuous multiple negative sputum smear results, there were still false negative samples. A multidimensional comparison of Mtb examination results from sputum smears, cultures, and bronchoalveolar lavage fluids is needed to further distinguish PTB infectivity. In the future, our research will focus on seeking a more precise negative group. Third, TBINet cannot explain the process of Mtb replication and release. This may require large cohort studies.
Conclusion
We developed a deep-learning model called TBINet that can distinguish the infectivity of PTB patients rapidly and cheaply. Experimental results demonstrate that our approach outperforms existing methods. This is a new attempt to distinguish the infectivity of PTB. In resource-constrained regions, it may serve as an auxiliary tool for controlling PTB by aiding in the quick triage and placement of outpatient PTB patients, facilitating secure referrals of PTB patients between various clinical departments, evaluating the condition of PTB patients, and offering personalized assessments of the duration of home isolation for these patients.
Data availability statement
The raw data supporting the conclusions of this article will be made available by the authors, without undue reservation.
Ethics statement
The studies involving humans were approved by Hainan General Hospital Ethics Committee (No. 2021-314). The studies were conducted in accordance with the local legislation and institutional requirements. Written informed consent for participation was not required from the participants or the participants' legal guardians/next of kin in accordance with the national legislation and institutional requirements.
Author contributions
YG: Conceptualization, data curation, formal analysis, funding acquisition, investigation, methodology, project administration, and writing—original draft. YZha: conceptualization, data curation, formal analysis, methodology, software, visualization, and writing—original draft. CH: investigation, formal analysis, and methodology. PH, JF, FL, KL, XF, RL, and JS: Data collection and data analysis. FC: conceptualization, data curation, supervision, and review. WY: conceptualization, resources, methodology, and review. YZho: conceptualization, funding acquisition, resources, supervision, and review. All authors contributed to the article and approved the submitted version.
Funding
This study received support from the Hainan Province Science and Technology Special Fund (ZDYF2021SHFZ079), and the National Natural Science Foundation of China (81772923). The funding agencies did not participate in study design, data collection and analysis, the decision to publish, or manuscript preparation.
Acknowledgments
We thank Xiaoyan Lei, Xiaobo Li, Jinzhong Wang, Jianghui Luo, and Zefang Deng for their contributions to this work. The manuscript has not previously appeared online.
Conflict of interest
The authors declare that the research was conducted in the absence of any commercial or financial relationships that could be construed as a potential conflict of interest.
Publisher's note
All claims expressed in this article are solely those of the authors and do not necessarily represent those of their affiliated organizations, or those of the publisher, the editors and the reviewers. Any product that may be evaluated in this article, or claim that may be made by its manufacturer, is not guaranteed or endorsed by the publisher.
References
1. Temesgen E, Belete Y, Haile K, Ali S. Prevalence of active tuberculosis and associated factors among people with chronic psychotic disorders at St. Amanuel Mental Specialized Hospital and Gergesenon Mental Rehabilitation Center, Addis Ababa, Ethiopia. BMC Infect Dis. (2021) 21:1100. doi: 10.1186/s12879-021-06807-z
2. Bates JH. Transmission and pathogenesis of tuberculosis. Clin Chest Med. (1980) 1:167–74. doi: 10.1016/S0272-5231(21)00065-4
3. Patterson B, Bryden W, Call C, McKerry A, Leonard B, Seldon R, et al. Cough-independent production of viable Mycobacterium tuberculosis in bioaerosol. Tuberculosis. (2021) 126:102038. doi: 10.1016/j.tube.2020.102038
4. Dinkele R, Gessner S, McKerry A, Leonard B, Seldon R, Koch AS, et al. Capture and visualization of live Mycobacterium tuberculosis bacilli from tuberculosis patient bioaerosols. PLoS Pathog. (2021) 17:e1009262. doi: 10.1371/journal.ppat.1009262
5. Zhou Z, Li C, Zhu R, Wang D, Liu T, Jia J, et al. Combination of percutaneous lung biopsy and Xpert MTB/RIF ultra enhances the differential diagnosis of tuberculosis: a prospective cohort study. Infect Dis Ther. (2020) 9:797–806. doi: 10.1007/s40121-020-00327-0
6. Turner CT, Gupta RK, Tsaliki E, Roe JK, Mondal P, Nyawo GR, et al. Blood transcriptional biomarkers for active pulmonary tuberculosis in a high-burden setting: a prospective, observational, diagnostic accuracy study. Lancet Respir Med. (2020) 8:407–19. doi: 10.1016/S2213-2600(19)30469-2
7. Gao XW, James-Reynolds C, Currie E. Analysis of tuberculosis severity levels from CT pulmonary images based on enhanced residual deep learning architecture - ScienceDirect. Neurocomputing. (2020) 392:233–44. doi: 10.1016/j.neucom.2018.12.086
8. Wetscherek MTA, Sadler TJ, Lee JYJ, Karia S, Babar JL. Active pulmonary tuberculosis: something old, something new, something borrowed, something blue. Insights Imaging. (2022) 13:3. doi: 10.1186/s13244-021-01138-8
9. Wang Y, Shang X, Wang L, Fan J, Tian F, Wang X, et al. Clinical characteristics and chest computed tomography findings related to the infectivity of pulmonary tuberculosis. BMC Infect Dis. (2021) 21:1197. doi: 10.1186/s12879-021-06901-2
10. Nachiappan AC, Rahbar K, Shi X, et al. Pulmonary tuberculosis: role of radiology in diagnosis and management. Radiographics. (2017) 37:52–72. doi: 10.1148/rg.2017160032
11. Li L, Huang H, Jin X. AE-CNN classification of pulmonary tuberculosis based on CT images. In: 9th International Conference on Information Technology in Medicine and Education (ITME) (Piscataway, NJ). (2018). p. 39–42. doi: 10.1109/ITME.2018.00020
12. Tian J, Zhang Y, Lei J, Sun C, Hu G. Lightweight classification network for pulmonary tuberculosis based on CT images. J Artif Intell Technol. (2023) 3:25–31. doi: 10.37965/jait.2023.0153
13. Gao XW, Qian Y. Prediction of multidrug-resistant TB from CT pulmonary images based on deep learning techniques. Mol Pharm. (2018) 15:4326–35. doi: 10.1021/acs.molpharmaceut.7b00875
14. Wang L, Ding W, Mo Y, Shi D, Zhang S, Zhong L, et al. Distinguishing nontuberculous mycobacteria from Mycobacterium tuberculosis lung disease from CT images using a deep learning framework. Eur J Nucl Med Mol Imaging. (2021) 48:4293–306. doi: 10.1007/s00259-021-05432-x
15. Hwang EJ, Park S, Jin K-N, Kim JI, Choi SY, Lee JH, et al. Development and validation of a deep learning-based automatic detection algorithm for active pulmonary tuberculosis on chest radiographs. Clin Infect Dis. (2019) 69:739–47. doi: 10.1093/cid/ciy967
16. Vajda S, Karargyris A, Jaeger S, Santosh KC, Candemir S, Xue Z, et al. Feature selection for automatic tuberculosis screening in frontal chest radiographs. J Med Syst. (2018) 42:146. doi: 10.1007/s10916-018-0991-9
17. Lee S, Yim JJ, Kwak N, Lee YJ, Lee JK, Lee JY, et al. Deep learning to determine the activity of pulmonary tuberculosis on chest radiographs. Radiology. (2021) 301:435–42. doi: 10.1148/radiol.2021210063
18. Fradejas I, Ontañón B, Muñoz-Gallego I, Ramírez-Vela MJ, López-Roa P. The value of xpert MTB/RIF-generated CT values for predicting the smear status of patients with pulmonary tuberculosis. J Clin Tuberc Other Mycobact Dis. (2018) 13:9–12. doi: 10.1016/j.jctube.2018.04.002
19. National Health and Family Planning Commission of China. Diagnosis for Pulmonary Tuberculosis. National Health and Family Planning Commission of China (2017).
20. Hofmanninger J, Prayer F, Pan J, Röhrich S, Prosch H, Langs G. Automatic lung segmentation in routine imaging is primarily a data diversity problem, not a methodology problem. Eur Radiol Exp. (2020) 4:50. doi: 10.1186/s41747-020-00173-2
21. He K, Zhang X, Ren S, Sun J. Deep residual learning for image recognition. In: Proceedings of the IEEE Conference on Computer Vision and Pattern Recognition (Piscataway, NJ). (2016). p. 770–8.
22. Kingma D, Ba J. Adam: a method for stochastic optimization. Comput Sci. (2014). doi: 10.48550/arXiv.1412.6980
23. Chen X, Wang X, Zhang K, Fung K-M, Thai TC, Moore K, et al. Recent advances and clinical applications of deep learning in medical image analysis. Med Image Anal. (2022) 79:102444. doi: 10.1016/j.media.2022.102444
24. Litjens G, Kooi T, Bejnordi BE, Setio AAA, Ciompi F, Ghafoorian M, et al. A survey on deep learning in medical image analysis. Med Image Anal. (2017) 42:60–88. doi: 10.1016/j.media.2017.07.005
25. Koul A, Bawa RK, Kumar Y. Artificial intelligence techniques to predict the airway disorders illness: a systematic review. Arch Comput Methods Eng. (2023) 30:831–64. doi: 10.1007/s11831-022-09818-4
26. Xie X, Niu J, Liu X, Chen Z, Tang S, Yu S. A survey on incorporating domain knowledge into deep learning for medical image analysis. Med Image Anal. (2021) 69:101985. doi: 10.1016/j.media.2021.101985
27. Rahman T, Khandakar A, Kadir MA, Islam KR, Islam KF, Mazhar R, et al. Reliable tuberculosis detection using chest X-ray with Deep learning, segmentation and visualization. IEEE Access. (2020) 8:191586–601. doi: 10.1109/ACCESS.2020.3031384
28. Kavitha S, Nandhini PR, Harshana S, Jahnavi Srividya S, Harrinei K. ImageCLEF 2019: A 2D Convolutional Neural Network Approach for Severity Scoring of Lung Tuberculosis Using CT Images. Lugano (2019).
29. Abdela A. Mossa AMYA. Multi-View CNN With MLP for Diagnosing Tuberculosis Patients Using CT Scans and Clinically Relevant Metadata. Lugano (2019).
30. Higashiguchi M, Nishioka K, Kimura H, Matsumoto T. Prediction of the duration needed to achieve culture negativity in patients with active pulmonary tuberculosis using convolutional neural networks and chest radiography. Respir Invest. (2021) 59:421–7. doi: 10.1016/j.resinv.2021.01.004
31. Kuok C, Horng M, Liao Y, Chow N, Sun Y. An effective and accurate identification system of Mycobacterium tuberculosis using convolution neural networks. Microsc Res Techn. (2019) 82:709–19. doi: 10.1002/jemt.23217
32. Yang A, Jin X, Li L. CT Images Recognition of Pulmonary Tuberculosis Based on Improved Faster RCNN and U-Net. In: 2019 10th International Conference on Information Technology in Medicine and Education (ITME) (Piscataway, NJ). (2019). doi: 10.1109/ITME.2019.00032
33. Pahar M, Klopper M, Reeve B, Warren R, Theron G, Niesler T. Automatic cough classification for tuberculosis screening in a real-world environment. Physiol Meas. (2021) 42:105014. doi: 10.1088/1361-6579/ac2fb8
34. Gentili A. ImageCLEF2018: Transfer Learning for Deep Learning With CNN for Tuberculosis Classification (2018).
35. Bao Y, Zhao X, Wang L, Qian W, Sun J. Morphology-based classification of mycobacteria-infected macrophages with convolutional neural network: reveal EsxA-induced morphologic changes indistinguishable by naked eyes. Transl Res. (2019) 212:1–13. doi: 10.1016/j.trsl.2019.06.001
36. Leonard MK, Kourbatova E, Blumberg HM. Re: how many sputum specimens are necessary to diagnose pulmonary tuberculosis. (2006) 34:328–9. doi: 10.1016/j.ajic.2006.01.006
37. Zunair H, Rahman A, Mohammed N, Cohen JP. Uniformizing techniques to process CT scans with 3D CNNs for tuberculosis prediction. In: Rekik I, Adeli E, Park SH, Valdés Hernández MC, editors. Predictive Intelligence in Medicine. PRIME 2020. Lecture Notes in Computer Science. Vol. 12329. Cham: Springer (2020). p. 156–68. doi: 10.1007/978-3-030-59354-4_15
38. Dhana A, Hamada Y, Kengne AP, Kerkhoff AD, Rangaka MX, Kredo T, et al. Tuberculosis screening among ambulatory people living with HIV: a systematic review and individual participant data meta-analysis. Lancet Infect Dis. (2022) 22:507–18. doi: 10.1016/S1473-3099(21)00387-X
39. World Health Organization. Meeting Report: High-Priority Target Product Profiles for New Tuberculosis Diagnostics. World Health Organization (2014).
40. Jing L, Tian Y. Self-supervised visual feature learning with deep neural networks: a survey. IEEE Trans Pattern Anal Mach Intellig. (2020) 43:403–758. doi: 10.1109/TPAMI.2020.2992393
41. Matsuoka S, Uchiyama K, Shima H, Suzuki K, Shimura A, Sasaki Y, et al. Relationship between CT findings of pulmonary tuberculosis and the number of acid-fast bacilli on sputum smears. Clin Imaging. (2004) 28:119–23. doi: 10.1016/S0899-7071(03)00148-7
42. Guan XH. 活动性肺结核间质病变高分辨CT表现及病理基础 (The HRCT Manifestations and Pathological Basis of Interstitial Disorders in the Active Pulmonary Tuberculosis). Dalian Medical University (2009). p. 1–30. (in Chinese).
43. Grosset J. Mycobacterium tuberculosis in the extracellular compartment: an underestimated adversary. Antimicrob Agents Chemother. (2003) 47:833–6. doi: 10.1128/AAC.47.3.833-836.2003
Keywords: pulmonary tuberculosis, deep learning, disease control and prevention, infectivity identification, CT
Citation: Gao Y, Zhang Y, Hu C, He P, Fu J, Lin F, Liu K, Fu X, Liu R, Sun J, Chen F, Yang W and Zhou Y (2023) Distinguishing infectivity in patients with pulmonary tuberculosis using deep learning. Front. Public Health 11:1247141. doi: 10.3389/fpubh.2023.1247141
Received: 25 June 2023; Accepted: 07 November 2023;
Published: 27 November 2023.
Edited by:
Jason C. Hsu, Taipei Medical University, TaiwanReviewed by:
Amir Faisal, Sumatra Institute of Technology, IndonesiaGuoliang Zhang, Shenzhen Third People's Hospital, China
Copyright © 2023 Gao, Zhang, Hu, He, Fu, Lin, Liu, Fu, Liu, Sun, Chen, Yang and Zhou. This is an open-access article distributed under the terms of the Creative Commons Attribution License (CC BY). The use, distribution or reproduction in other forums is permitted, provided the original author(s) and the copyright owner(s) are credited and that the original publication in this journal is cited, in accordance with accepted academic practice. No use, distribution or reproduction is permitted which does not comply with these terms.
*Correspondence: Yuanping Zhou, eXVhbnBpbmd6aG91QDE2My5jb20=; Wei Yang, d2VpeWFuZ2dtQGdtYWlsLmNvbQ==; Feng Chen, ZmVuZ2VyMDgwMkAxNjMuY29t
†These authors have contributed equally to this work