 Di Liang
 Wenjun Zhu1,2
 Jiayan Huang
- 1School of Public Health, Fudan University, Shanghai, China
- 2Key Lab of Health Technology Assessment, National Health Commission, Shanghai, China
- 3The People’s Hospital of Yuhuan, Taizhou, China
Introduction: An integrated care program was set up in China to improve the collaboration between primary healthcare centers and hospitals on diabetes management. This study aims to evaluate the economic value of this program with real-world data and to examine whether it can be promoted in primary healthcare settings in China.
Methods: This integrated diabetes care program was implemented in Yuhuan City, China, to coordinate primary care and specialty care, treatment and prevention services, as well as the responsibilities of doctors and nurses. Cost-effectiveness analysis was used to compare the short-term economic value of this program (intervention group) versus usual diabetes management (control group). The cost data were collected from a societal perspective, while the effectiveness indicators pointed to the improvement of control rates of fasting blood glucose (FBG), systolic blood pressure (SBP), and diastolic blood pressure (DBP) levels after the 1 year intervention. In addition, cost-utility analysis was applied to evaluate the long-term value of the two groups. Patients’ long-term diabetes management costs and quality-adjusted life years (QALYs) were simulated by the United Kingdom Prospective Diabetes Study Outcomes Model 2.
Results: The results showed that for 1% FBG, SPB, and DBP control rate improvement, the costs for the intervention group were 290.53, 124.39, and 249.15 Chinese Yuan (CNY), respectively, while the corresponding costs for the control group were 655.19, 610.43, and 1460.25 CNY. Thus, the intervention group’s cost-effectiveness ratios were lower than those of the control group. In addition, compared to the control group, the intervention group’s incremental costs per QALY improvement were 102.67 thousand CNY, which means that the intervention was cost-effective according to the World Health Organization’s standards.
Discussion: In conclusion, this study suggested that this integrated diabetes care program created short-term and long-term economic values through patient self-management support, primary care strengthening, and care coordination. As this program followed the principles of integrated care reform, it can be promoted in China. Also, its elements can provide valuable experience for other researchers to build customized integrated care models.
Introduction
Diabetes can have significant economic impacts on individuals, families, and society (1). It was estimated that 536.6 million adults had diabetes worldwide in 2021 (2). The direct and indirect costs of diabetes in 2015 were calculated to be US$1.31 trillion globally, accounting for 1.8% of the global Gross Domestic Product (GDP) in the same year (3).
Like the rest of the world, China also faces a significant burden of disease from diabetes. However, there are several challenges in managing diabetes in China. First, the capacity of primary healthcare centers (PHCs) is insufficient. According to a national survey, only half of the patients with diabetes can be diagnosed, and less than 10% of diagnosed patients had good diabetes control when they sought care from PHCs (4). Second is that secondary and tertiary hospitals undertake lots of routine diabetes management tasks instead of PHCs, which is a huge workload for hospitals’ medical staff. In summary, the collaboration between PHCs and hospitals is still underdeveloped in China.
In order to address these problems, an integrated diabetes care program called Metabolic Management Center (MMC) was set up. This program established a standardized clinical pathway that specified the responsibility of diabetes management at each level of medical facilities, and integrated the treatment and prevention services provided by PHCs and hospitals. In addition, through comprehensive training, the program also enabled medical staff to provide high-quality and continuous services to patients. The efficacy of the MMC program has been validated by previous randomized controlled trials (5). However, there is a relative paucity of studies investigating the effectiveness and economic value of this integrated diabetes care program based on real-world data.
Globally, debate continues about the economic value of integrated diabetes care programs. Some studies found that integrated care programs were cost-saving considering patients’ long-term coronary heart disease risk reduction (6). However, most studies suggested that integrated care programs can improve patients’ quality-adjusted life years (QALYs) but with additional input. The types and frequencies of disease management inventions included in integrated care programs would influence whether those programs were cost-effective or not (7). Furthermore, there were also some weaknesses in previous economic evaluations. First, the costs and clinical parameters required by the health economic analysis were normally collected from registered datasets, clinical trials, key informant interviews, and literature (8–11). Few studies utilized claim datasets to capture the real-world costs of diabetes treatment (12). Second, the perspectives of cost collection were mainly from the health system or third-party payer. Few studies collected patients’ direct non-medical costs and indirect costs. However, indirect costs were estimated to account for 34.7% of the global economic burden of diabetes in 2015 (3), so these costs were also essential and can largely influence patients’ lives.
In order to supplement the evidence for the economic value of diabetes care, our study conducted a health economic analysis of the aforementioned integrated diabetes care program in China. Real-world data was used to assess the short-term and long-term economic value of this program in order to evaluate whether it can be promoted in primary healthcare settings.
Methods
Study setting
Our study was conducted in Yuhuan City, Zhejiang Province, China. Yuhuan is located in southeast China, with a population of 648 thousand residents (12). In 2021, the yearly GDP per capita of Yuhuan was 110,122 Chinese Yuan (CNY) which is the currency of China (13), which was 35.99% higher than the GDP per capita in China (80,976 CNY) (14). Yuhuan has two secondary hospitals and 11 primary healthcare centers (PHCs). PHCs are responsible for the preventive care and treatment of common diseases, such as diabetes and hypertension. In contrast, the responsibilities of secondary hospitals mainly include treatment for specialty diseases. In order to promote integrated care, these medical facilities have integrated into two medical groups according to the geographic locations. Group 1 consists of one secondary hospital and five PHCs, and provides services for residents living in the southern part of Yuhuan. Group 2 contains the remaining facilities and serves residents living in the northern part of Yuhuan. However, since China does not establish formal gate-keeping mechanisms, patients can choose any medical facility to treat diseases based on their preference.
Group 1 initiated an integrated diabetes care program and was selected as the survey site in this study.
Usual diabetes management
As part of the Essential Public Health Services in China, primary care providers (PCPs) in PHCs are responsible for diabetes management for patients with diabetes in Yuhuan City. Usual diabetes management consists of blood glucose surveillance, treatment plan adjustment, and health education. The interval of follow-up depends on patients’ disease risks, which are assessed by patients’ blood glucose levels and the presence of comorbidities or complications. For high-risk patients, the interval is 1 month, while for low-risk patients the interval is 3 months. When PCPs cannot handle patients’ problems, they would refer those patients to secondary hospitals. In practice, due to the limited capacity of PCPs, they can hardly address patients’ needs if complications arise. Consequently, many patients bypass PCPs and go directly to secondary hospitals due to the lack of gate-keeping mechanisms. However, there is still insufficient collaboration and coordination between PHCs and hospitals.
Intervention
To supplement the shortcomings of usual diabetes management, an integrated diabetes care program (MMC program) was established. This program was delivered by two MMC centers in the secondary hospital and one of five PHCs in Group 1. This program aims to provide better diabetes management services for patients. Compared to usual diabetes management, MMC first integrated diabetes treatment and prevention services. MMC established a standardized management plan, which specifies detailed examination requirements (e.g., blood glucose, blood lipid, urine microalbumin) at each follow-up. This plan emphasizes the importance of both diabetes control and the prevention of diabetes-related complications, with the aim of early detection and treatment for retinopathy, nephropathy, neuropathy, vascular disease, foot ulcer, and so on. In addition, each MMC center has a health education nurse to provide personalized lifestyle interventions to patients. An App was also developed to encourage patients to record their self-tested fasting blood glucose (FBG) and blood pressure levels which can be supervised by physicians.
Second, MMC integrates primary care provided by the PHC and specialty care provided by the secondary hospital. The responsibilities of patient management are separated between the two facilities. Most follow-ups are done by PHCs, while patients only need to go to the hospital once a year. Furthermore, a referral network was built and all medical records of registered patients can be checked by responsible physicians in the secondary hospital and PHC. The divisions between nurses and doctors were also adjusted in two facilities, as nurses undertake many management responsibilities and doctors’ work burden is reduced.
Study design
A cohort study was conducted to evaluate the economic value of the MMC program versus usual diabetes management. The study period ranged from May 1st, 2021 to April 30th, 2022. All patients with diabetes or pre-diabetes who registered at MMC from January to April 2021 in Yuhuan were included in the intervention group. The registration for MMC is based on patients’ willingness. On the other side, all patients with diabetes or pre-diabetes who received the usual diabetes management provided by five selected PHCs and did not register at MMC by the end of the study period were included in the control group. Both groups had the freedom to visit any PHCs or hospitals as needed.
The exclusion criteria for the study were: (1) patients who did not attend any social medical insurance in Yuhuan, which includes Basic Medical Insurance for Urban Employees (UE) and Basic Medical Insurance for Urban and Rural Residents (URR); (2) patients who did not have any diabetes-related records in claims dataset; (3) patients with no follow-up data after the one-year intervention period. According to these criteria, 295 patients from the intervention group and 6,435 patients from the control group were eligible.
This study was approved by the Medical Research Ethics Committee, School of Public Health, Fudan University (IRB#2021-TYSQ-04-122).
Cost-effectiveness analysis
Cost parameters
The costs of intervention and control groups were collected from a societal perspective, which included direct medical costs, direct nonmedical costs, indirect costs, and overhead costs.
Direct medical costs pointed to the medical fees generated for the treatment of diabetes and its complications in any medical facilities around China, including reimbursed costs and patients’ out-of-pocket costs. These costs were retrieved from Yuhuan’s social health insurance claims dataset.
Direct nonmedical costs and indirect costs referred to transportation fees, hotel fees, and productivity loss due to diabetes treatment, which were gathered through patient questionnaires. This questionnaire survey, which was conducted by trained investigators, collected patients’ and their companions’ transportation fees, hotel fees, and time used to seek outpatient and inpatient care because of diabetes. The calculation of indirect costs (productivity loss) was based on the treatment time and the patient’s average daily income in Yuhuan. All participants were informed and consented to attend the survey.
Lastly, the study calculated the overhead costs for two groups, which mainly included the costs for health education, fee-for-free follow-ups, medical staff training, and clinic re-decoration. Those costs were estimated through interviews with six key informants who participated in usual diabetes management or MMC, including two hospital managers, two doctors, and two nurses. The summary costs were shared by each beneficiary patient.
In summary, the total costs for a patient’s 1 year diabetes management are equal to:
Short-term clinical parameters
The clinical effectiveness of intervention and control groups was evaluated in one year from May 1st, 2021 to April 30th, 2022. And the intervention and control groups’ data came from the MMC information system and county patients’ electronic health records, respectively. We measured the rate of patients who achieved FBG, systolic blood pressure (SBP), and diastolic blood pressure (DBP) control targets (control rate) at baseline and after intervention in two groups. The control targets for FBG, SPB, and DBP were <7.0 mmol/L, ≤139 mmHg, and ≤89 mmHg, respectively (15–17). The effectiveness indicators included the percentage changes in FBG, SPB, and DBP control rates, defined as:
Cost-effectiveness ratio
Our study applied cost-effectiveness analysis to assess the short-term economic value of MMC. In order to control confounding biases, propensity score matching (PSM) was first used to match the patients in intervention and control groups under 1:4 nearest neighbors matching, with a matching caliper of 0.05. Matching covariates included patients’ sociodemographic information (age, sex, and type of social medical insurance) and their disease conditions (diabetes type, whether or not has diabetes-related complications, duration of diabetes, whether or not use oral hypoglycemic medications/insulin, and whether or not smoke/drink alcohol). Among those covariates, social medical insurance type can be a proxy for patients’ socioeconomic status (SES). Normally, people with UE have a relatively higher SES than those with URR, as UE covers all public and private sectors’ employees and URR covers the remaining residents.
Secondly, patients’ sociodemographic information and disease conditions were reported before and after matching, and the chi-square test and Wilcoxon rank sum test were used to compare the differences between the intervention and control groups. In addition, the cost-effectiveness ratio (CER) of the two groups and the incremental cost-effectiveness ratio (ICER) were calculated based on matched data. The algorithms were:
CER represents the unit costs for 1% control rate improvement in two groups. ICER showed the intervention group’s incremental costs for higher clinical improvement compared to the control group. The lower the CER and ICER, the higher the short-term economic value of MMC.
Cost-utility analysis
Long-term costs and health outcomes
The United Kingdom Prospective Diabetes Study Outcomes Model 2 (UKPDS-OM2) was applied to simulate the long-term costs and health outcomes of the intervention and control groups. This simulation model was built on the 30 years follow-up results of the United Kingdom Prospective Diabetes Study, and was applied and validated by many previous studies (18, 19). After entering patients’ demographic, clinical risk factors and costs, as well as complication history data at present time, the model would predict individual patients’ annual incidence of death and complications (e.g., myocardial infarction, renal failure), life expectancy, QALYs and costs for diabetes management in future years (18).
Our study used patients’ clinical parameters after intervention and 1 year total costs for diabetes management to predict intervention and control groups’ QALYs and long-term costs in 50 years. The detailed data sources of clinical parameters are presented in Appendix 1 (20). In addition, the values and data sources of input therapy costs, complication costs (21–23), as well as baseline utility and utility decrements for each complication (24, 25) are shown in Appendices 2, 3. The model loop was set to be 5,000 times, and discount rates for costs and QALYs were set to be 3% as recommended by the World Health Organization (WHO) (26). Due to the requirement of UKPDS-OM2, patients with missing clinical data and/or type 1 diabetes were excluded from the simulation.
Cost-utility ratio
A cost-utility analysis was applied to evaluate the long-term economic value of MMC. First, PSM with nearest neighbors matching was used to match one patient from the intervention group to four patients from the control group in order to reduce confounding biases. Matching covariates included patients’ age, sex, duration of diabetes, whether or not use oral hypoglycemic medications/insulin, and whether or not smoke/drink alcohol. The matching caliper was 0.05. The differences of each covariate between intervention and control groups were tested by chi-square test or Wilcoxon rank sum test after matching. Also, our study calculated the cost-utility ratio (CUR) of each group and the incremental cost-utility ratio (ICUR) using matched data. The algorithms were:
CUR describes the unit costs per QALY for two groups, while ICUR assessed the intervention group’s incremental costs per QALY improvement compared to the control group. According to WHO’s recommendation, if ICUR was less than the annual GDP per capita in China (80,976 CNY in 2021), then the intervention can be considered very cost-effective. If ICUR was less than three times the annual GDP per capita (242,928 CNY), then the intervention is considered cost-effective. Those exceeding this level are considered not cost-effective (27, 28).
In addition, subgroup analyses for different age patients were conducted, since age can largely influence patients’ QALYs and long-term costs.
Results
Patients’ characteristics
A total of 6,730 patients were eligible for cost-effectiveness analysis, among which 295 patients belonged to the intervention group and 6,435 belonged to the control group. The basic characteristics differed significantly between the two groups. Compared to the control group, patients from the intervention group were younger and had shorter diabetes duration. A higher percentage of patients in the intervention group were male (intervention vs. control: 62.03% vs. 45.84%), attended UE (64.41% vs. 24.51%), had diabetes-related complications (46.78% vs. 11.97%), used insulin (24.75% vs. 16.11%), smoked (22.37% vs. 16.43%), and drank alcohol (39.32% vs. 20.14%). The detailed characteristics of patients are presented in Table 1.
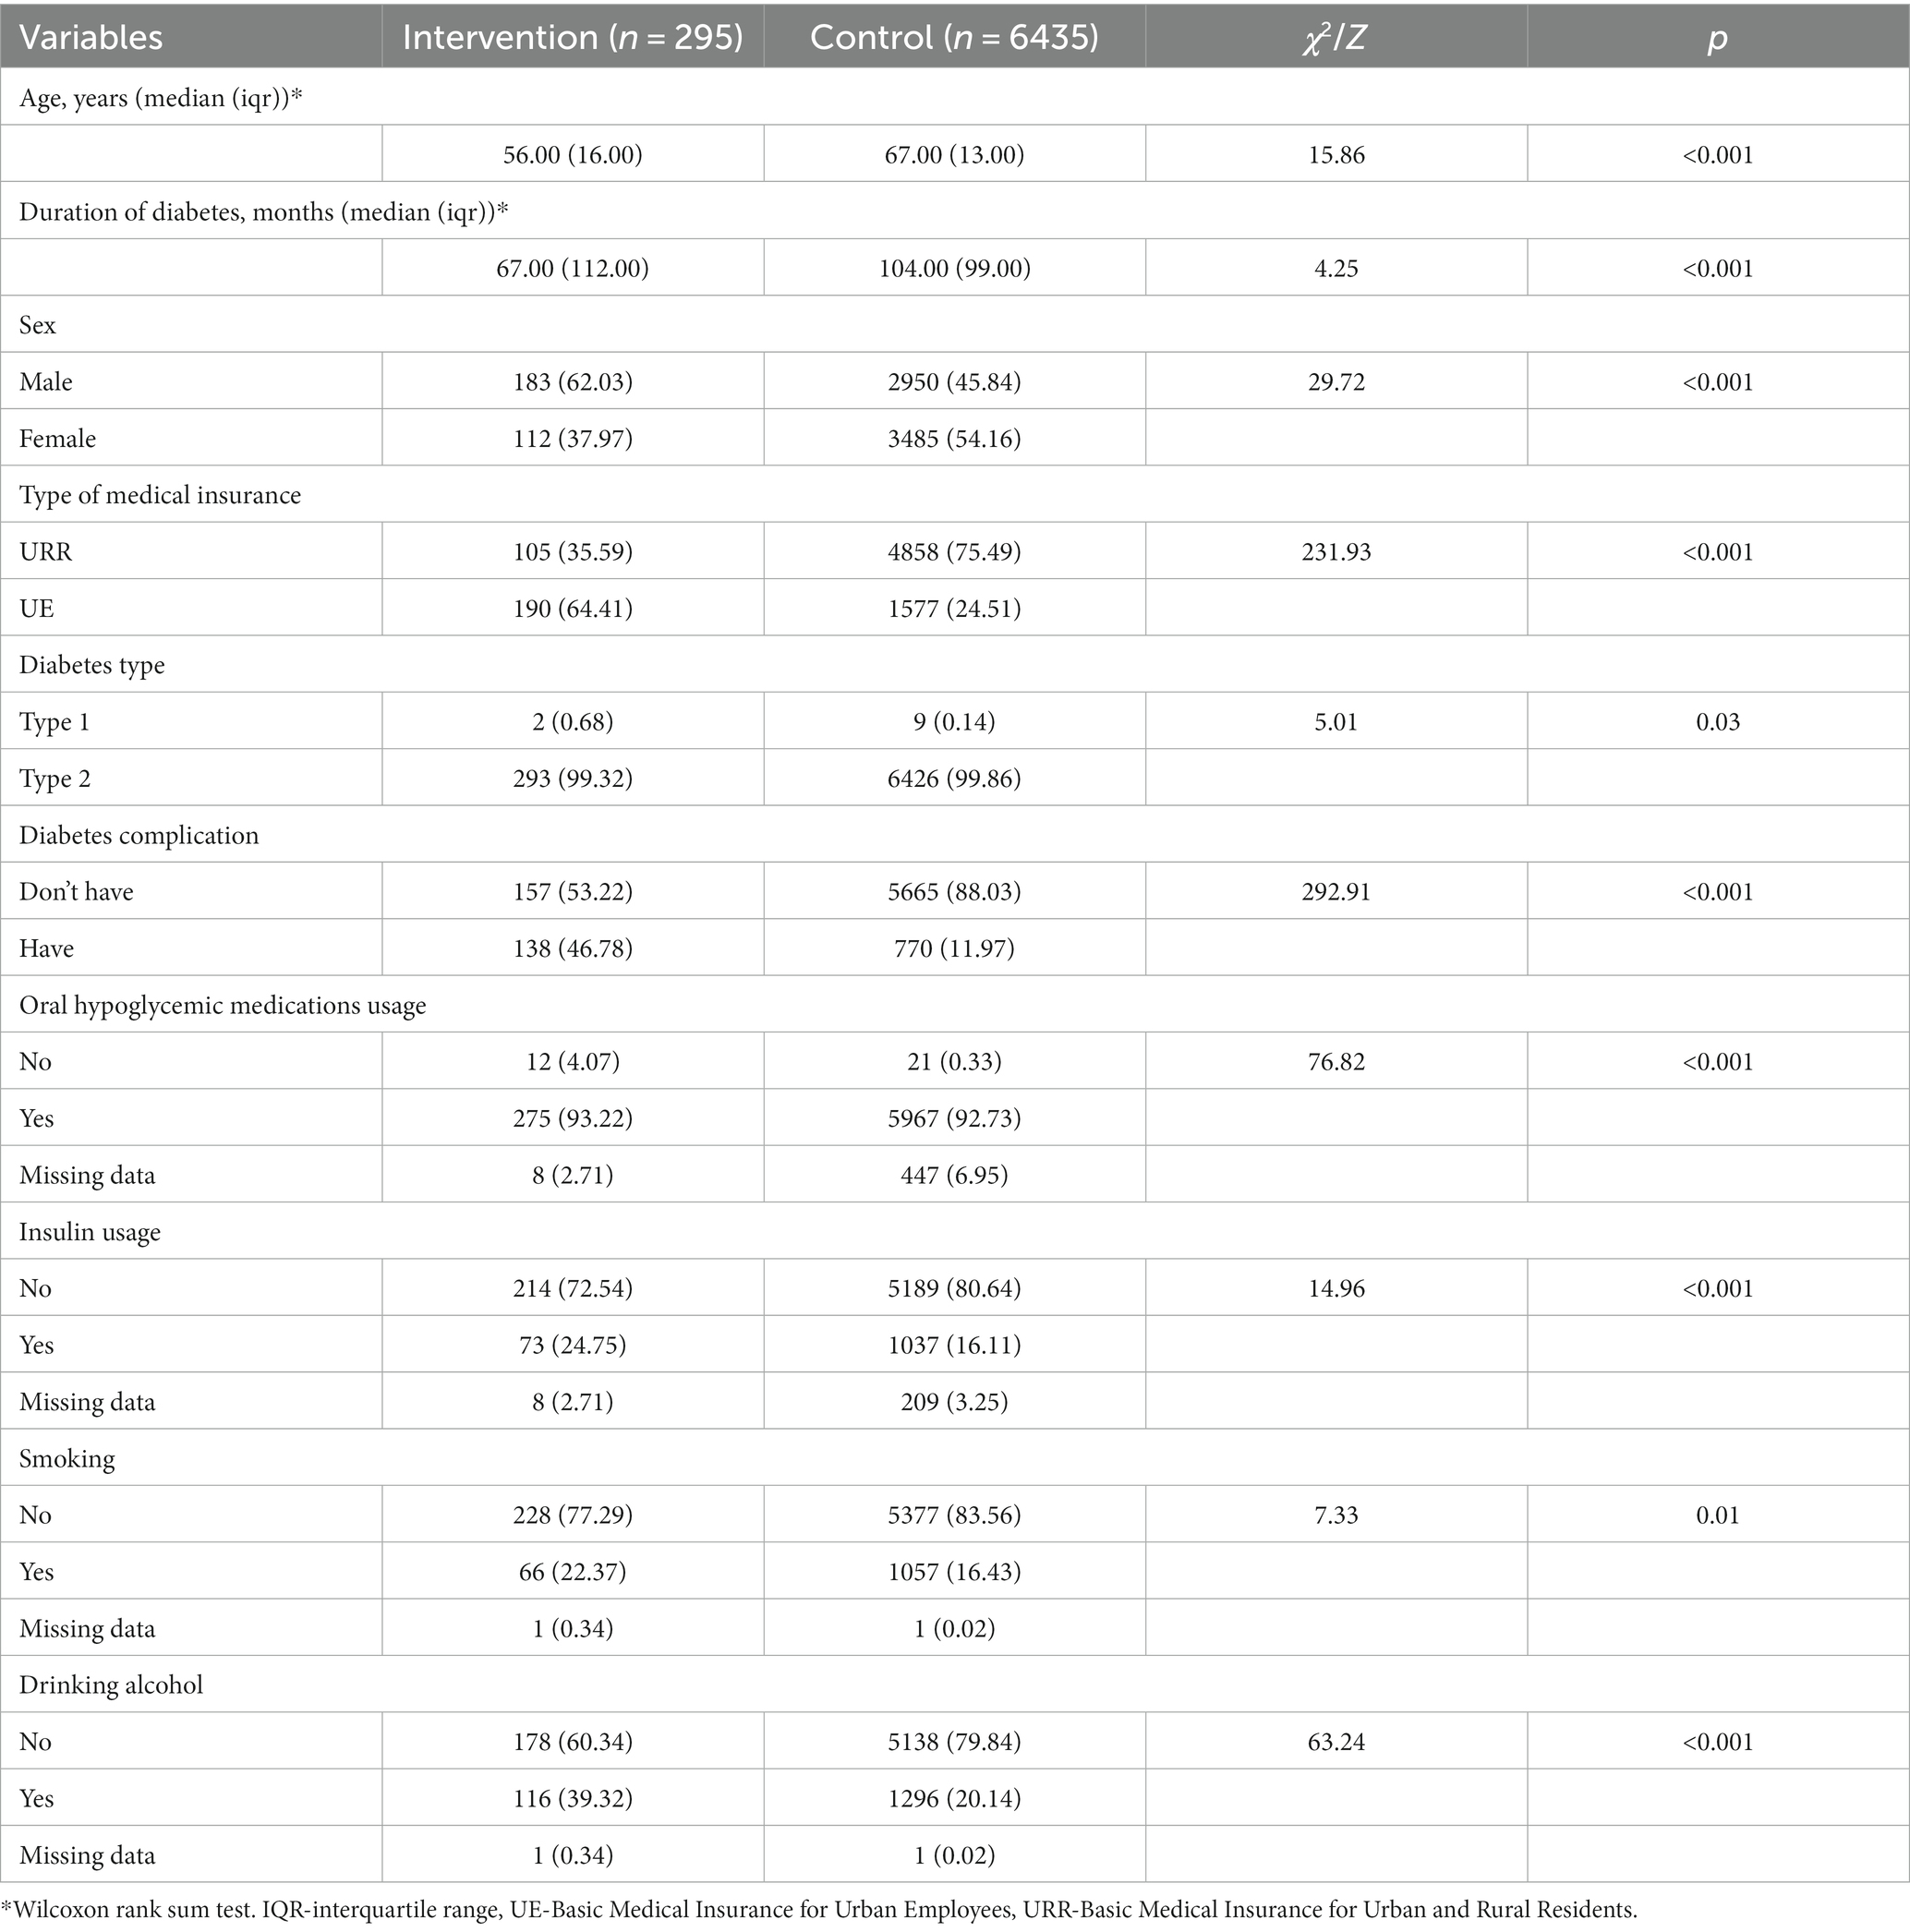
Table 1. The basic characteristics of diabetes patients included in the study.
Among those patients, 213 patients with type 2 diabetes from the intervention group and 1,468 patients from the control group had all the clinical data required by the UKPDS-OM2 model, thus 1,681 patients were eligible for cost-utility analysis. The patient flow is shown in Figure 1.
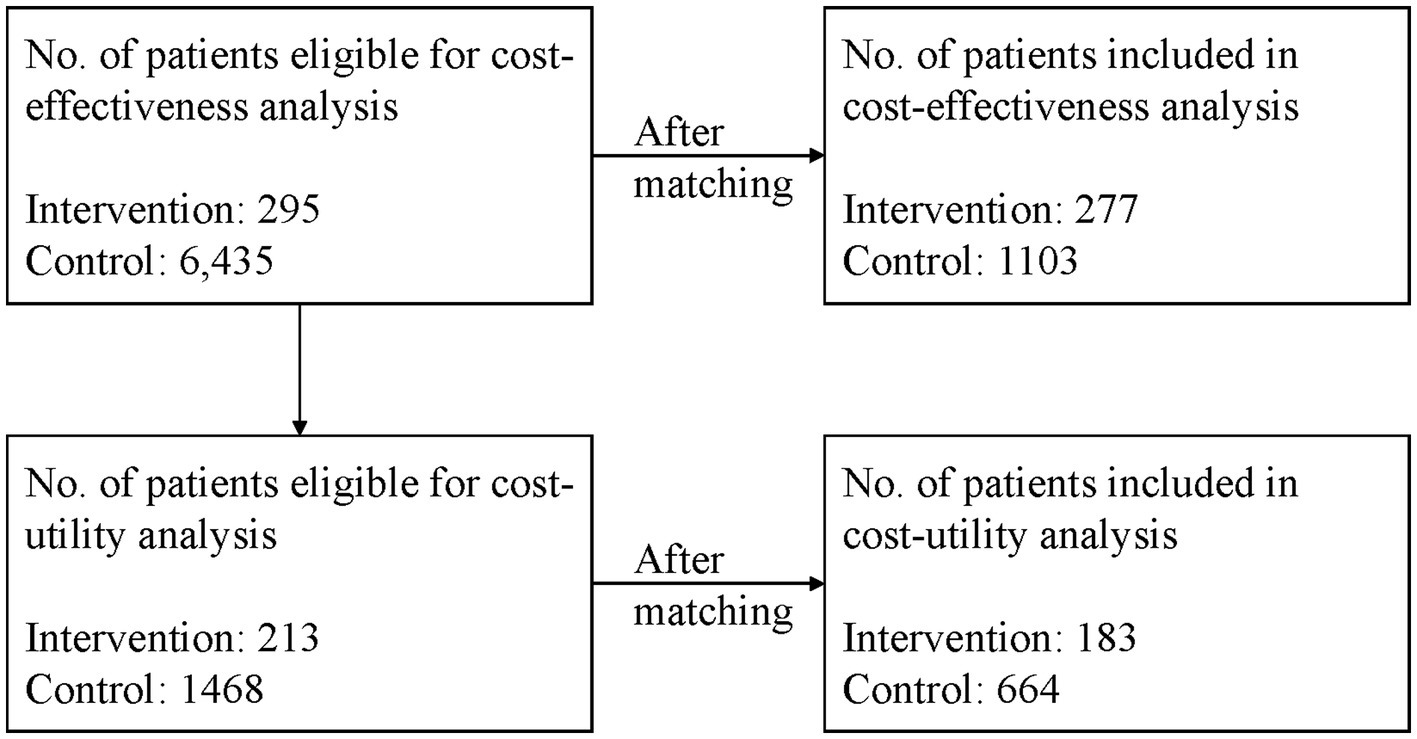
Figure 1. The patient flow of the study.
Cost-effectiveness analysis
Cost structure
After 1:4 matching, 277 patients from the intervention group and 1,103 patients from the control group were included. There were no significant differences between the two groups considering patients’ basic characteristics (Appendix 4).
The components of intervention and control groups’ 1 year diabetes management total costs are displayed in Table 2. The median (interquartile range, IQR) of total costs for the intervention group were 2536.37 (3160.18) CNY, while the total costs for control group were 2234.19 (4034.12) CNY. Among all the components, direct medical costs accounted for the largest part of total costs. For the intervention group, the direct medical costs were 1551.52 (2795.12) CNY, and for the control group, the costs were 673.08 (1378.38) CNY. In addition, the detailed components of overhead costs were shown in Appendix 5.
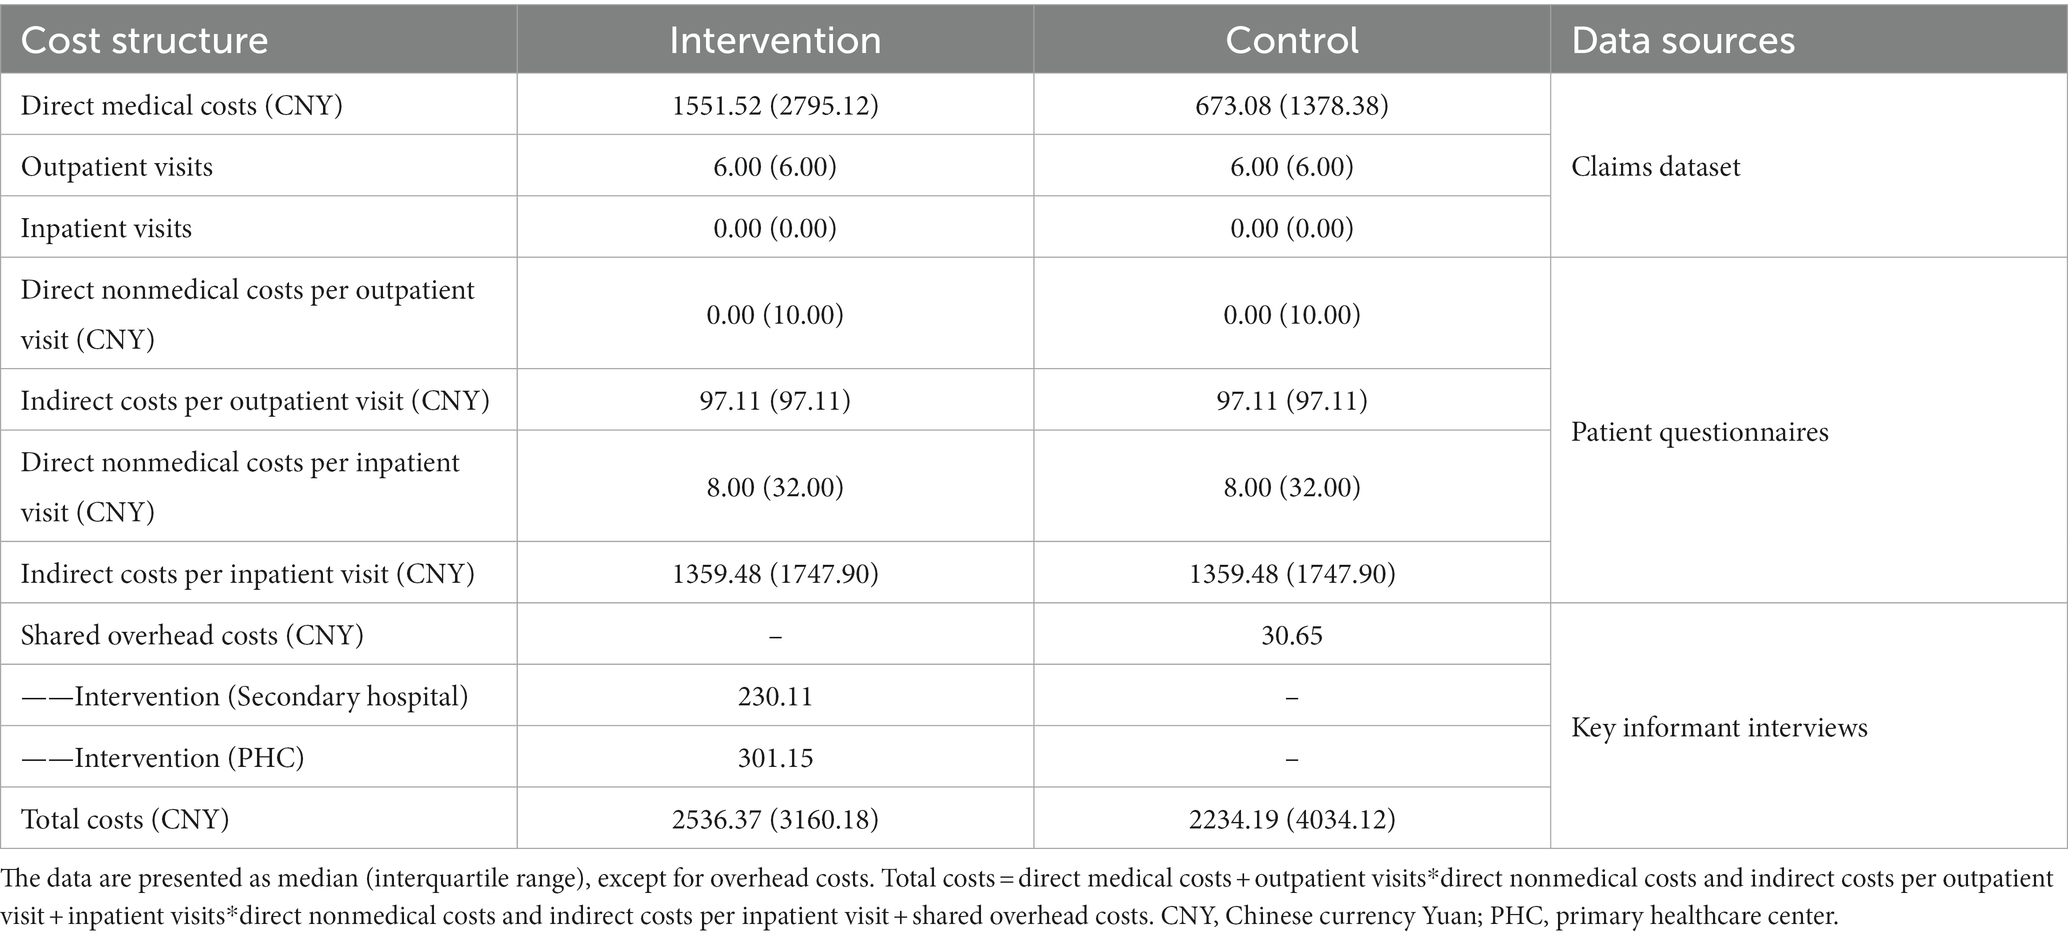
Table 2. The cost structure for 1 year diabetes management total costs.
The results of cost-effectiveness analysis
The FBG control rate increased by 8.73 and 3.41% after 1 year for the intervention and control groups, respectively. Thus, for 1% FBG control rate improvement, the costs of the two groups were 290.53 CNY and 655.19 CNY. Also, the intervention group’s incremental costs per improvement (ICER) were 56.80 CNY (Table 3).
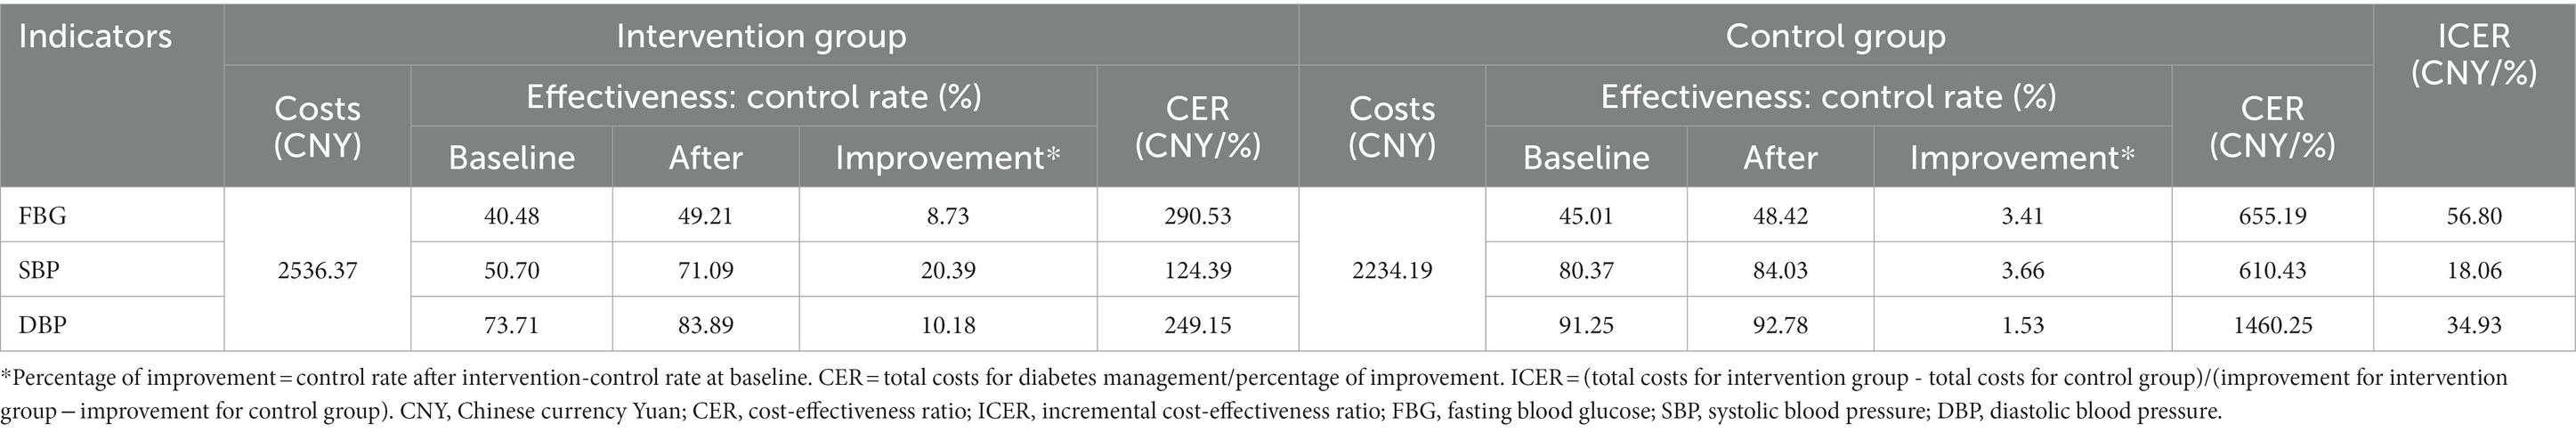
Table 3. The results of cost-effectiveness analysis for intervention versus control group.
In addition, for 1% SBP control rate improvement, the costs of the two groups were 124.39 CNY and 610.43 CNY, leading to an ICER of 18.06 CNY/%. For 1% DBP control rate improvement, the costs of the two groups were 249.15 CNY and 1460.25 CNY, and the ICER was 34.93 CNY/%. For all three clinical indicators, the intervention group’s CERs were lower than the control group’s (Table 3).
Cost-utility analysis
QALYs and long-term costs
After 1:4 matching, 183 and 664 patients from intervention and control groups were included in the cost-utility analysis. There were no significant differences between the two groups considering the basic characteristics, as shown in Appendix 6.
According to the results of the simulation model, the median (IQR) of predicted QALYs for intervention and control groups were 14.10 (4.91) and 13.80 (4.27) years, while the predicted long-term costs for the two groups were 100.00 (30.20) and 69.20 (27.40) thousand CNY. The QALYs and long-term costs decreased as patients’ age grew. In addition, in each age subgroup, the QALYs and long-term costs of the intervention group were higher than the control group (Table 4).
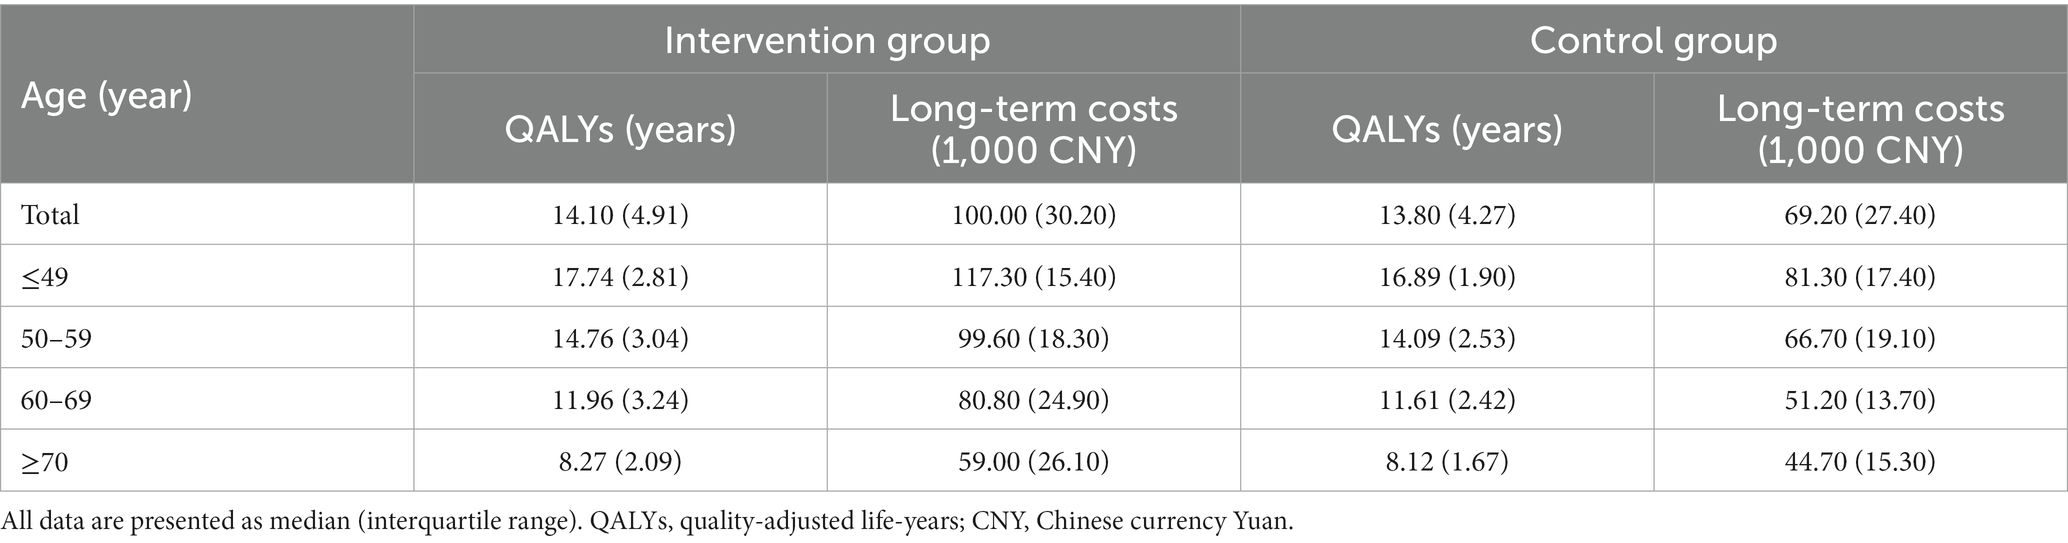
Table 4. The QALYs and long-term costs for matched intervention and control groups’ patients.
The results of cost-utility analysis
The CURs for intervention and control groups were 7.09 and 5.01 thousand CNY/QALY, leading to an ICUR of 102.67 thousand CNY/QALY. According to WHO standards, the ICUR of the intervention group was lower than three times China’s annual GDP per capita (242.93 thousand CNY), thus the intervention was considered cost-effective (Table 5).
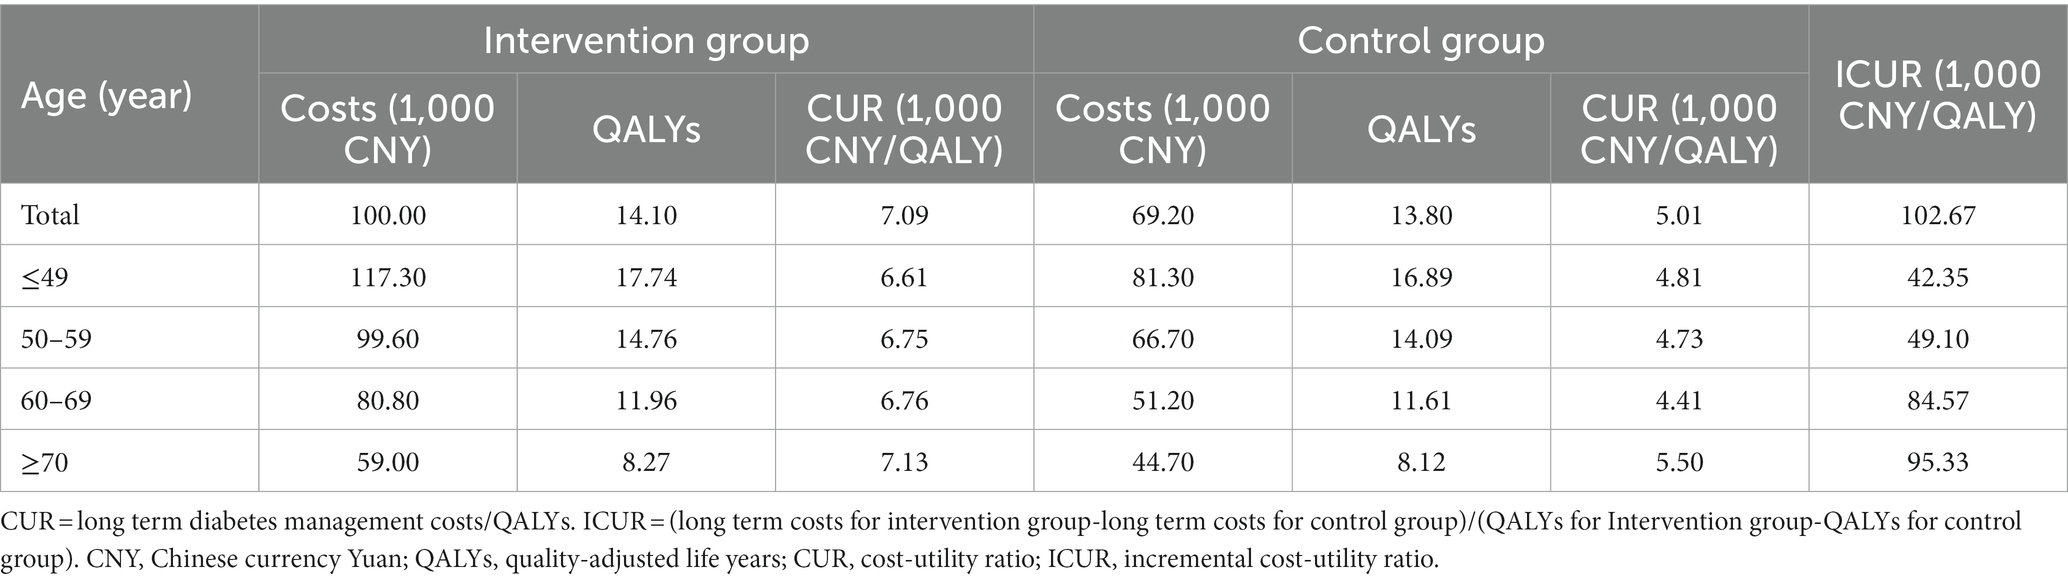
Table 5. The results of cost-utility analysis for intervention versus control group.
Subgroup analyses for different age patients were also conducted to examine the influence of age on cost-utility analysis. The results showed that for patients aged <60 years old, the ICURs for the intervention group were lower than China’s annual GDP per capita (80.98 thousand CNY), so the intervention was very cost-effective. But for patients aged ≥60 years old, the ICURs were lower than three times China’s annual GDP per capita, hence the intervention was cost-effective. Likewise, the ICUR increased as patients’ age grew (Table 5).
Discussion
In this study, we used cost-effectiveness analysis and cost-utility analysis to evaluate the short-term and long-term economic value of MMC compared to usual diabetes management. The results showed that the intervention group’s unit costs for 1% FBG, SBP, and DBP control rate improvement were lower than the control group, which demonstrated that MMC had short-term economic value. On the other side, MMC was cost-effective considering the QALYs and long-term costs it led to, indicating that MMC had long-term economic value.
Since medical resources are always limited, health economic analysis can help policymakers to decide which treatment plan should be adopted for specific patient groups considering both the efficacy and medical costs. Our study evaluated the short-term and long-term economic value of the integrated diabetes care program, as we chose the improvement of clinical control rate and the QALYs gained after the intervention as health outcomes. In addition, the study presented a real-world situation, utilizing claim datasets and clinical information systems to collect patients’ costs and clinical improvement. Moreover, patients’ efforts and time taken to seek care were also considered in the analysis, and the costs were collected from a societal perspective.
The current study found that the intervention group’s CERs for FBG, SBP, and DBP were lower than the control group, which demonstrated that MMC’s unit costs per control rate improvement were more economic compared to usual diabetes management. This result may be explained by two reasons. First, the intervention group achieved better clinical improvement after 1 year. This may due to the fact that through standardized management plans and personalized health education, MMC motivates both medical staff and patients to participate in diabetes management actively (29). Also, the collaboration between the hospitals and the PHC, as well as the coordination between nurses and doctors provide more continuous services to patients (30). Second, the 1 year total costs of the intervention group were only a bit higher than the control group. A possible explanation for this would be that by providing high-quality outpatient services, MMC reduced patients’ hospitalization requirements and costs, thus the total costs did not increase dramatically.
Another interesting finding is that considering the long-term economic value, MMC was very cost-effective among patients aged <60 years old, and was cost-effective among patients aged ≥60 years old. It may be that these patients benefitted from better clinical management efficacy and early diabetes complication detection. Patients with diabetes complications have been found to incur twice or even triple the medical costs of those without complications (31, 32). Complications also had negative impacts on patients’ life expectancies and QALYs (33). Hence, the early detection and treatment of complications not only can reduce patients’ potential treatment costs in the future, but also improve their quality of life. Our results are also in line with those of previous studies (34), and further support the evidence that interventions involving diabetes complication screening can be cost-effective. In addition, these results also demonstrated the importance of early intervention, as MMC achieved better long-term economic value in younger patients.
Our study suggested that integrated diabetes care can be cost-effective or even very cost-effective in primary healthcare settings in China. According to the People-Centered Integrated Care (PCIC) model promoted by WHO, the directions of integrated care reform should include people empowerment and engagement, care model reorientation, and service coordination (35). Through patient education and self-management support, primary care strengthening, and the coordination between primary care and specialty care, MMC followed the principles of PCIC and improved the integration level of diabetes care. Although the intensive therapy and examinations cost additional input, MMC improved patients’ clinical conditions and QALYs, and the health economic analysis showed that the input was reasonable. Therefore, this integrated diabetes care program can be promoted in China, also its elements can be referred to by other countries to build customized integrated care models.
This study has two major limitations. First, the cost-utility analysis only included patients who had all the clinical data required by the simulation model. Those patients may have higher treatment adherence or financial resources to accept more clinical examinations compared to patients with missing data, and their clinical conditions may be better. Thus, the results of the cost-utility analysis may be overestimated. Second, our study only included patients with one-year follow-up data, introducing uncertainty into the long-term cost-utility analysis. The economic value of MMC on patients with low adherence was not examined. Thus, the results may only be extrapolated to patients with regular follow-ups. Future studies can explore the economic value of health intervention for patients with low adherence, considering the intervention’s influence on patients’ costs, efficacy, and adherence.
Conclusion
In summary, MMC can be promoted in primary healthcare settings in China, since this integrated diabetes care program improved patients’ diabetes conditions and QALYs with reasonable costs. In addition, our study utilized real-world data to estimate the economic value of an intervention from both 1 year and lifetime horizons, which increased the extrapolation possibilities of the results. Countries that face similar diabetes management problems could also refer to the interventions implemented in the MMC program to build customized integrated care models.
Data availability statement
The raw data supporting the conclusions of this article will be made available by the authors, without undue reservation.
Ethics statement
The studies involving humans were approved by Medical Research Ethics Committee, School of Public Health, Fudan University. The studies were conducted in accordance with the local legislation and institutional requirements. The ethics committee/institutional review board waived the requirement of written informed consent for participation from the participants or the participants’ legal guardians/next of kin because This study used administrative data for analysis.
Author contributions
WZ, DL, and JH designed the study. WZ conducted the analysis, interpreted the data, and wrote the first draft of the manuscript. DL revised the manuscript extensively. YD managed the implementation of the intervention program. JH and YD are the guarantor of this work and, as such, had full access to all the data in the study and takes responsibility for the integrity of the data and the accuracy of the data analysis. All authors contributed to the article and approved the submitted version.
Funding
This article is supported by Grants from the Major Program of National Social Science Fund (No. 20VMG027) and Pujiang Talent Program (2020PJC015). The funder did not have any role in the study design; collection, analysis, and interpretation of the data; writing the manuscript; and decision to submit the manuscript for publication.
Conflict of interest
The authors declare that the research was conducted in the absence of any commercial or financial relationships that could be construed as a potential conflict of interest.
Supplementary material
The Supplementary material for this article can be found online at: https://www.frontiersin.org/articles/10.3389/fpubh.2023.1211671/full#supplementary-material
References
1. Songer, TJ . The role of cost-effectiveness analysis and health insurance in diabetes care. Diabetes Res Clin Pract. (2001) 54:S7–S11. doi: 10.1016/s0168-8227(01)00303-5
2. Sun, H, Saeedi, P, Karuranga, S, Pinkepank, M, Ogurtsova, K, Duncan, BB, et al. Idf diabetes atlas: global, regional and country-level diabetes prevalence estimates for 2021 and projections for 2045. Diabetes Res Clin Pract. (2022) 183:109119. doi: 10.1016/j.diabres.2021.109119
3. Bommer, C, Heesemann, E, Sagalova, V, Manne-Goehler, J, Atun, R, Bärnighausen, T, et al. The global economic burden of diabetes in adults aged 20-79 years: a cost-of-illness study. Lancet Diabetes Endocrinol. (2017) 5:423–30. doi: 10.1016/s2213-8587(17)30097-9
4. Li, X, Lu, J, Hu, S, Cheng, KK, De Maeseneer, J, Meng, Q, et al. The primary health-care system in China. Lancet. (2017) 390:2584–94. doi: 10.1016/s0140-6736(17)33109-4
5. Yin, H, Du, J, Wang, A, Men, L, Chen, Z, and An, L. Effect of National Metabolic Management Center in the Management of Diabetes (in Chinese). Chinese General Practice. (2020) 23:1928–32. doi: 10.12114/j.issn.1007-9572.2019.00.741
6. Yu, J, Shah, BM, Ip, EJ, and Chan, J. A Markov model of the cost-effectiveness of pharmacist Care for Diabetes in prevention of cardiovascular diseases: evidence from Kaiser Permanente northern California. J Manag Care Pharm. (2013) 19:102–14. doi: 10.18553/jmcp.2013.19.2.102
7. Kirsch, F . A systematic review of Markov models evaluating multicomponent disease management programs in diabetes. Expert Rev Pharmacoecon Outcomes Res. (2015) 15:961–84. doi: 10.1586/14737167.2015.1108191
8. Kaku, K, Haneda, M, Sakamaki, H, Yasui, A, Murata, T, Ustyugova, A, et al. Cost-effectiveness analysis of Empagliflozin in Japan based on results from the Asian subpopulation in the Empa-Reg outcome trial. Clin Ther. (2019) 41:40. doi: 10.1016/j.clinthera.2019.07.016
9. McRae, IS, Butler, JR, Sibthorpe, BM, Ruscoe, W, Snow, J, Rubiano, D, et al. A cost effectiveness study of integrated Care in Health Services Delivery: a diabetes program in Australia. BMC Health Serv Res. (2008) 8:205. doi: 10.1186/1472-6963-8-205
10. Men, P, Liu, T, and Zhai, S. Empagliflozin in type 2 diabetes mellitus patients with high cardiovascular risk: a model-based cost-utility analysis in China. Diabetes Metab Syndr Obes. (2020) 13:2823–31. doi: 10.2147/dmso.S266901
11. Palmer, JL, Gibbs, M, Scheijbeler, HW, Kotchie, RW, Nielsen, S, White, J, et al. Cost-effectiveness of switching to biphasic insulin Aspart in poorly-controlled type 2 diabetes patients in China. Adv Ther. (2008) 25:752–74. doi: 10.1007/s12325-008-0080-4
12. Turner, RM, Ma, Q, Lorig, K, Greenberg, J, and DeVries, AR. Evaluation of a diabetes self-management program: claims analysis on comorbid illnesses, health care utilization, and cost. J Med Internet Res. (2018) 20:e207. doi: 10.2196/jmir.9225
15. Zhejiang Provincial Health Commission . Clinical Guidance on the Community Comprehensive Prevention and Treatment and the High-Risk Group Health Management of Hypertension and Type 2 Diabetes in Zhejiang Province Zhejiang (2016) (cited 2022 Jan 2nd). Available at: http://www.cdc.zj.cn/newsinfo.php?item=77c8WmXkZkSrl[a]r4uiaqowjbd9Dl5Ad[a]Ug9iwDRbb6M0
16. Chinese Working Group on Obesity . Guidelines for the prevention and control of overweight and obesity in Chinese adults (excerpt). Acta Nutrimenta Sinica. (2004) 1:1–4.
17. Unger, T, Borghi, C, Charchar, F, Khan, NA, Poulter, NR, Prabhakaran, D, et al. 2020 International Society of Hypertension Global Hypertension Practice Guidelines. J Hypertens. (2020) 38:982–1004. doi: 10.1097/hjh.0000000000002453
18. Hayes, AJ, Leal, J, Gray, AM, Holman, RR, and Clarke, PM. Ukpds outcomes model 2: a new version of a model to simulate lifetime health outcomes of patients with type 2 diabetes mellitus using data from the 30 year United Kingdom prospective diabetes study: Ukpds 82. Diabetologia. (2013) 56:1925–33. doi: 10.1007/s00125-013-2940-y
19. Wang, X, Zhao, W, Ke, J, and Zhao, D. Comparison and analyses of therapeutic effects between metabolic management center (mmc) and conventional management modes. Acta Diabetol. (2020) 57:1049–56. doi: 10.1007/s00592-020-01518-4
20. Shi, H, Chen, N, Zhang, W, Ren, H, Xu, Y, Shen, P, et al. Evaluating and refitting the simplified equation of Mdrd to predict glomerular filtration rate in Chinese patients with chronic kidney disease (in Chinese). Chin J Pract Inter Med. (2006) 9:665–9.
21. He, X, Zhang, Y, Zhou, Y, Dong, C, and Wu, J. Direct medical costs of incident complications in patients newly diagnosed with type 2 diabetes in China. Diabetes Ther. (2021) 12:275–88. doi: 10.1007/s13300-020-00967-y
22. Lu, Q, Wang, J, Wei, X, Wang, G, Xu, Y, Lu, Z, et al. Cost of diabetic foot ulcer Management in China: a 7-year single-center retrospective review. Diabetes Metab Syndr Obes. (2020) 13:4249–60. doi: 10.2147/dmso.S275814
23. Wu, J, and Zheng, Y. Cost-effectiveness analysis of biphasic insulin Aspart 30 and premixed human insulin in Chinese patients with type 2 diabetes (in Chinese). Chin Pharm J. (2010) 45:1116–20.
24. Mok, CH, Kwok, HHY, Ng, CS, Leung, GM, and Quan, J. Health state utility values for type 2 diabetes and related complications in east and Southeast Asia: a systematic review and Meta-analysis. Value Health. (2021) 24:1059–67. doi: 10.1016/j.jval.2020.12.019
25. Shi, Z, Dong, Y, and Li, S. Health state utility values for diabetes patients in China: a systematic review and meta-analysis (in Chinese). Mod Prevent Med. (2022) 49:1091–8.
26. World Health Organization . The World Health Report 2002 – Chapter 5 (Some Strategies to Reduce Risk – Technical Considerations for Cost-Effectiveness Analysis). (2002)
27. Bertram, MY, Lauer, JA, De Joncheere, K, Edejer, T, Hutubessy, R, Kieny, MP, et al. Cost-effectiveness thresholds: pros and cons. Bull World Health Organ. (2016) 94:925–30. doi: 10.2471/blt.15.164418
28. WHO Commission on Macroeconomics Health, World Health Organization . Macroeconomics and health: investing in health for economic development: Executive summary/report of the commission on macroeconomics and health. Geneva: World Health Organization (2001)
29. Wagner, EH, Austin, BT, Davis, C, Hindmarsh, M, Schaefer, J, and Bonomi, A. Improving chronic illness care: translating evidence into action. Health Aff (Millwood). (2001) 20:64–78. doi: 10.1377/hlthaff.20.6.64
30. Karimi-Shahanjarini, A, Shakibazadeh, E, Rashidian, A, Hajimiri, K, Glenton, C, Noyes, J, et al. Barriers and facilitators to the implementation of doctor-nurse substitution strategies in primary care: a qualitative evidence synthesis. Cochrane Database Syst Rev. (2019) 4:CD010412. doi: 10.1002/14651858.CD010412.pub2
31. Hidayat, B, Ramadani, RV, Rudijanto, A, Soewondo, P, Suastika, K, and Siu Ng, JY. Direct medical cost of type 2 diabetes mellitus and its associated complications in Indonesia. Value Health Reg Issues. (2022) 28:82–9. doi: 10.1016/j.vhri.2021.04.006
32. Wu, H, Eggleston, KN, Zhong, J, Hu, R, Wang, C, Xie, K, et al. Direct medical cost of diabetes in rural China using electronic insurance claims data and diabetes management data. J Diabetes Investig. (2019) 10:531–8. doi: 10.1111/jdi.12897
33. Hayes, AJ, Leal, J, Kelman, CW, and Clarke, PM. Risk equations to predict life expectancy of people with type 2 diabetes mellitus following major complications: a study from Western Australia. Diabet Med. (2011) 28:428–35. doi: 10.1111/j.1464-5491.2010.03189.x
34. Siegel, KR, Ali, MK, Zhou, X, Ng, BP, Jawanda, S, Proia, K, et al. Cost-effectiveness of interventions to manage diabetes: has the evidence changed since 2008? Diabetes Care. (2020) 43:1557–92. doi: 10.2337/dci20-0017
Keywords: diabetes, integrated care, primary care setting, health economic analysis, real-world evidence
Citation: Liang D, Zhu W, Huang J and Dong Y (2023) A health economic analysis of an integrated diabetes care program in China: based on real-world evidence. Front. Public Health. 11:1211671. doi: 10.3389/fpubh.2023.1211671
Edited by:
Amit Sharma, Indo-Soviet Friendship College of Pharmacy, IndiaReviewed by:
Pushkar Silwal, The University of Auckland, New ZealandIvica Smokovski, Goce Delcev University, North Macedonia
Copyright © 2023 Liang, Zhu, Huang and Dong. This is an open-access article distributed under the terms of the Creative Commons Attribution License (CC BY). The use, distribution or reproduction in other forums is permitted, provided the original author(s) and the copyright owner(s) are credited and that the original publication in this journal is cited, in accordance with accepted academic practice. No use, distribution or reproduction is permitted which does not comply with these terms.
*Correspondence: Jiayan Huang, amlheWFuaHVhbmdAZnVkYW4uZWR1LmNu; Yin Dong, OTU5NzA4MkBxcS5jb20=
†These authors have contributed equally to this work