 Dramane Sam Idris Kanté
 Aissam Jebrane
 Abdelilah Hakim1
- 1LAMAI, Department of Mathematics, Faculty of Sciences and Technologies, Cadi Ayyad University, Marrakesh, Morocco
- 2Centrale Casablanca, Complex Systems and Interactions Research Center, Ville Verte, Bouskoura, Morocco
During infectious disease outbreaks, some infected individuals may spread the disease widely and amplify risks in the community. People whose daily activities bring them in close proximity to many others can unknowingly become superspreaders. The use of contact tracking based on social networks, GPS, or mobile tracking data can help to identify superspreaders and break the chain of transmission. We propose a model that aims at providing insight into risk factors of superspreading events. Here, we use a social force model to estimate the superspreading potential of individuals walking in a bidirectional corridor. First, we applied the model to identify parameters that favor exposure to an infectious person in scattered crowds. We find that low walking speed and high body mass both increase the expected number of close exposures. Panic events exacerbate the risks while social distancing reduces both the number and duration of close encounters. Further, in dense crowds, pedestrians interact more and cannot easily maintain the social distance between them. The number of exposures increases with the density of person in the corridor. The study of movements reveals that individuals walking toward the center of the corridor tend to rotate and zigzag more than those walking along the edges, and thus have higher risks of superspreading. The corridor model can be applied to designing risk reduction measures for specific high volume venues, including transit stations, stadiums, and schools.
1. Introduction
Superspreaders are infectious individuals who transmit a contagious disease to a larger number of others. Superspreading Events (SSEs) are gatherings where many people are infected at once. They were documented in various infectious diseases such as measles, rubella, monkeypox, smallpox, Ebola hemorrhagic fever, the Severe Acute Respiratory Syndrome (SARS-CoV-1) and COVID-19 (1–5). The definition of a superspreader depends on the pathogen and is often debated even for a single pathogen (6, 7). SSEs largely contribute to the growth of cases, and to counteract this growth public health strategies are adopted. The effectiveness of these strategies depends on people's risk perception and readiness to participate (8–10). This leads to a reduction of production performances and supply chain disruption (11–13). Closure of schools resulted in a learning deficit (14). Closure of services and transition to remote work deteriorated health in certain communities (15–19).
Identifying characteristics, behaviors, and situations that lead to superspreading is critical to slowing transmission and mitigating risks during emerging outbreaks (20–23). Researchers have searched for risk factors using contact tracing and viral genomic data (24). Their analysis have determined a specific viral bottleneck for SARS-CoV-2 transmission, above which individuals can be superspreaders. Some studies suggest high viral loads and high emission of aerosol particles as superspreading factors (25–27). Edwards et al. (28) showed that exhaled virus concentrations tend to increase with COVID-19 infection progression, advanced age, and higher body mass. For diseases that are transmissible via airborne particles or via fomites like SARS-CoV-1 and COVID-19, other factors include virus persistence in the environment due to humidity and temperature, and poor ventilation indoors (29–32).
Mathematical models have also provided insights into the sociological drivers of superspreading. An agent-based model of MERS-CoV transmission (33) conducted a wide monte carlo study and determined the infectiousness of individuals and the number of their contacts as the most critical factors that increase their chances of being a superspreader. Another study devised a susceptible-infectious-recovered (SIR) with spatial structure to elucidate the spatial effects of superspreaders during an epidemic (34). Their analysis suggest that superspreaders are people with many social connections. Another agent-based modeling study suggested that even limiting contacts among people who rarely meet can reduce risks of supersreading (35).
Contact tracing algorithms are extensively used to track the chain of transmission. Kojaku et al. (36) simulations on backward contact tracing on social networks suggest the prevention of a substantial growth in transmissions. Serafino et al. (37) implemented a digital contact tracing over a large Global Positioning System (GPS) data to find the quarantine strategy that breaks the chain with minimal disruption to communities. Mobile phone apps also allow to collect mobility data, however they fail to register contact in some situations (38).
In some cases, we can identify individuals who are likely to have many contacts while they are infectious. For example, children who attend school, adults who have high-contact occupations, or individuals living in congregate housing may have more frequent close encounters than others. In other cases, individuals may become superspreaders through seemingly ordinary daily activities.
Researchers have developed accurate simulations of individual pedestrian dynamics that consider the walker's age, speed, and body weight. Some of these models use cellular automata (CA) to capture the self-organizing patterns that arises within groups of walkers (39, 40). Helbing and Molnar introduced social force models, an alternative framework that uses solid mechanics to describe the movement of pedestrians (41). The movement of each pedestrian is dictated by social and psychological forces. The approach can accurately describe the movement of pedestrians in crowded settings (42–44) and in evacuation situations (45–47). Previous models are not well suited to situations where agents move in different directions and their paths cross or are opposite (48, 49). Smith et al. (50), proposed some modifications where a pedestrian is represented as three overlapping circles. The model allows to simulate avoidance of pedestrians inside concert halls and stadiums. According to Lee et al. (49), lane formation and conflicting pedestrians walking in opposite directions can be modeled using the following effect and the evasive effect. Jiang et al. (51) proposed a dynamic navigation field to describe agent desired direction in bidirectional pedestrian movement. Heliövaara et al. (48) implemented a counterflow model where the area in front of each agent is divided into three overlapping sectors. The counterflow model is formulated as an optimization problem, where each agent lying within a sector either increases or decreases the score of the sector depending on its location and moving velocity. Authors stated that these types of models produce unrealistic trajectories in sparse crowds due to the short range inside which pedestrians react to each other (48). Pedestrians cannot avoid multiple pedestrians simultaneously with these methods especially in dense crowds (52). Wang (53) modified the repulsive forces to account for agents' personal spaces and long-range interactions. Pècol et al. (54–56) have developed a discrete approach to simulate multiple simultaneous collisions. This approach uses pseudo-potentials of dissipation to model local interactions between pedestrians. It was implemented to study congestion (57) and crowd density (44). We will use the framework in Wang (53) and the discrete multiple collision model to simulate movements in sparse crowds, dense crowds, and panic situations. Recently, social force models were applied to estimate infection risks while walking (58) or traveling in an airplane (59), as well as to design optimal mitigation queues (60). We have previously used pedestrian simulation to study the impact of various non-phamarceutical interventions on COVID-19 transmission dynamics in different countries (61–63).
In this work, we use a modified social force model that is calibrated to study the superspreading potential of individuals walking in a bidirectional corridor like those found in transit stations, schools, shopping centers, and office buildings. It is important to note that our work concerns only the case of person-to-person transmission via direct contact. Hence, it is not certain that our findings necessarily apply to infectious diseases transmitted by other routes, such as airborne transmission. We run large numbers of numerical simulations to estimate the distributions of contacts that occur for a pedestrian across a range of conditions, from very low density (social distancing) to very high density (panic). We identify crowding conditions and locations within a corridor that promote superspreading and discuss strategies for mitigating these risks.
2. Materials and methods
2.1. Movement model in the absence of collisions
In the absence of contacts, regular movement of pedestrians can be described using a social force model (53). The presented microscopic pedestrian movement model has already been introduced in details in previous works (54–56). We use a framework that bring some modifications to the traditional expressions of repulsive forces in Helbing and Molnár (41). It introduces some parameters that make the model consistent, from a psychological point of view, with effects such as time-related stress and interpersonal stress: while moving in public areas, pedestrians tend to keep a certain distance between them. We represent each individual using a disk of center xi and radius ri. The used notations for model description are graphically represented in Figure 1. We describe the motion of the i-th individual using the following equation:
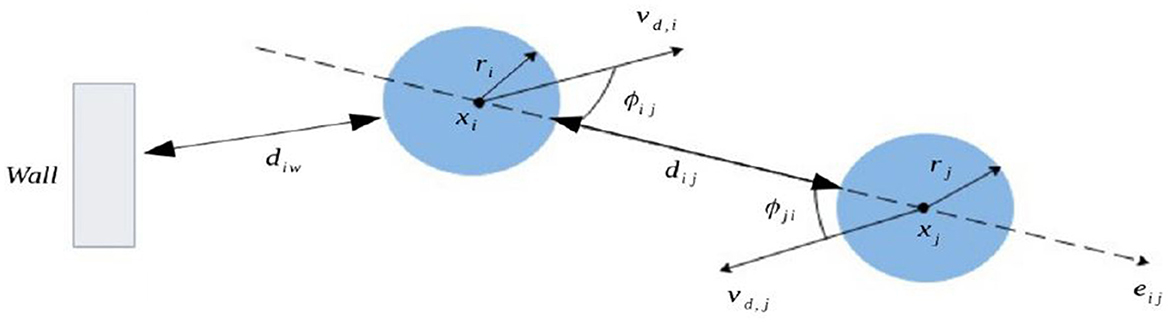
Figure 1. Schematic representation of the model parameters defining the interactions between two pedestrians described as blue disks. Each individual has a center xi and a radius ri. The distance separating the two individuals i and j is described by dij, while we denote the distance separating an individual from a wall w by diw. The desired velocity of each individual is vd, i and ϕij is the angle between the direction of the desired velocity of i and the distance between the individual i and j.
where mi is the mass of the individual, vi is their velocity, the self-driven force, that describes the adaptation of the pedestrian movement speed to a desired velocity (vd, i). It is given as follows:
The desired velocity vd, i is sampled from a normal distribution of mean vd given in Tables 1, 2, ed, i is the desired direction, τi is the needed time for the pedestrian velocity to adapt to the desired speed. Next, we introduce the social psychological force exerted by pedestrians toward others:
where is the social psychological force between the i-th and j-th individuals, given as follows:
Here Asoc represents the magnitude of the social psychological force, dij is the distance between the two pedestrians i and j, dsoc describes the distance that individuals tend to keep between them, βsoc is the falloff length of the social psychological force, while ϕij represents the angle between the desired velocity and the actual one. After that, we model the interactions between individuals and walls using the force , given as follows:
where is the interaction between the i-th individual and the wall w described as follows:
Here Aobs represents the magnitude of the psychological force between the individual and the wall, diw is the distance that separates the individual from the wall, dobs is the desired distance that each individual aims to keep between from the wall, βobs is the falloff length of the psychological force between a person and a wall, and n is a normal vector pointing from the wall to pedestrian i. We have summarized the parameters used by the model in Table 1.
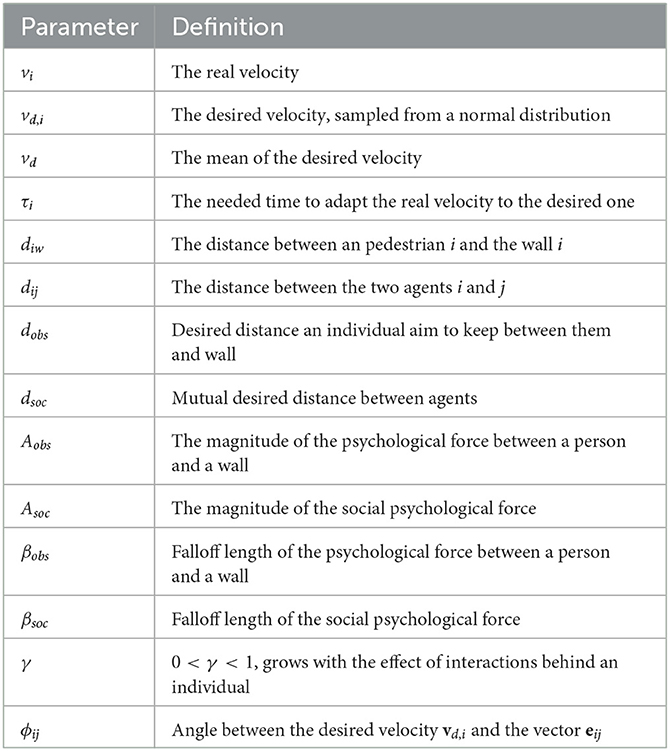
Table 1. A summary of the parameters used in the social force model and the used notations to describe them.
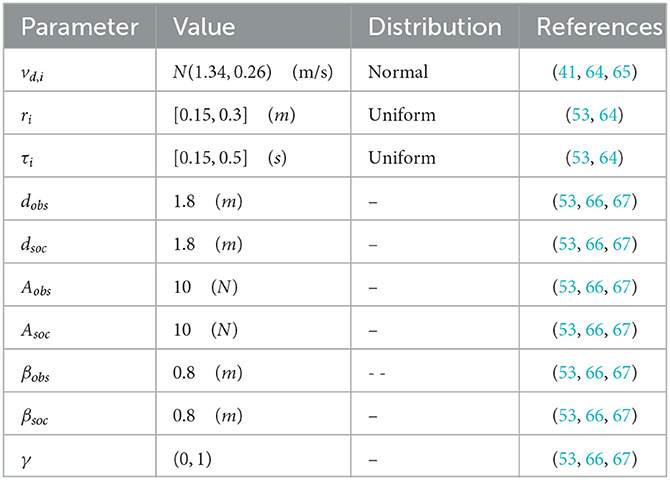
Table 2. Numerical values of model parameters in scattered crowds in absence of panic.
2.2. Collison modeling using a non-smooth microscopic approach
We use a non-smooth approach to describe the behavior of individuals during collisions. Let us consider a system of N pedestrians represented by circular disks moving in a horizontal plane each defined by a mass mi an inertia moment Ii, a radius ri, a center of gravity xi, whose position with respect to a reference system with axes x−y and origin O, is described by the vector ∈ℝ2 and a velocity denoted by . For sake of simplicity, the rotation along the z-axis has been omitted. The dynamics equations for the set of all pedestrians can be written as follows:
where M is the 2N×2N inertial matrix of the set of individuals; v− and v+ are the pedestrian's velocities before and after the collision. When a contact is detected, the velocities of colliding pedestrians become discontinuous. Therefore, Eq. 8, where the interior and exterior percussions (pint and pext respectively) are introduced, is used to calculate the velocity after the collision. By definition, percussions have the dimension of a linear momentum: a force multiplied by time (kgms−1). The pint percussions are unknown; they take into account the dissipative interactions between the colliding agents (dissipative percussions pd ) and the reaction forces that permit the avoidance of overlapping among pedestrians (reactive percussions preac ), and hence pint = pd+preac. Frémond (68, 69) defined the deformation velocity in duality with pint according to the work of internal forces, where Δv represents the vector containing all the velocities of deformation of individuals in contact. He then introduced a pseudopotential of dissipation Φ, which allows to express pint as:
where the symbol ∂ denotes the sub differential of the functional in the sense of convex analysis, which generalizes the derivative for convex functions. We recall that a pseudo-potential, in the definition by Moreau, is a non-negative convex function, which is zero for zero dissipation.
2.3. Calibration of the model parameters
Several methods were used to identify the values of physical parameters involved in social force models (70–72). For example, some previous works (70, 71) used fundamental diagram to identify these parameters. This diagram assumes a relation between the average walking speed and the density of the crowd. Analytical methods were also used for the determination of parameters. In these methods, parameters were fitted such that the movement characteristics of agents approximate those of pedestrians in organized pedestrian experiments (72) or in real situations (73). The social force model was calibrated to reproduce pedestrian behaviors in normal situations. Johansson et al. (74) estimated model parameters to analyze displacements in urban settings. Wang (53) tuned the parameters to simulate scattered crowds in normal situations. Guo et al. (75) modified the model to simulate pedestrian twice crossing behavior. Heliövaara et al. (48) used the model to study pedestrian counterflow. In this study we use the parameters estimated in Wang (53), Wang and Wang (66), and Trivedi and Pandey (67) to simulate pedestrians in scattered crowds. Values of the parameters are summarized in Table 2. Panic situations also have been extensively studied (53, 76–78). In this study, we use the parameter values determined in a previous study by comparing simulated crowd densities to the ones observed in real settings (44, 57). Panic situations are described through an elevation in the mean desired velocity and the tuning of other parameters, as reported in previous studies (79, 80). The values in Table 2 will be replaced with the estimate in (53, 76–78) to study the impact of panic.
2.4. Simulation settings
We consider a domain corresponding to a corridor of 50m×10m. This corridor has two exits which also serve as entrances for pedestrians. At the beginning of the simulation, pedestrians are placed at random locations of the computational domain, and we set their initial velocity to the mean desired velocity. We consider that half of the individuals move from left to right, while the other half move in the opposite direction. A representation of the computational domain is provided in Figure 2. In this figure, red pedestrians move from left to right (ei = (1, 0)), while blue ones walk in the opposite direction (ei = (−1, 0)). We consider that simulations last for 10 minutes and 30 seconds. We apply periodic boundary conditions at the two exits to keep the same number of pedestrians during the course of simulations: whenever a pedestrian crosses one of the two exits, they are replaced by another one that has the same mass and speed at a random location on the opposite entrance. We begin our investigation by considering a scattered crowd consisting of 30 individuals, such that the density is equal to 0.06 p/m2. Then, we increase the number of individuals to study the movement of pedestrians in crowded settings. We estimate the characteristics of individuals belonging to two groups: those with a high number of interactions, defined as pedestrians who are responsible for making more contacts than 80 % of the maximal contact number per individual, and those with a low number of interactions, corresponding to pedestrians with a number of contacts lower than 20 % of the maximal contact number per individual in the population.
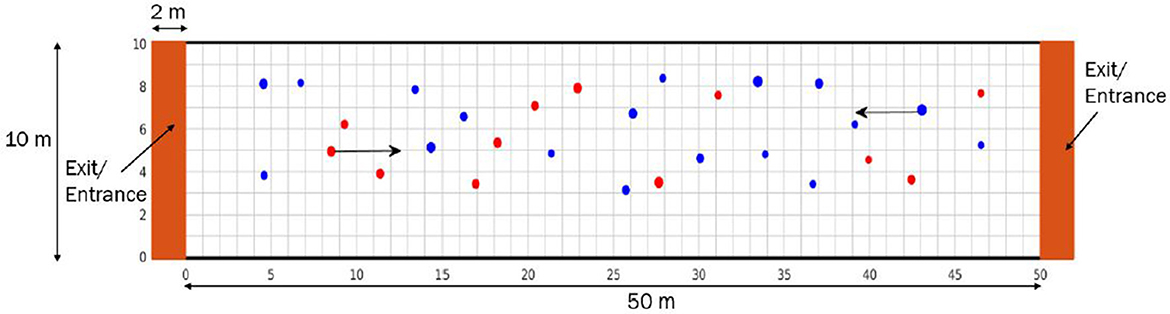
Figure 2. A representation of the domain where numerical simulations are taking place. It corresponds to a bidirectional corridor with two entrances/exits. Red disks represent individuals moving from the left to the right, while blue ones correspond to pedestrians walking from the right to the left. The size of each disk is proportional to the mass of the corresponding individual.
3. Results
3.1. Dynamics of potential superspreaders in scattered crowds
In this section, we study the characteristics of individuals with a higher number of contacts who can be potential superspreaders. We consider a small population consisting of 30 pedestrians and investigate the effect compliance to social-distance and walking during panic situations on the prevalence of potential superspreaders.
3.1.1. Potential superspreaders have a high body mass and a lower average walking speed
We begin by applying the model to determine the characteristics of potential superspreaders in a heterogeneous population. To achieve this, we consider a population of pedestrians with randomly sampled weights and means of the desired velocity. We sample the mean of the desired speed for each pedestrian in the range [0.5, 2.3] m/s using a uniform distribution. This situation corresponds to a crowd where some individuals are in a hurry while others walk slower than the average.
We study the relationship between body mass and the chances of being a superspreader. We estimate the body mass of each pedestrian from their radius using the formula , where ω = 500kg/m2 (57). The pedestrian radi are sampled from a uniform distribution such that the body mass of individuals falls between 35.3 and 141.4 kg. Data analysis shows that potential superspreaders have an average body mass of 86 kg, which is 21 % higher than the average body mass of the population (71 kg).
The analysis of the obtained data shows that potential superspreaders have a lower desired velocity on average (1.18 m/s). In comparison, individuals with fewer contacts tend to have a higher desired walking velocity (average vd is 1.48 m/s).
3.1.2. High compliance with physical distancing prevents superspreading
We vary the amplitude of the physical psychological force (Asoc) to describe the compliance of individuals to physical distancing. If the value of this amplitude is high, then the individuals tend to keep the desired social distance (dsoc) between them. We track the contacts between individuals and calculate the total number of contacts for each individual. We set the average desired velocity for all pedestrians to its normal value vd = 1.34m/s. We conduct systemic numerical simulations for different values of Asoc, and we evaluate the distribution of the total number of contacts for each value (Figure 3A). To minimize the effect of stochastic noises, we consider the average results of 30 simulations of each Asoc. The obtained data show a bimodal distribution with two peaks when compliance to physical distancing is very low, with the first peak in zero and the other between 12 and 14 contacts. As we slightly increase compliance with physical distancing, we obtain a unimodal distribution whose peak decreases as we keep increasing the value of Asoc. These dynamics suggest that a significant portion of the population could be potential superspreaders if physical distancing is not fully adopted. When adherence to physical distancing is high, most pedestrians would have a low number of contacts. These findings suggest that strong compliance with physical distancing is necessary to prevent superspreading in scattered crowds. Table 3 summarizes the range of contacts made by the highest number of individuals for different values of Asoc. It shows that this range decreases from [12, 14] for Asoc = 10N to [0, 2] for Asoc = 340N. These results demonstrate the important of compliance to physical distancing in not only preventing superspreading, but also reducing the overall risk of disease spread.
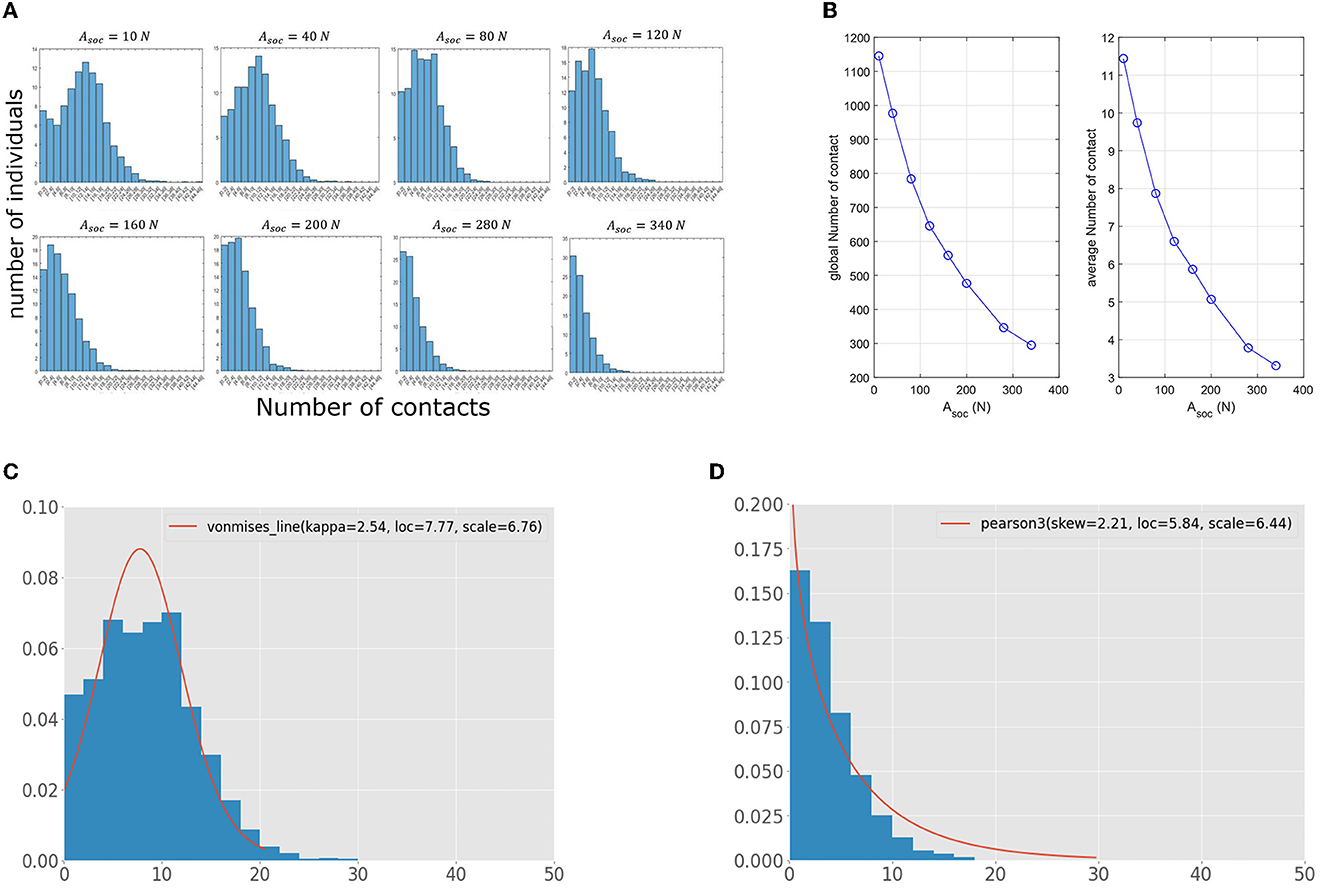
Figure 3. (A) Impact of compliance to physical distancing on the distribution of contacts among the pedestrians. The results correspond to the average of 30 numerical simulations for each value. (B) The total and average numbers of contacts for different values of Asoc. (C) Contact distribution for Asoc = 80N, fitted to a von Mises distribution. (D) Contact distribution for high compliance to social-distancing (Asoc = 340N) fitted with a Pearson distribution.
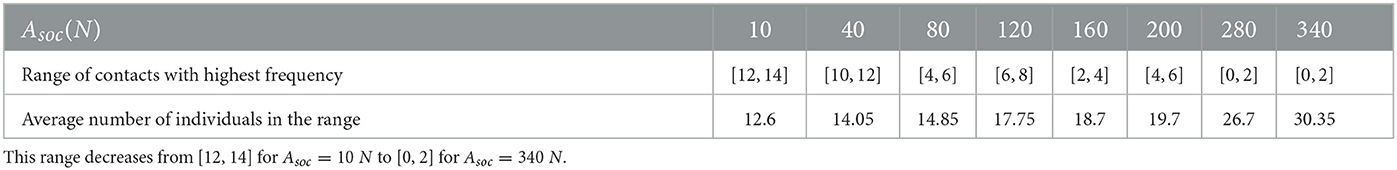
Table 3. For each value of Asoc, we display the interval in which most individuals' number of contacts falls and the corresponding number of individuals.
Next, we evaluate the impact of compliance to physical distancing on the contact patterns in the population. Figure 3B shows that both the total and the average numbers of contacts significantly drop when the compliance with physical distancing increases. These findings suggest that the overall risk of disease transmission greatly diminishes when pedestrians abide by physical distancing. To further analyze the effect of Asoc on the distribution of the total number of contacts, we fit the obtained distributions for contacts with the 101 probabilistic distributions available in the stats module of the python library Scipy (81). The best distribution that fits the distribution for low compliance to physical distancing (Asoc = 80N) is the von Mises one (Figure 3C), while it is possible to fit data for high compliance level using a Pearson distribution (Figure 3D).
3.1.3. Panic situations increase the relative prevalence of potential superspreaders
Next, we investigate the impact of panic situations on the contact dynamics of the crowds. Panic situations increase the mean desired velocity of pedestrians as shown in a previous work (79). Furthermore, they also change the behavior of pedestrians while walking. To account for these effects, we modify the values of the model as it was done in a previous study (79). In particular, we set the value of Asoc to 2000N and we vary the mean of the desired velocity for all pedestrians in the range of [0.5m/s, 2.3m/s]. Other changes introduced to the parameter values are described in Table 4. Changes in the parameter values were introduced to simulate the tendency of individuals to avoid others while walking under panic.
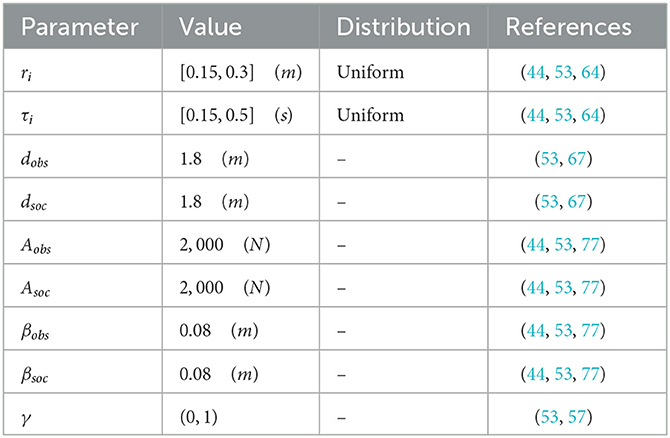
Table 4. Numerical values of the parameters used to simulate pedestrian movement under panic and in dense crowds.
As before, we track the contacts between pedestrians and analyze the contact distribution in the population. Figure 4A shows the distribution of contacts among pedestrians for different values of the desired velocity. These distributions show that the prevalence of individuals who make a higher number of contacts tend to increase when the mean desired velocity of pedestrians grows. In Figure 4B, we provide the average and the total contact numbers as a function of vd. The obtained results not only confirm that panic situations increase the prevalence of potential supereaders but also elevates the individual risk of getting infected. To further investigate this last point, we determine the ranges of contact that have the highest frequency for different desired velocity means and the corresponding average number of individuals (Table 5). The obtained results show that panic situations increase this range from [2, 8] to [8, 10].
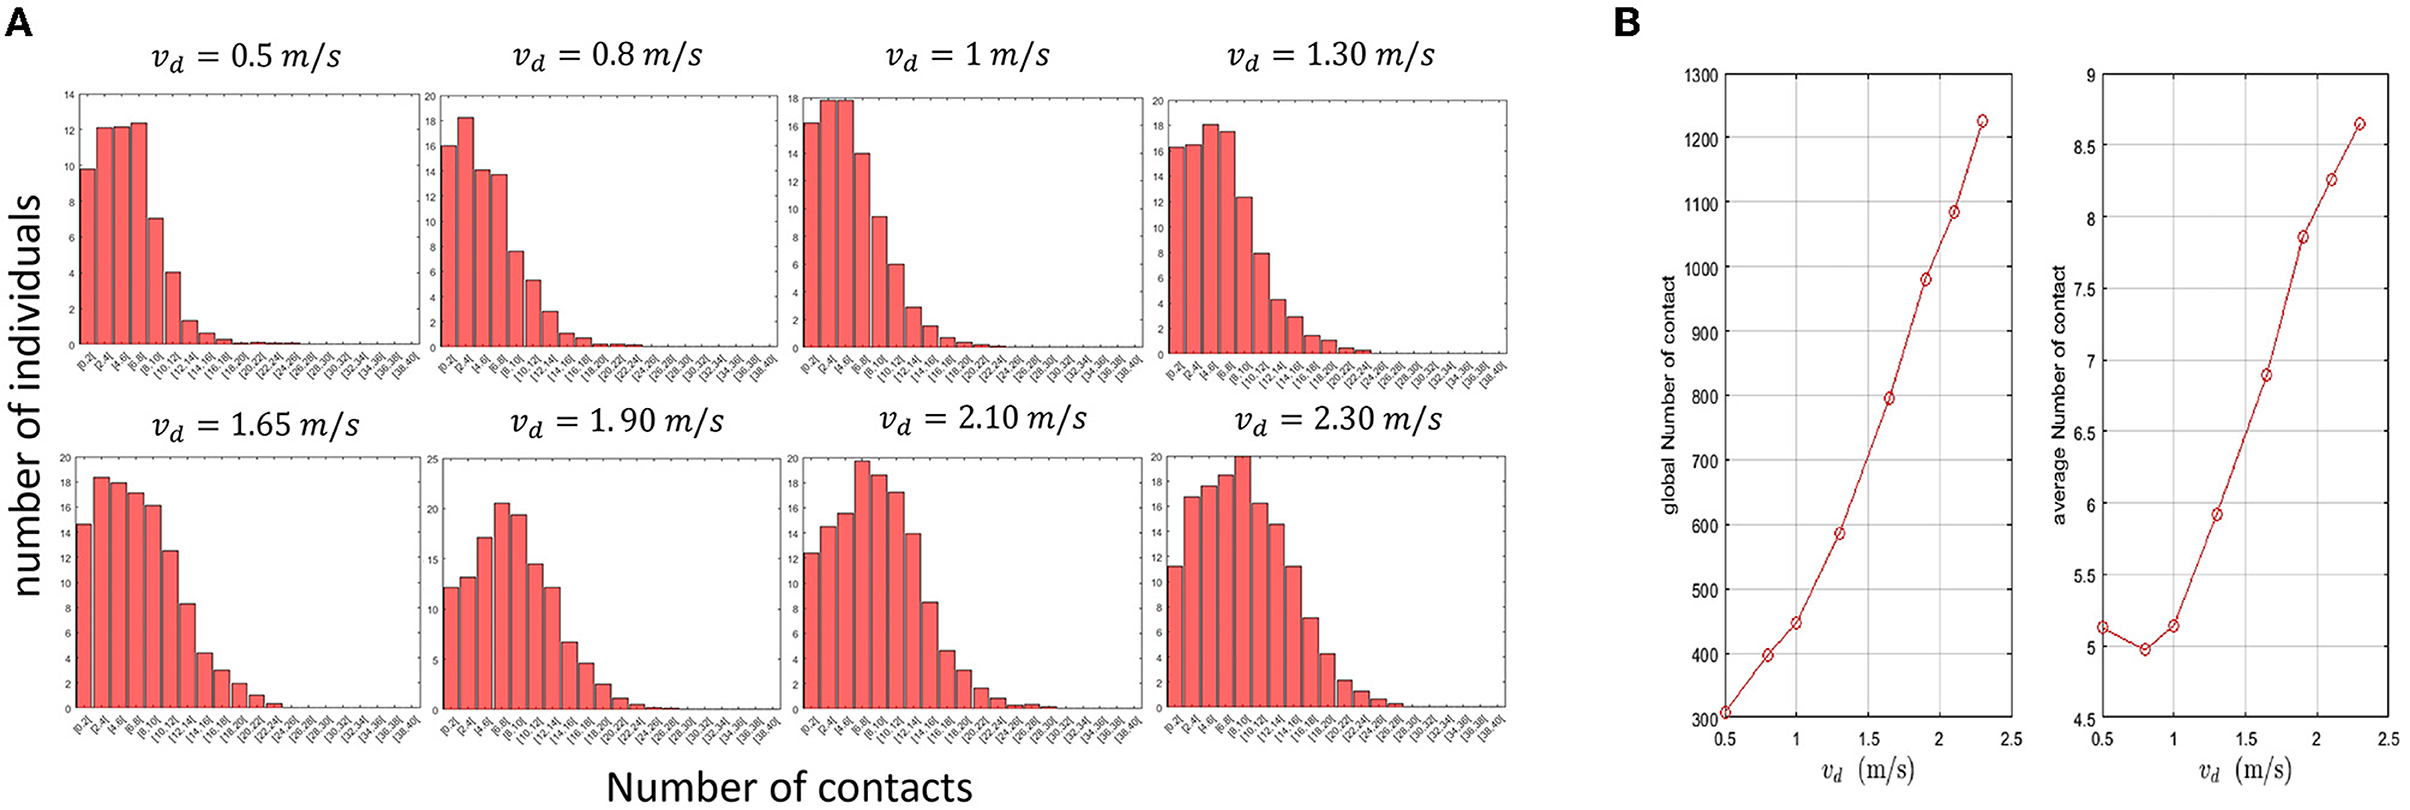
Figure 4. (A) Impact of changes in the desired velocity induced by panic situations on the distribution of contacts. (B) The total and the average contact numbers in the population for different values of the mean desired velocity (vd).
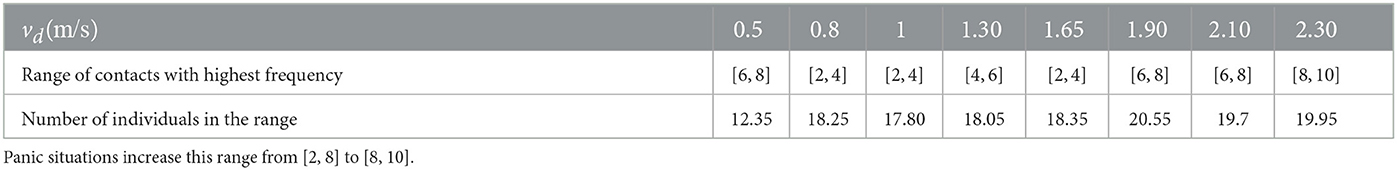
Table 5. For each value of vd, we display the interval in which most individuals' number of contacts falls and the corresponding number of individuals.
3.1.4. Physical distancing reduces the contact duration with superspreaders while panic situations increase it
Another aspect that can be explored using our model is the variations in the duration of contacts. Contact duration increases the chances of disease transmission. We study the average contact duration of two population subtypes: individuals who have a high contact frequency, corresponding to those who have more interactions than 80% of the maximal contact number per individual, and individuals with a low contact frequency, i.e., those whose contact number is below 20% of the maximal value. Our analysis reveals that individuals with a higher number of contacts tend to interact with other pedestrians for a shorter time, regardless of their compliance level to physical distancing or the mean desired velocity (Figure 5). The only exception to this rule is when the compliance to physical distancing is very low (Asoc ≤ 40N). In this case, pedestrians with a higher contact rate tend to stay in touch with others for a longer time. Another important finding is that compliance to physical distancing not only reduces the relative prevalence of potential superspreaders, but also their average contact duration. In contrast, panic situations increase both their prevalence and their average contact duration.
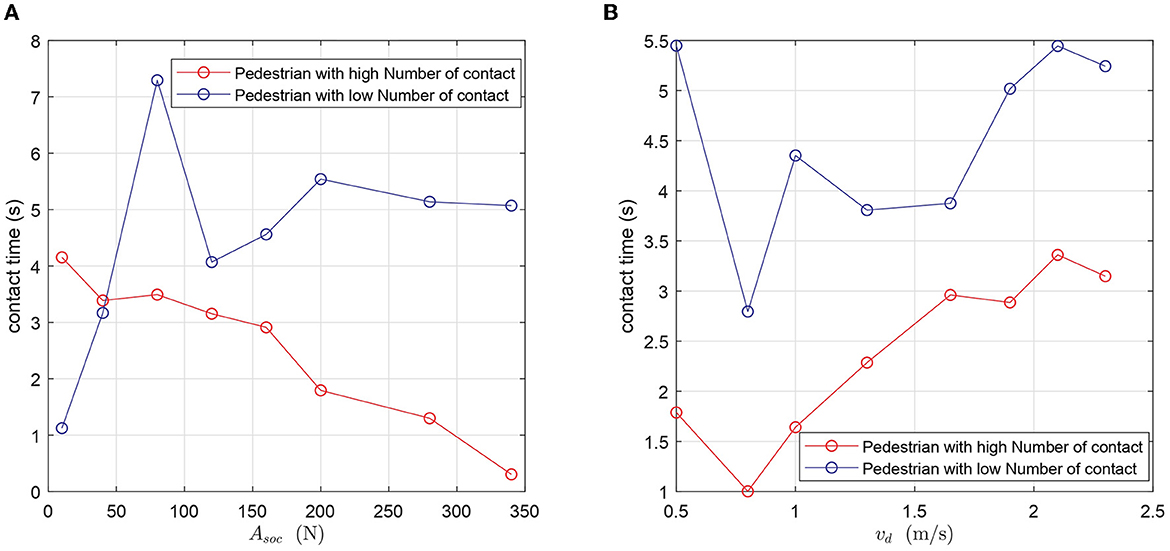
Figure 5. Comparison of the duration of contacts of a pedestrian with a high number of contacts and a pedestrian with a low number of contacts. (A) The average duration of contacts as a function of the compliance level to physical distancing. (B) The average duration of contacts as a function of the mean desired velocity.
3.2. Movement characteristics of potential superspreaders in dense areas
After studying the dynamics of superspreading in scattered crowds, we investigate their characteristics in dense populations. Pedestrians interact more in dense crowds and cannot easily maintain the social distance between them. We quantify the impact of crowd density on the interactions between individuals by varying the number of pedestrians in simulations such that we consider four density values: 0.8 p/m2, 1.386 p/m2, 1.82 p/m2, and 2.72 p/m2. Results of numerical simulations suggest that when density grows, the average number of contacts increases, as shown in Figure 6A.
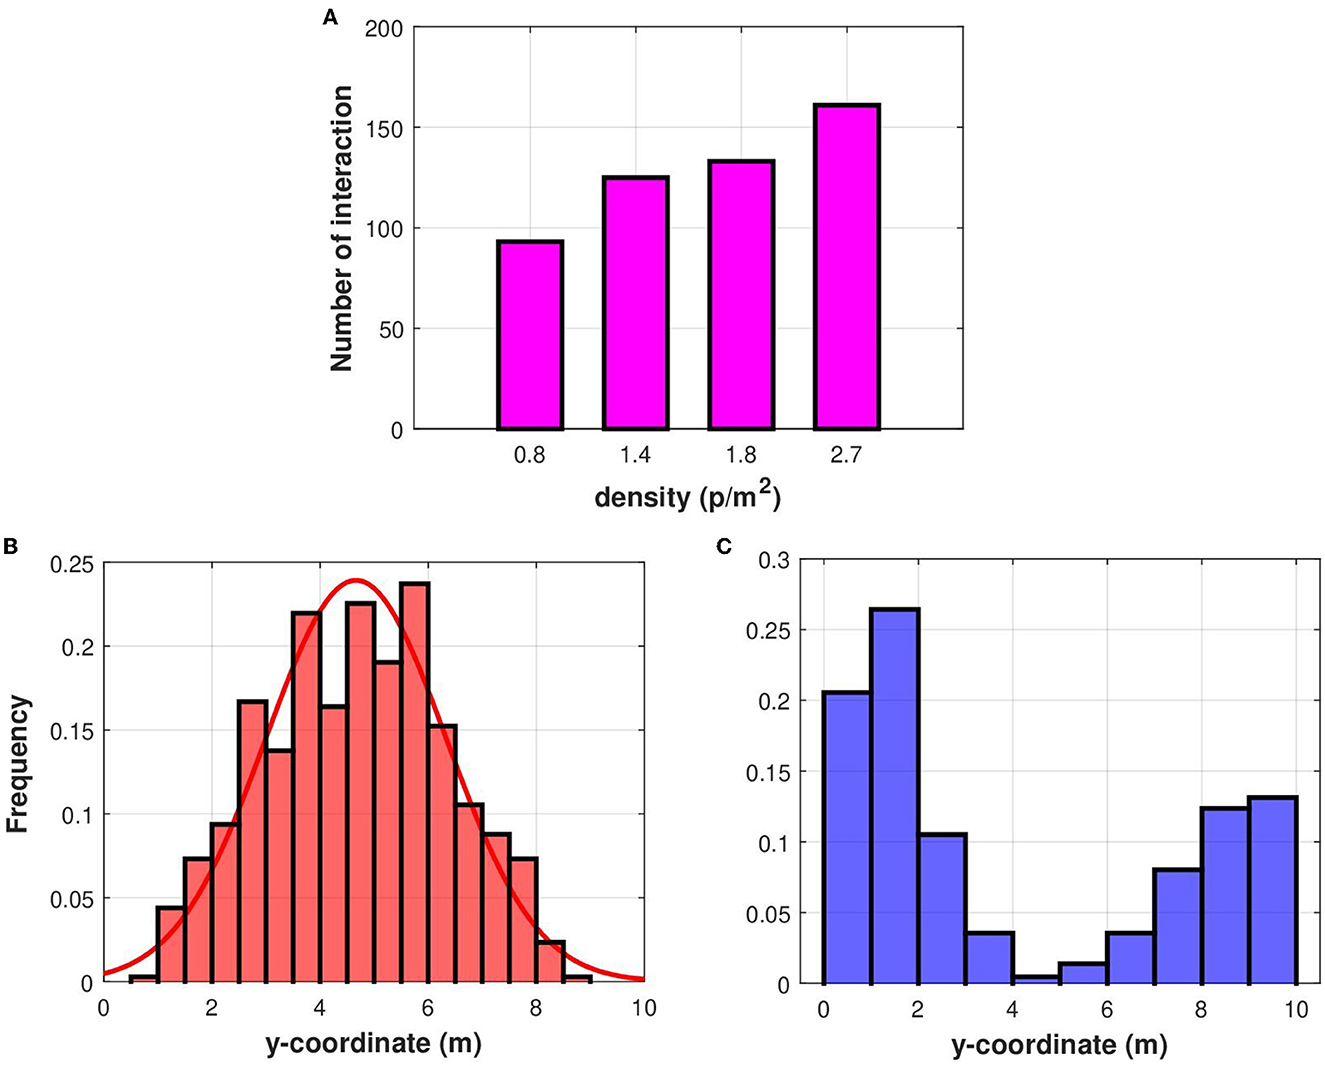
Figure 6. (A) A comparison between the average number of contacts for different crowd densities. We also investigate potential superspreaders position in the corridor where the y-coordinate varies from 0 to 10 m and the x-coordinate varies from 0 to 50 m. (B) The distribution of the average y-coordinate of potential superspreaders in crowded settings. (C) The distribution of the average y-coordinate of pedestrians with a lower number of contacts in a dense crowd.
3.2.1. The density of potential superspreaders increases toward the center of the corridor in dense crowds
We continue our investigation by looking at the locations of potential superspreaders. To achieve this, we calculate the average y-coordinate for individuals with a high number of interactions. As before, we define potential superspreaders as pedestrians with more contacts than 80 % of the highest contact numbers, while we refer to individuals with low contact numbers as those whose contact number is lower than 20 % of the maximal contact number. The analysis of results from numerical simulations reveals that the concentration of superspreaders increase toward the center of the corridor (Figure 6B), while pedestrians with a low number of contacts can be encountered near the walls (Figure 6C). The frequency of the average y-coordinate of superspreaders can be approximated using a normal distribution as shown in Figure 6B. These results suggest that walking near the corridor walls would minimize the overall risk of infection when crowd density is high.
3.2.2. Superspreaders tend to rotate more while walking in crowds
The trajectories of pedestrians is another feature that can be analyzed using our modeling framework. We compare the movement patterns of potential superspreaders and individuals who have a low number of contacts. A qualitative comparison of the movement trajectories shows that while individuals with a lower contact number walk in a more straight line, those who have a high number of contacts tend to rotate more frequently while walking in crowded areas (Figure 7). These findings apply both in scattered and dense crowds. Thus, potential superspreaders usually walk in zigzag patterns and change the direction of their movement more often. The trajectories of individuals can be used as training data for a classification algorithm that aims to detect potential superspreaders in crowds from real-time images.
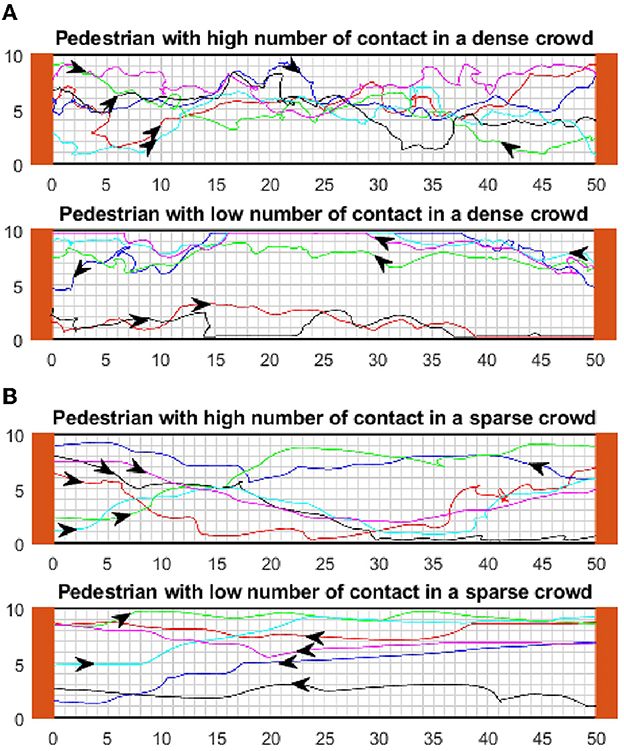
Figure 7. Comparison of trajectories in both dense and scattered crowds. (A) Examples of the trajectory of individuals with a high number of contacts. (B) Examples of the trajectory of individuals with a low number of contacts.
4. Discussion
Superspreaders play a critical role in promoting and sustaining the spread of infectious diseases (82, 83). As a result, the isolation of superspreaders and the prevention of superspreading can significantly curb the spread of infectious diseases (84). In this work, we have devised a social force model to study the movement characteristics of superspreaders in a bidirectional corridor. One feature of superspreaders is that they tend to have more contacts than average (23, 33, 35). We have focused our present study on these individuals who make a higher number of contacts to be able to interpret the results. Indeed, our findings are more appropriate for diseases that transmit through direct contact with infectious individuals and may not necessarily apply to pathogens that transmit through other routes such as airborne transmission. To study this latter case, we have recently extended the social force framework to include a transmission model that describes the spatial aerosol concentration and the individual risk of infection (85).
The data obtained with our simulations show that potential superspreaders have high body mass and low desired velocities. Since there exist a correlation between advanced age and slower walking speed (86), our results suggest that older people are more prone to be superspreaders. Another previously published study showed an association between severe COVID-19 outcomes and slower walking speed (87). One possible explanation for that is that slower walking people tend to accumulate a higher viral inoculum by getting in contact with more than one infectious individual (88). A prior study identified both advanced age and a higher body mass as risk factors for superspreading, and attributed the finding to elevated concentrations of aerosalized virus in these groups (28). Our analysis suggests an alternative explanation, as both of these characteristics are significantly correlated with elevated contact rates while walking. The social force model can be used to explain this by stating that as mass increases, the magnitude of the repulsive force (or socio-psychological force) weakens and agents are no longer able to maintain a suitable social distance from one another. For COVID-19 and several other viruses, these also happen to be risk factors for severe outcomes (35). During periods of high transmission, precautionary measures such as face masks and social distancing may protect these individuals as well as those around them. We also found that the risk of infection and transmission may correlate with where an individual walks within a corridor. In sparse crowds, superspreaders are distributed evenly across the width of the corridor. In dense crowds, however, they tend to occupy the center of the corridor.
Most of the parameters in social force model have an intuitive physical explanation, which allows us to model sociological phenomena like social distancing and panic events. We find that compliance with physical distancing recommendations reduces both the number and duration of close encounters while walking. This is consistent with prior contact tracing studies (89, 90) and highlights the importance of clear and compelling communication when such measures are warranted, including signage, directional markers, and barriers. Panic events exacerbate risks, increasing the rate of contacts and prevalence of potential superspreaders. Panic may arise during alarming events, in the absence of effective communications and organization. For example, the threat of natural disasters can lead to panic buying, where individuals to rush to stores and form dense crowds in the corridors (91).
We propose an idea to gain insight into superspreading risk factors in a corridor which can be found in transit stations, schools, shopping malls etc. The perspectives of this study are the followings:
• The social force model can be readily calibrated to measure and mitigate superspreading risks in particular crowded settings, such as residences, workplaces, schools, and other public areas.
• The model allowed us to simulate pedestrian movements and interactions, however there are variations of the social force model that account for waiting pedestrians (92) as seen in train stations, and group behavior (93, 94). Other variations could also be used to estimate the risk of infection and study superspreading in specific evacuation scenarios (94).
• Moreover, this method can also be used to estimate contact patterns in different social contexts. It allows to estimate the effect of social distancing, which is lacking in traditional contact matrix estimation methods.
5. Conclusion
Based on the social force model, this article proposes a new method for preventing superspreading events and applies the method to study the different factors favoring these events in a corridor. The results show that characteristics such as low walking speed and high body mass increase an individual's risk of exposure. In addition, situations like panic and dense crowds favor superspreading events. The analysis of the movements in the corridor show that the risk of superspreading is much greater in the center of the corridor than along the edges. Finally, we note several limitations of the analysis. Although social force model accurately captures pedestrian movement in dense crowds, it has not yet been validated for crowds across multiple parameter spaces for movement characteristics. The validation of social force models is usually done through comparison with specific settings, where the movement speed and social psychological force are pre-determined. Further, one study suggests that social force models may be unrealistic for some pedestrians when crowd density is varied (95). Another issue is that people do not always behave according to the assumptions of social force models (96). For example, some individuals tend to be unsure about their movement trajectories while others seem to be in a rush. However, we sought to roughly estimate risks of superspreading and identify potential risk factors rather than accurately predict the movement of individual pedestrians. The presented framework can help prevent superspreading during high mass gatherings in different social contexts.
Data availability statement
The raw data supporting the conclusions of this article will be made available by the authors, without undue reservation.
Author contributions
DK, AJ, and AH contributed to conception and design of the study. DK and AJ organized the database and implemented the computer code. DK wrote the first draft of the manuscript. AJ, AH, and AB revised the manuscript. AB supervised the project. All authors have read and approved the submitted version.
Funding
This work is funded by a grant from the Hassan II Academy of Science and Technology of Morocco for the fight against epidemics.
Conflict of interest
The authors declare that the research was conducted in the absence of any commercial or financial relationships that could be construed as a potential conflict of interest.
Publisher's note
All claims expressed in this article are solely those of the authors and do not necessarily represent those of their affiliated organizations, or those of the publisher, the editors and the reviewers. Any product that may be evaluated in this article, or claim that may be made by its manufacturer, is not guaranteed or endorsed by the publisher.
References
1. Mohindra R, Ghai A, Brar R, Khandelwal N, Biswal M, Suri V, et al. Superspreaders: a lurking danger in the community. J Prim Care Community Health. (2021) 12:2150132720987432. doi: 10.1177/2150132720987432
2. Paunio M, Peltola H, Valle M, Davidkin I, Virtanen M, Heinonen OP. Explosive school-based measles outbreak: intense exposure may have resulted in high risk, even among revaccinees. Am J Epidemiol. (1998) 148:1103–10. doi: 10.1093/oxfordjournals.aje.a009588
3. Khan AS, Tshioko FK, Heymann DL, Le Guenno B, Nabeth P, Kerstiëns B, et al. The reemergence of Ebola hemorrhagic fever, Democratic Republic of the Congo, 1995. J Infect Dis. (1999) 179(Supplement_1):S76–86. doi: 10.1086/514306
5. Liu Y, Eggo RM, Kucharski AJ. Secondary attack rate and superspreading events for SARS-CoV-2. Lancet. (2020) 395:e47. doi: 10.1016/S0140-6736(20)30462-1
6. Zhang Y, Li Y, Wang L, Li M, Zhou X. Evaluating transmission heterogeneity and super-spreading event of COVID-19 in a metropolis of China. Int J Environ Res Public Health. (2020) 17:3705. doi: 10.3390/ijerph17103705
7. Xu XK, Liu XF, Wu Y, Ali ST, Du Z, Bosetti P, et al. Reconstruction of transmission pairs for novel coronavirus disease 2019 (COVID-19) in mainland China: estimation of superspreading events, serial interval, and hazard of infection. Clin Infect Dis. (2020) 71:3163–7. doi: 10.1093/cid/ciaa790
8. Khorram-Manesh A, Dulebenets MA, Goniewicz K. Implementing public health strategies—the need for educational initiatives: a systematic review. Int J Environ Res Public Health. (2021) 18:5888. doi: 10.3390/ijerph18115888
9. Yuan J, Zou H, Xie K, Dulebenets MA. An assessment of social distancing obedience behavior during the COVID-19 post-epidemic period in China: a cross-sectional survey. Sustainability. (2021) 13:8091. doi: 10.3390/su13148091
10. Siegrist M, Luchsinger L, Bearth A. The impact of trust and risk perception on the acceptance of measures to reduce COVID-19 cases. Risk Anal. (2021) 41:787–800. doi: 10.1111/risa.13675
11. Moosavi J, Fathollahi-Fard AM, Dulebenets MA. Supply chain disruption during the COVID-19 pandemic: recognizing potential disruption management strategies. Int J Disaster Risk Reduct. (2022) 75:102983. doi: 10.1016/j.ijdrr.2022.102983
12. Swanson D, Santamaria L. Pandemic supply chain research: a structured literature review and bibliometric network analysis. Logistics. (2021) 5:7. doi: 10.3390/logistics5010007
13. Pujawan IN, Bah AU. Supply chains under COVID-19 disruptions: literature review and research agenda. Supply Chain Forum. (2022) 23:81–95. doi: 10.1080/16258312.2021.1932568
14. Betthäuser BA, Bach-Mortensen AM, Engzell P. A systematic review and meta-analysis of the evidence on learning during the COVID-19 pandemic. Nat Hum Behav. (2023) 7:375–85. doi: 10.1038/s41562-022-01506-4
15. Carbone SR. Flattening the curve of mental ill-health: the importance of primary prevention in managing the mental health impacts of COVID-19. Ment Health Prev. (2020) 19:200185. doi: 10.1016/j.mhp.2020.200185
16. Proto E, Quintana-Domeque C. COVID-19 and mental health deterioration by ethnicity and gender in the UK. PLoS ONE. (2021) 16:1–16. doi: 10.1371/journal.pone.0244419
17. Schwartz Tayri TM. On the frontlines: the impact of the COVID-19 pandemic on social workers' well-being. Soc Work. (2023) 68:69–80. doi: 10.1093/sw/swac050
18. Beland LP, Brodeur A, Wright T. The short-term economic consequences of COVID-19: exposure to disease, remote work and government response. PLoS ONE. (2023) 18:1–32. doi: 10.1371/journal.pone.0270341
19. Fan W, Moen P. Ongoing Remote work, returning to working at work, or in between during COVID-19: what promotes subjective well-being? J Health Soc Behav. (2023) 64:152–71. doi: 10.1177/00221465221150283
20. Adam DC, Wu P, Wong JY, Lau EHY, Tsang TK, Cauchemez S, et al. Clustering and superspreading potential of severe acute respiratory syndrome coronavirus 2 (SARS-CoV-2) infections in Hong Kong. Nat Med. (2020) 26:1714–9. doi: 10.1038/s41591-020-1092-0
21. Hasan A, Susanto H, Kasim MF, Nuraini N, Lestari B, Triany D, et al. Superspreading in early transmissions of COVID-19 in Indonesia. Sci Rep. (2020) 10:1–4. doi: 10.1038/s41598-020-79352-5
22. Li YK, Peng S, Li LQ, Wang Q, Ping W, Zhang N, et al. Clinical and transmission characteristics of COVID-19—a retrospective study of 25 cases from a single thoracic surgery department. Curr Med Sci. (2020) 40:295–300. doi: 10.1007/s11596-020-2176-2
23. Althouse BM, Wenger EA, Miller JC, Scarpino SV, Allard A, Hébert-Dufresne L, et al. Superspreading events in the transmission dynamics of SARS-CoV-2: opportunities for interventions and control. PLoS Biol. (2020) 18:1–13. doi: 10.1371/journal.pbio.3000897
24. Popa A, Genger JW, Nicholson MD, Penz T, Schmid D, Aberle SW, et al. Genomic epidemiology of superspreading events in Austria reveals mutational dynamics and transmission properties of SARS-CoV-2. Sci Transl Med. (2020) 12:eabe2555. doi: 10.1126/scitranslmed.abe2555
25. Asadi S, Wexler AS, Cappa CD, Barreda S, Bouvier NM, Ristenpart WD. Aerosol emission and superemission during human speech increase with voice loudness. Sci Rep. (2019) 9:1–10. doi: 10.1038/s41598-019-38808-z
26. Avadhanula V, Nicholson EG, Ferlic-Stark L, Piedra FA, Blunck BN, Fragoso S, et al. Viral load of severe acute respiratory syndrome coronavirus 2 in adults during the first and second wave of coronavirus disease 2019 pandemic in Houston, Texas: the potential of the superspreader. J Infect Dis. (2021) 223:1528–37. doi: 10.1093/infdis/jiab097
27. Jolly B, Scaria V. A distinct phylogenetic cluster of Monkeypox genomes suggests an early and cryptic spread of the virus. J Infect. (2023) 86:e24–6. doi: 10.1016/j.jinf.2022.08.013
28. Edwards DA, Ausiello D, Salzman J, Devlin T, Langer R, Beddingfield BJ, et al. Exhaled aerosol increases with COVID-19 infection, age, and obesity. Proc Nat Acad Sci. (2021) 118:e2021830118. doi: 10.1073/pnas.2021830118
29. Chan KH, Peiris JM, Lam S, Poon L, Yuen K, Seto WH. The effects of temperature and relative humidity on the viability of the SARS coronavirus. Adv Virol. (2011) 2011:734690. doi: 10.1155/2011/734690
30. Van Doremalen N, Bushmaker T, Morris DH, Holbrook MG, Gamble A, Williamson BN, et al. Aerosol and surface stability of SARS-CoV-2 as compared with SARS-CoV-1. N Engl J Med. (2020) 382:1564–7. doi: 10.1056/NEJMc2004973
31. Peng Z, Rojas AP, Kropff E, Bahnfleth W, Buonanno G, Dancer SJ, et al. Practical indicators for risk of airborne transmission in shared indoor environments and their application to COVID-19 outbreaks. Environ Sci Technol. (2022) 56:1125–37. doi: 10.1021/acs.est.1c06531
32. Ou C, Hu S, Luo K, Yang H, Hang J, Cheng P, et al. Insufficient ventilation led to a probable long-range airborne transmission of SARS-CoV-2 on two buses. Build Environ. (2022) 207:108414. doi: 10.1016/j.buildenv.2021.108414
33. Kim Y, Ryu H, Lee S. Agent-based modeling for super-spreading events: a case study of MERS-CoV transmission dynamics in the Republic of Korea. Int J Environ Res Public Health. (2018) 15:2369. doi: 10.3390/ijerph15112369
34. Fujie R, Odagaki T. Effects of superspreaders in spread of epidemic. Physica A. (2007) 374:843–52. doi: 10.1016/j.physa.2006.08.050
35. Sneppen K, Nielsen BF, Taylor RJ, Simonsen L. Overdispersion in COVID-19 increases the effectiveness of limiting nonrepetitive contacts for transmission control. Proc Nat Acad Sci. (2021) 118:e2016623118. doi: 10.1073/pnas.2016623118
36. Kojaku S, Hébert-Dufresne L, Mones E, Lehmann S, Ahn YY. The effectiveness of backward contact tracing in networks. Nat Phys. (2021) 17:652–8. doi: 10.1038/s41567-021-01187-2
37. Serafino M, Monteiro HS, Luo S, Reis SDS, Igual C, Lima Neto AS, et al. Digital contact tracing and network theory to stop the spread of COVID-19 using big-data on human mobility geolocalization. PLoS Comput Biol. (2022) 18:1–17. doi: 10.1371/journal.pcbi.1009865
38. Vogt F, Haire B, Selvey L, Katelaris AL, Kaldor J. Effectiveness evaluation of digital contact tracing for COVID-19 in New South Wales, Australia. Lancet Public Health. (2022) 7:e250–8. doi: 10.1016/S2468-2667(22)00010-X
39. Kirchner A, Klüpfel H, Nishinari K, Schadschneider A, Schreckenberg M. Discretization effects and the influence of walking speed in cellular automata models for pedestrian dynamics. J Stat Mech Theory Exp. (2004) 2004:P10011. doi: 10.1088/1742-5468/2004/10/P10011
40. Burstedde C, Klauck K, Schadschneider A, Zittartz J. Simulation of pedestrian dynamics using a two-dimensional cellular automaton. Physica A. (2001) 295:507–25. doi: 10.1016/S0378-4371(01)00141-8
41. Helbing D, Molnár P. Social force model for pedestrian dynamics. Phys Rev E. (1995) 51:4282–6. doi: 10.1103/PhysRevE.51.4282
42. Kolivand H, Rahim MS, Sunar MS, Fata AZA, Wren C. An integration of enhanced social force and crowd control models for high-density crowd simulation. Neural Comput Appl. (2021) 33:6095–117. doi: 10.1007/s00521-020-05385-6
43. Yang X, Dong H, Wang Q, Chen Y, Hu X. Guided crowd dynamics via modified social force model. Physica A. (2014) 411:63–73. doi: 10.1016/j.physa.2014.05.068
44. Jebrane A, Argoul P, Hakim A, Rhabi ME. Estimating contact forces and pressure in a dense crowd: microscopic and macroscopic models. Appl Math Model. (2019) 74:409–21. doi: 10.1016/j.apm.2019.04.062
45. Makmul J. A Social force model for pedestrians' movements affected by smoke spreading. Model. Simul. Eng. (2020) 2020:1–11. doi: 10.1155/2020/8819076
46. Han Y, Liu H. Modified social force model based on information transmission toward crowd evacuation simulation. Physica A. (2017) 469:499–509. doi: 10.1016/j.physa.2016.11.014
47. Liu Q. A social force model for the crowd evacuation in a terrorist attack. Physica A. (2018) 502:315–30. doi: 10.1016/j.physa.2018.02.136
48. Heliövaara S, Korhonen T, Hostikka S, Ehtamo H. Counterflow model for agent-based simulation of crowd dynamics. Build Environ. (2012) 48:89–100. doi: 10.1016/j.buildenv.2011.08.020
49. Lee J, Kim T, Chung JH, Kim J. Modeling lane formation in pedestrian counter flow and its effect on capacity. KSCE J Civil Eng. (2016) 20:1099–108. doi: 10.1007/s12205-016-0741-9
50. Smith A, James C, Jones R, Langston P, Lester E, Drury J. Modelling contra-flow in crowd dynamics DEM simulation. Saf Sci. (2009) 47:395–404. doi: 10.1016/j.ssci.2008.05.006
51. Jiang YQ, Chen BK, Wang BH, Wong WF, Cao BY. Extended social force model with a dynamic navigation field for bidirectional pedestrian flow. Front Phys. (2017) 12:1–9. doi: 10.1007/s11467-017-0689-3
52. Chen X, Treiber M, Kanagaraj V, Li H. Social force models for pedestrian traffic-state of the art. Transp Rev. (2018) 38:625–53. doi: 10.1080/01441647.2017.1396265
53. Wang P. Understanding social-force model in psychological principles of collective behavior. arXiv. (2016) [preprint]. doi: 10.48550/arXiv.1605.05146
54. Pécol P, Pont SD, Erlicher S, Argoul P. Modeling crowd-structure interaction. Mec Ind EDP Sci. (2010) 11:495–504. doi: 10.1051/meca/2010057
55. Pécol P, Pont SD, Erlicher S, Argoul P. Smooth/nonsmooth contact modeling of human crowds movement: numerical aspects and application to emergency evacuations. Ann Solid Struct Mech. (2011) 2:69–85. doi: 10.1007/s12356-011-0019-3
56. Pécol P, Argoul P, Pont SD, Erlicher S. The non-smooth view for contact dynamics by Michel Fre'mond extended to the modeling of crowd movements. Discrete Contin Dyn Syst. (2013) 6:547–65. doi: 10.3934/dcdss.2013.6.547
57. Kabalan B, Argoul P, Jebrane A, Cumunel G, Erlicher S. A crowd movement model for pedestrian flow through bottlenecks. Ann Solid Struct Mech. (2016) 8:1–15. doi: 10.1007/s12356-016-0044-3
58. Harweg T, Bachmann D, Weichert F. Agent-based simulation of pedestrian dynamics for exposure time estimation in epidemic risk assessment. J Public Health. (2021) 31, 221–228. doi: 10.1007/s10389-021-01489-y
59. Namilae S, Derjany P, Mubayi A, Scotch M, Srinivasan A. Multiscale model for pedestrian and infection dynamics during air travel. Phys Rev E. (2017) 95:052320. doi: 10.1103/PhysRevE.95.052320
60. Derjany P, Namilae S, Liu D, Srinivasan A. Multiscale model for the optimal design of pedestrian queues to mitigate infectious disease spread. PLoS ONE. (2020) 15:e0235891. doi: 10.1371/journal.pone.0235891
61. Bouchnita A, Jebrane A. A hybrid multi-scale model of COVID-19 transmission dynamics to assess the potential of non-pharmaceutical interventions. Chaos Solitons Fractals. (2020) 138:109941. doi: 10.1016/j.chaos.2020.109941
62. Bouchnita A, Jebrane A. A multi-scale model quantifies the impact of limited movement of the population and mandatory wearing of face masks in containing the COVID-19 epidemic in Morocco. Math Model Nat Phenom. (2020) 15:31. doi: 10.1051/mmnp/2020016
63. Bouchnita A, Chekroun A, Jebrane A. Mathematical modeling predicts that strict social distancing measures would be needed to shorten the duration of waves of COVID-19 infections in Vietnam. Front Public Health. (2021) 8:987. doi: 10.3389/fpubh.2020.559693
64. Yang X, Wang Q. Crowd hybrid model for pedestrian dynamic prediction in a corridor. IEEE Access. (2019) 7:95264–73. doi: 10.1109/ACCESS.2019.2928556
65. Campanella M, Hoogendoorn SP, Daamen W. Effects of heterogeneity on self-organized pedestrian flows. Sage J. (2009) 2124:148–56. doi: 10.3141/2124-14
66. Wang P, Wang X. Understanding social-force model in psychological principles of collective behavior. arXiv. (2021) [preprint]. Available online at: https://arxiv.org/abs/2109.12597
67. Trivedi A, Pandey M. Agent based modelling and simulation to estimate movement time of pilgrims from one place to another at Allahabad Jn. Railway Station during Kumbh Mela-2019. Auton Agent Multi-Agent Syst. (2020) 34:1–37. doi: 10.1007/s10458-020-09454-x
68. Frémond M. Rigid bodies collisions. Phys Lett A. (1995) 204:33–41. doi: 10.1016/0375-9601(95)00418-3
69. Frémond M. Collisions Engineering: Theory and Applications, 1st ed. Berlin: Springer (2017). doi: 10.1007/978-3-662-52696-5
70. Bassoli E, Vincenzi L. Parameter calibration of a social force model for the crowd-induced vibrations of footbridges. Front Built Environ. (2021) 7:656799. doi: 10.3389/fbuil.2021.656799
71. Taherifar N, Hamedmoghadam H, Sree S, Saberi M. A macroscopic approach for calibration and validation of a modified social force model for bidirectional pedestrian streams. Transportmetrica A Transp Sci. (2018) 15:1637–61. doi: 10.1080/23249935.2019.1636156
72. Kretz T, Lohmiller J, Sukennik P. Some indications on how to calibrate the social force model of pedestrian dynamics. Transp Res Rec. (2018) 2672:228–38. doi: 10.1177/0361198118786641
73. Seer S, Rudloff C, Matyus T, Brändle N. Validating social force based models with comprehensive real world motion data. Transp Res Procedia. (2014) 2:724–32. doi: 10.1016/j.trpro.2014.09.080
74. Johansson A, Helbing D, Shukla PK. Specification of the social force pedestrian model by evolutionary adjustment to video tracking data. Adv Complex Syst. (2007) 10(supp02):271–88. doi: 10.1142/S0219525907001355
75. Guo Y, Ma S, Wei F, Lu L, Sun F, Wang J. Analysis of behavior characteristics for pedestrian twice-crossing at signalized intersections based on an improved social force model. Sustainability. (2022) 14:2003. doi: 10.3390/su14042003
76. Sticco IM, Frank GA, Dorso CO. Social Force Model parameter testing and optimization using a high stress real-life situation. Physica A. (2021) 561:125299. doi: 10.1016/j.physa.2020.125299
77. Zhou R, Cui Y, Wang Y, Jiang J. A modified social force model with different categories of pedestrians for subway station evacuation. Tunn Undergr Space Technol. (2021) 110:103837. doi: 10.1016/j.tust.2021.103837
78. Yuan Z, Jia H, Zhang L, Bian L. A social force evacuation model considering the effect of emergency signs. Simulation. (2018) 94:723–37. doi: 10.1177/0037549717741350
79. Helbing D, Farkas I, Vicsek T. Simulating dynamical features of escape panic. Nature. (2000) 407:487–90. doi: 10.1038/35035023
80. Helbing D, Farkas I, Molnar P, Vicsek T. Simulation of pedestrian crowds in normal and evacuation situations. In:Schreckenberg M, Sharma SD, , editors. Pedestrian and Evacuation Dynamics. Berlin: Springer (2002), p. 21–58.
81. Virtanen P, Gommers R, Oliphant TE, Haberland M, Reddy T, Cournapeau D. et al. SciPy 10: fundamental algorithms for scientific computing in Python. Nat Methods. (2020) 17:261–72.
82. Stein RA. Super-spreaders in infectious diseases. Int J Infect Dis. (2011) 15:e510–3. doi: 10.1016/j.ijid.2010.06.020
83. Rambo APS, Gonçalves LF, Gonzáles AI, Rech CR, Paiva KMd, Haas P. Impact of super-spreaders on COVID-19: systematic review. Sao Paulo Med J. (2021) 139:163–9. doi: 10.1590/1516-3180.2020.0618.r1.10122020
84. Kain MP, Childs ML, Becker AD, Mordecai EA. Chopping the tail: how preventing superspreading can help to maintain COVID-19 control. Epidemics. (2021) 34:100430. doi: 10.1016/j.epidem.2020.100430
85. Kanté DSI, Jebrane A, Bouchnita A, Hakim A. Estimating the risk of contracting COVID-19 in different settings using a multiscale transmission dynamics model. Mathematics. (2023) 11:254. doi: 10.3390/math11010254
86. Schimpl M, Moore C, Lederer C, Neuhaus A, Sambrook J, Danesh J, et al. Association between walking speed and age in healthy, free-living individuals using mobile accelerometry–a cross-sectional study. PLoS ONE. (2011) 6:e23299. doi: 10.1371/journal.pone.0023299
87. Yates T, Razieh C, Zaccardi F, Rowlands AV, Seidu S, Davies MJ, et al. Obesity, walking pace and risk of severe COVID-19 and mortality: analysis of UK Biobank. Int J Obes. (2021) 45:1155–9. doi: 10.1038/s41366-021-00771-z
88. Guallar MP, Meiriño R, Donat-Vargas C, Corral O, Jouvé N, Soriano V. Inoculum at the time of SARS-CoV-2 exposure and risk of disease severity. Int J Infect Dis. (2020) 97:290–2. doi: 10.1016/j.ijid.2020.06.035
89. Wang X, Dobnikar J, Frenkel D. Effect of social distancing on super-spreading diseases: why pandemics modelling is more challenging than molecular simulation. Mol Phys. (2021) 119:e1936247. doi: 10.1080/00268976.2021.1936247
90. Goyal A, Reeves DB, Cardozo-Ojeda EF, Schiffer JT, Mayer BT. Viral load and contact heterogeneity predict SARS-CoV-2 transmission and super-spreading events. Elife. (2021) 10:e63537. doi: 10.7554/eLife.63537
91. Chua G, Yuen KF, Wang X, Wong YD. The determinants of panic buying during COVID-19. Int J Environ Res Public Health. (2021) 18:3247. doi: 10.3390/ijerph18063247
92. Johansson F, Peterson A, Tapani A. Waiting pedestrians in the social force model. Physica A. (2015) 419:95–107. doi: 10.1016/j.physa.2014.10.003
93. Subramanian GH, Choubey N, Verma A. Modelling and simulating serpentine group behaviour in crowds using modified social force model. Physica A. (2022) 604:127674. doi: 10.1016/j.physa.2022.127674
94. Zhang H, Liu H, Qin X, Liu B. Modified two-layer social force model for emergency earthquake evacuation. Physica A. (2018) 492:1107–19. doi: 10.1016/j.physa.2017.11.041
95. Wei J, Fan W, Li Z, Guo Y, Fang Y, Wang J. Simulating crowd evacuation in a social force model with iterative extended state observer. J Adv Transp. (2020) 2020:4604187. doi: 10.1155/2020/4604187
Keywords: superspreading events, pedestrian dynamics, contact patterns, social distancing, superspreaders movement, panic, close-contact infections, COVID-19
Citation: Kanté DSI, Jebrane A, Hakim A and Boukamel A (2023) Characterization of superspreaders movement in a bidirectional corridor using a social force model. Front. Public Health 11:1188732. doi: 10.3389/fpubh.2023.1188732
Received: 17 March 2023; Accepted: 11 July 2023;
Published: 28 July 2023.
Edited by:
Chun Yin, East China Normal University, ChinaReviewed by:
Maxim A. Dulebenets, Florida Agricultural and Mechanical University, United StatesShuqi Xue, Xi'an University of Posts and Telecommunications, China
Shaoqing Dai, University of Twente, Netherlands
Copyright © 2023 Kanté, Jebrane, Hakim and Boukamel. This is an open-access article distributed under the terms of the Creative Commons Attribution License (CC BY). The use, distribution or reproduction in other forums is permitted, provided the original author(s) and the copyright owner(s) are credited and that the original publication in this journal is cited, in accordance with accepted academic practice. No use, distribution or reproduction is permitted which does not comply with these terms.
*Correspondence: Dramane Sam Idris Kanté, ZHJhbWFuZXNhbWlkcmlzLmthbnRlQGVkdS51Y2EubWE=