 Xiang-Yu Chen
 Le Fang
94% of researchers rate our articles as excellent or good
Learn more about the work of our research integrity team to safeguard the quality of each article we publish.
Find out more
ORIGINAL RESEARCH article
Front. Public Health , 15 May 2023
Sec. Clinical Diabetes
Volume 11 - 2023 | https://doi.org/10.3389/fpubh.2023.1188212
Objectives: This study aimed to investigate the association between body mass index (BMI) and dyslipidemia and to explore the interaction between BMI and family history of dyslipidemia towards dyslipidemia in patients with type 2 diabetes.
Methods: This cross-sectional study was conducted between March and November 2018 in Zhejiang Province, China. A total of 1,756 patients with type 2 diabetes were included, physical examination data, fasting blood samples and face-to-face questionnaire survey data were collected. Restricted cubic spline analysis was used to evaluate the association between BMI and the risk of dyslipidemia. Unconditional multivariable logistic regression was used to estimate the interaction between BMI and family history of dyslipidemia towards dyslipidemia.
Results: The prevalence of dyslipidemia was 53.7% in the study population. The risk of dyslipidemia elevated with increased BMI value (p for non-linearity <0.05). After adjusting for covariates, individuals with high BMI (≥24 kg/m2) and a family history of dyslipidemia had a 4.50-fold (95% CI: 2.99–6.78) increased risk of dyslipidemia compared to the normal reference group, which was higher than the risk associated with high BMI alone (OR = 1.83, 95% CI: 1.47–2.28) or family history of dyslipidemia alone (OR = 1.79 95% CI: 1.14–2.83). Significant additive interaction between high BMI and a family history of dyslipidemia was detected, with RERI, AP, and SI values of 1.88 (95% CI: 0.17–4.10), 0.42 (95% CI: 0.02–0.62), and 2.16 (95% CI: 1.07–4.37), respectively. However, stratified by status of diabetes control, this additive interaction was only find significant among patients with controlled diabetes.
Conclusion: Both high BMI and a family history of dyslipidemia were related with high risk of dyslipidemia. Moreover, there were synergistic interaction between these two factors. Patients with type 2 diabetes who had a family history of dyslipidemia were more susceptible to the negative impact of being overweight or obesity on dyslipidemia.
The latest study has reported that diabetes affects approximately 11% of the Chinese population, and its prevalence is still on the rise, posing a significant public health challenge in China (1). Meanwhile, previous study reported that the prevalence of dyslipidemia was 67.1% among the type 2 diabetes populations (2). The co-occurrence of diabetes and dyslipidemia is of particular concern since it significantly increases the risk of developing cardiovascular disease, which is a leading cause of morbidity and mortality in individuals with diabetes (3–5).
Body mass index (BMI) is a commonly used measure of adiposity, the high level of BMI was indicated to be associated with an increased risk of dyslipidemia in some studies (6–8). In addition to BMI, family history of dyslipidemia is also a known risk factor for developing dyslipidemia (9, 10). Previous research suggested that family history of dyslipidemia plays a significant role in the development of cardiometabolic alterations (9, 11, 12). Despite this, to date, there is limited knowledge on the association between BMI and family history of dyslipidemia in relation to dyslipidemia among individuals with diabetes. Given the high prevalence of dyslipidemia in people with diabetes, to understand the effect measure modification between BMI and family history of dyslipidemia towards dyslipidemia in people with diabetes is important for identifying high-risk individuals and developing effective prevention and treatment strategies.
Thus, the aim of this study is to analyze the characteristics of dyslipidemia in people with diabetes by utilizing data from the Zhejiang Provincial Diabetic Complications Study. Specifically, we seek to investigate the association of BMI and its effect measure modification with family history of dyslipidemia on the risk of dyslipidemia. The findings of this study will provide a basis for the prevention and control of dyslipidemia in the populations with type 2 diabetes.
During the period of March to November 2018, the Zhejiang Provincial Diabetic Complications Study was conducted as part of the China National Diabetic Complications Study. The study aimed to investigate the prevalence and risk factors of diabetic complications among patients with type 2 diabetes in Zhejiang Province, China. A detailed description of the study design, methods, and participants can be found elsewhere (13). In brief, the study recruited eligible participants who were registered patients with type 2 diabetes living in the survey sites for more than 6 months within 12 months before the survey, aged 18 years or older, and were not pregnant, bedridden, or intellectually disabled.
The study adopted a multi-stage random sampling method (13), Firstly, two districts and two counties were randomly selected from Zhejiang Province. Secondly, four streets/towns were randomly selected from each district/county. Thirdly, 120 patients with type 2 diabetes registered in the local health system were randomly selected from each street/town based on gender and age stratification, resulting in a total of 1,920 eligible participants. The study collected physical examination data, fasting blood samples, and conducted a face-to-face detailed questionnaire survey for all participants.
This study was approved by the ethics committee (Approval No: 2018-010) (13), written informed consent was obtained from each participant prior to data collection.
The questionnaire survey collected data on participants’ demographic and socioeconomic information, health-related behaviors, and family history of certain diseases via face-to-face interviews conducted by well-trained staff from the center for disease control and prevention (CDC) or primary health care institutions. Physical measurements and blood sample collection were carried out by trained personnel in primary health care institutions. Demographic and socioeconomic information included gender, age, residential area, and educational level, etc. Health-related behaviors included cigarette smoking, alcohol consumption, tea, and coffee consumption, etc. Family history of certain diseases included hypertension, diabetes, obesity, coronary heart disease, stroke, tumor, and dyslipidemia, etc. Physical examinations involved measuring body height, weight, waist circumference, and blood pressure. Height was measured using a TZG height gage with a precision of 0.1 centimeters (cm), while weight was measured using a TANITA HD-390 body weight scale with a precision of 0.1 kilograms (kg). Blood pressure was measured three times, with a 1-min rest interval, using an Omron HBP-1300 blood pressure monitor. Blood samples were tested for fasting plasma glucose (FPG), glycosylated hemoglobin (HbA1c), uric acid (UA), triglyceride (TG), total cholesterol (TC), low-density lipoprotein-cholesterol (LDL-C), and high-density lipoprotein-cholesterol (HDL-C), etc. The lipids (TC, TG, HDL-C, LDL-C) and UA were measured using enzymatic methods (Roche cobas c701, Switzerland). FPG was measured using the hexokinase method, while HbA1c was measured using the high-performance liquid chromatography method (BioRad D10 Hemoglobin Analyzer, USA).
Dyslipidemia was used as outcome variable. The diagnostic criteria for dyslipidemia were subjects having any one of the following: TC level ≥ 6.22 mmol/L; TG level ≥ 2.26 mmol/L; LDL-C level ≥ 4.14 mmol/L; HDL-C level < 1.04 mmol/L; had been diagnosed as dyslipidemia or hyperlipidemia by clinical institutions (14).
In our study, BMI and family history of dyslipidemia were considered as independent variables. BMI was calculated as weight in kilograms divided by the square of height in meters (kg/m2). According to the guidelines for prevention and control of overweight and obesity in Chinese adults (15), BMI was divided into low and normal BMI (<24 kg/m2) and high BMI (≥24 kg/m2). Family history of dyslipidemia was defined as the presence of dyslipidemia in parents or siblings of a patient with type 2 diabetes.
The following categorical variables were considered to be potential covariates adjusted in the multivariate logistic regression model. Age group: according to the prior studies in China, participants in this study were categorized into young adults (≥18 years and < 45 years old), middle-aged adults (≥45 years and <60 years old) and old adults (≥60 years old) groups (16). Gender was categorized as male or female. The education levels were divided into secondary school or lower, senior high school, college or above (17). Residence area was classified as urban or rural based on the participant’s residential location, either in an urban district or a county. Hypertension was defined as systolic blood pressure(SBP) ≥140 mmHg and/or diastolic blood pressure(DBP) ≥90 mmHg and/or a self-reported diagnosis of hypertension (18). Current cigarette smoking was defined as an individual currently smokes cigarette every day or some days. Alcohol drinking was defined as an individual have drunk alcohol within the past 30 days or 30 days ago. The diagnostic criteria for hyperuricemia was defined as uric acid (UA) >420 μmol/L in both males and females. Abnormal FPG and abnormal HbA1c were defined as FPG ≥ 7.0 mmol/L and HbA1c ≥7.0%, respectively (19).
SAS (version 9.4) software was used to analyze the data. Continuous data was described as means with standard deviations (SD) or median (interquartile range, IQR). Differences of continuous data between groups were analyzed using t-test or Wilcoxon rank-sum test. Qualitative data was described as frequency (percentage) and chi-square test (χ2-test) was used to compare the differences between these different groups. Restricted cubic spline model was used to evaluate the association between BMI levels and risk of dyslipidemia. An unconditional multivariable logistic regression model was used to estimate the influencing factors of dyslipidemia, and the backward elimination method was used to select variables for confounder adjustment. The results of this unconditional multivariable logistic regression model and the interaction table were used to analyze the additive interaction between BMI and family history of dyslipidemia (20). The relative excess risk due to interaction (RERI), the attributable proportion due to interaction (AP) and the synergy index (SI) were calculated (21). The table produced by T Anderson was used to calculate the 95% confidence interval (CI) of the interaction indicators (22). If the RERI equal to 0, it means there is no additive interaction, if the RERI greater than 0, it indicates a positive additive interaction (23). If the 95% CI of AP or RERI contains 0 or the 95% CI of SI contains 1, it means that the two factors have no interaction. The level of significance (α) in this study was set at 0.05.
The study enrolled 1,756 out of 1,920 participants who provided complete research information. Among the participants, 876 (49.9%) were males, with a mean age of 57.2 ± 10.2 years and a mean BMI of 24.8 ± 3.4 kg/m2. Dyslipidemia was found in 943 (53.7%) subjects, hypertension in 1,147 (65.3%), hyperuricemia in 292 (16.6%), and 260 (14.8%) had a family history of dyslipidemia. Furthermore, 436 (24.8%) were current cigarette smokers, and 646 (36.8%) were alcohol drinkers. Table 1 presents the basic characteristics of the 1,756 subjects.
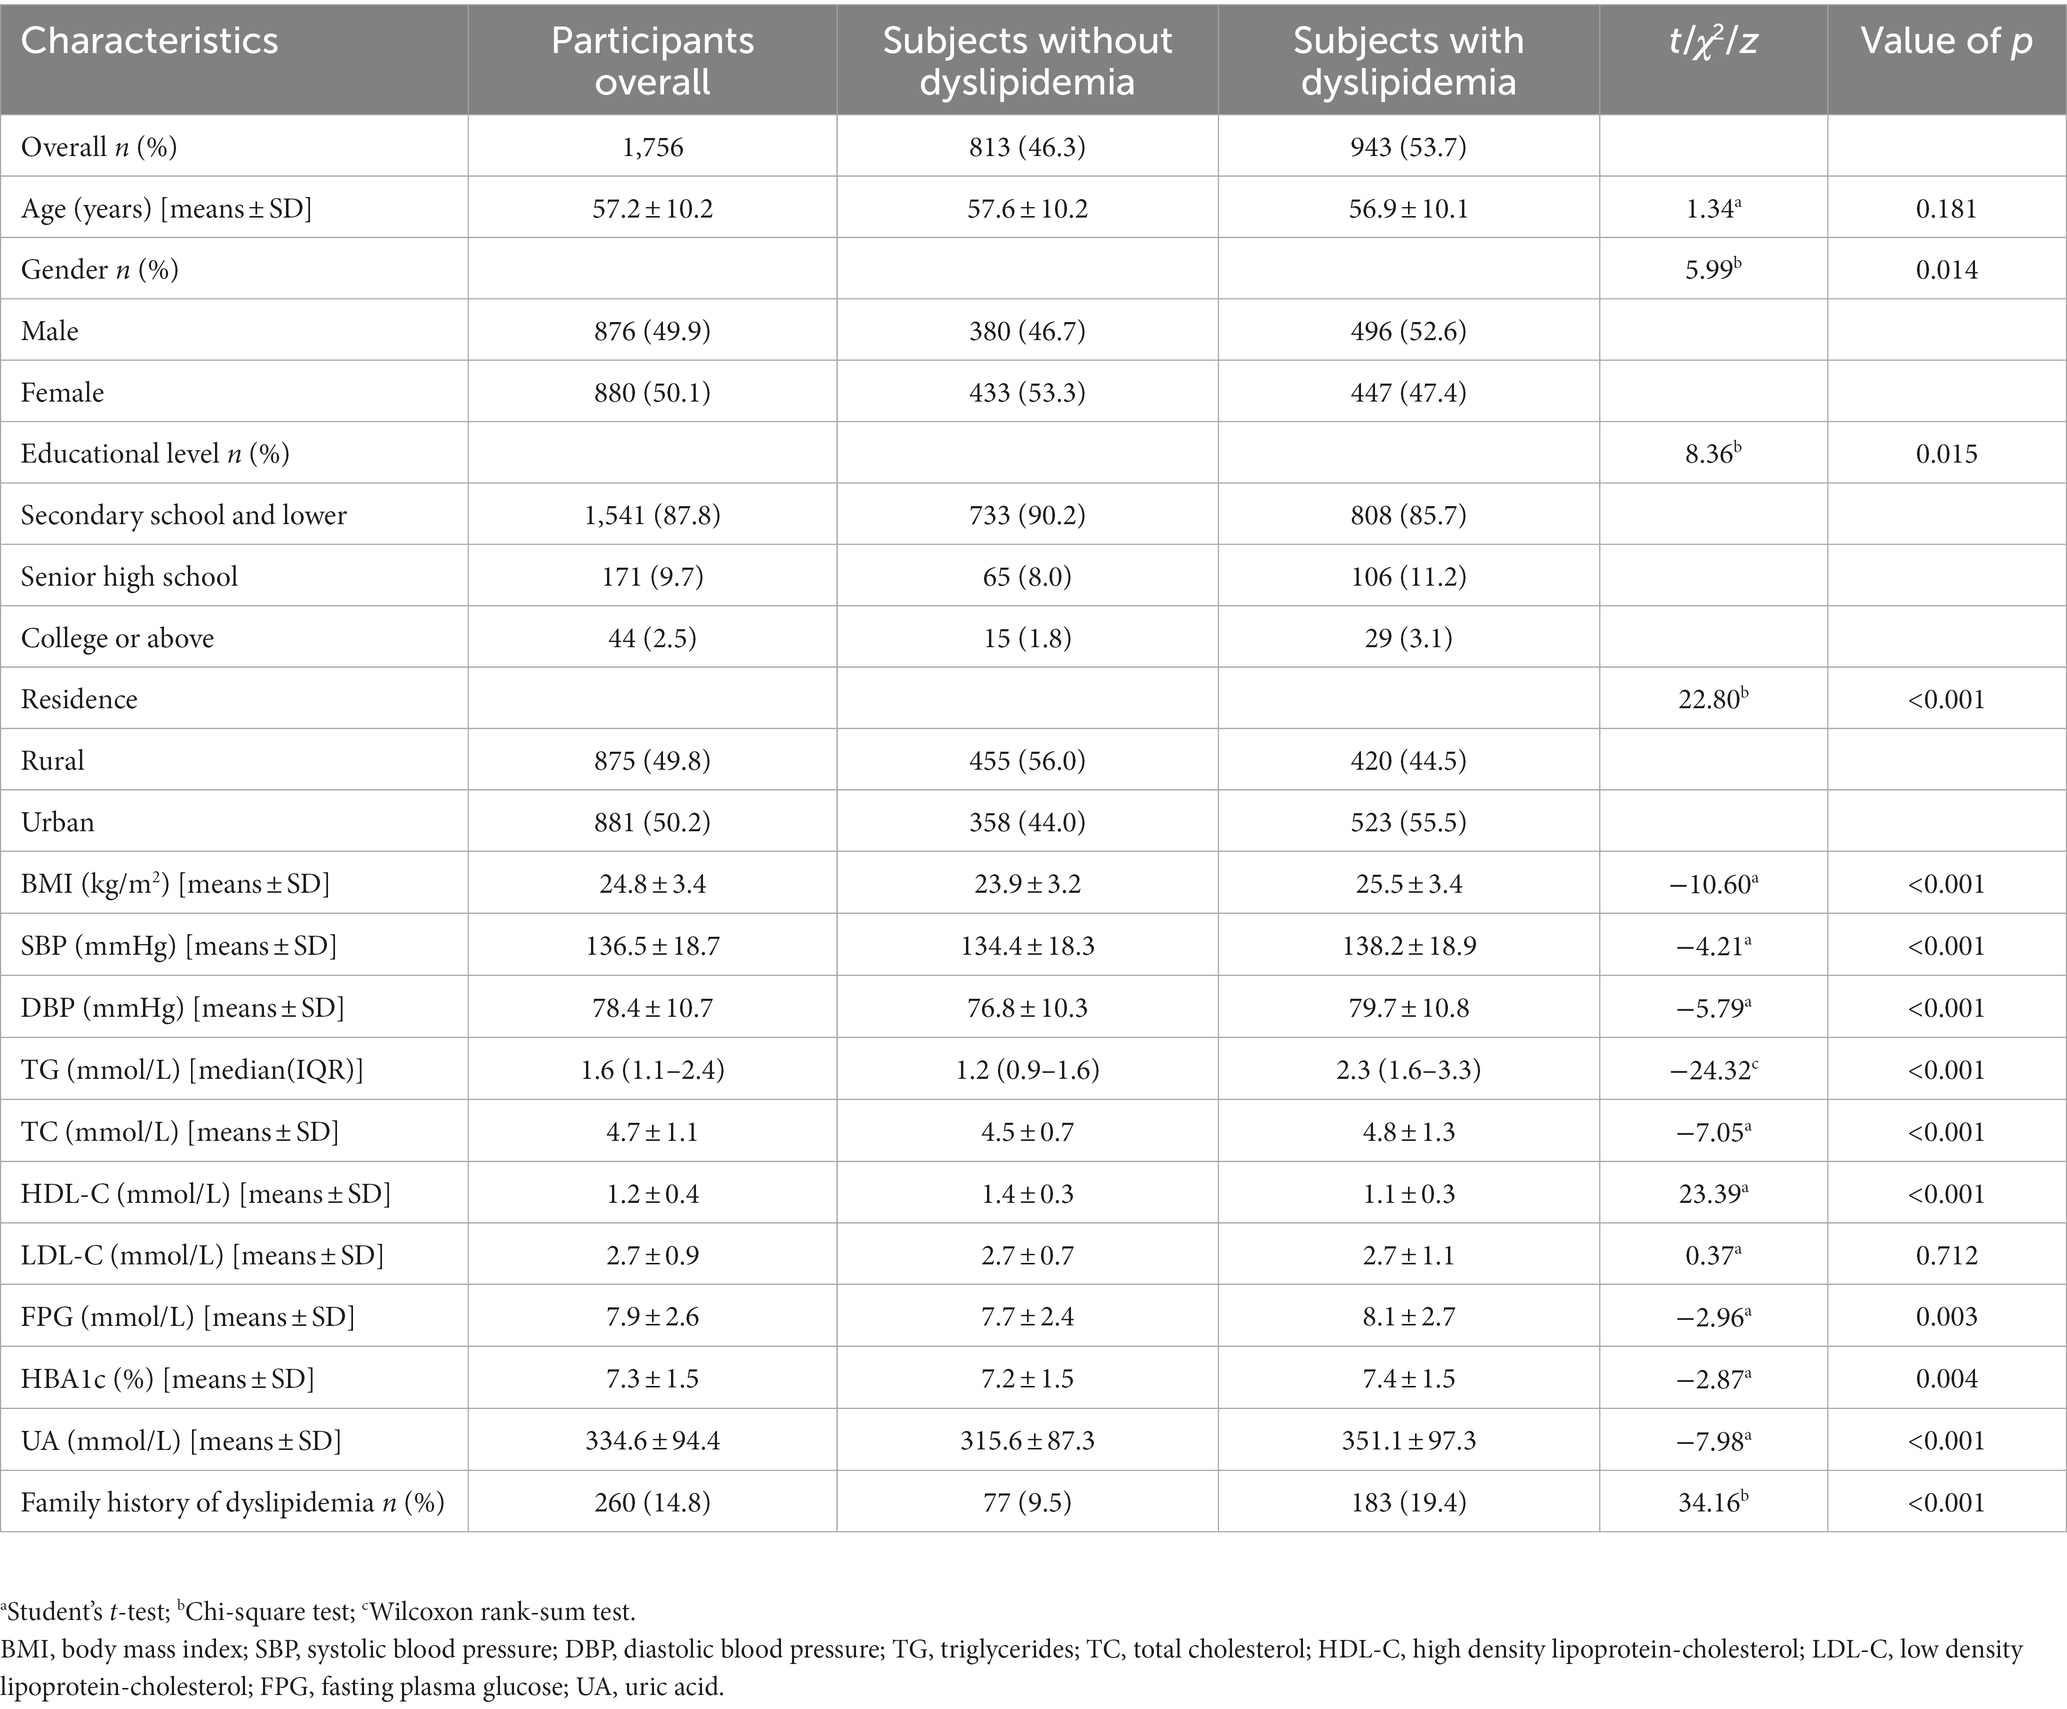
Table 1. Basic characteristics of the subjects (n = 1,756).
The multivariable logistic regression results on influencing factors of dyslipidemia are presented in Table 2. The results indicate that in addition to BMI and family history of dyslipidemia, urban residence (OR = 1.67, 95%CI: 1.36–2.06), hyperuricemia (OR = 1.83, 95%CI: 1.37–2.44), hypertension (OR = 1.91, 95%CI: 1.52–2.39), abnormal HbA1c (OR = 1.42, 95%CI: 1.16–1.73), and current cigarette smoking (OR = 1.57, 95%CI: 1.18–2.08) are significantly associated with an elevated risk of dyslipidemia. After adjusting for these factors, the risk of dyslipidemia in patients with type 2 diabetes with high BMI is 1.92 times higher than that in those with low or normal BMI (95%CI: 1.57–2.37). The risk of dyslipidemia in patients with type 2 diabetes with a family history of dyslipidemia is 2.30 times higher than that in those without a family history of dyslipidemia (95%CI: 1.73–3.06).
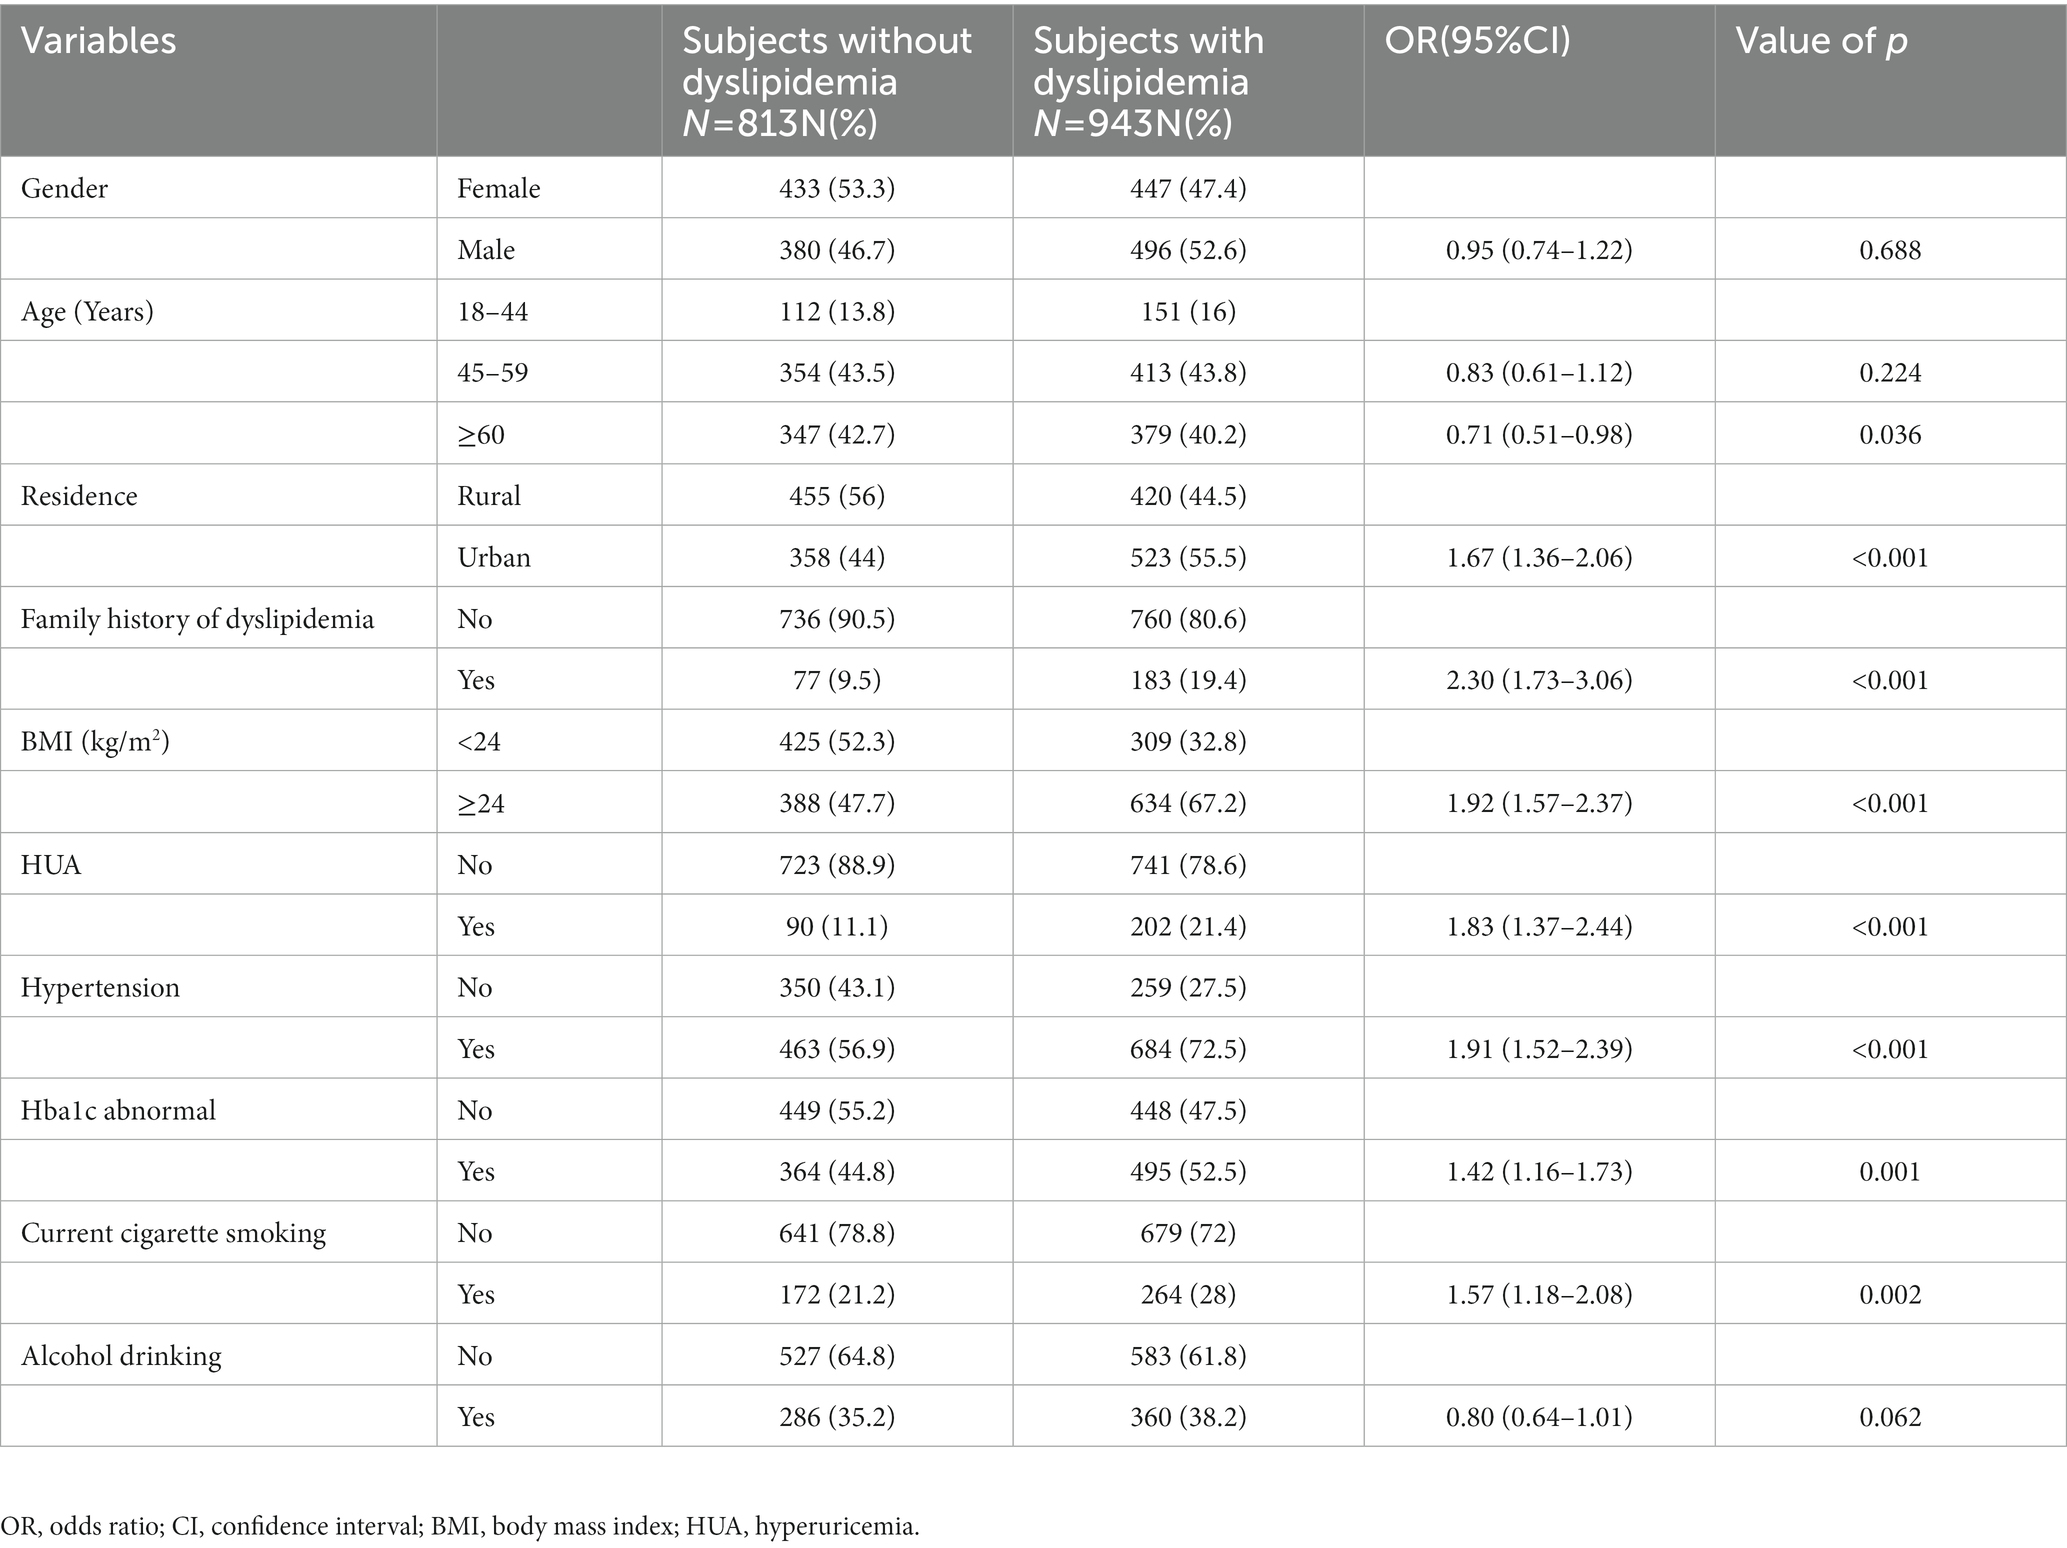
Table 2. Multivariable analysis on influencing factors of dyslipidemia (n = 1,756).
A restricted cubic spline model was used to evaluate and visualize the relationship between BMI and the risk of dyslipidemia (Figure 1). The reference value (OR = 1) was set at BMI = 24 kg/m2. The figure shows that there is non-linearity association between BMI and the risk of dyslipidemia (p for non-linearity<0.05). The figure indicates a sustained elevation of the risk with increased BMI, this elevation becomes flat around BMI = 28 kg/m2 and larger.
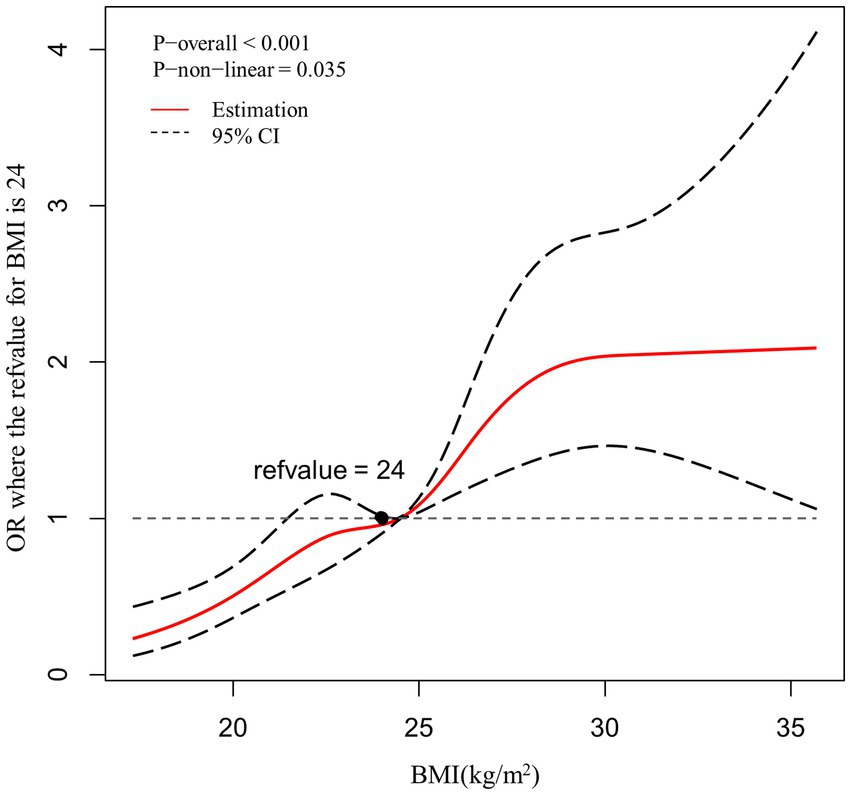
Figure 1. Association between BMI and the risk of dyslipidemia, allowing for nonlinear effects, with 95%CI. The model shows ORs compared with BMI 24 kg/m2, adjusting for age, gender, residence, hypertension, hyperuricemia, HbA1c abnormal, current cigarette smoking. BMI, body mass index; CI, confidence interval; OR, odds ratio.
Participants were categorized into four groups based on their BMI levels: ≥24 kg/m2 (high BMI), <24 kg/m2 (low and normal BMI) and family history of dyslipidemia. Compared to underweight or normal weight subjects without family history of dyslipidemia, patients with high BMI and a family history of dyslipidemia had the highest risk of dyslipidemia (crude OR = 5.30, 95%CI:3.56–7.89; multi-adjusted OR = 4.50, 95%CI:2.99–6.78; Table 3). There was a significant additive interaction between BMI and a family history of dyslipidemia towards dyslipidemia with the RERI, AP, and SI were 1.91 (95% CI: 0.18–4.17), 0.42 (95% CI: 0.02–0.62), and 2.15 (95% CI: 1.07–4.33), respectively (Table 4). More specifically, BMI and a family history of dyslipidemia acted synergistically towards dyslipidemia.
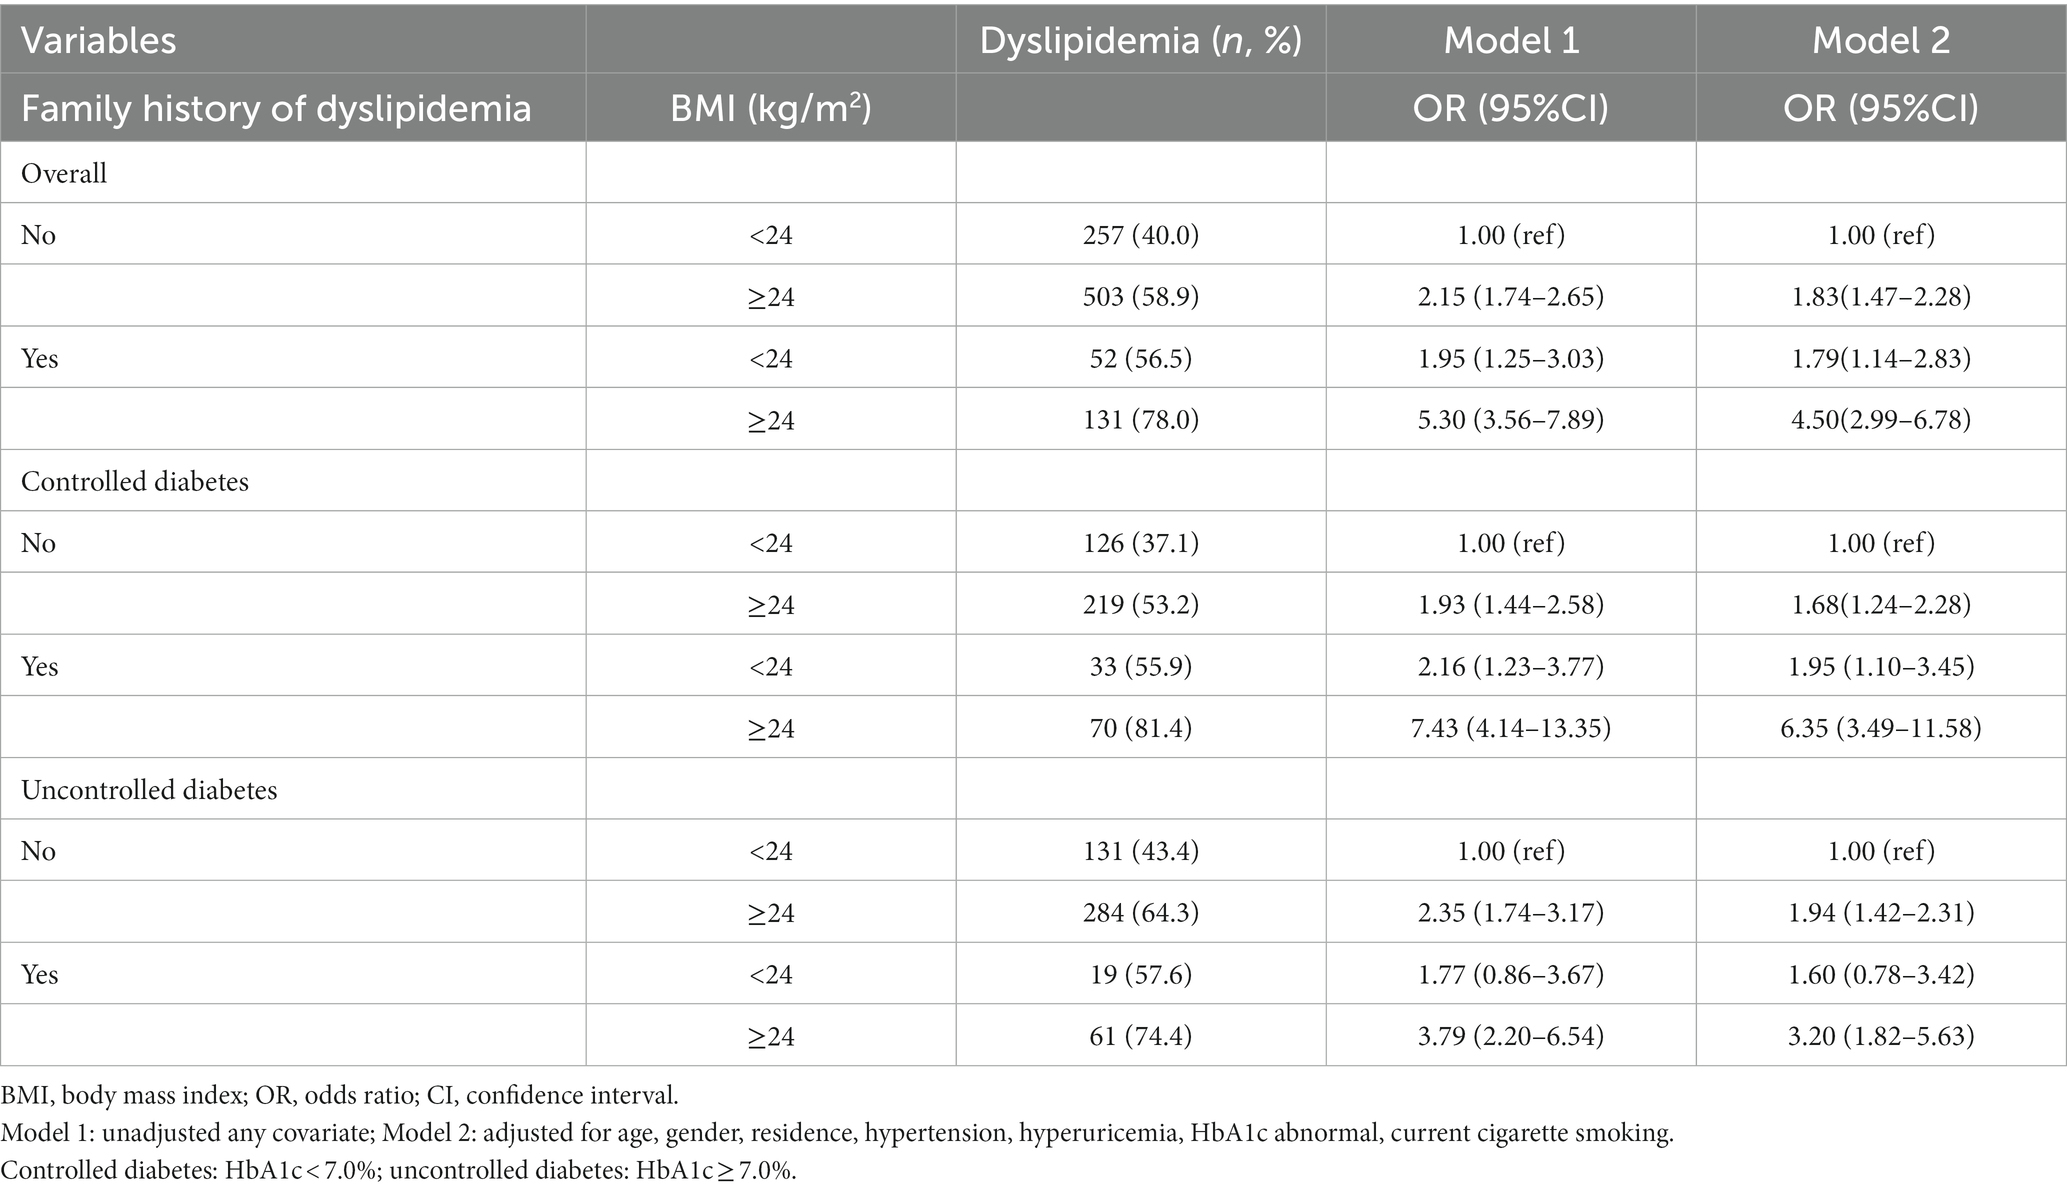
Table 3. The interaction analysis on BMI and family history of dyslipidemia towards dyslipidemia (n = 1,756).
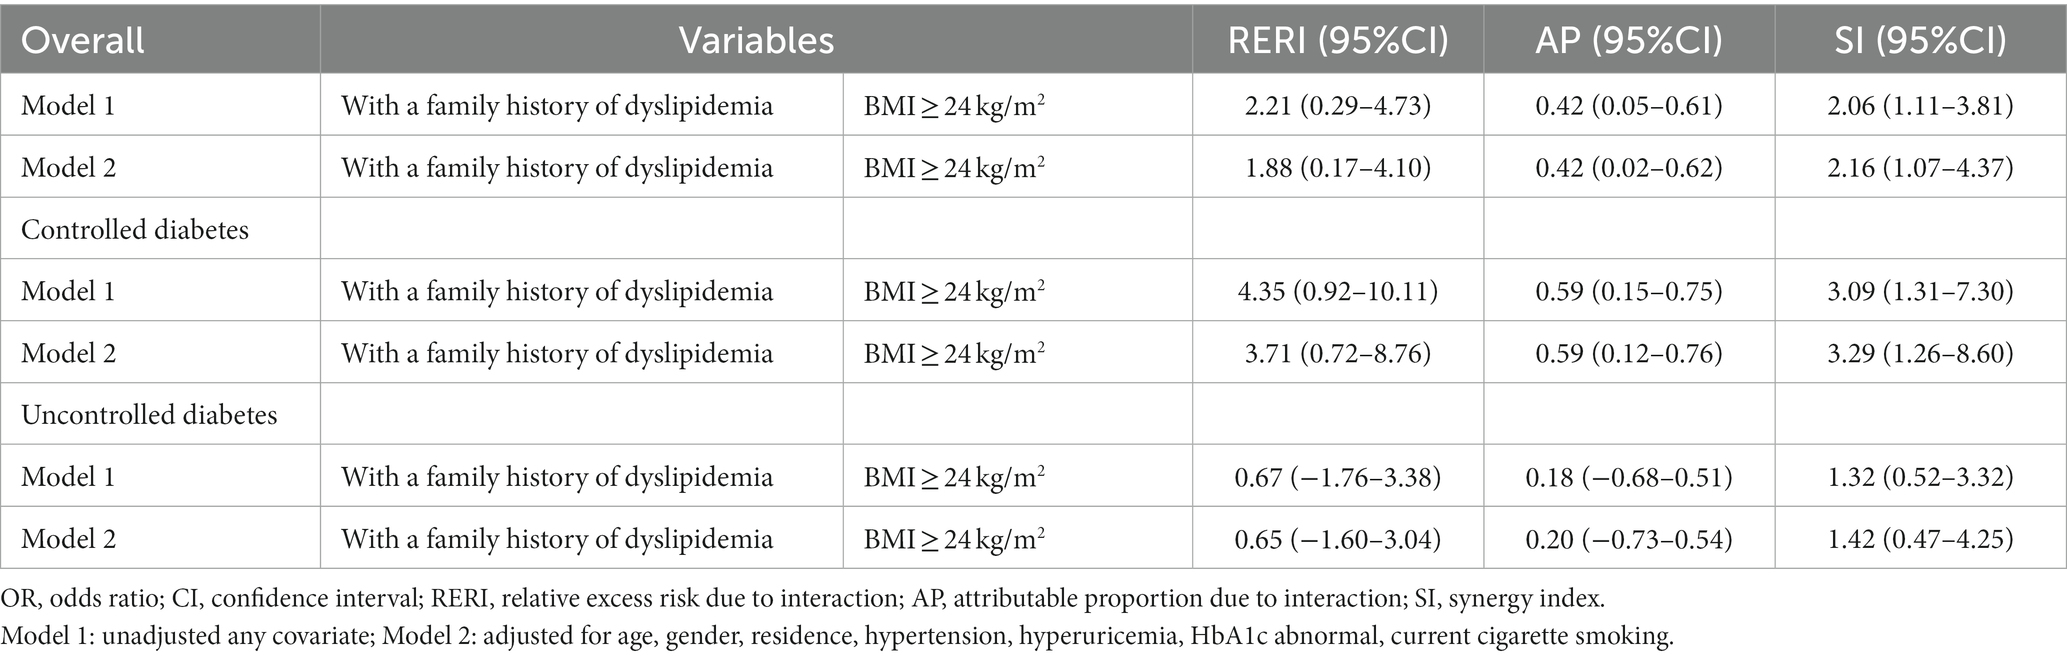
Table 4. Indicators of additive interaction between BMI and family history of dyslipidemia (n = 1,756).
We further conducted the analysis of the additive interaction across different status of diabetes control and the inconsistent results was revealed. This additive interaction was significant among patients with controlled diabetes (RERI = 3.71, 95%CI:0.72–8.76; AP = 0.59, 95%CI:0.12–0.76; SI = 3.29, 95%CI:1.26–8.60; Table 4). However, this additive interaction was not significant among patients with uncontrolled diabetes (RERI = 0.65, 95%CI: −1.60-3.04; AP = 0.20, 95%CI: −0.73-0.54; SI = 1.42,95%CI:0.47–4.25; Table 4).
Our study provides the first prevalence data of dyslipidemia among individuals with type 2 diabetes in Zhejiang Province, China. In 2018, the prevalence of dyslipidemia in this population was found to be 53.7%, which is slightly lower than the 59.3% reported in Yaru Li′s study (14), but significantly higher than the national prevalence of 34.0% in the general population of China (24). Given the large number of individuals with type 2 diabetes in Zhejiang Province (25), the high percentage of dyslipidemia in this population represents a significant hidden threat to both social and economic development.
BMI is a widely used measure of body fat based on an individual’s height and weight. Our findings revealed a significant non-linear dose–response relationship between BMI and the risk of dyslipidemia (p for non-linearity<0.05). Our study found evidence of a dose–response relationship between BMI and dyslipidemia among overweight and obesity diabetes patients. This was consistently with some previous studies (6, 26). The mechanism is thought to be related with metabolic effects of excess body fat, which can lead to insulin resistance, inflammation, and some other physiological changes that disrupt the normal lipid metabolism (27).
Our study identified family history of dyslipidemia as an independent risk factor for dyslipidemia, which is consistent with several previous studies (9, 28). While the exact mechanisms by which family history of dyslipidemia increases the risk of dyslipidemia are not fully understood, it is believed that genetic factors may play a role (29, 30). Certain genes have been identified that increase the risk of dyslipidemia, including genes that regulate cholesterol metabolism and lipoprotein synthesis (31). In addition, environmental factors may contribute to the association between family history of dyslipidemia and dyslipidemia. Individuals with family members who have dyslipidemia may live in the environment where unhealthy lifestyle behaviors like consuming a diet high in saturated fats, being physically inactive, or smoking were common due to the cultural/social norm (9).
Our study was the first clue to implicate an additive interaction between BMI and family history of dyslipidemia towards dyslipidemia in patients with type 2 diabetes. Specifically, the effect of BMI on dyslipidemia was significantly modified by family history of dyslipidemia. This finding is noteworthy as there are limited studies investigating this interaction. Despite this, our study was consistent with some similar studies. For example, in a previous study conducted on a population of Filipinos, it was observed that the APOA5 Gly185Cys variant had a significant interaction with waist circumference in relation to triglyceride levels and the effects of the variant on plasma triglycerides became more pronounced as the waist circumference increased (32). Several other studies also had indicated that the genetic susceptibility to hypertriglyceridemia is notably exacerbated by obesity, while the advantageous impact of genetic variants that raise HDL-C is diminished (33, 34). Gene–environment interactions may contribute to this interaction effect in our study (35), whereby genetic variants associated with dyslipidemia may interact with environmental factors (such as high-calorie diets and low physical activity) to increase the risk of dyslipidemia in individuals with a high BMI.
Further stratified by status of diabetes control, we found that this interaction was significant among patients with controlled diabetes. However, it was not significant among patients with uncontrolled diabetes. One possible reason is that the uncontrolled diabetes can lead to hypertriglyceridemia due to high dihydroxyacetone phosphate (DHAP) availability (36). The exact mechanism remains to be further studied.
Our study findings hold significant implications for the prevention and management of dyslipidemia among patients with type 2 diabetes. Specifically, individuals with diabetes who have a family history of dyslipidemia and a high BMI should receive close monitoring for dyslipidemia, with prompt interventions implemented to prevent its development. Even in patients with good glycemic control, this should not be ignored. Since the family history is an unmodifiable risk factor, controlling BMI remains a critical strategy for reducing dyslipidemia risk. Lifestyle modifications, such as dietary changes and physical exercise, may be particularly effective in individuals with a family history of dyslipidemia and a high BMI.
Our study had several limitations that need to be acknowledged. Firstly, the self-reporting of family history of dyslipidemia, current cigarette smoking and alcohol drinking by subjects may have introduced information bias. Secondly, the cross-sectional nature of our study limits our ability to establish causality between BMI, family history of dyslipidemia and dyslipidemia in individuals with type 2 diabetes. Thirdly, our study was conducted in a specific population with type 2 diabetes in China, and may not be generalizable to other populations. Future longitudinal studies using larger, more diverse populations are needed to confirm our findings.
Our study uncovered a significant synergistic interaction between high BMI and family history of dyslipidemia in relation to dyslipidemia among individuals with diabetes. This finding highlights the need to account for this interaction when evaluating dyslipidemia risk in the populations with type 2 diabetes. Our study can help to identify more beneficial subgroups for dyslipidemia prevention in the case of limited healthcare resources. Our study could provide clues for future corresponding mechanistic studies regarding these two factors.
The raw data supporting the conclusions of this article will be made available by the authors, without undue reservation.
The studies involving human participants were reviewed and approved by Ethics committee of Shanghai Jiao Tong University Affiliated Sixth People’s Hospital. The patients/participants provided their written informed consent to participate in this study.
X-YC and LF contributed to conception and design of the study. FL and JZ collected the data. X-YC, JZ, and J-JL organized the database. X-YC performed the statistical analysis. X-YC and J-MZ wrote the first draft of the manuscript. All authors contributed to the article and approved the submitted version.
This study was supported by “Zhejiang Provincial Medical Health and Technology Project (2020RC049)” and “Zhejiang Provincial Soft Science Research Program (2022C35013).”
We would like to thank all the staffs from Haining City, Tongxiang City, Keqiao District and Wucheng District for their hard work on providing the data for our study.
The authors declare that the research was conducted in the absence of any commercial or financial relationships that could be construed as a potential conflict of interest.
All claims expressed in this article are solely those of the authors and do not necessarily represent those of their affiliated organizations, or those of the publisher, the editors and the reviewers. Any product that may be evaluated in this article, or claim that may be made by its manufacturer, is not guaranteed or endorsed by the publisher.
1. Ma, R. Epidemiology of diabetes and diabetic complications in China. Diabetologia. (2018) 61:1249–60. doi: 10.1007/s00125-018-4557-7
2. Yan, L, Xu, MT, Yuan, L, Chen, B, Xu, ZR, Guo, QH, et al. Prevalence of dyslipidemia and its control in type 2 diabetes: a multicenter study in endocrinology clinics of China. J Clin Lipidol. (2016) 10:150–60. doi: 10.1016/j.jacl.2015.10.009
4. Srikanth, S, and Deedwania, P. Management of dyslipidemia in patients with hypertension, diabetes, and metabolic syndrome. Curr Hypertens Rep. (2016) 18:76. doi: 10.1007/s11906-016-0683-0
5. Sunil, B, and Ashraf, AP. Dyslipidemia in pediatric type 2 diabetes mellitus. Curr Diab Rep. (2020) 20:53. doi: 10.1007/s11892-020-01336-6
6. Kuwabara, M, Kuwabara, R, Niwa, K, Hisatome, I, Smits, G, Roncal-Jimenez, CA, et al. Different risk for hypertension, diabetes, dyslipidemia, and hyperuricemia according to level of body mass index in japanese and american subjects. Nutrients. (2018) 10:10. doi: 10.3390/nu10081011
7. Yu, L, Xu, X, Yu, W, Chen, L, Zhang, S, Li, Y, et al. The effect of BMI on blood lipids and dyslipidemia in lactating women. Nutrients. (2022) 14:14. doi: 10.3390/nu14235174
8. Ali, HI, Elmi, F, Stojanovska, L, Ibrahim, N, Cheikh, IL, and Al, DA. Associations of dyslipidemia with dietary intakes, body weight status and sociodemographic factors among adults in the United Arab Emirates. Nutrients. (2022) 14:14. doi: 10.3390/nu14163405
9. Filgueiras, MS, Vieira, SA, Ribeiro, AQ, and Novaes, JF. Family history is associated with the presence of dyslipidemia in pre-school children. Rev Paul Pediatr. (2019) 37:41–8. doi: 10.1590/1984-0462/;2019;37;1;00005
10. Marateb, HR, Mohebian, MR, Javanmard, SH, Tavallaei, AA, Tajadini, MH, Heidari-Beni, M, et al. Prediction of dyslipidemia using gene mutations, family history of diseases and anthropometric indicators in children and adolescents: the CASPIAN-III study. Comput Struct Biotechnol J. (2018) 16:121–30. doi: 10.1016/j.csbj.2018.02.009
11. Wiegman, A, Rodenburg, J, de Jongh, S, Defesche, JC, Bakker, HD, Kastelein, JJ, et al. Family history and cardiovascular risk in familial hypercholesterolemia. Circulation. (2003) 107:1473–8. doi: 10.1161/01.cir.0000058166.99182.54
12. Strufaldi, MW, Souza, FI, Puccini, RF, and Franco, MC. Family history of cardiovascular disease and non-HDL cholesterol in prepubescent non-obese children. Rev Assoc Med Bras. (1992) 2016:347–52. doi: 10.1590/1806-9282.62.04.347
13. Hou, XH, Wang, LM, Chen, SY, Liang, YB, Zhang, M, Huang, ZJ, et al. Data resource profile: a protocol of China national diabetic chronic complications study. Biomed Environ Sci. (2022) 35:633–40. doi: 10.3967/bes2022.078
14. Li, Y, Zhao, L, Yu, D, and Ding, G. The prevalence and risk factors of dyslipidemia in different diabetic progression stages among middle-aged and elderly populations in China. PLoS One. (2018) 13:e205709:e0205709. doi: 10.1371/journal.pone.0205709
15. Chen, C, and Lu, FC. The guidelines for prevention and control of overweight and obesity in Chinese adults. Biomed Environ Sci. (2004) 17:1–36.
16. Yan, M, Fu, Z, Qin, T, Wu, N, Lv, Y, Wei, Q, et al. Associations of sleep duration and prediabetes prevalence in a middle-aged and elderly Chinese population with regard to age and hypertension: the China health and retirement longitudinal study baseline survey. J Diabetes. (2018) 10:847–56. doi: 10.1111/1753-0407.12662
17. Fang, L, Gao, P, Bao, H, Tang, X, Wang, B, Feng, Y, et al. Chronic obstructive pulmonary disease in China: a nationwide prevalence study. Lancet Respir Med. (2018) 6:421–30. doi: 10.1016/S2213-2600(18)30103-6
18. Zhu, F, Qin, Y, Bi, Y, Su, J, Cui, L, Luo, P, et al. Fresh vegetable and fruit consumption and carotid atherosclerosis in high-cardiovascular-risk population: a cross-sectional study in Jiangsu, China. Cad Saude Publica. (2021) 37:e33020. doi: 10.1590/01021-311X00033020
19. Classification and diagnosis of diabetes. Standards of medical care in diabetes-2019. Diabetes Care. (2019) 42:S13–28. doi: 10.2337/dc19-S002
20. Tang, N, Ma, J, Tao, R, Chen, Z, Yang, Y, He, Q, et al. The effects of the interaction between BMI and dyslipidemia on hypertension in adults. Sci Rep. (2022) 12:927. doi: 10.1038/s41598-022-04968-8
21. Andersson, T, Alfredsson, L, Kallberg, H, Zdravkovic, S, and Ahlbom, A. Calculating measures of biological interaction. Eur J Epidemiol. (2005) 20:575–9. doi: 10.1007/s10654-005-7835-x
22. Hosmer, DW, and Lemeshow, S. Confidence interval estimation of interaction. Epidemiology. (1992) 3:452–6. doi: 10.1097/00001648-199209000-00012
23. Correia, K, and Williams, PL. Estimating the relative excess risk due to interaction in clustered-data settings. Am J Epidemiol. (2018) 187:2470–80. doi: 10.1093/aje/kwy154
24. Pan, L, Yang, Z, Wu, Y, Yin, RX, Liao, Y, Wang, J, et al. The prevalence, awareness, treatment and control of dyslipidemia among adults in China. Atherosclerosis. (2016) 248:2–9. doi: 10.1016/j.atherosclerosis.2016.02.006
25. Wang, M, Gong, WW, Pan, J, Fei, FR, Wang, H, Yu, M, et al. Incidence and time trends of type 2 diabetes mellitus among adults in Zhejiang Province, China, 2007-2017. J Diabetes Res. (2020) 2020:2597953–9. doi: 10.1155/2020/2597953
26. Izadi, N, Rahimi, MA, Shetabi, HR, Hashemi, NS, and Najafi, F. Dyslipidemia and its components across body mass index levels among type II diabetic patients in the west of Iran. Int J Prev Med. (2020) 11:188. doi: 10.4103/ijpvm.IJPVM_305_18
27. Vekic, J, Zeljkovic, A, Stefanovic, A, Jelic-Ivanovic, Z, and Spasojevic-Kalimanovska, V. Obesity and dyslipidemia. Metabolism. (2019) 92:71–81. doi: 10.1016/j.metabol.2018.11.005
28. Memon, MY, Ali, G, Bukhari, SI, Sandeelo, N, Alvi, H, Talib, A, et al. Dyslipidemia is an independent predictor of rapid progressive disease in patientswith chronic liver disease. J Pharm Res Int. (2022) 34:12–8. doi: 10.9734/jpri/2022/v34i37A36194
29. Liu, CX, Yin, RX, Shi, ZH, Zheng, PF, Deng, GX, Guan, YZ, et al. Associations between TUBB-WWOX SNPs, their haplotypes, gene-gene, and gene-environment interactions and dyslipidemia. Aging (Albany NY). (2021) 13:5906–27. doi: 10.18632/aging.202514
30. Hellstrand, S, Ericson, U, Schulz, CA, Drake, I, Gullberg, B, Hedblad, B, et al. Genetic susceptibility to dyslipidemia and incidence of cardiovascular disease depending on a diet quality index in the Malmo diet and Cancer cohort. Genes Nutr. (2016) 11:20. doi: 10.1186/s12263-016-0536-0
31. Garcia-Giustiniani, D, and Stein, R. Genetics of dyslipidemia. Arq Bras Cardiol. (2016) 106:434–8. doi: 10.5935/abc.20160074
32. Wu, Y, Marvelle, AF, Li, J, Croteau-Chonka, DC, Feranil, AB, Kuzawa, CW, et al. Genetic association with lipids in Filipinos: waist circumference modifies an APOA5 effect on triglyceride levels. J Lipid Res. (2013) 54:3198–205. doi: 10.1194/jlr.P042077
33. Cole, CB, Nikpay, M, Lau, P, Stewart, AF, Davies, RW, Wells, GA, et al. Adiposity significantly modifies genetic risk for dyslipidemia. J Lipid Res. (2014) 55:2416–22. doi: 10.1194/jlr.P052522
34. Cole, CB, Nikpay, M, and McPherson, R. Gene-environment interaction in dyslipidemia. Curr Opin Lipidol. (2015) 26:133–8. doi: 10.1097/MOL.0000000000000160
35. ABE, S, TOKORO, F, MATSUOKA, R, ARAI, M, NODA, T, WATANABE, S, et al. Association of genetic variants with dyslipidemia. Mol Med Rep. (2015) 12:5429–36. doi: 10.3892/mmr.2015.4081
36. Basel-Vanagaite, L, Zevit, N, Zahav, AH, Guo, L, Parathath, S, Pasmanik-Chor, M, et al. Transient infantile hypertriglyceridemia, fatty liver, and hepatic fibrosis caused by mutated GPD1, encoding glycerol-3-phosphate dehydrogenase 1. Am J Hum Genet. (2012) 90:49–60. doi: 10.1016/j.ajhg.2011.11.028
Keywords: body mass index, family history of dyslipidemia, interaction, dyslipidemia, diabetes mellitus
Citation: Chen X-Y, Fang L, Zhang J, Zhong J-M, Lin J-J and Lu F (2023) The association of body mass index and its interaction with family history of dyslipidemia towards dyslipidemia in patients with type 2 diabetes: a cross-sectional study in Zhejiang Province, China. Front. Public Health. 11:1188212. doi: 10.3389/fpubh.2023.1188212
Edited by:
Sathish Thirunavukkarasu, Emory University, United StatesReviewed by:
Jithin Varghese, Emory University, United StatesCopyright © 2023 Chen, Fang, Zhang, Zhong, Lin and Lu. This is an open-access article distributed under the terms of the Creative Commons Attribution License (CC BY). The use, distribution or reproduction in other forums is permitted, provided the original author(s) and the copyright owner(s) are credited and that the original publication in this journal is cited, in accordance with accepted academic practice. No use, distribution or reproduction is permitted which does not comply with these terms.
*Correspondence: Feng Lu, Zmx1QGNkYy56ai5jbg==
Disclaimer: All claims expressed in this article are solely those of the authors and do not necessarily represent those of their affiliated organizations, or those of the publisher, the editors and the reviewers. Any product that may be evaluated in this article or claim that may be made by its manufacturer is not guaranteed or endorsed by the publisher.
Research integrity at Frontiers
Learn more about the work of our research integrity team to safeguard the quality of each article we publish.