 Yu Wang1,2
 Ding Ding
- 1Center of Excellence for Environmental Safety and Biological Effects, Beijing Key Laboratory for Green Catalysis and Separation, Department of Chemistry, Beijing University of Technology, Beijing, China
- 2Institute of Urban Safety and Environmental Science, Beijing Academy of Science and Technology, Beijing, China
- 3School of Energy and Environmental Engineering, University of Science and Technology Beijing, Beijing, China
Introduction: Air pollution imposes a significant burden on public health. Compared with the popular air quality index (AQI), the air quality health index (AQHI) provides a more comprehensive approach to measuring mixtures of air pollutants and is suitable for overall assessments of the short-term health effects of such mixtures.
Methods: We established an AQHI and cumulative risk index (CRI)-AQHI for Tianjin using single–and multi-pollutant models, respectively, as well as environmental, meteorological, and daily mortality data of residents in Tianjin between 2018 and 2020.
Results and discussion: Compared with the AQI, the AQHI and CRI-AQHI established herein correlated more closely with the exposure-response relationships of the total mortality effects on residents. For each increase in the interquartile range of the AQHI, CRI-AQHI and AQI, the total daily mortality rates increased by 2.06, 1.69 and 0.62%, respectively. The AQHI and CRI-AQHI predicted daily mortality rate of residents more effectively than the AQI, and the correlations of AQHI and CRI-AQHI with health were similar. Our AQHI of Tianjin was used to establish specific (S)-AQHIs for different disease groups. The results showed that all measured air pollutants had the greatest impact on the health of persons with chronic respiratory diseases, followed by lung cancer, and cardiovascular and cerebrovascular diseases. The AQHI of Tianjin established in this study was accurate and dependable for assessing short-term health risks of air pollution in Tianjin, and the established S-AQHI can be used to separately assess health risks among different disease groups.
1. Introduction
Rapid economic development and urbanization has led to air pollution becoming the greatest environmental threat to global public health and imposing a huge burden of disease on the public. Data published in 2016 by the World Health Organization (WHO) (1) shows that 4.2 million persons die annually from ambient air pollution worldwide, and 92% of the global population live with air quality standards that exceed those recommended by the World Health Organization (WHO) (2), mainly in Asia and Africa (3). Although the Chinese government has implemented several measures to reduce air pollution, control remains a long-term process. According to the recently published State of Ecology and Environment Report of China 2021 (4), the average concentrations of particulate matter (PM2.5 and PM10), ozone (O3), sulfur dioxide (SO2), nitrogen dioxide (NO2), and carbon monoxide (CO) in China, especially in Beijing-Tianjin-Hebei and surrounding areas were still not optimistic. All these concentrations far exceeded the long-term exposure indexes described in the 2021 Global Air Quality Guidelines published by the WHO (5). These findings showed that persistent air pollution in China is very serious, especially in Beijing-Tianjin-Hebei and surrounding areas. Air pollution adversely affects the health of populations (6–9) and can increase risk of death (10). The burden of disease from air pollution is higher in developing, than in developed countries (11, 12). The public needs to develop awareness of the severity of air pollution and its potential health effects.
The air quality index (AQI) is intended for public use so that individuals are aware of air quality and potential health effects. The AQI uses a simple formula and the data is presented using the well-known ‘traffic light’ scale, making it straightforward for the public to comprehend (13). However, the AQI reflects air quality only as the amount of a pollutant with the highest subindex without considering the possible combined effects of simultaneous exposure to multiple pollutants and ignoring variations in the characteristics of relationships between health outcomes and air pollutants in different countries or regions (13). Therefore, the index does not reflect the non-threshold concentration response relationship between air pollutants and health risks (14–16). To address the shortcomings of the AQI, the concept of an air quality health index (AQHI) was first proposed in Canada to assess the effects of multiple air pollutants on health and to assess air quality (17). The AQHI has subsequently been investigated in Shanghai (18, 19), Guangzhou (15), Tianjin (20), and Hong Kong (21), China. Du et al. (22) analyzed exposure-response relationships between multiple air pollutants and daily mortality rates in 272 representative cities in China, and established a national AQHI based on PM2.5, O3, and NO2. Others have suggested that because the AQHI is calculated by directly adding excess risk using single pollutant models, the impact of pollutants might be overestimated (23, 24). This issue has been addressed by introducing the cumulative risk index (CRI) to establish the CRI-AQHI (25, 26). The AQHI seems to correlate more closely with health outcomes than the AQI, and provides a more comprehensive method of measuring mixtures of several air pollutants, allowing for a holistic assessment of their effects on health (27). Accumulated time-series and case-crossover studies have provided strong evidence of the acute health effects of air pollution (28, 29). In addition, individuals in populations respond differently, even when exposed to the same amount of air pollution. Exploring the effects of air pollution on the health of populations with various diseases is important to develop an in-depth under-standing of the mechanisms of air pollution health hazards and strategies for population-based prevention.
Air quality is affected by factors including seasons, time, geographic locations and weather changes. Therefore, identifying ambient air pollution levels, and effectively communicating the significance of air pollution to public health are hot spots for epidemiological research. The relationship between air pollution and health risk varies greatly among regions and times. Thus local AQHIs should be established instead of directly applying the results of other cities or earlier AQHI studies. This would help to cope more effectively with the regional complexity and variability of air pollutants and to ensure that AQHI results faithfully reflect the impact of local air quality on public health.
2. Methodology
2.1. Study area
Air pollution in the Beijing-Tianjin-Hebei region has become an extremely serious problem. The rapid development of the Chinese economy has led to this region becoming the capital economic circle of China. It has a strong industrial base and a developed commodity economy, and Tianjin is the most important industrial city in the region. It is representative of cities where the air is so polluted that it confers great risk on the health of the population. An AQHI has been established for Tianjin using principal component analysis (PCA) of data from 2014 to 2017 (20). However, it did not consider varied levels of susceptibility of different populations toward air pollution hazards and a stratified analysis of various disease groups was not included. Tianjin formulated an action plan (2018–2020) for ecological environmental protections to accelerate improvements in the quality of local ambient air (30). Therefore, a locally applicable exposure-response relationship model is needed based on recent health data and air pollution data in Tianjin to reconstruct its AQHI. The effects of air pollution on the health of populations with various diseases should be analyzed to understand the health risks of air pollution.
2.2. Data sources
Average daily concentrations of air pollutants (PM2.5, PM10, O3, SO2, NO2, and CO) at various monitoring sites in Tianjin during 2018–2020 were obtained from the China National Environmental Monitoring Station. The daily air pollutant concentrations were calculated by taking the average of the data collected from the 15 monitoring stations in Tianjin. Daily meteorological data for Tianjin were obtained from the National Meteorological Observing Station in Tianjin Urban district, including daily maximum, minimum, and average temperatures (AVET; °C) and daily average relative humidity (AVEH; %). Daily mortality data for Tianjin residents during the study period were obtained from the Chinese Center For Disease Control And Prevention (CCDC) Cause of Death Reporting System, including sex, age, location, and underlying cause of death. The International Classification of Diseases (ICD) codes were A00-R99, and S00-Z99 were excluded. The ICD codes of cardiovascular diseases, lung cancer, and chronic respiratory diseases were I00-I99, C33-C34, and J30-J98, respectively. AQI data were obtained from the website.1
The data were then integrated, anomalies were removed. For the pollutant data, the missing data were identified and generated via linear interpolation. The number of deaths resulting from Covid-19 was deleted from non-accidental death data. Considering that PM2.5 is more hazardous to humans, we selected PM2.5 as the representative particulate matter.
2.3. Statistical analysis
We used Spearman correlations method for the descriptive analysis. We used the Generalized Additive Model (GAM), which is a time series analysis, to estimate the exposure-response relationship between air pollutant concentrations and daily mortality rates in Tianjin. By fitting air pollutants and confounders of unknown forms through parametric and non-parametric methods, respectively, the GAM controlled confounding factors of non-linear relationships associated with death caused by temperature and humidity through smoothing functions. We introduced the control variables of date, temperature, humidity and day of the week as confounders in the GAM. We established an AQHI for Tianjin using single- and multi-pollutant models, respectively, and health and air pollution data from Tianjin between 2018 and 2020. We then used our AQHI for Tianjin to analyze populations with different diseases.
2.3.1. Single-pollutant model
2.3.1.1. Exposure-response relationship
The dependent variable in the single-pollutant model was the daily mortality rate of the population, which follows a Poisson distribution relative to the entire population or time period. Thus, the quasi-Poisson distribution is linked to the GAM to solve the problem of overdispersion of the mortality rate. The following base function was established by Eq. 1 (16):
where E(Yt) is the predicted daily mortality of the population on observation day t, Zt is the level (μg/m3) of a pollutant on observation day t, β is the exposure-response relationship coefficient, namely, the daily change in mortality caused by each unit increase in the pollutant, and time is the date variable, which can effectively control long-term and seasonal fluctuations in pollution-mortality series data by choosing an appropriate degree of freedom (ν) for a specific date. Sensitivity was analyzed using the Qian etc. (31) and Welty and Zeger (32) approaches, with the annual degree of freedom identified as 8. DOW is a dummy variable, namely the effect of the day of the week, which eliminates the impact of short-term natural fluctuations in mortality; ns is the natural smoothing spline function, and ν is the degree of freedom. It deals with non-linear trends and serial correlations of daily mortality counts along a time axis. That is, confounding factors related to long-term variability over time including long-term trends and meteorological factors are controlled. Xt represents meteorological factors on day t, including daily average temperature (°C) and relative humidity (%), with the degrees of freedom of the smoothing function set to 3 during the study (31, 32).
Considering the lagged effect of air pollutants on health, we further examined the effect of air pollutants with different lag structures of single-day lag (distributed lag from Lag0 to Lag7).
Exposure-response relationships were established for each disease (cardiovascular diseases, lung cancer, and chronic respiratory disorders). We analyzed health risk for populations with different types of diseases based on daily mortality data of residents. The effects of each pollutant on the total daily mortality rate of populations with different diseases was calculated through GAM, that is, the increase in the total daily mortality rate of populations with different types of diseases caused by 10 μg/m3 increments in pollutant concentrations.
We further investigated the effects of each air pollutant on the health of different populations. We initially calculated their contributions to the increased daily mortality of different populations based on the relationships between the effects of air pollutants on the total daily mortality of populations with different types of diseases in Tianjin and the daily air quality data between 2018 and 2020.
2.3.1.2. Excess rate
With zero air pollutants as the base point, the exposure-response relationship model was used to derive the health exposure-response coefficients of major air pollutants and calculate excess mortality rates caused by daily levels of each pollutant during the studied period using the Eq. 2:
where ERkt is excess mortality caused by pollutant k on day t, β is the coefficient of the exposure-response relationship estimated by regression models (incremental daily mortality caused by each unit increase in a pollutant), and Pkt is the average concentration of pollutant k on day t.
The Tianjin air quality health index was established based on excess mortality caused by an increase in the concentration of a unit pollutant calculated by Eq. 3:
2.3.2. Multi pollutant model
2.3.2.1. Cumulative risk index
The CRI, originally proposed by Lippmann etc. (33), represents the relative risk of a 1-unit increase in all pollutants versus no increase in any pollutant. Based on the assumption of an additive effect of combined pollutant exposure on mortality, the CRI was calculated by applying a multi-pollutant generalized additive model (GAM) with Eqs. 4, 5:
where CRIt is the cumulative risk of multiple pollutants on day t.
2.3.2.2. Excess rate
The rate of excess mortality caused by daily air pollutant mixtures during the study period was then calculated by Eq. 6:
where ERt is the excess mortality rate caused by the air pollution mixture on day t. The CRI-AQHI is subsequently calculated in the same way as the standard AQHI.
2.3.3. Air quality health index construction
Since the AQHI is a composite indicator of multiple air pollutants, selecting the appropriate pollutant as the primary indicator to establish the AQHI is critical. Which pollutants should be included when establishing AQHIs for different regions has not reached consensus. Early studies mostly used two to three pollutants to evaluate health effects (31, 34–36). In Canada (16) and China (22), AQHIs were established based on PM2.5, NO2, and O3. The AQHI for Shanghai (18) included PM10 or PM2.5 and NO2, whereas that for Guangzhou (15) included PM2.5, SO2, NO2, and O3. The main reason for this is that the composition of multiple air pollutants and population susceptibility differs among regions (15).
In order to evaluate the exposure-response relationships between multiple air pollutants and health risks, we constructed an AQHI for Tianjin by using two types of methods: the standard single pollutant model and a multi-pollutant model that includes a cumulative risk index (CRI).
We selected the regression coefficient β and the pollutant concentration on the best lag days to construct the AQHI for Tianjin, the construction results were as follows Eq. 7:
Referring to the single-pollutant model, we selected the best lag days for each air pollutant, and the multi-pollutant GAM was applied to construct the CRI-AQHI of Tianjin, the construction results were as follows Eq. 8:
To further investigate the effects of air pollutant on the health of different disease groups, we constructed the S-AQHI for different disease groups in Tianjin, the construction results were as follows Eqs. 9–11:
Lung cancer
Cardiovascular disease
Chronic respiratory disease.
2.4. Validity analysis of the AQHI
The daily AQI and AQHI for the study period were descriptively analyzed using the indicators, mean, standard deviation, minimum, maximum, lower quartile (P25), median (P50), upper quartile (P75) and IQR. The differences between the two indices were then compared. The daily values of the AQI and AQHI during the study period were incorporated into separate time series models and the relative degree of daily variation in the AQI and AQHI differed. Thus, we used IQR as a scale to determine the ability of the AQI and AQHI to predict health hazards and to assess the validity of the AQHI.
3. Results
3.1. Health effects of air pollutants in Tianjin
Supplementary Table S1 shows the environmental data collected at national monitoring stations, as well as meteorological, and health data for Tianjin for the period 2018–2020. The environmental data showed that the annual average concentrations of PM10, PM2.5, O3, and NO2, were 78.74 μg/m3, 50.31 μg/m3, 123.74 μg/m3and 41.95 μg/m3, respectively, all of which far exceeded the long-term exposure targets proposed in the 2021 edition of the WHO Global Air Quality Guidelines (5). In terms of domestic standards, the annual average concentrations of PM10, PM2.5, and NO2, exceeded the Grade 2 national standards for annual average concentrations (70 μg/m3, 35 μg/m3, and 40 μg/m3). Figure 1 shows correlations between air pollutants and meteorological factors in Tianjin. PM10, PM2.5, SO2, CO, and NO2 significantly and positively correlated (p < 0.05). O3 was significantly positively correlated with daily average temperature, while PM10, PM2.5, CO, SO2, and NO2 were all negatively correlated with daily average temperature. PM2.5, CO, and O3 were all positively correlated with daily average humidity.
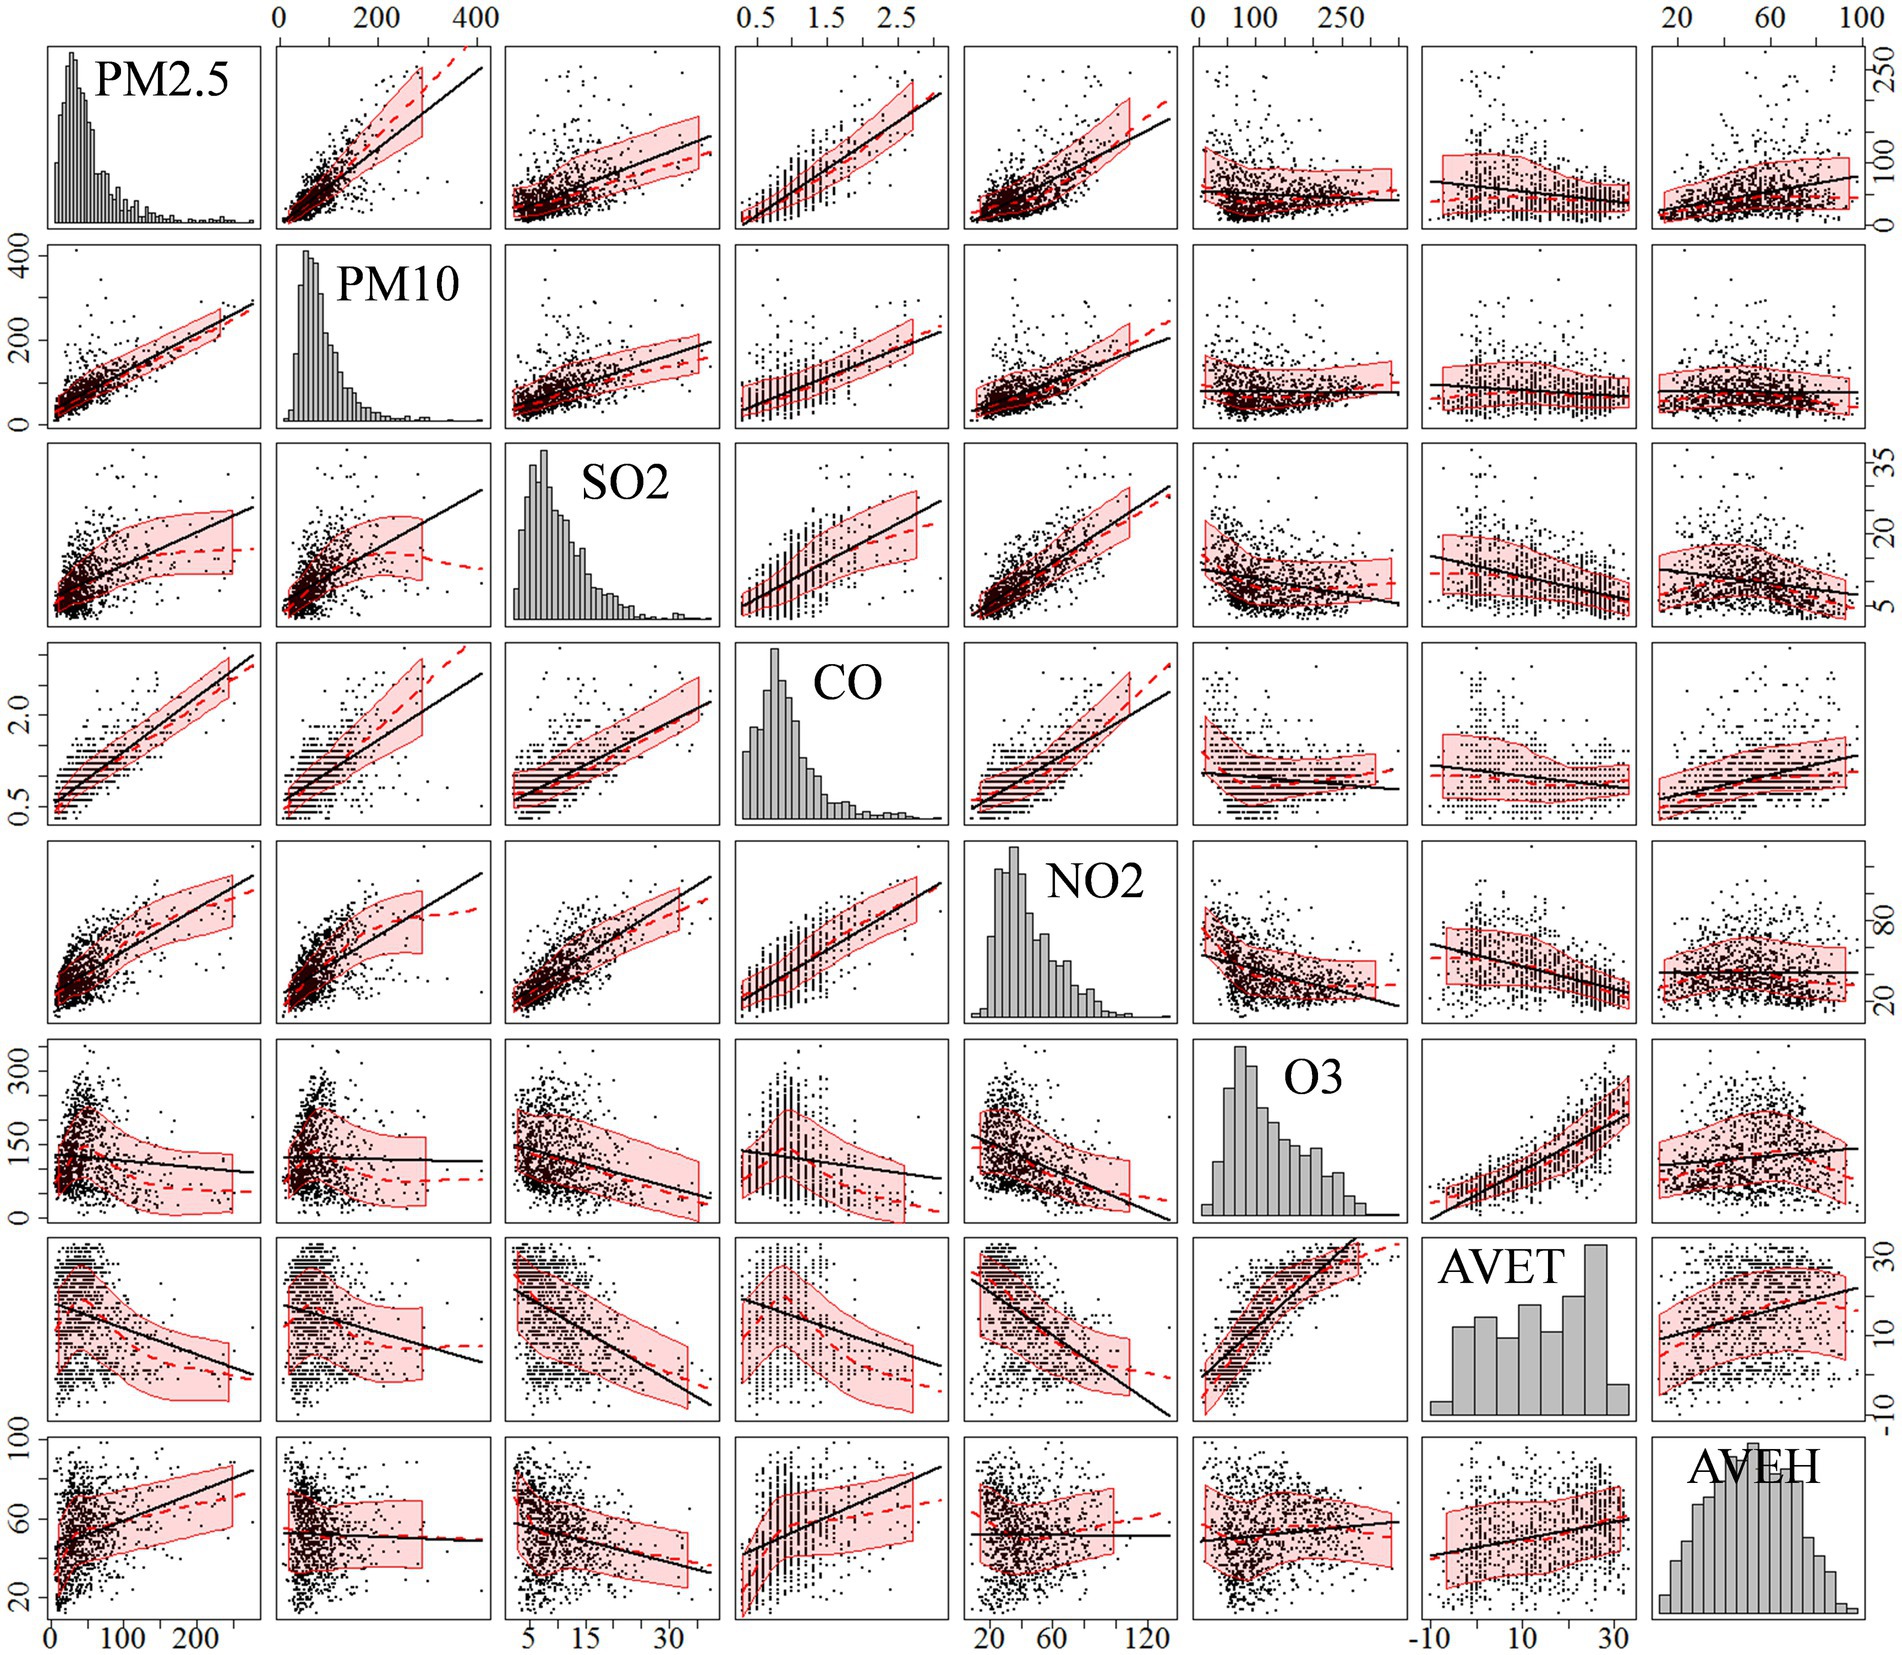
Figure 1. Correlation matrix analysis of environmental variables in Beijing from 2018 to 2020.
Figure 2 shows that the exposure-response relationship between SO2 and non-accidental mortality rate is largely linear; CO, NO2 and O3 positively correlated with the non-accidental mortality rate; PM10 and PM2.5 have largely monotonically increasing exposure-response relationships with non-accidental mortality rates in the P75 concentration range (96.9 μg/m3 and 61.3 μg/m3), indicating that PM10 and PM2.5 positively correlated with the non-accidental mortality rate. The overall fluctuation of the CO concentration was small with little effect, and was not selected. We finally established the AQHI based on the air pollutants, PM2.5, NO2, SO2, and O3.
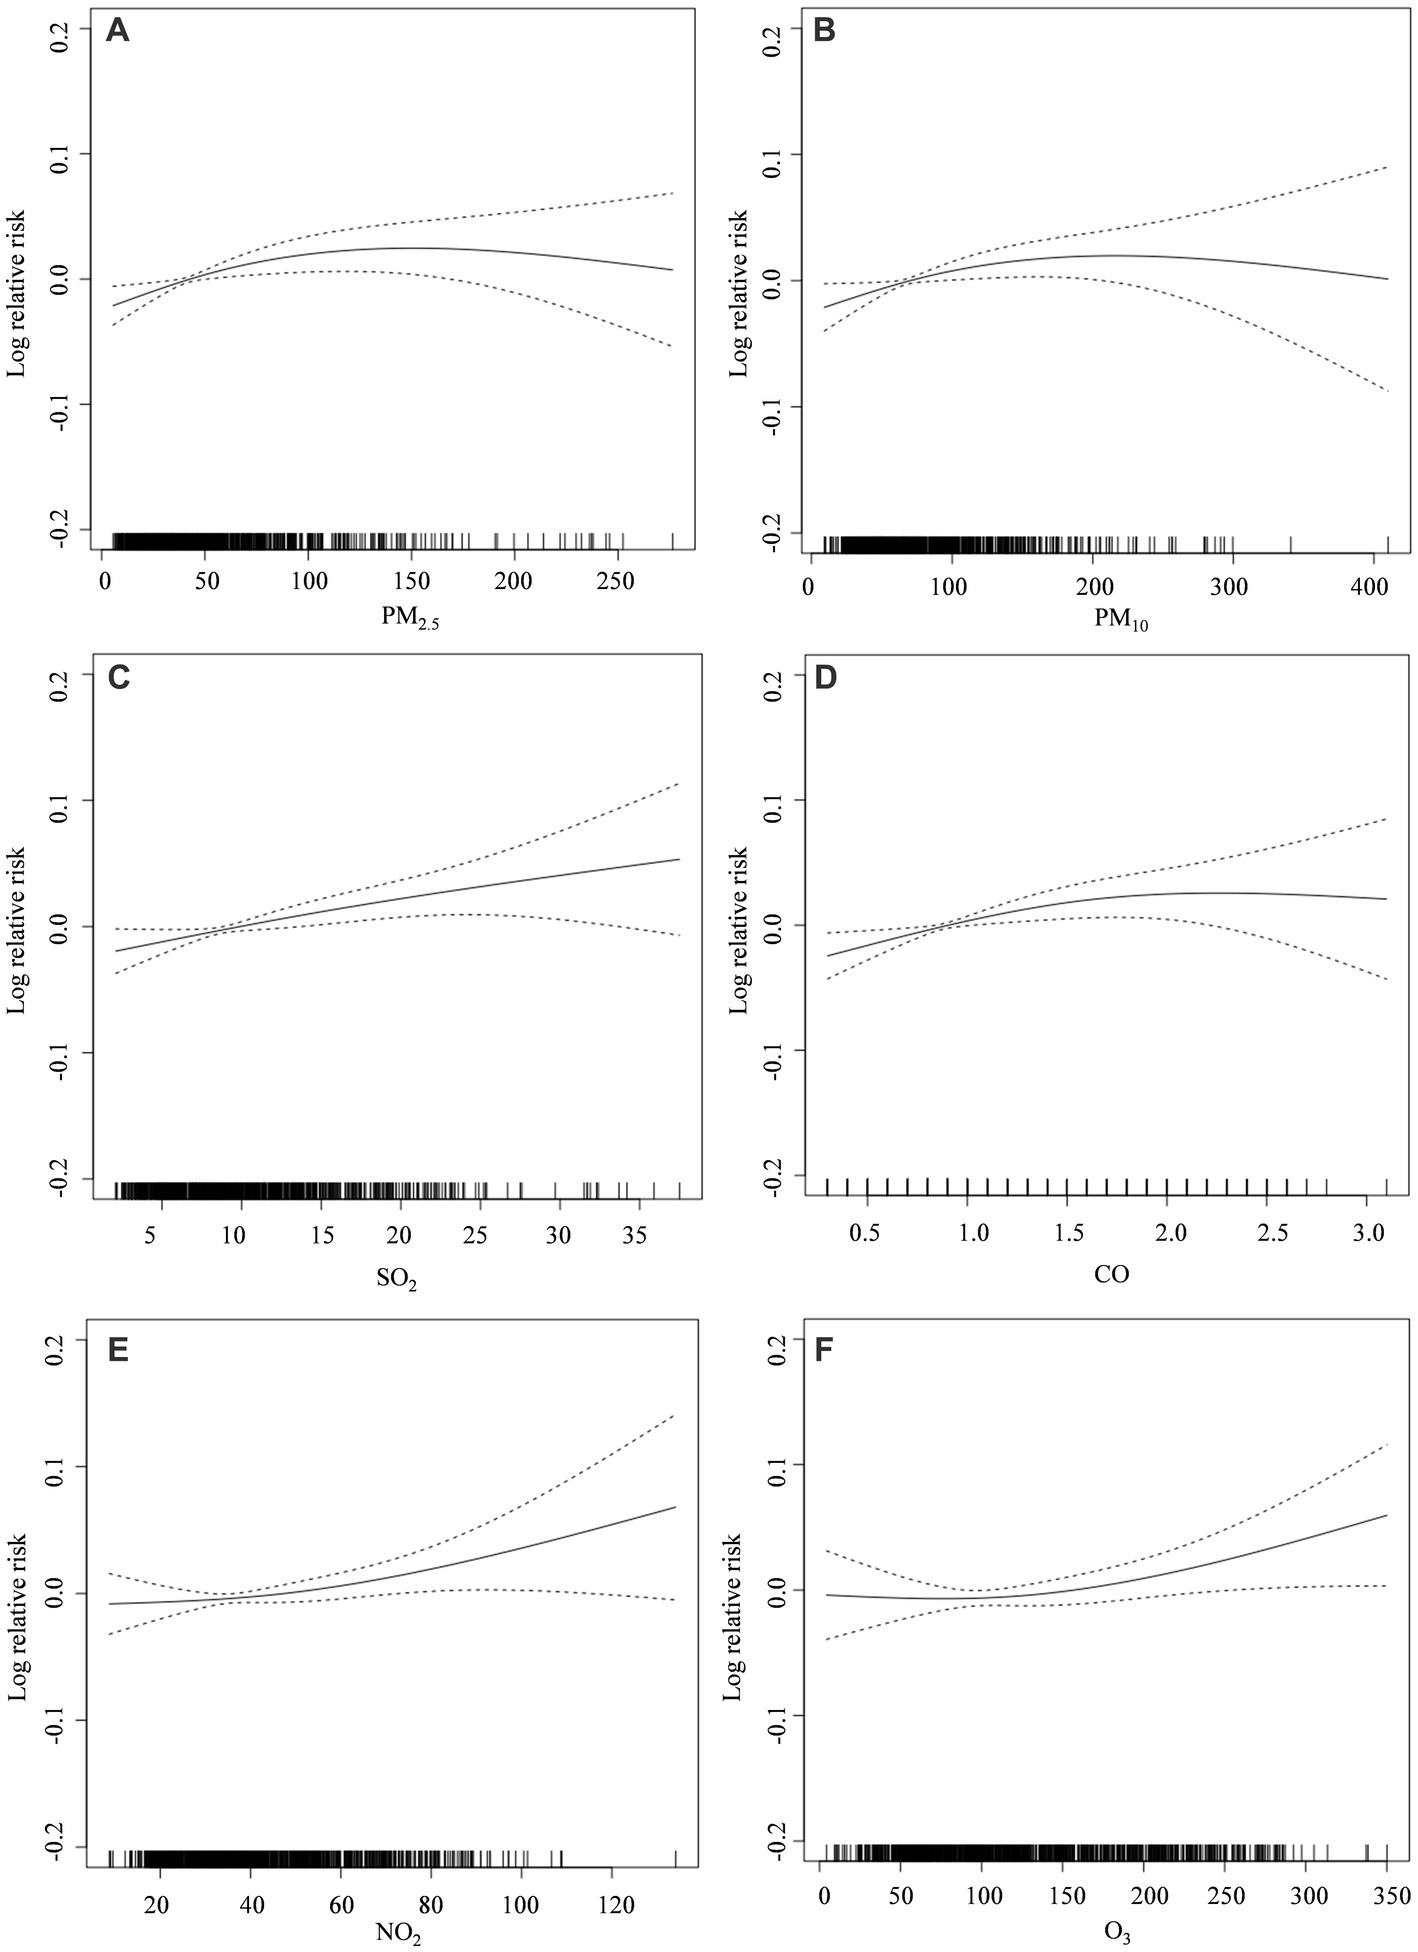
Figure 2. Exposure–response relationship graph of air pollutant concentrations and non-accidental mortality in Tianjin (2018–2020): (A) PM2.5; (B) PM10; (C) SO2; (D) CO; (E) NO2; (F) O3. The solid line represents the log relative risk of mortality, and the dashed lines represent the 95% confidence interval of the log relative risk.
3.2. Construction results analysis of the Tianjin AQHI
Figure 3 shows the results of the exposure-response relationship between each air pollutant and daily mortality in Tianjin between 2018 and 2020. The position and length of the line segments in the figure indicate changes (%) in total daily mortality rates of the population caused by 10 μg/m3 increments in the concentration of each air pollutant and the 95% CI. The figure shows that the maximum lagged effect of PM2.5, NO2, and SO2, occurs on the same day (lag 0), and that the maximum lagged effect of O3 is lag 1.
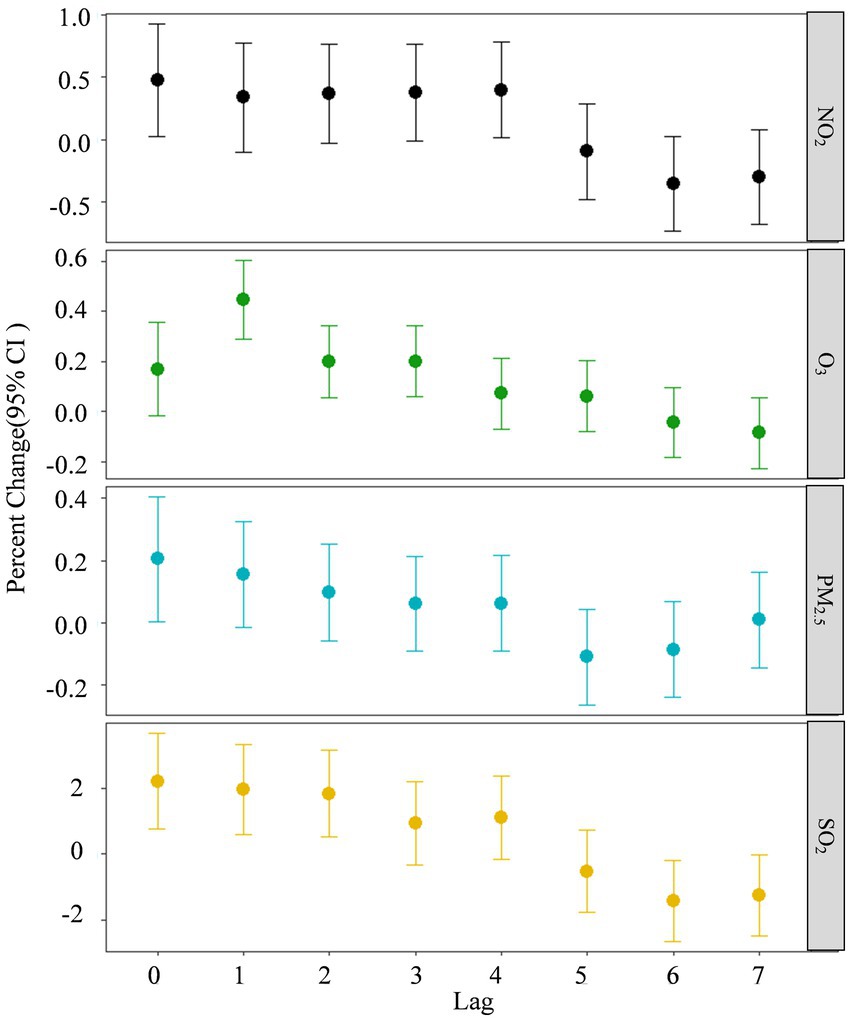
Figure 3. Exposure-response relationships between four air pollutants and daily mortality rates in Tianjin 2018–2020. Lag 0 is the current day, and lags 1–7 represent lags of 1–7 days, respectively.
Supplementary Figure S1 shows the daily trends of each air pollutant, mortality AQI and the AQHI of Tianjin for 2018–2020. The figure shows clear seasonal variations in PM2.5, SO2, NO2, and O3, whereas the trends of AQHI and CRI-AQHI were not the same as those of the air pollutant concentrations.
The AQHI of Tianjin established herein used daily mortality data of residents and was thus consistent with the AQHI of Canada, where the AQHI featured a significant right-skewed, rather than normal distribution, and the frequency of AQHI greater than or equal to 7 was less than 10%. Therefore, referring to the Canadian grading standard, the AQHI classifies air quality into levels from 1 to 10, with higher values associated with increased health risks (Table 1).
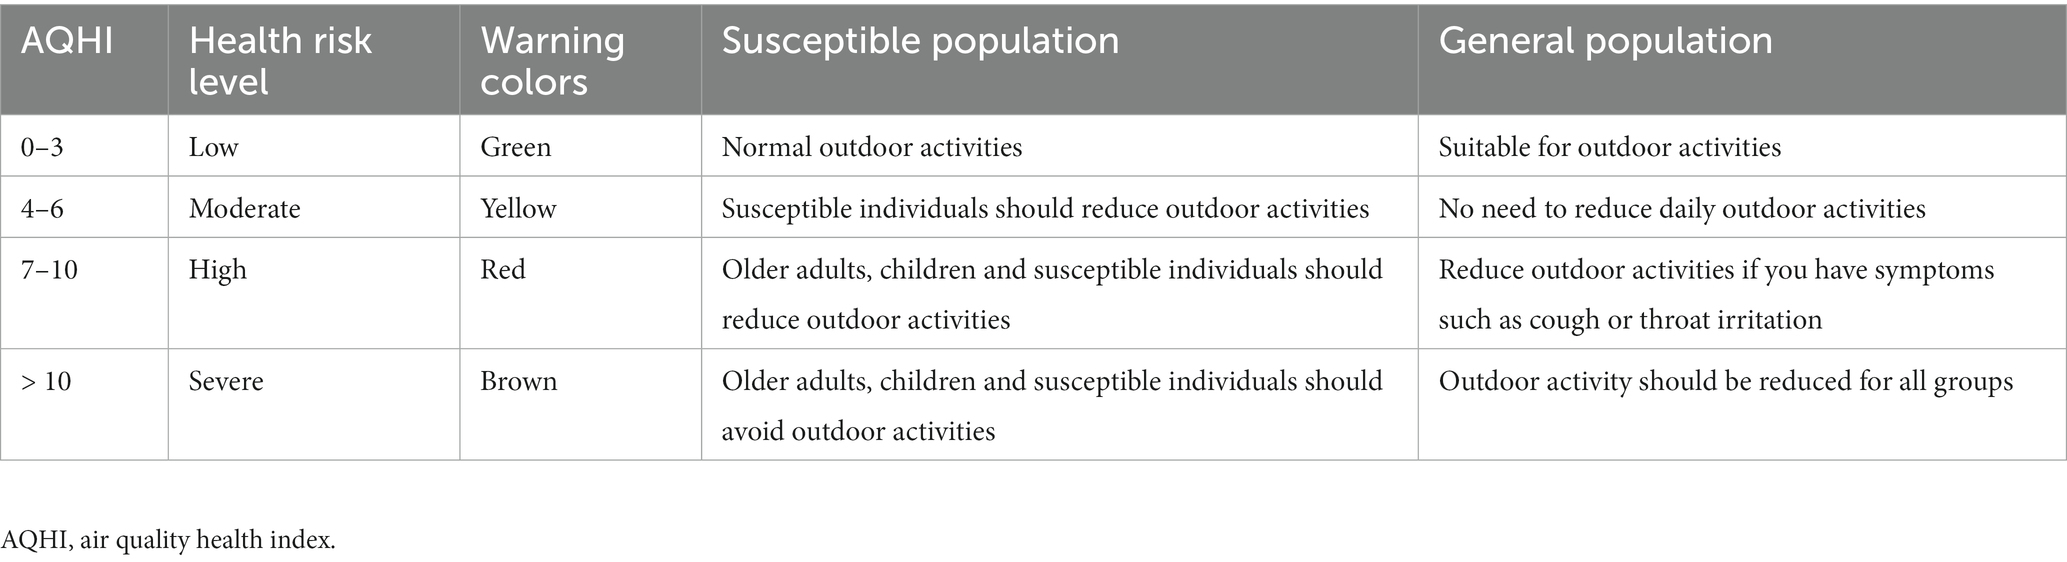
Table 1. AQHI classification standards.
3.3. Validity analysis of the AQHI
We validated the effectiveness of AQHI and CRI-AQHI by comparing them with the AQI. Table 2 shows the statistical results of the daily AQI, AQHI and CRI-AQHI for Tianjin between 2018 and 2020. The P50 values for AQI, AQHI, and CRI-AQHI were 72, 3.76, and 3.72, respectively, and their IQRs were 36, 1.85, and 2.13, respectively.
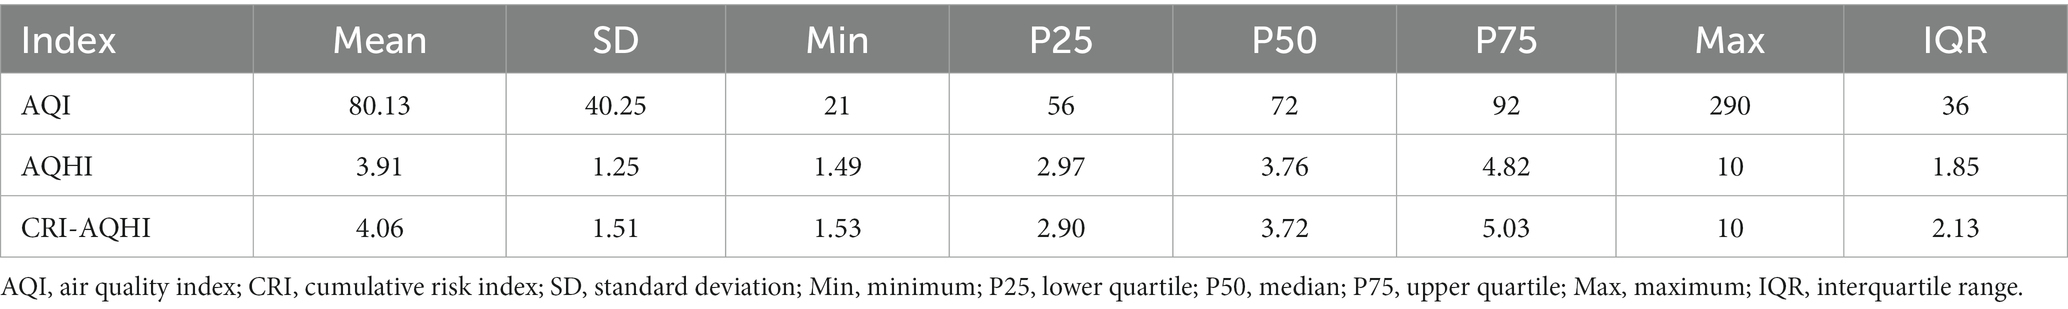
Table 2. Comparative statistics of the AQI and AQHI in Tianjin from 2018 to 2020.
Figure 4 shows correlations between AQHI and AQI. The Spearman correlation coefficients of AQHI and CRI-AQHI with AQI were 0.63 and 0.43, respectively (both p < 0.01), which confirmed the correlation and thus the applicability of AQHI for air quality and health impact assessment. The Spearman correlation coefficient of AQHI and CRI-AQHI was 0.94 (p < 0.01), which was significant. Figure 5 shows the results of an analysis of the exposure-response relationship between the AQHI and AQI with total mortality rate for the day. The exposure-response relationship between increasing AQHI and CRI-AQHI indices and increased risk of total resident mortality was essentially linear.
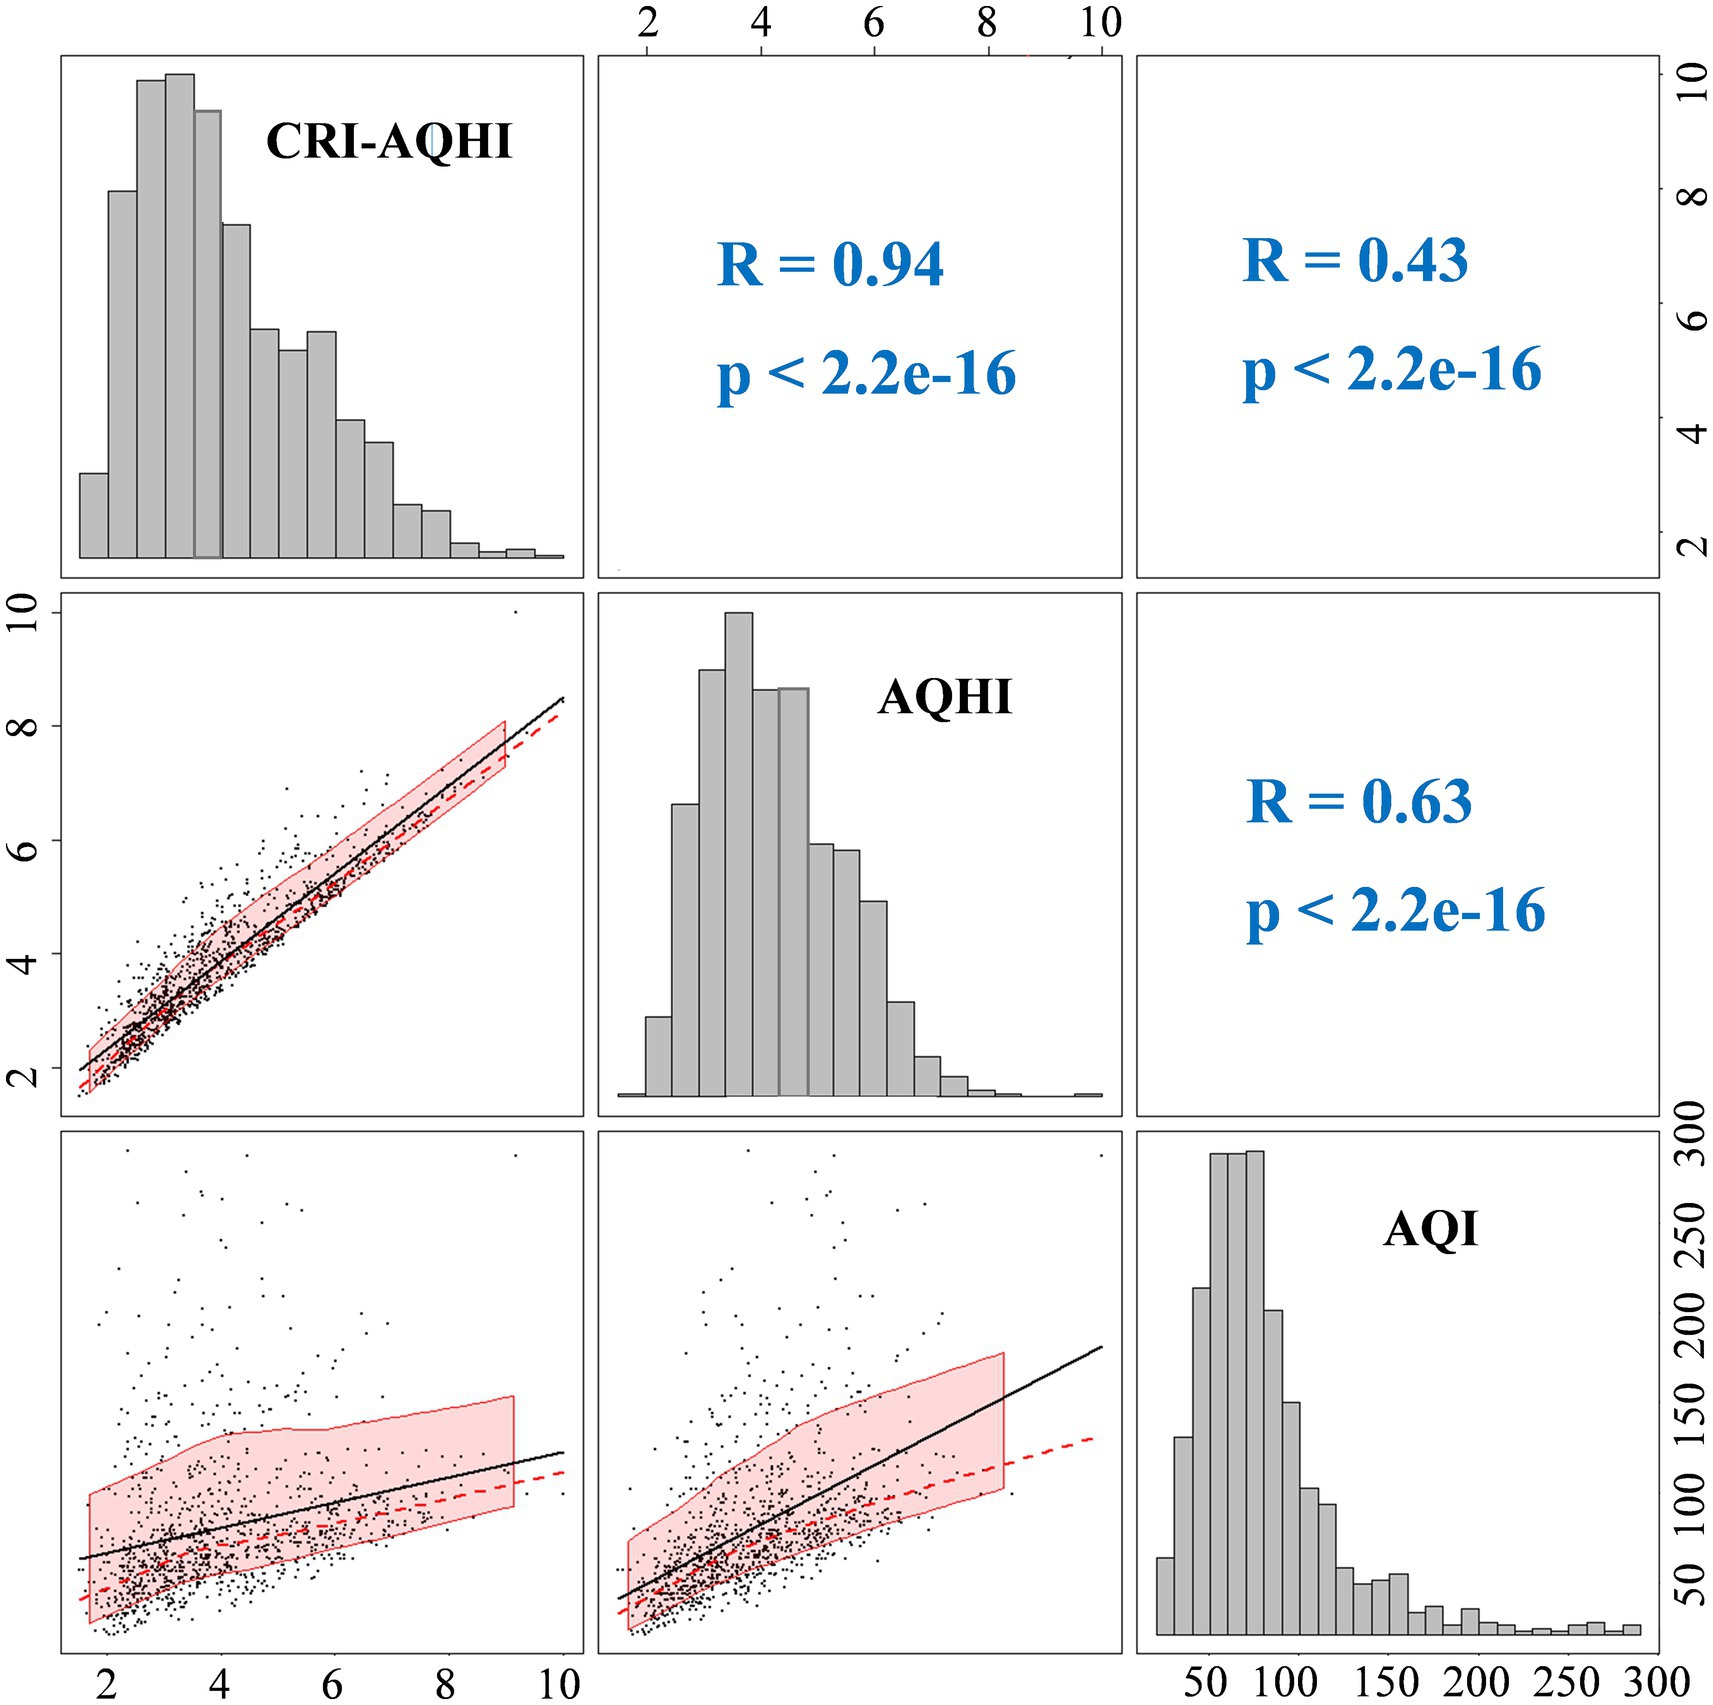
Figure 4. Correlation analysis of AQHI and AQI.
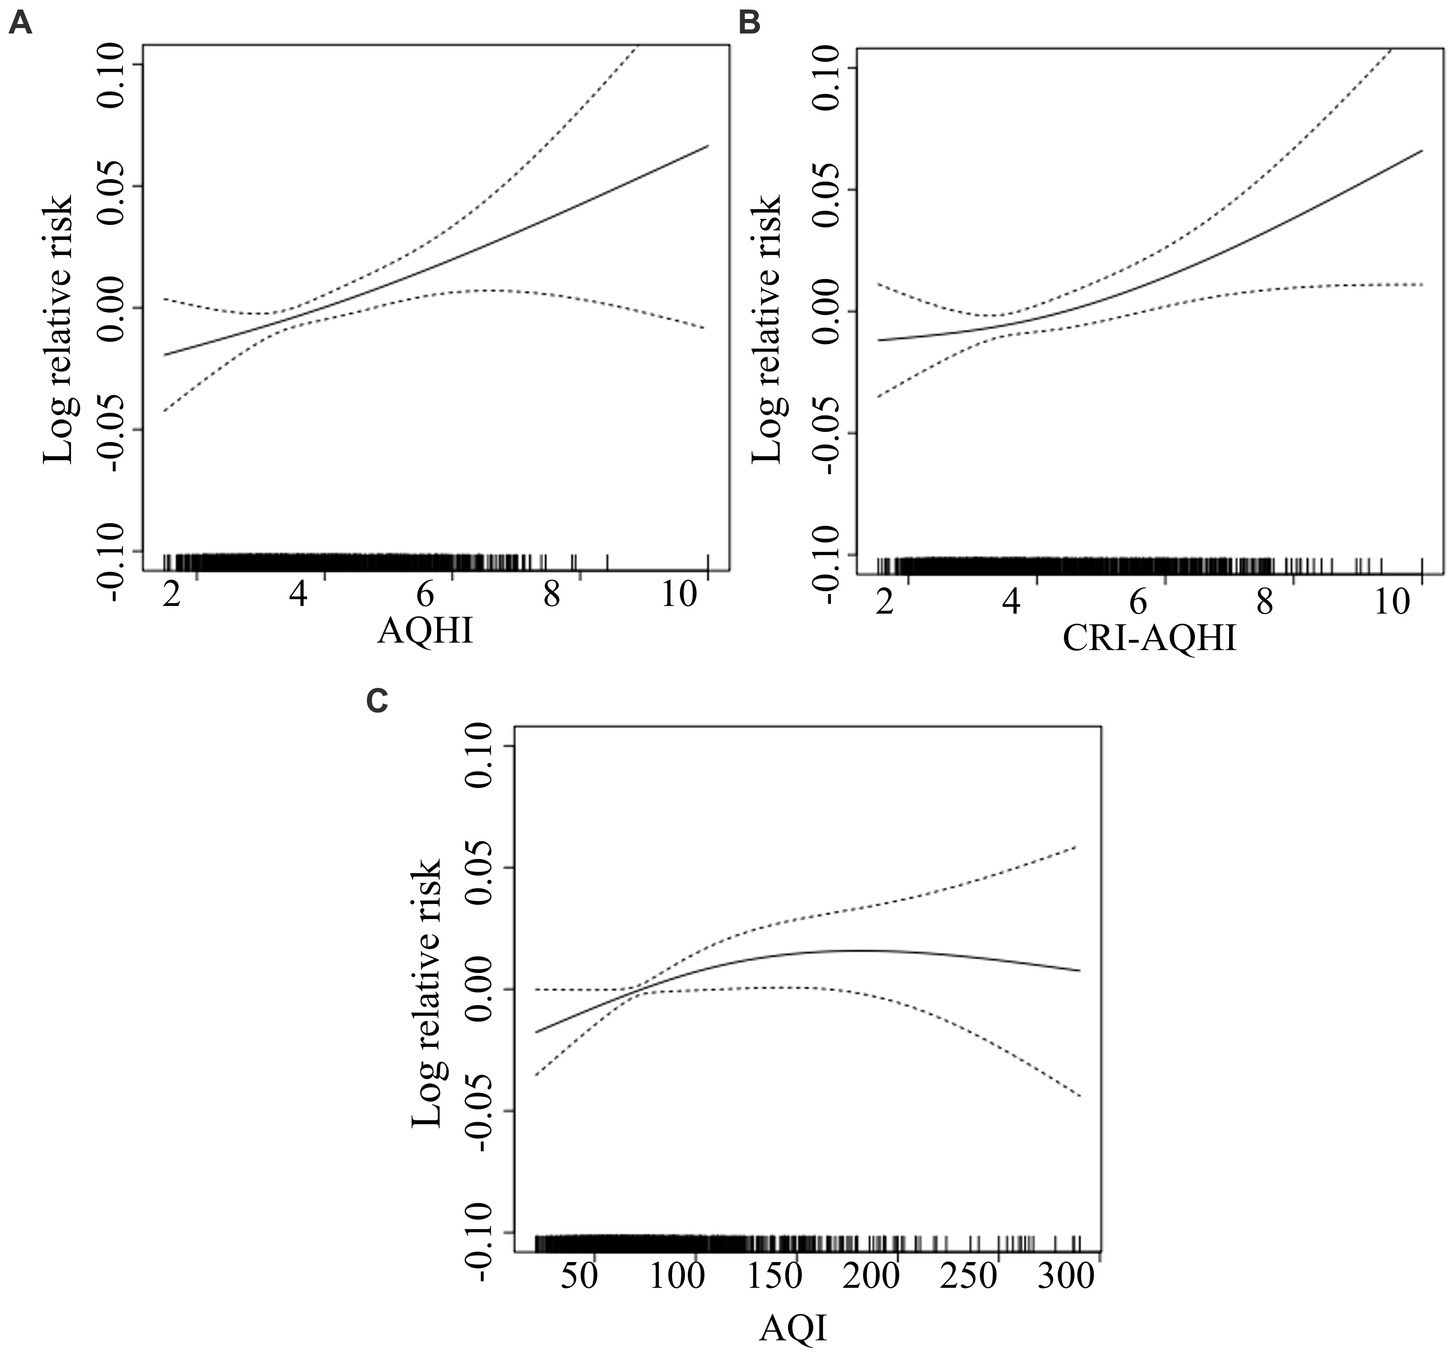
Figure 5. Exposure-response relationship curves of effects of AQHI (A) CRI-AQHI (B), and AQI (C) on total population mortality.
The daily values of AQHI, CRI-AQHI and AQI between 2018 and 2020 were separately incorporated into the time series model. Due to different levels of daily relative changes in AQHI, CRI-AQHI and AQI, we measured their ability to predict health hazards based on IQRs. Figure 6 shows that each increase in the IQR of the AQHI and CRI-AQHI values caused an increase in the total mortality rate of 2.06 and 1.69% on a specific day in Tianjin and correspondingly, each increase of IQR in the AQI resulted in a much lower excess mortality rate of 0.62%. Furthermore, correlations between each of AQHI and CRI-AQHI and health did not significantly differ. Therefore, we selected the coefficients of the single-pollutant model when establishing the AQHI of Tianjin to maintain comparability with previous AQHI findings.
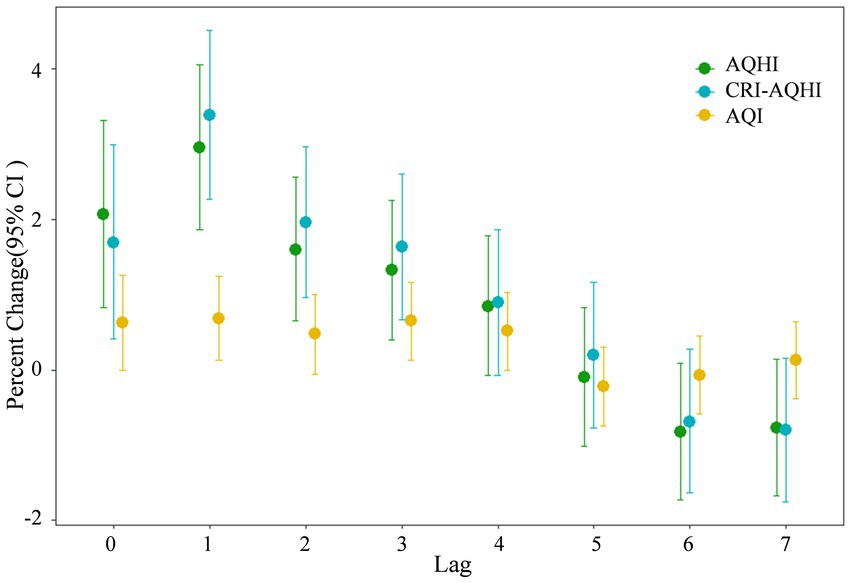
Figure 6. Comparison of correlations between daily mortality and each of AQHI and AQI in Tianjin 2018–2020.
3.4. Application of AQHI to populations with different types of diseases in Tianjin
3.4.1. Analysis of exposure-response relationship in populations with different types of diseases
We investigated the relationship of the best lagged data of air pollutants in Tianjin with the total daily mortality rate of populations with different types of diseases based on the results of a time series analysis (Table 3).
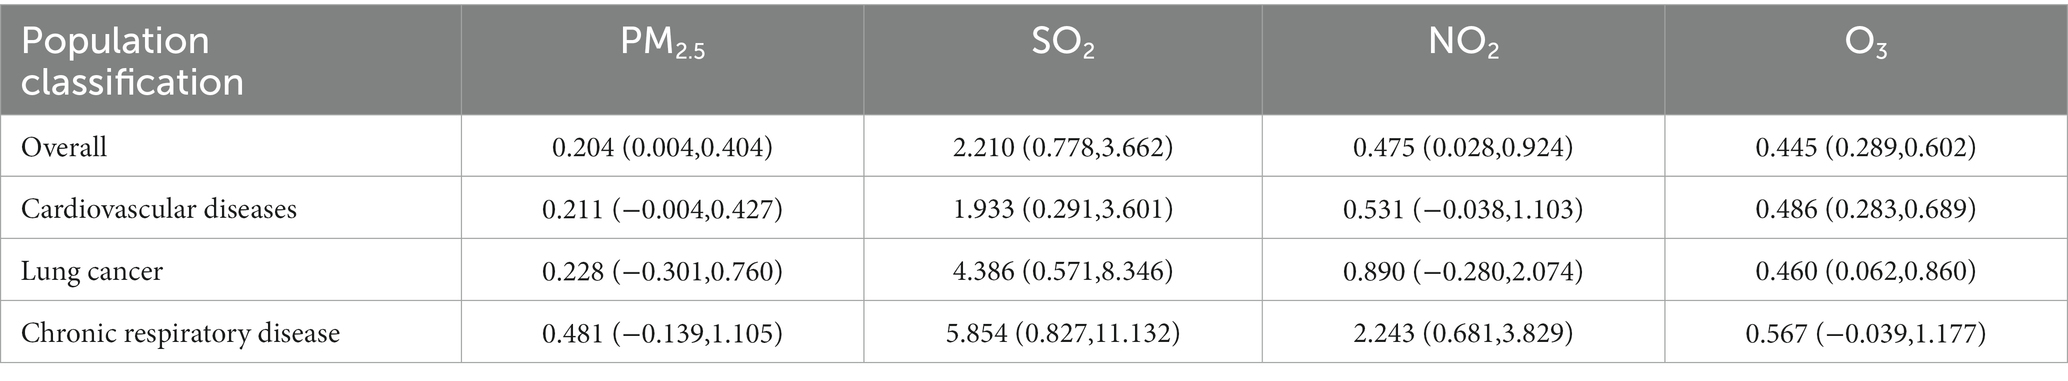
Table 3. Effects of air pollutants on the total daily mortality rate of groups with different types of diseases in Tianjin (%).
Table 3 shows that the effects of PM2.5, SO2, NO2, and O3 on total daily mortality differed among the types of diseases. The effects of PM2.5, SO2, NO2, and O3 on populations with chronic respiratory diseases and lung cancer were stronger than those for the entire population, and the effects of PM2.5, NO2, and O3 on those with cardiovascular and cerebrovascular diseases were stronger than those for the entire population.
Figure 7 shows the contributions of each air pollutant to increased daily mortality among different populations in Tianjin 2018–2020. According to the figure, for the total population, the total contributions of each air pollutant to increased daily mortality were 4.19–27.21%. For the populations with cardiovascular and cerebrovascular diseases (CD), lung cancer (LC), and chronic respiratory diseases (CRD), the total contributions to increased daily mortality were 4.28–28.24%, 5.94–39.73%, and 9.25–71.10%. The effects of each air pollutant on the health of populations with chronic respiratory disease, lung cancer and cardiovascular disease were more significant than those of the whole population. During the summer (June to August), the contribution of O3 (the yellow part in the Figure 7) to the daily mortality rate of different populations significantly increased. The health effects of increased O3 concentrations during the summer were significantly higher. SO2 contributed the highest proportion to the increase in daily mortality rate of lung cancer populations, ranging from 6.86 to 69.24%. And the proportion of SO2 contributions to the increase in daily mortality rates of the total populations, cardiovascular and cerebrovascular diseases populations, and respiratory diseases populations were 4.00–59.85%, 3.24–54.69%, and 6.03–59.62%. Compared with other populations, NO2 and PM2.5 had greater contributions to the increase in daily mortality rate in chronic respiratory diseases populations, with an average of 9.47 and 2.43%, respectively.
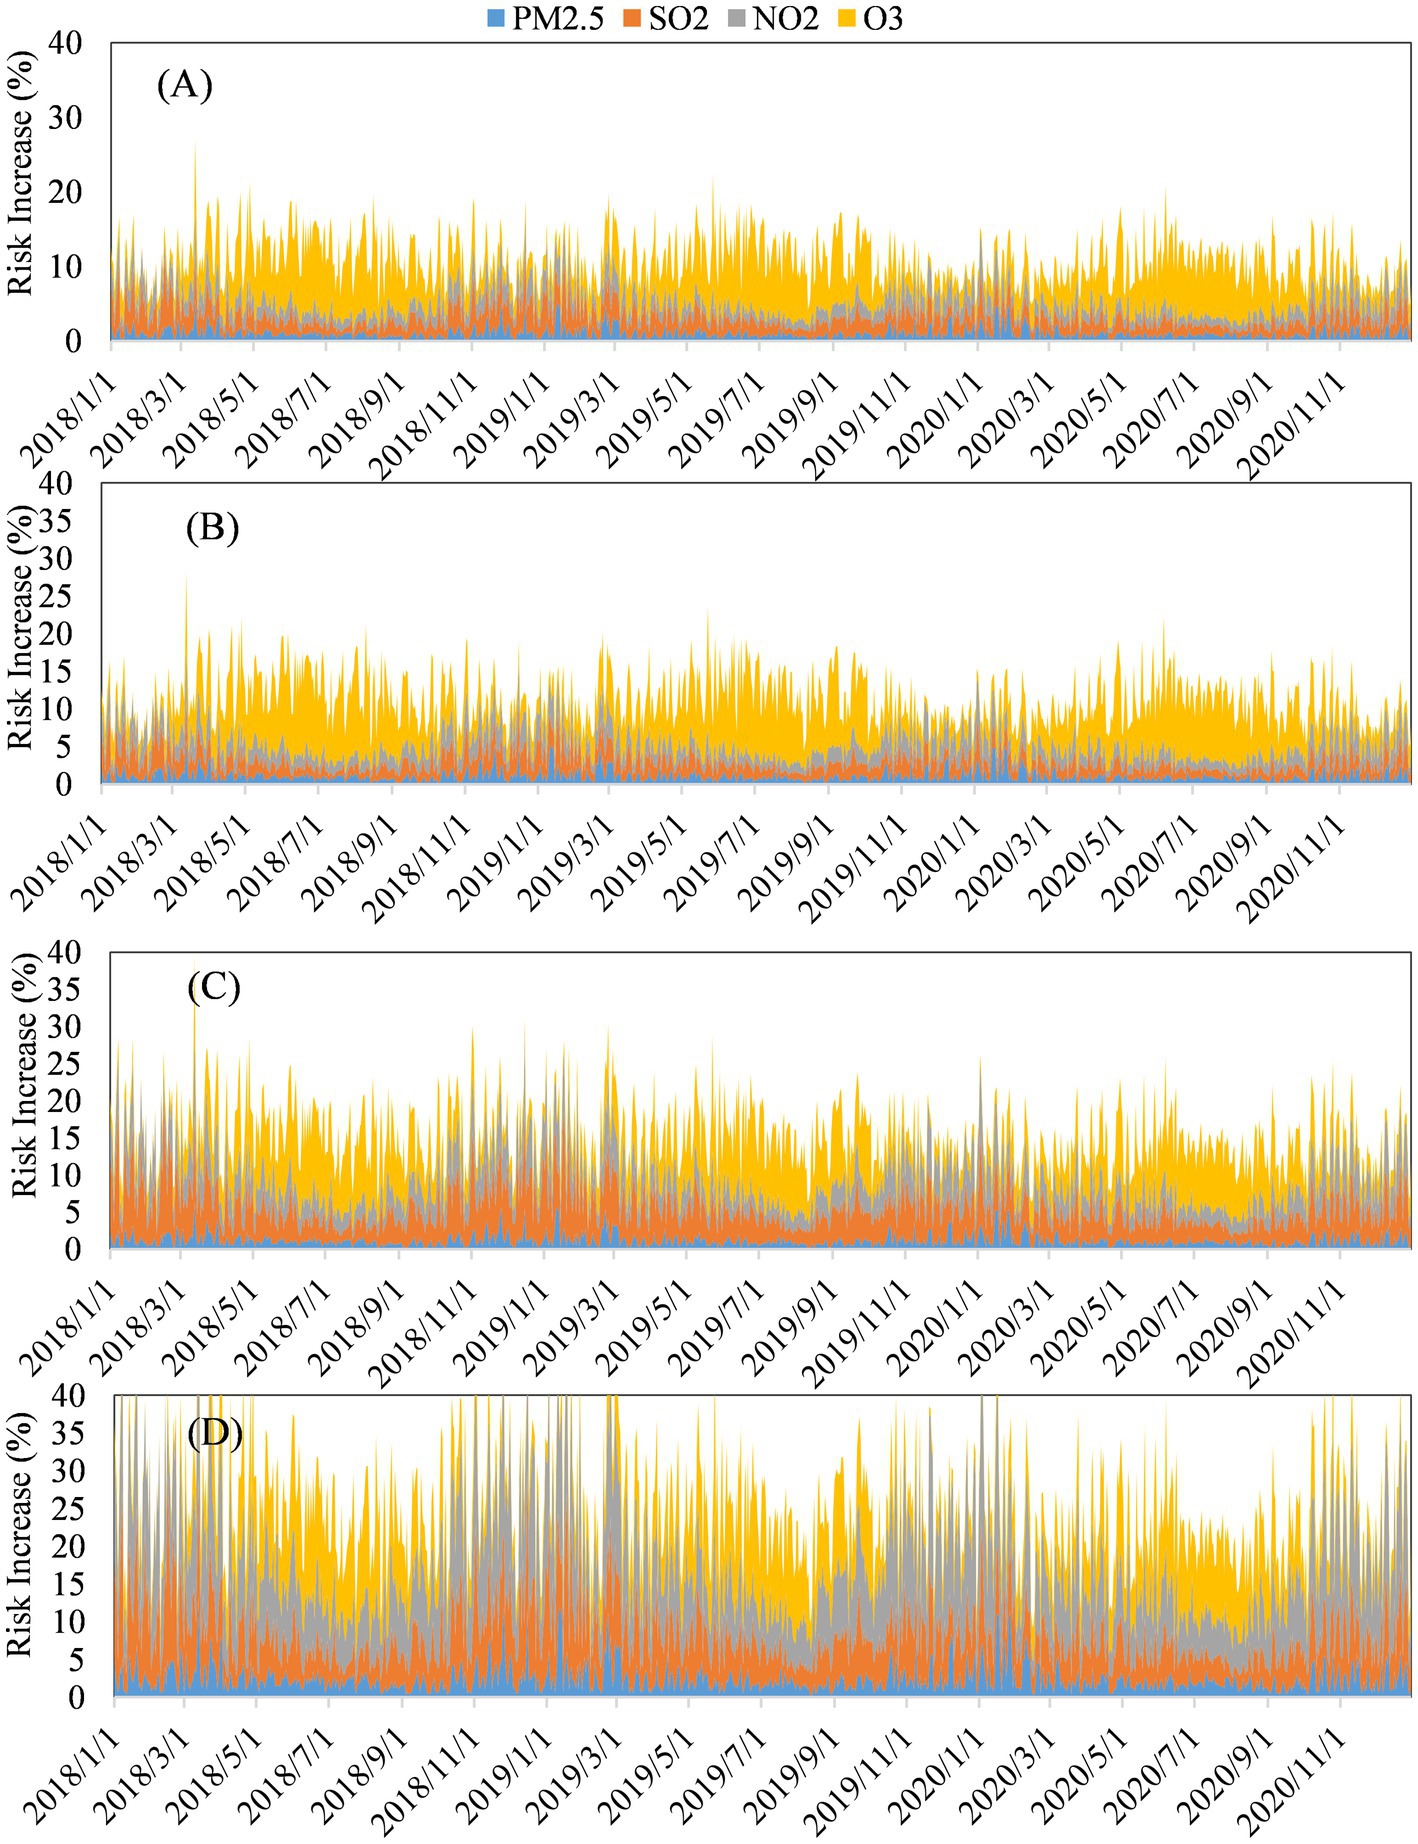
Figure 7. Contributions of each air pollutant to increased daily mortality among different populations in Tianjin 2018–2020: (A) Total population. Populations with (B) cardiovascular and cerebrovascular diseases (CD), (C) lung cancer (LC), and (D) chronic respiratory diseases (CRD).
3.4.2. Construction of AQHI index for populations with different diseases in Tianjin
The exposure-response relationships among populations with different diseases clarified that populations with lung cancer, cardiovascular and chronic respiratory disease are more sensitive to the acute health effects of air pollution.
The resulting AQHI values of air pollutants in Tianjin for populations with different types of diseases were graded according to the criteria shown in Table 1. Figure 8 shows that the grades of the AQHI and S-AQHI indices of Tianjin for 2018–2020 varied, and that the number of days with moderate and high grades were worse for populations with cardiovascular and chronic respiratory diseases than for the whole population, being 53, 3, and 58%, and 6%, respectively.
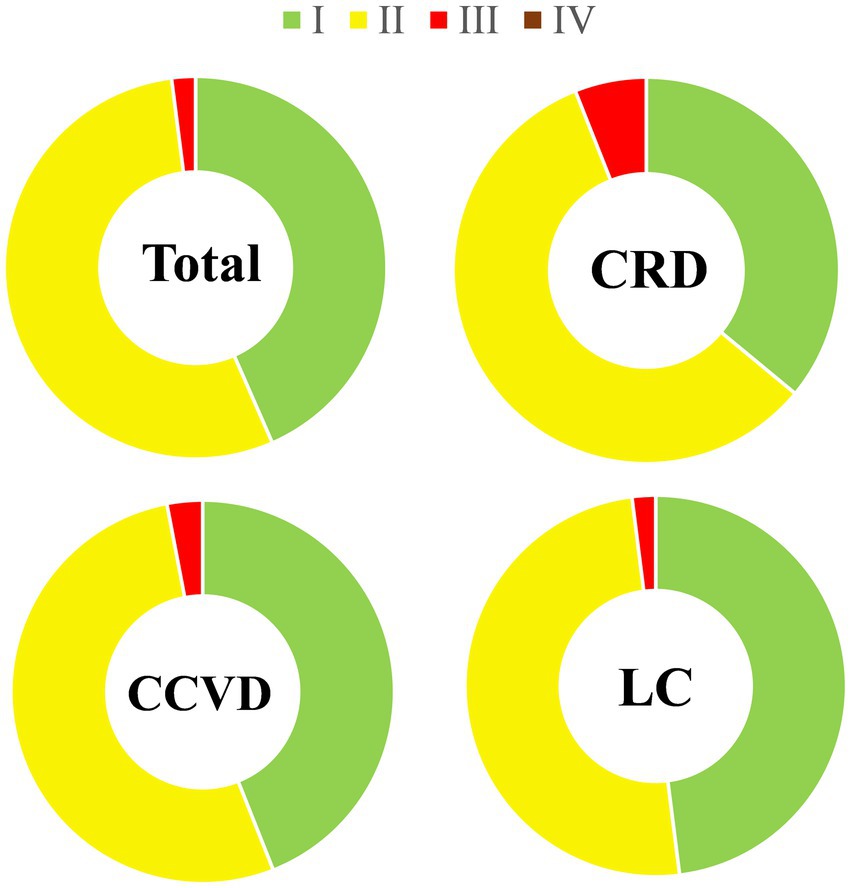
Figure 8. Comparative AQHI and S-AQHI grades for health risk in Tianjin 2018–2020. Levels I, II, III and IV are low, moderate, high, and severe, respectively.
4. Discussion
4.1. Health risk evaluation of air pollutants in Tianjin
The health effects results of air pollutants indicated that air pollution in Tianjin is influenced by meteorological factors and that the level of pollution remains very high, and the seasonal variations in PM2.5, SO2, NO2, O3, and CO are clear, whereas the trends of AQHI and CRI-AQHI are not the same as those of the air pollutant concentrations, because the AQHI takes into account the combined health effects of multiple air pollutants, resulting in less distinct seasonal variations.
The validity analysis results indicated closer correlations between the exposure-response relationship of total mortality and the AQHI and the CRI-AQHI compared with the AQI. And according to the analysis of excess mortality rate, the correlations between AQHI and CRI-AQHI and health are significantly stronger than AQI, indicated that AQHI and CRI-AQHI are more effective in predicting daily mortality rates of residents. It is similar to the previous research results. Du etc. (22) found that the associations of AQHI with mortality were stronger than AQI. Cao et al. (23, 37) also found that CRI-AQHI and AQHI performed better than AQI when identifying health risks.
4.2. Health effects analysis of different disease groups
The acute health effects of air pollution are influenced by several factors, and public health prevention can be implemented for populations with various types of diseases to minimize the health hazards of air pollution. This study showed that people with lung cancer, cardiovascular and chronic respiratory diseases are more susceptible to air pollution, and that chronic underlying cardiopulmonary and respiratory diseases enhance sensitivity to air pollution. In fact, individuals with diseases have inherently poor health with diminished ability to clear inhaled pollutants from the respiratory tract and decreased immunity, and are thus more susceptible to pollutants (28, 29).
The health effects of each air pollutant on the population with chronic respiratory disease was the most significant, followed by lung cancer and cardiovascular disease. The contribution of each air pollutant to the increase in daily mortality rates was similar between the entire population and the population with cardiovascular disease. The health effects of increased O3 concentrations during the summer were significantly higher. The contribution of SO2 to the increase in daily mortality rate for the population with lung cancer was larger than that for other populations, and SO2, as an auxiliary carcinogen, is mainly generated by pollution due to coal combustion which is more severe when air convection is very weak or during an atmospheric inversion. Epidemiological studies have shown that SO2 can affect lung function and is closely associated with lung cancer mortality (38–40). Sulfur dioxide can adsorb onto the surface of PM2.5 and deeply penetrate the respiratory tract, increasing the level of toxicity 3–4-fold, and it can be oxidized to SO3 through catalysis by metal particles (39). This is 4-fold more dangerous than SO2 alone. Furthermore, SO2 combined with benzo(a)pyrene can increase the carcinogenicity of the latter. Both NO2 and PM2.5 contribute more to the increase of daily mortality rates of persons with chronic respiratory disease than other populations. Having entered the lungs, PM2.5 blocks local tissues, causing a decrease in local bronchial ventilation and a loss of fine bronchial and alveolar air exchange. Adsorbed with harmful gasses, PM2.5 can irritate or corrode the alveolar wall, and the long-term effect can damage the respiratory defense function, leading to bronchitis, emphysema and bronchial asthma. Epidemiological findings have shown that short- and long-term exposure to high concentrations of particulate matter can increase the morbidity and mortality rates of respiratory diseases (41, 42). Nitrogen dioxide is mainly produced during the combustion of nitrogenous substances, and the main source is vehicle exhaust emissions. Inhalation of NO2 not only damages human lung function, but also causes bronchial asthma and other diseases (43, 44). Epidemiological findings have associated NO2 with increased rates of mortality from chronic respiratory diseases (43, 44). In addition, several cohort study also shows that long-term exposure to PM2.5 could significantly increase the incidence rate of total cardiovascular diseases among residents (HR = 1.04, 1.02–1.07) (45), and long-term exposure to PM2.5 and nitrogen dioxide have an impact on multiple stages of the development of cardiovascular metabolic comorbidity (46). Long term exposure to ozone is associated with an increased risk of total cardiovascular disease death, ischemic heart disease death, and stroke death. For every 10 μg/m3 increase in ozone concentration during the warm season, these death risks increase by 9.3, 18.4, and 6.3%, respectively (47). This shows that air pollutants are harmful to humans in many ways, and the impact of each on human health cannot be taken lightly.
The above results show that the impact of each air pollutant on the health of populations with different types of diseases varies. Therefore, it is necessary to establish S-AQHI for these populations in this study. The results also provide technical support for the feasibility and effectiveness of establishing S-AQHI for other susceptible populations (pregnant women, children, older adults group, etc.). S-AQHI can be established for various susceptible populations to comprehensively assess public health risks in the future.
4.3. Strengths and limitations
In this study, we constructed Tianjin AQHI and a validity comparison based on two different methods, and constructed S-AQHIs for populations with different disease. In addition, we analyzed the health effects of air pollution based on different disease groups. The present results will provide guidance for the general and diseases populations to adopt of healthy behaviors, and will serve as a model for the establishment of AQHI in other Chinese cities in the future.
The AQHI is an indicator of the combined health effects of multiple air pollutants. Thus, the selection of appropriate pollutant data, health data and modeling methods as primary indicators is critical for establishing an AQHI for different regions and populations, but the types of included pollutants and modeling methods have not yet reached consensus. For example, To etc. (29) developed an AQHI for chronic diseases in Canada based on exposure-response relationships between each of PM2.5, NO2, and O3 and the number of patients with various diseases. Li etc. (15) developed an AQHI for Guangzhou using a single-pollutant model based on exposure-response relationships between daily mortality rates and each of PM2.5, O3, NO2, and SO2. Zeng etc. (20) created an AQHI for Tianjin using principal component analysis (PCA), comprehensively considering the exposure-response relationship between each of PM2.5, PM10, SO2, NO2, CO, and O3 and daily mortality as well as years of life lost. Pollutant screening, modeling methods, and the selection of health data used to establish an AQHI in various regions clearly differ. This has also led to a lack of comparability among studies associated with AQHI. Therefore, relevant ambient air quality standards and policies for AQHI should be established to comprehensively analyze the combined health effects of air pollutants in different regions. Residents in all regions should be educated about air pollution and the severity of its potential harmful effects on health.
Due to the data acquisition limitations, this study used disease mortality data for different disease groups, which were not comprehensive enough in analyzing health risks. In the future, different disease incidence data can be obtained to assess health risks more comprehensively and effectively.
5. Conclusion
We constructed an AQHI and a CRI-AQHI for Tianjin using single- and multi-pollutant models and environmental (PM2.5, O3, NO2, SO2), meteorological, and health data for 2018–2020. Compared with the AQI, the AQHI and CRI-AQHI established herein correlated more closely with exposure-response relationships that were mostly linear. Each increase in the IQRs of AQHI, CRI-AQHI and AQI values resulted in an increase of 2.06, 1.69 and 0.62%, respectively, in total daily mortality rates. These findings confirmed that the AQHI and CRI-AQHI were far more effective than AQI in predicting the daily mortality rates of Tianjin residents and that they were similarly associated with health. Therefore, we selected the coefficients of the single-pollutant model when establishing the AQHI for Tianjin to maintain comparability with previous AQHI findings.
Based on these findings, we used our AQHI to analyze populations with different types of diseases in Tianjin. Populations with lung cancer, cardiovascular and chronic respiratory disease were vulnerable, and more susceptible to air pollution. The deleterious effects of each air pollutant on the health of the population with chronic respiratory disease were the most significant, followed by lung cancer and cardiovascular and cerebrovascular diseases. The contributions of each air pollutant to the increased daily mortality rates of the entire population and the population with cardiovascular and cerebrovascular diseases were similar, with O3 having significantly worse effects on health during the summer. Sulfur dioxide contributed more to the increase in daily mortality rates of the population with lung cancer than other types of diseases. Nitrogen dioxide and PM2.5 contributed more to the increase in daily mortality rates for populations with chronic respiratory than other diseases. Based on these findings, we established an S-AQHI for various populations with different diseases. The present results will provide guidance for the general and diseases populations to adopt of healthy behaviors. In the future, the combined health effects of air pollutants in various regions will be comprehensively analyzed. Relevant ambient air quality standards and policies for AQHI need to be established to comprehensively analyze the combined health effects of air pollutants in various regions, and to educate the public in general to recognize and understand the severity of air pollution and its potential effects on health.
Data availability statement
The raw data supporting the conclusions of this article will be made available by the authors, without undue reservation.
Author contributions
YW, DD, and MS contributed to conception, design of the study, and wrote the first draft of the manuscript. YW organized the database. YW and DD performed the statistical analysis. MD, YD, LG, and ZX wrote sections of the manuscript. All authors contributed to manuscript revision, read, and approved the submitted version.
Funding
This work was supported by China’s National Key Research and Development Program (2019YFE0194500) and the Municipal Financial Research Project of Beijing Academy of Science and Technology (11000022T000000445296 and 11000022T000000468149).
Acknowledgments
The authors would like to extend sincerest gratitude to the National Center for Chronic and Noncommunicable Disease Control and Prevention for providing the daily citizen mortality data.
Conflict of interest
The authors declare that the research was conducted in the absence of any commercial or financial relationships that could be construed as a potential conflict of interest.
Publisher’s note
All claims expressed in this article are solely those of the authors and do not necessarily represent those of their affiliated organizations, or those of the publisher, the editors and the reviewers. Any product that may be evaluated in this article, or claim that may be made by its manufacturer, is not guaranteed or endorsed by the publisher.
Supplementary material
The Supplementary material for this article can be found online at: https://www.frontiersin.org/articles/10.3389/fpubh.2023.1177290/full#supplementary-material
Footnotes
References
1. World Health Organization. Ambient air pollution: a global assessment of exposure and burden of disease, vol. 26. Geneva: World Health Organization (2016). 6 p.
2. Babatola, SS. Global burden of diseases attributable to air pollution. J Public Health Afr. (2018) 9:813. doi: 10.4081/jphia.2018.813
3. Mathers, C, Stevens, G, Hogan, D, Mahanani, WR, and Ho, J. Disease control priorities: Improving health and reducing pov-erty. Washington DC: World Bank (2017).
4. Ministry of Ecology and Environment of the People's Republic of China. Communiqué on the ecological and environmental conditions of China 2021. (2022). Available at: https://www.mee.gov.cn/hjzl/sthjzk/zghjzkgb/202205/P020220608338202870777.pdf.
5. World Health Organization. WHO global air quality guidelines: particulate matter (PM2.5 and PM10), ozone, nitrogen di-oxide, sulfur dioxide and carbon monoxide. Geneva: World Health Organization. (2021). Available at: https://apps.who.int/iris/handle/10665/345329.
6. Brunekreef, B, and Holgate, ST. Air pollution and health. Lancet. (2002) 360:1233–42. doi: 10.1016/S0140-6736(02)11274-8
7. He, F, Shaffer, ML, Rodriguez-Colon, S, Yanosky, JD, Bixler, E, Cascio, WE, et al. Acute effects of fine particulate air pollution on cardiac arrhythmia: the APACR study. Environ Health Perspect. (2011) 119:927–32. doi: 10.1289/ehp.1002640
8. Hwang, BF, and Lee, YL. Air pollution and prevalence of bronchitic symptoms among children in Taiwan. Chest. (2010) 138:956–64. doi: 10.1378/chest.09-2600
9. Liu, WY, Yu, ZB, Qiu, HY, Wang, JB, and Chen, XY. Association between ambient air pollutants and preterm birth in Ningbo, China: a time-series study. BMC Pediatr. (2018) 18:305. doi: 10.1186/s12887-018-1282-9
10. Campbell, LD, and Pruss, UA. Climate change, air pollution and noncommunicable diseases. Bull World Health Organ. (2019) 97:160–1. doi: 10.2471/BLT.18.224295
11. Wu, YF, Jin, A, Xie, GQ, Wang, L, and Liu, K. The 20 most important and most preventable health problems of China: a Del-phi consultation of Chinese experts. Am J Public Health. (2018) 108:1592–8. doi: 10.2105/AJPH.2018.304684
12. Yang, G, Wang, Y, Zeng, Y, Gao, GF, Liang, X, Zhou, M, et al. Rapid health transition in China, 1990-2010: findings from the global burden of disease study 2010. Lancet. (2013) 381:1987–2015. doi: 10.1016/S0140-6736(13)61097-1
13. Plaia, A, and Ruggieri, M. Air quality indices: a review. Rev Environ Sci Biotechnol. (2011) 10:165–79. doi: 10.1007/s11157-010-9227-2
14. Chen, RJ, Chen, BH, and Kan, HD. Air quality health index in China: a pilot study. China Environ Sci. (2013) 33:2081–6. doi: 10.3969/j.issn.1000-6923.2013.11.024
15. Li, X, Xiao, JP, Lin, HL, Liu, T, Qian, ZM, Zeng, WL, et al. The construction and validity analysis of AQHI based on mortality risk: a case study in Guangzhou, China. Environ Pollut. (2017) 220:487–94. doi: 10.1016/j.envpol.2016.09.091
16. Stieb, DM, Burnett, RT, Smith-Doiron, M, Brion, O, Shin, HH, and Economou, V. A new multipollutant, no-threshold air quality health index based on short-term associations observed in daily time-series analyses. J Air Waste Manag Assoc. (2008) 58:435–50. doi: 10.3155/1047-3289.58.3.435
17. Cairncross, EK, John, J, and Zunckel, M. A novel air pollution index based on the relative risk of daily mortality associated with short-term exposure to common air pollutants. Atmos Environ. (2007) 41:8442–54. doi: 10.1016/j.atmosenv.2007.07.003
18. Chen, RJ. The health effects of complex air pollution in 17 Chinese cities. Shanghai: Fudan University (2013).
19. Zhang, LJ, Xu, HH, Guo, CY, Chen, J, Dong, CY, Zhang, JH, et al. Con-structing an air quality health index for children: a case study in Shanghai, China. Atmos Environ. (2021) 267:118765. doi: 10.1016/j.atmosenv.2021.118765
20. Zeng, Q, Fan, L, Ni, Y, Li, GX, and Gu, Q. Construction of AQHI based on the exposure relationship between air pollution and YLL in northern China. Sci Total Environ. (2020) 710:136264. doi: 10.1016/j.scitotenv.2019.136264
21. Mason, TG, Schooling, CM, Chan, KP, and Tian, LW. An evaluation of the air quality health index program on respiratory diseases in Hong Kong: an interrupted time series analysis. Atmos Environ. (2019) 211:151–8. doi: 10.1016/j.atmosenv.2019.05.013
22. Du, X, Chen, RJ, Meng, X, Liu, C, Niu, Y, Wang, WD, et al. The establishment of National air Quality Health Index in China. Environ Int. (2020) 138:105594. doi: 10.1016/j.envint.2020.105594
23. Cao, R, Wang, YX, Huang, J, Zeng, Q, Pan, XC, Li, GX, et al. The construction of the air quality health index (AQHI) and a validity comparison based on three different methods. Environ Res. (2021) 197:110987. doi: 10.1016/j.envres.2021.110987
24. Costa, AF, Hoek, G, Brunekreef, B, and Monteiro, ACM. Effects of NO2 exposure on daily mortality in Sao Paulo, Brazil. Environ Res. (2017) 159:539–44. doi: 10.1016/j.envres.2017.08.041
25. Crouse, DL, Peters, PA, Hystad, P, Brook, JR, van Donkelaar, A, Martin, RV, et al. Ambient PM2.5, O3, and NO2 exposures and associations with mortality over 16 years of follow-up in the Canadian census health and environment cohort (CanCHEC). Environ Health Perspect. (2015) 123:1180–6. doi: 10.1289/ehp.1409276
26. Klompmaker, JO, Hoek, G, Bloemsma, LD, Wijga, AH, van den Brink, C, Brunekreef, B, et al. Associations of combined exposures to surrounding green, air pollution and traffic noise on mental health. Environ Int. (2019) 129:525–37. doi: 10.1016/j.envint.2019.05.040
27. Spurr, K, Pendergast, N, and MacDonald, S. Assessing the use of the air quality health index by vulnerable populations in a ‘Lowrisk’ region: a pilot study. Can J Respir Ther. (2014) 50:45–9.
28. Olstrup, H. An air quality health index (AQHI) with different health outcomes based on the air pollution concentrations in Stockholm during the period of 2015–2017. Atmos. (2020) 11:192. doi: 10.3390/atmos11020192
29. To, T, Feldman, L, Simatovic, J, Gershon, AS, Dell, S, Su, JD, et al. Health risk of air pollution on people living with major chronic diseases: a Canadian population-based study. BMJ Open. (2015) 5:e009075. doi: 10.1136/bmjopen-2015-009075
30. The People's Government of Tianjin Municipality. Tianjin three-year action plan to win the blue sky protection campaign. Available at: (2018). Available at: https://www.tj.gov.cn/zwgk/szfgb/qk/2018/16_3417/202005/t20200520_2476551.html.
31. Qian, Z, He, Q, Lin, HM, Kong, L, Liao, D, Dan, J, et al. Association of daily cause-specific mortality with ambient particle air pollution in Wuhan, China. Environ Res. (2007) 105:380–9. doi: 10.1016/j.envres.2007.05.007
32. Welty, L, and Zeger, SL. Are the acute effects of particulate matter on mortality in the National Morbidity, mortality, and air pollution study the result of inadequate control for weather and season? A sensitivity analysis using flexible distributed lag models. Am J Epidemiol. (2005) 162:80–8. doi: 10.1093/aje/kwi157
33. Lippmann, M, Chen, LC, Gordon, T, Ito, K, and Thurston, GD. National Particle Component Toxicity (NPACT) initiative: integrated epidemiologic and toxicologic studies of the health effects of particulate matter components. Res Rep Health EffInst. (2013) 177:5–13.
34. Chen, R, Pan, G, Kan, H, Tan, J, Song, W, Wu, Z, et al. Ambient air pollution and daily mor-tality in Anshan, China: a time-stratified case-crossover analysis. Sci Total Environ. (2010) 408:6086–91. doi: 10.1016/j.scitotenv.2010.09.018
35. Shang, Y, Sun, ZW, Cao, JJ, Wang, XM, Zhong, LJ, Bi, XH, et al. Systematic review of Chinese studies of short-term exposure to air pollution and daily mortality. Environ Int. (2013) 54:100–11. doi: 10.1016/j.envint.2013.01.010
36. Tao, YB, Huang, W, Huang, XL, Zhong, LJ, Lu, SE, Li, Y, et al. Estimated acute effects of ambi-ent ozone and nitrogen dioxide on mortality in the Pearl River Delta of southern China. Environ Health Perspect. (2012) 120:393–8. doi: 10.1289/ehp.1103715
37. Cao, R, Liu, W, Huang, J, Pan, XC, Zeng, Q, Evangelopoulos, D, et al. The establishment of air quality health index in China: a comparative analysis of methodological approaches. Environ Res. (2022) 215:114264. doi: 10.1016/j.envres.2022.114264
38. Hu, Y. Assessment of the economic loss to human health from air pollution in Qingdao. Chin J Public Health. (2003) 19:940–1. doi: 10.11847/zgggws2003-19-08-29
39. Pope, CA, Burnett, RT, and Thun, MJ. Lung cancer, cardiopulmonary mortality, and long-term exposure to fine particulate air pollution. JAMA. (2002) 287:1132–41. doi: 10.1001/jama.287.9.1132
40. Zhang, GQ, Wang, N, Wang, T, Zhu, WX, Qu, CX, and Xing, XM. Effects of tobacco consumption and air pollution on lung cancer mortality among urban residents in Beijing. JEH. (2009) 26:666–9. doi: 10.16241/j.cnki.1001-5914.2009.08.039
41. Chen, RJ, and Kan, HD. Haze pollution and human health. J Nat. (2013) 35:342–4. doi: 10.3969/j.issn.0253-9608.2013.05.006
42. Pope, CA, and Dockery, DW. Health effects of fine particulate air pollution: lines that connect. J Air Waste Manag Assoc. (2006) 56:709–42. doi: 10.1080/10473289.2006.10464485
43. Carey, IM, Atkinson, RW, Kent, AJ, Staa, T, Cook, DG, and Anderson, HR. Mortality associations with long-term expo-sure to outdoor air pollution in a National English Cohort. Am J Resp Crit Care. (2012) 187:1226–33. doi: 10.1164/rccm.201210-1758OC
44. Crouse, DL, Pinault, L, Balram, A, Hystad, P, Peters, PA, Chen, H, et al. Urban greenness and mortality in Canada's largest cities: a national cohort study. Health. (2017) 1:e289–97. doi: 10.1016/S2542-5196(17)30118-3
45. Liu, C, Chan, KH, Lv, J, Lam, H, Newell, K, Meng, X, et al. Long-term exposure to ambient fine particulate matter and incidence of major cardiovascular diseases: a prospective study of 0.5 million adults in China. Environ Sci Technol. (2022) 56:13200–11. doi: 10.1021/acs.est.2c03084
46. Luo, HH, Zhang, QL, Yu, KX, Meng, X, Kan, HD, and Chen, RJ. Long-term exposure to ambient air pollution is a risk factor for trajectory of cardiometabolic multimorbidity: a prospective study in the UK biobank. EBioMedicine. (2022) 84:104282. doi: 10.1016/j.ebiom.2022.104282
Keywords: air quality, air pollution, health risk, disease, air quality health index, air quality index
Citation: Wang Y, Dan M, Dou Y, Guo L, Xu Z, Ding D and Shu M (2023) Evaluation of the health risk using multi-pollutant air quality health index: case study in Tianjin, China. Front. Public Health. 11:1177290. doi: 10.3389/fpubh.2023.1177290
Edited by:
Mohiuddin Md. Taimur Khan, Washington State University Tri-Cities, United StatesReviewed by:
Xuelei Zhang, Chinese Academy of Sciences (CAS), ChinaPak Lun Fung, University of Helsinki, Finland
Mohd Faiz Ibrahim, Ministry of Health (Malaysia), Malaysia
Copyright © 2023 Wang, Dan, Dou, Guo, Xu, Ding and Shu. This is an open-access article distributed under the terms of the Creative Commons Attribution License (CC BY). The use, distribution or reproduction in other forums is permitted, provided the original author(s) and the copyright owner(s) are credited and that the original publication in this journal is cited, in accordance with accepted academic practice. No use, distribution or reproduction is permitted which does not comply with these terms.
*Correspondence: Ding Ding, ZDIwMjExMDA5MkB4cy51c3RiLmVkdS5jbg==; Mushui Shu, c21zQGJtaWxwLmNvbQ==