 Yifei Ma
 Shujun Xu
 Yuxin Luo
 Yao Qin
 Jiantao Li
 Lijian Lei
 Lu He
Lu He Tong Wang
 Hongmei Yu
 Jun Xie
95% of researchers rate our articles as excellent or good
Learn more about the work of our research integrity team to safeguard the quality of each article we publish.
Find out more
ORIGINAL RESEARCH article
Front. Public Health , 21 June 2023
Sec. Infectious Diseases: Epidemiology and Prevention
Volume 11 - 2023 | https://doi.org/10.3389/fpubh.2023.1175869
This article is part of the Research Topic COVID-19: Integrating Artificial Intelligence, Data Science, Mathematics, Medicine and Public Health, Epidemiology, Neuroscience, Neurorobotics, and Biomedical Science in Pandemic Management, volume II View all 92 articles
Background: On September 28, 2022, the first case of Omicron subvariant BF.7 was discovered among coronavirus disease 2019 (COVID-19) infections in Hohhot, China, and then the epidemic broke out on a large scale during the National Day holiday. It is imminently necessary to construct a mathematical model to investigate the transmission dynamics of COVID-19 in Hohhot.
Methods: In this study, we first investigated the epidemiological characteristics of COVID-19 cases in Hohhot, including the spatiotemporal distribution and sociodemographic distribution. Then, we proposed a time-varying Susceptible-Quarantined Susceptible-Exposed-Quarantined Exposed-Infected-Asymptomatic-Hospitalized-Removed (SQEIAHR) model to derive the epidemic curves. The next-generation matrix method was used to calculate the effective reproduction number (Re). Finally, we explored the effects of higher stringency measures on the development of the epidemic through scenario analysis.
Results: Of the 4,889 positive infected cases, the vast majority were asymptomatic and mild, mainly concentrated in central areas such as Xincheng District. People in the 30–59 age group primarily were affected by the current outbreak, accounting for 53.74%, but females and males were almost equally affected (1.03:1). Community screening (35.70%) and centralized isolation screening (26.28%) were the main ways to identify positive infected cases. Our model predicted the peak of the epidemic on October 6, 2022, the dynamic zero-COVID date on October 15, 2022, a number of peak cases of 629, and a cumulative number of infections of 4,963 (95% confidential interval (95%CI): 4,692 ~ 5,267), all four of which were highly consistent with the actual situation in Hohhot. Early in the outbreak, the basic reproduction number (R0) was approximately 7.01 (95%CI: 6.93 ~ 7.09), and then Re declined sharply to below 1.0 on October 6, 2022. Scenario analysis of higher stringency measures showed the importance of decreasing the transmission rate and increasing the quarantine rate to shorten the time to peak, dynamic zero-COVID and an Re below 1.0, as well as to reduce the number of peak cases and final affected population.
Conclusion: Our model was effective in predicting the epidemic trends of COVID-19, and the implementation of a more stringent combination of measures was indispensable in containing the spread of the virus.
As the most widespread and severe public health crisis in the last 100 years, coronavirus disease 2019 (COVID-19) has affected more than 200 countries to varying degrees (1, 2), with 600 million people infected and 6.5 million deaths to date. At present, Omicron has replaced Delta as the predominant strain worldwide, accounting for approximately 58.5% ~ 80.6% of cases (3). From March 1 to April 22, 2022, more than half a million local Omicron cases were reported in almost all provinces across China (4). In the UK, the prevalence of the Omicron variant and its multiple subvariants has led to high infection rates across all age groups, particularly among young children (5). The monthly incidence rate of COVID-19 infections (new cases per 1,000 persons per day) in the US increased substantially when Omicron became the dominant strain compared to Delta (3.8–5.2 vs. 0.5–0.7) (6). The sheer number of Omicron cases has strained health care systems worldwide.
Recent outbreaks of COVID-19 in mainland China were distributed in multiple locations, with wide coverage and frequent occurrences, involving many provinces, cities, counties and districts nationwide, so the epidemic prevention and control situation remains severe and complex. On September 28, 2022, one new indigenous confirmed case of COVID-19 was reported in Hohhot, Inner Mongolia Autonomous Region. This was the first time that the Omicron subvariant BF.7 had appeared in China. The variant, called BA.5.2.1.7 or BF.7 for short, is an offshoot of the Omicron subvariant BA.5, which has the characteristics of extremely strong transmissibility, pathogenicity and immune escape capacity. As of October 3, 2022, the cumulative number of COVID-19 cases reported in Hohhot has exceeded 500, suggesting that the anti-epidemic situation is not optimistic. A serious concern at present is that there is no clear description or consensus on the epidemiological characteristics and future course of the current outbreak. There is an urgent need to explore the epidemiological characteristics of COVID-19 in Hohhot and to develop a prediction model to estimate the incidence trend and determine the priorities of prevention and control measures to provide a scientific basis for an effective response to subsequent outbreaks.
Since the outbreak of COVID-19, scholars have carried out related research from various perspectives, including mathematical modeling, epidemiology, and spatial analysis. Infectious disease dynamic models are regarded as important tools to forecast the prevalence of COVID-19, among which Susceptible-Infected-Removed (SIR) and Susceptible-Exposed-Infected-Removed (SEIR) compartmental models are particularly popular (7–9). Huarachi Olivera RE et al. applied the SIR model to characterize the epidemic evolution of COVID-19 and found that stringent measures can effectively prevent the spread of COVID-19 (10). Hao X et al. used the SAPHIRE model to reconstruct the full-spectrum dynamics of COVID-19 (11). Cai J et al. developed an age-structured stochastic compartmental SLIRL model to project the COVID-19 burden under mitigation scenarios (4). Shin HY conducted multi-stage estimations of the COVID-19 transmission dynamics using SEIR(D) epidemic models, and the results showed that the SEIR(D) is useful and informative (12). Kuniya T estimated the basic reproduction number (R0) for the epidemic in Japan based on the SEIR compartmental model using a least-square-based method with Poisson noise (13). A Bayesian approach has also been proposed to monitor the COVID-19 pandemic and to estimate the proportion of people who died or became infected with SARS-CoV-2 (14). Some studies have investigated the epidemiology and spatial distribution of COVID-19, for example, examining the associations of self-reported COVID-19 infection and SARS-CoV-2 serology test results with persistent physical symptoms and analyzing the spatiotemporal variations of cases and deaths of COVID-19 (15, 16).
Although the above models have achieved rather good prediction results, the SEIR model and its parameters still need to be further modified in due course because the transmission characteristics of the mutant strains differ considerably from those of past strains, and the speed and intensity of implementation of prevention and control measures are inconsistent across regions. Our objectives were to (1) establish a dynamic model based on the current epidemiological situation in Hohhot, (2) predict the development trends of COVID-19, including the peak, size, and reproduction number, and (3) evaluate the effectiveness and priority of different non-pharmaceutical interventions in halting the spread of COVID-19.
Daily COVID-19 report data were obtained from the Inner Mongolia Autonomous Region Health and Health Commission,1 including newly confirmed cases, newly asymptomatic infections and newly asymptomatic infections converted to confirmed cases. Epidemiological survey data of positive infected cases included age, sex, place of residence, disease severity (asymptomatic/mild/moderate/severe/critical) and identification methods (community screening/centralized isolation screening/home quarantine screening/mass screening/risk region screening/close contact screening/others).
In the study of dynamic models of infectious diseases, individuals are abstracted into several compartments: Susceptible (S), Exposed (E), Infected (I) and Removed (R), and transitions between individuals constitute different transmission models. The classical transmission models include SI, SIR, SIS and SEIR, of which SIR and SEIR occupy a central place in epidemiology (17–19). Given the existence of a latent period for COVID-19 and the ability of patients to acquire some immunity after healing, a modified SEIR model was selected for analysis in this study.
Figure 1 provides a comprehensive description of the time-varying Susceptible-Quarantined Susceptible-Exposed-Quarantined Exposed-Infected-Asymptomatic-Hospitalized-Removed (SQEIAHR) model established under the actual epidemic characteristics in Hohhot, such as the large number of asymptomatic infections and the changing transmission rate. The model has eight compartments (S, Q_s, E, Q_e, I, A, H, R) and 14 parameters ( ), of which and are related to intervention strategies. It is important to note that compartment I did not include those who moved from an asymptomatic infection to a confirmed case during isolation.
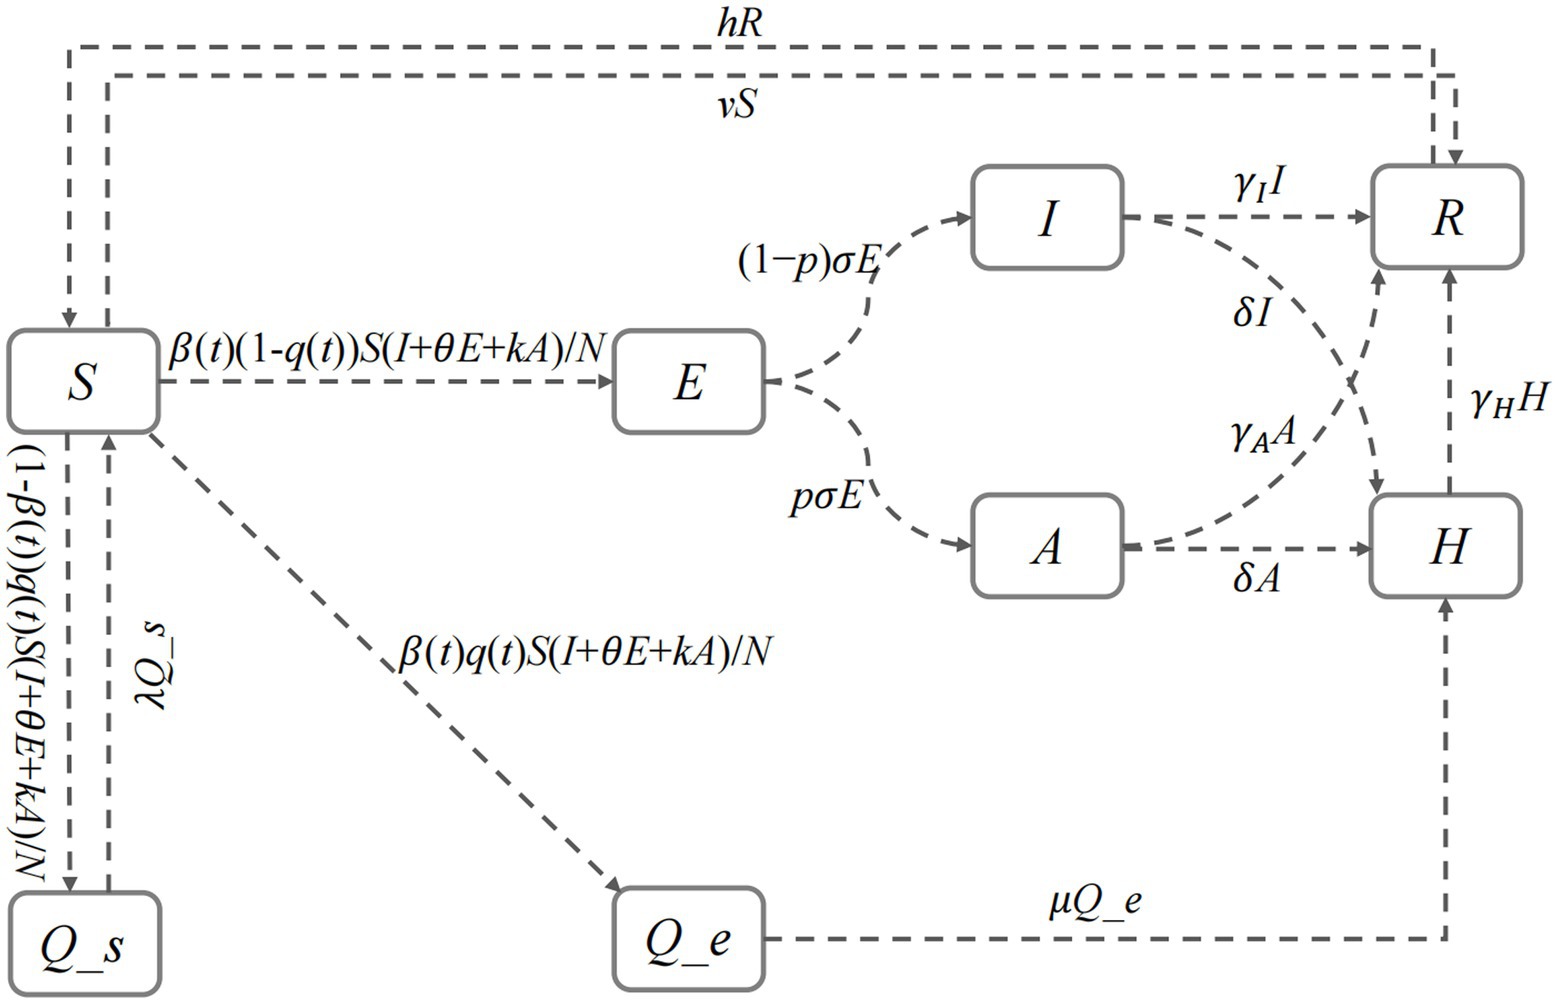
Figure 1. The structure of the SQEIAHR model.
In the SQEIAHR model, we have the constraint N = S + Q_s + E + Q_e + I + A + H + R with the following set of differential equations:
The compartments and parameters in the above equations are described in Table 1.
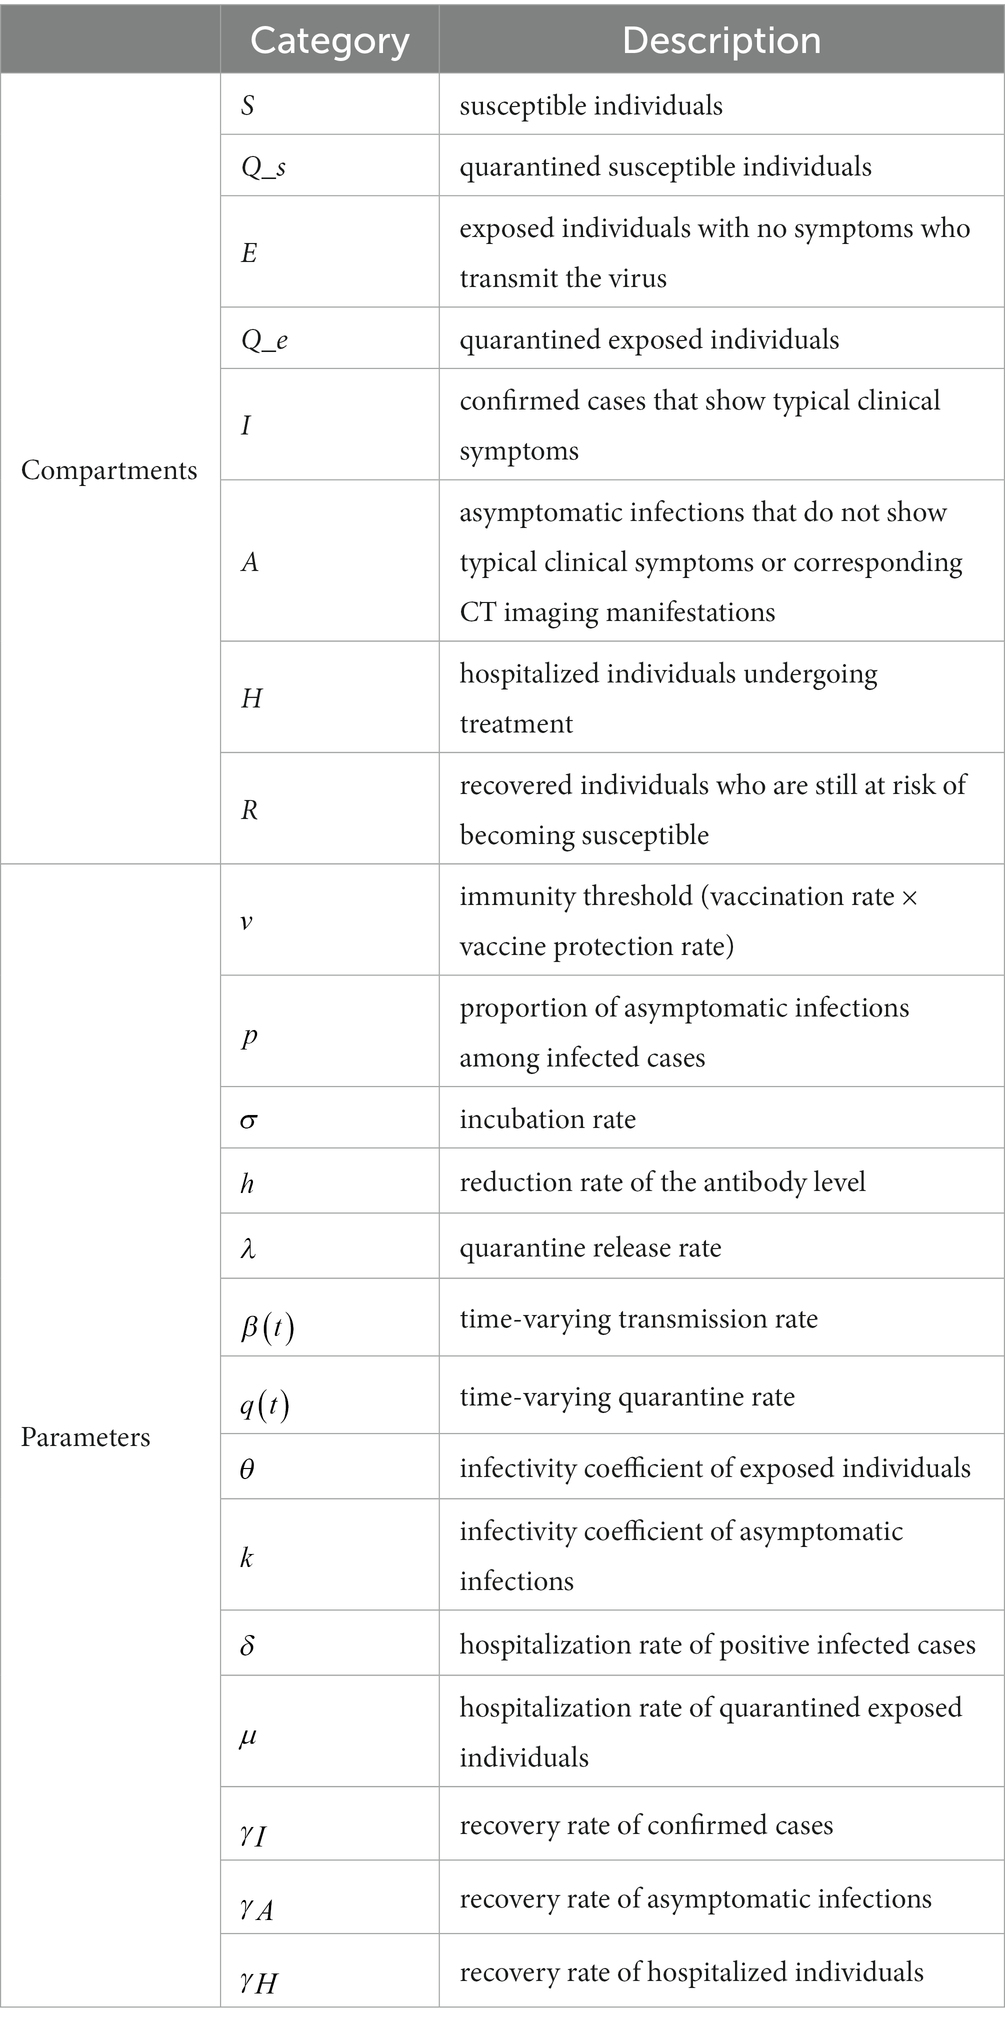
Table 1. Descriptions of the model compartments and parameters.
In this study, and are piecewise functions that represent the time-varying transmission rate and time-varying quarantine rate, respectively. The function expression was split into two segments using October 3, 2022, as the turning point. Since October 3, 2022, Hohhot has upgraded its level of management and control, applied more rigorous measures and paid greater attention to the hardest-hit and high-risk areas. In Eq. (9), represents the initial transmission rate, stands for the exponential decline rate of the transmission rate after taking preventive and control measures, and refers to October 3, 2022. In Eq. (10), and represent the initial quarantine rate and the maximum quarantine rate after the implementation of preventive and control measures, respectively, stands for the exponential increase rate of the quarantine rate, and refers to October 3, 2022.
The transmission process of COVID-19 in the SQEIAHR model is as follows:
The model assumes that S enters E, Q_s, and Q_e with probabilities , , and after exposure to infectious sources such as E, I, and A. If S acquires specific immunity through vaccination, then it will enter R with probability . If no abnormality is found at the end of the quarantine period , then Q_s will re-enter S. E enters A and I at rates and . I, A, and Q_e enter H for treatment at rates , , and The cured I, A, and H enter R at rates , , and . Regarding R, as the antibody level decreases, it re-enters S at rate .
The Markov Chain Monte Carlo (MCMC) method has become very popular for Bayesian computation in complex statistical models. The basic idea is to first construct a Markov Chain whose desired distribution is close to its equilibrium distribution, and then generate samples of the posterior distribution through this Markov Chain, and finally perform Monte Carlo integration based on the valid samples when the Markov Chain reaches its equilibrium. To compensate for the low acceptance probability of MCMC sampling, we used the Metropolis-Hastings (M-H) algorithm to sample the posterior distribution of (20, 21). We ran this algorithm for 60,000 iterations with a burn-in period of 55,000. The posterior means and 95% Bayesian credible intervals for 12 parameters are displayed in Table 2, and the model compartments and remaining parameters were derived from actual epidemic or literature reports.
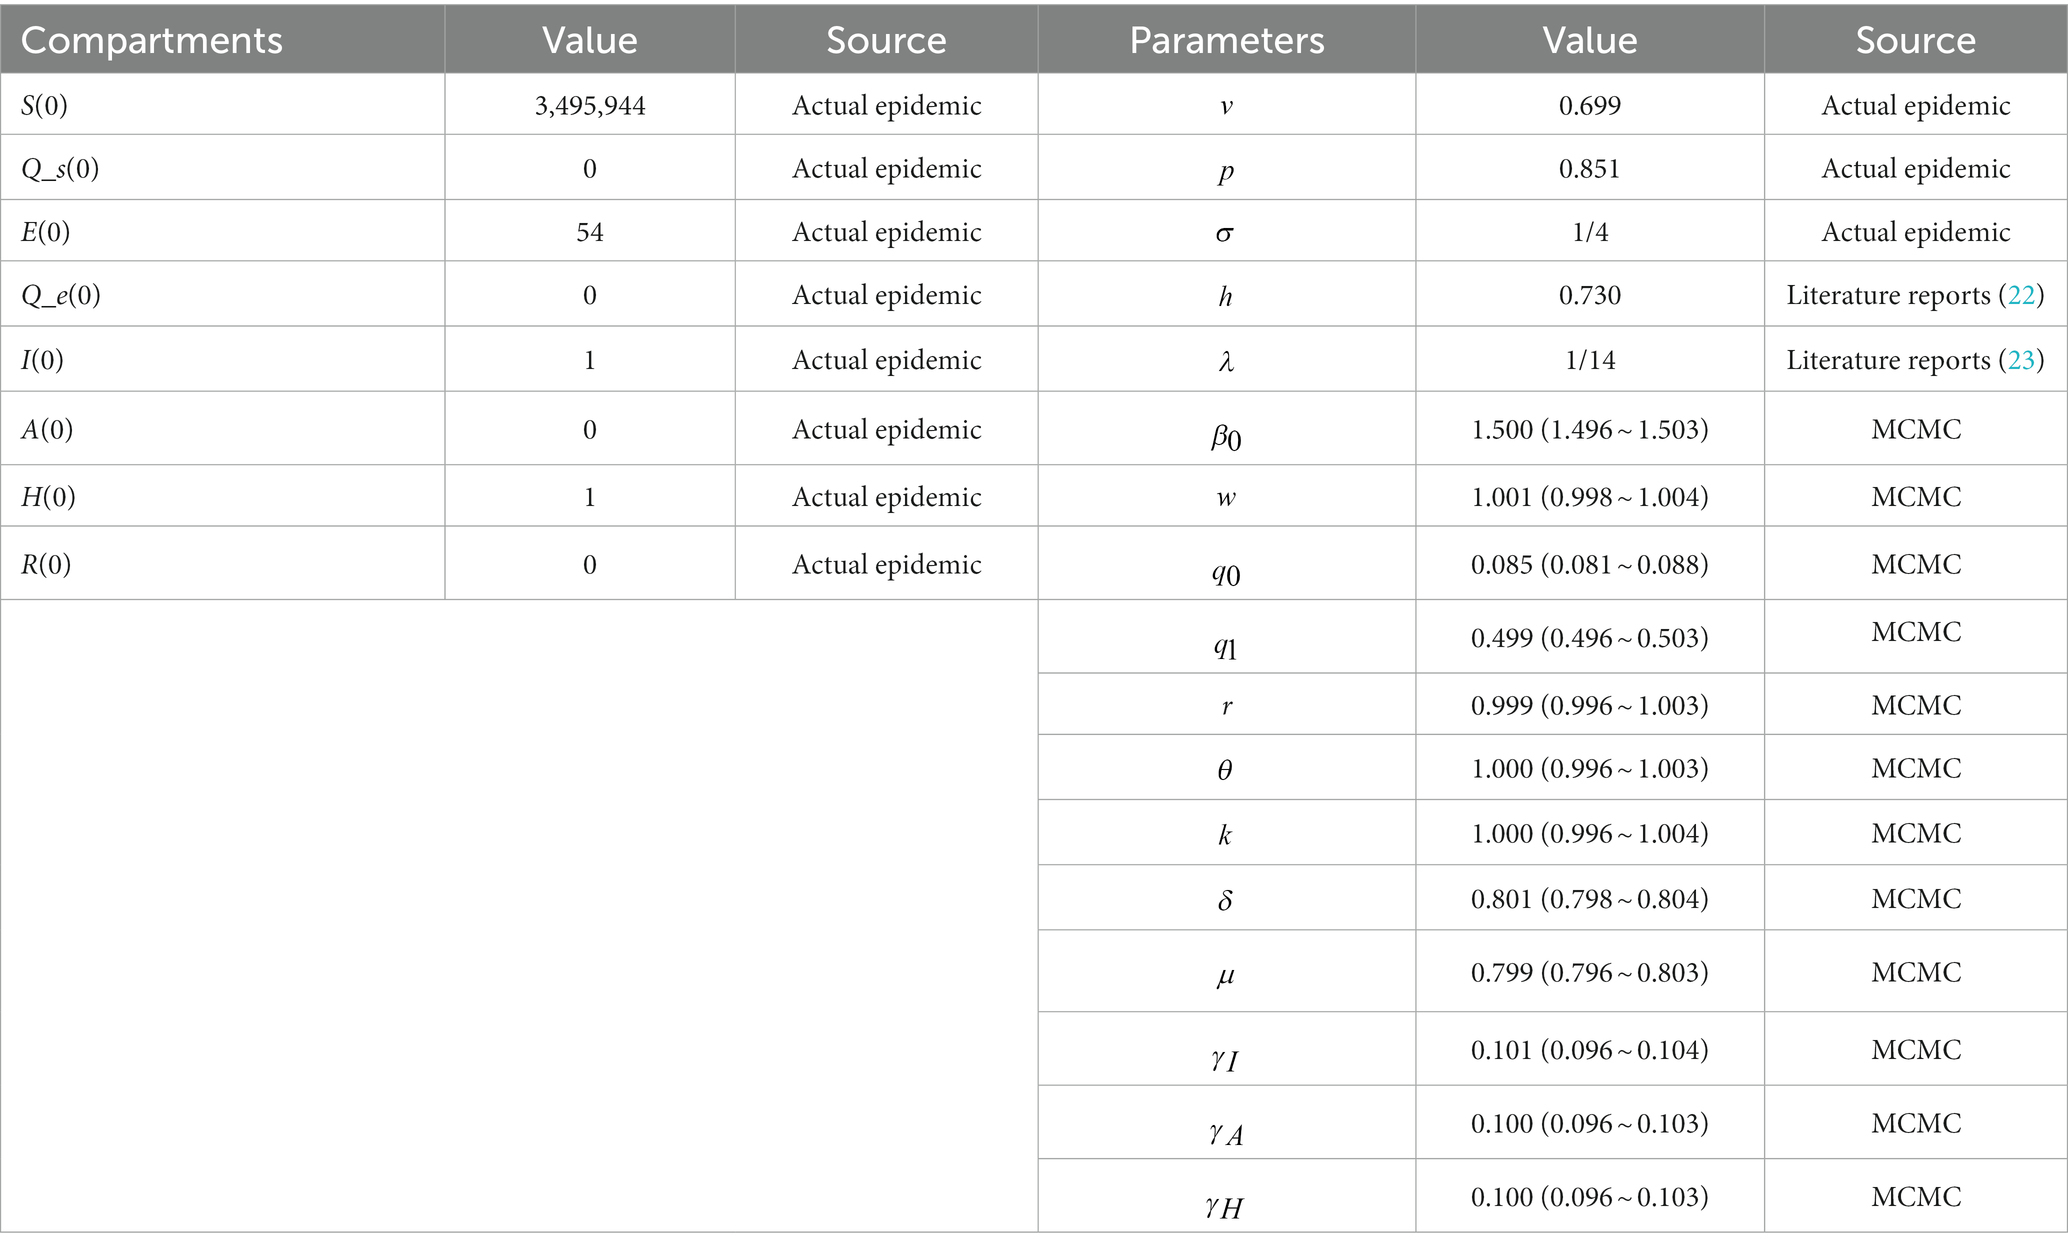
Table 2. The values and sources of model compartments and parameters.
The basic reproduction number (R0) is defined as the number of second-generation cases caused by an individual infected in a fully susceptible population without any intervention. It is a threshold indicator for measuring the transmission capacity of infectious diseases and determining the point of disease-free equilibrium. Notably, the effective reproduction number (Re) is more appropriate than R0 for assessing the effectiveness of vaccines or other non-pharmaceutical interventions. It can be used to track changes in the reproduction number, and whether the epidemic is controlled depends on whether Re is consistently less than 1.
The next-generation matrix method (24, 25) was applied to calculate Re:
The calculations of the SQEIAHR compartmental model were performed using Python software (version 3.7.1, Python Software Foundation, Python Language Reference). The figures were produced by GraphPad Prism software (version 9.0, La Jolla, CA, United States). The coefficient of determination (R2) was used to evaluate the goodness-of-fit of the model.
As of October 18, 2022, a total of 4,889 positive infected cases have been reported in Hohhot. Among them, 4,160 cases were asymptomatic, 727 were mild, 2 were moderate, and there were no severe or critical cases.
From September 28, 2022, the daily number of new infections showed a fluctuating growth trend, reaching the first peak (n = 653) on October 6, 2022, and then rapidly decreasing after arriving at the second peak (n = 645) on October 10, 2022 (Figure 2). A spatial distribution map of cumulative infected cases in Hohhot is shown in Figure 3. Among the information officially released by the Hohhot government on the activity trajectories of the 1,941 indigenous positive infected cases, nearly half of the cases were found in Xincheng District, followed by Huimin, Yuquan, and some other nearby districts, while southern areas such as Tuoketuo, Helingeer and Wuchuan had extremely low infection rates, accounting for a total of 0.72%.
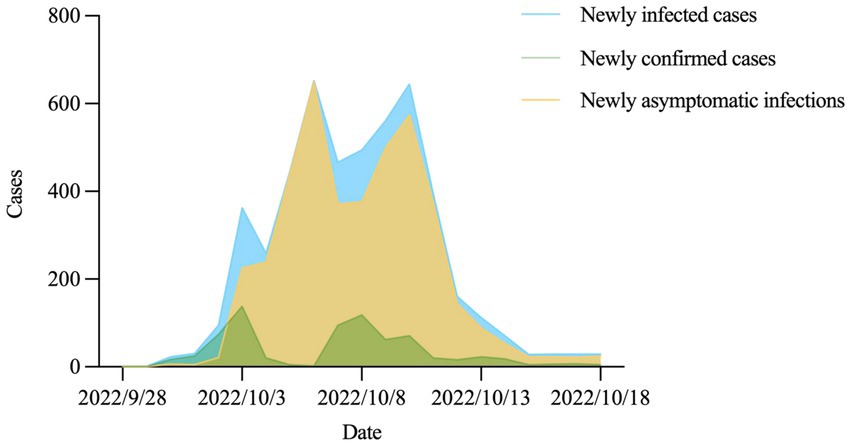
Figure 2. The daily number of new infections in Hohhot.

Figure 3. The spatial distribution of COVID-19 cases in Hohhot.
People with COVID-19 had broad age-specific variation, ranging from 3 days to 89 years of age. People in the 30–59 age group were the main victims of the current outbreak, accounting for 53.74% of the total cases. In terms of sex, females (n = 984) and males (n = 957) were almost equally affected, and the sex ratio was approximately 1.03:1 (Figure 4). In addition, community screening (35.70%) and centralized isolation screening (26.28%) were the main ways to detect cases, suggesting that the focus should be on the social transmission of the epidemic (Figure 5).
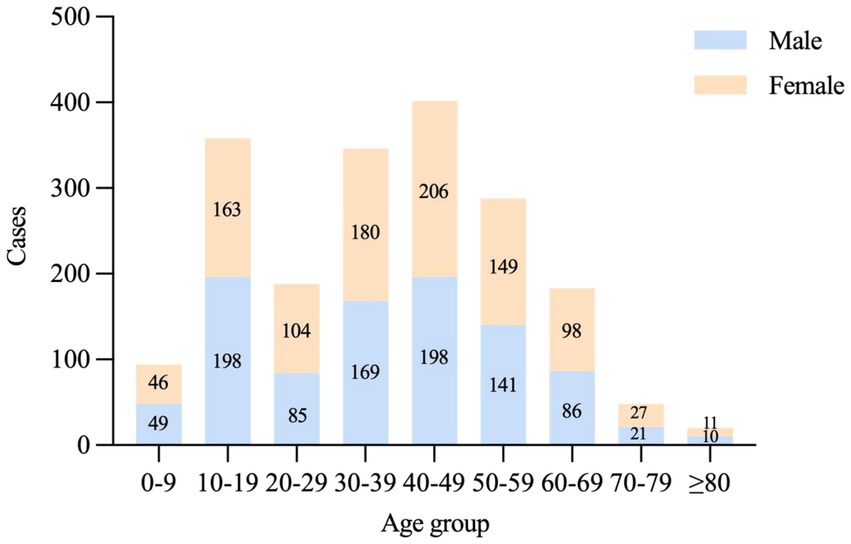
Figure 4. The distribution of age and sex of positive infected cases in Hohhot.
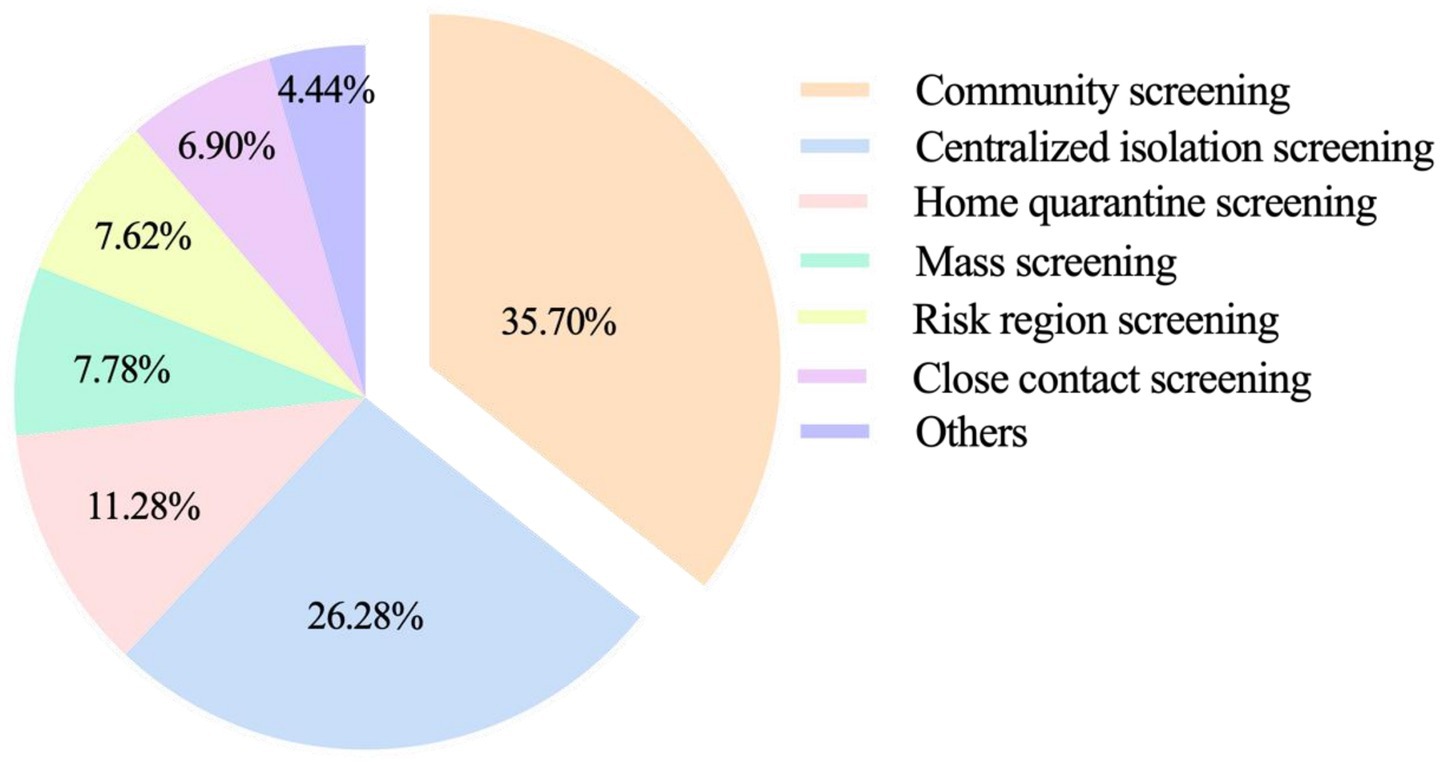
Figure 5. The distribution of identification methods of positive infected cases in Hohhot.
During the epidemic, the four most important indicators were the time to reach the peak, the time to achieve dynamic zero-COVID, the number of peak cases, and the cumulative number of infections (26). We plotted the actual daily number of new infections up to October 18, 2022, onto our forecasted curve and found that there was an overall good fit between our projected and reported data (R2 = 0.739, p < 0.001) (Figure 6A). The number of newly confirmed cases and newly asymptomatic infections was expected to reach an inflection point on October 6, 2022 (n = 629), with the sum of the two dropping below 100 cases on October 15, 2022, after which the epidemic gradually died out (Figures 6B,C). Our model predicted that the final affected population in Hohhot would reach 4,963 (95% confidential interval (95%CI): 4,692 ~ 5,267), including 740 (95%CI: 699 ~ 786) confirmed cases and 4,224 (95%CI: 3,993 ~ 4,481) asymptomatic infections (Table 3). The above projections demonstrated the reliability of our model in assessing COVID-19 trends (actual peak date: October 6, 2022; actual dynamic zero-COVID date: October 14, 2022; actual number of peak cases: 653; actual cumulative number of infections: 4,889).
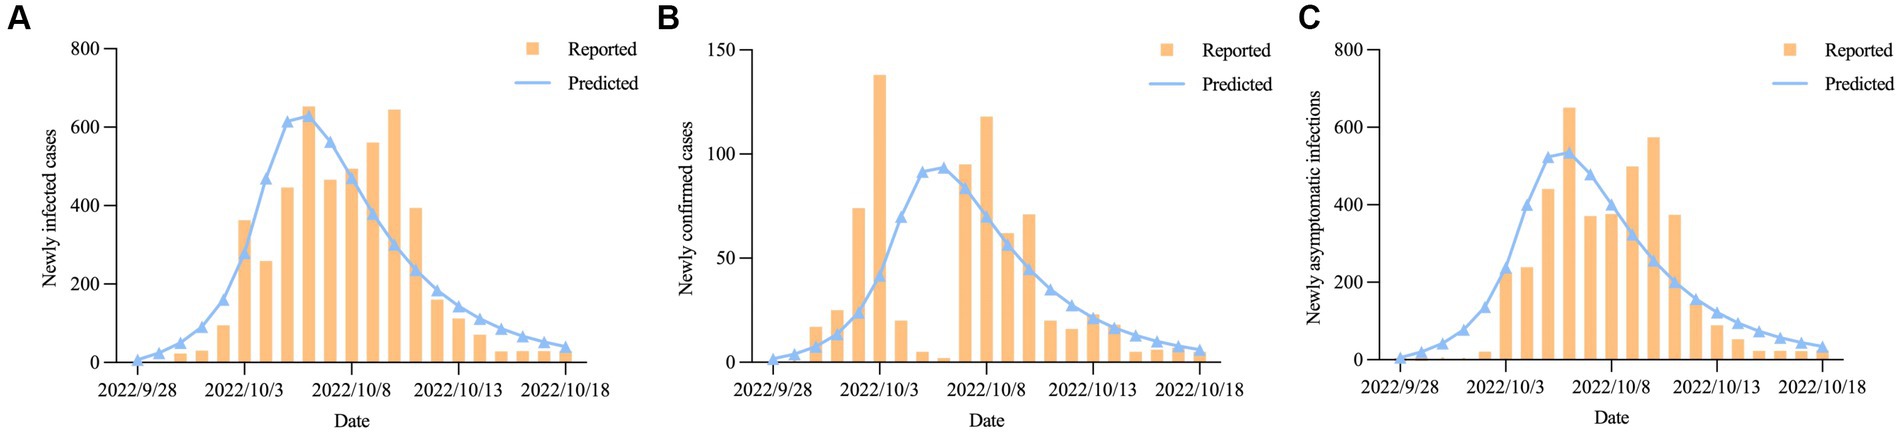
Figure 6. The predicted daily number of new COVID-19 cases in Hohhot; (A) Newly infected cases; (B) Newly confirmed cases. (C) Newly asymptomatic infections.
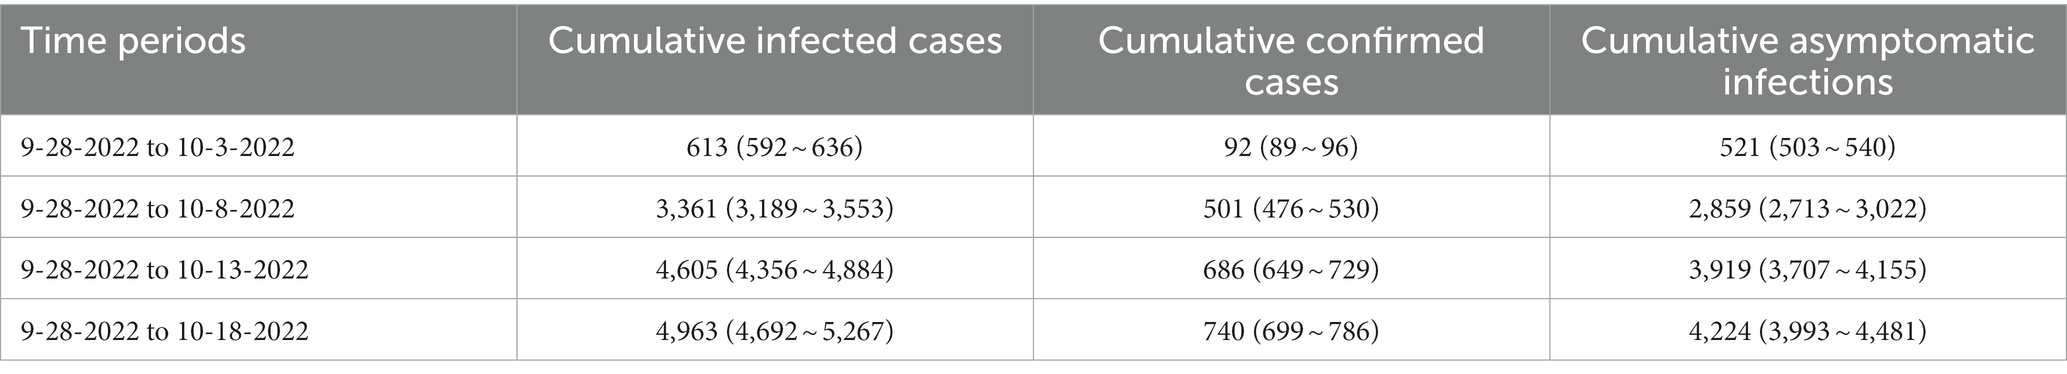
Table 3. The predicted cumulative number of COVID-19 cases in Hohhot in different time periods.
The effective reproduction number can be discussed in two stages. During the first stage, from September 28, 2022, to October 3, 2022, the risk of virus transmission increased as population mobility increased during the National Day holiday, with an R0 of approximately 7.01 (95%CI: 6.93 ~ 7.09). The second stage occurred after October 4, 2022. Following the implementation of a series of measures, such as multiple rounds of nucleic acid testing and resident travel control, Re began to decline rapidly until it dropped below 1.0 on October 6, 2022, and has since maintained a steady trend (Figure 7).
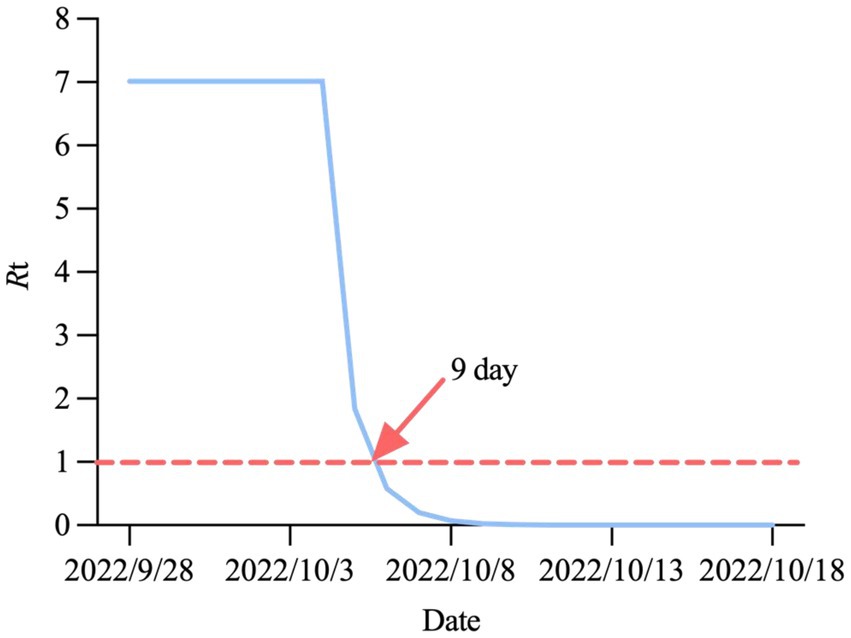
Figure 7. Change trend of Re in Hohhot.
In this study, higher stringency measures were aimed at curbing the spread of the epidemic by decreasing the transmission rate and increasing the quarantine rate. The scenario design of higher stringency measures was divided into three parts: (1) increasing the exponential decline rate of the transmission rate (2.000 vs. 1.001), (2) increasing the maximum quarantine rate (0.700 vs. 0.499) and the exponential increase rate of the quarantine rate (2.000 vs. 0.999), and (3) increasing the exponential decline rate of the transmission rate (2.000 vs. 1.001), the maximum quarantine rate (0.700 vs. 0.499), and the exponential increase rate of the quarantine rate (2.000 vs. 0.999). Our results showed that scenario design 3 was the optimal strategy: the time to reach the peak, the time to achieve dynamic zero-COVID, and the time for the Re curve to fall to 1.0 would be brought forward to October 5, 2022, October 13, 2022, and October 5, 2022, respectively, while the number of peak cases and final affected population would be greatly reduced by 14.31% and 19.83%, respectively (Figures 8A–C; Table 4).
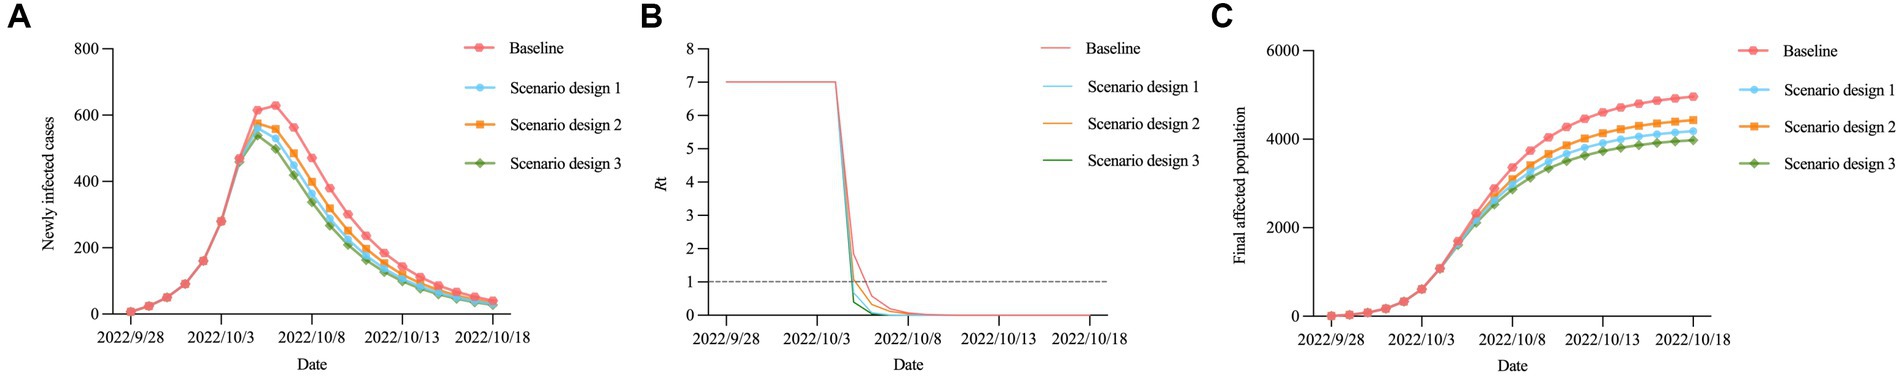
Figure 8. Trends in the epidemic under different measure scenarios. (A) Newly infected cases. (B) Re. (C) final affected population.
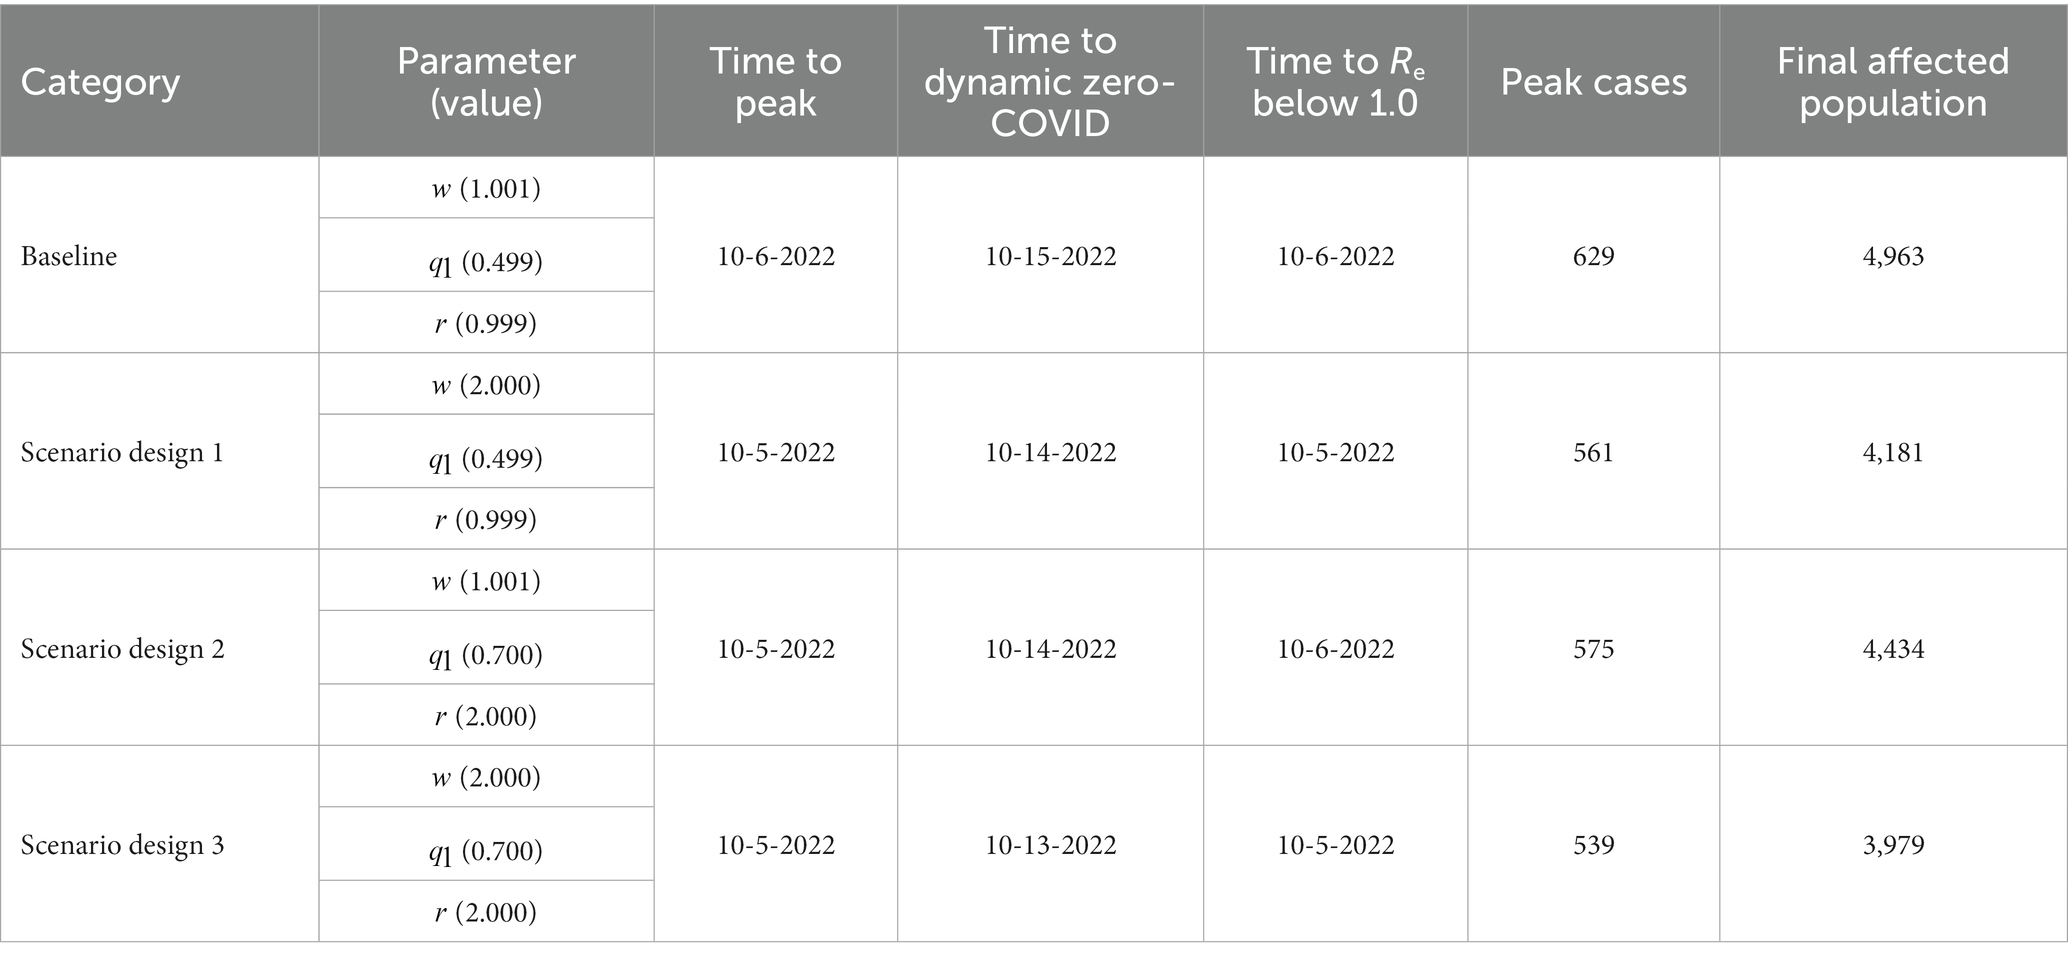
Table 4. Values of epidemic indicators under different measure scenarios.
Overall, the peak of the epidemic in Hohhot has passed, and the number of new cases is steadily declining, indicating that the epidemic has been effectively controlled. The time-varying SQEIAHR compartmental model we proposed in this study captured some important qualitative features and hence could provide guidance in policy-making. To the best of our knowledge, this is the most comprehensive report investigating the latest epidemiological characteristics and development trends of COVID-19 in Hohhot.
According to epidemiological investigations, the majority of cases in the current outbreak were asymptomatic and mild, which may be related to the fact that COVID-19 vaccination reduces the threat of serious illness and death (27). People aged 30–59 years were at particular risk of COVID-19, contrary to the finding that older people were the main vulnerable group (28). We conjectured that this might be because the middle-aged population has a wider range of activities and is more likely to be exposed to the virus, for example, engaging in group work or recreation. The key to stopping the spread of the virus is to identify all infections quickly. In Hohhot, those who had positive nucleic acid test results were mainly derived from community screening, indicating that the efficiency and scope of nucleic acid testing should be further improved (29). Wu Zunyou, chief epidemiologist at the Chinese Center for Disease Control and Prevention, recommended that “each round of mass screening should be completed within one to three days and be guaranteed to cover all target groups.” Additionally, areas with a large number of cases were primarily concentrated in the central part of Hohhot, and therefore, more medical resources should be prepared in advance and allocated to Xincheng and surrounding districts as soon as possible.
Dynamic model is an important method for the theoretical and quantitative study of infectious diseases. It can be used to describe the pattern of disease transmission, predict disease status and assess the effectiveness of prevention and control measures (30–32). The time-varying SQEIAHR model we constructed is methodologically robust and built on the classical SEIR model previously applied to forecast the development trends of infectious diseases. In earlier studies, scholars did not consider the impact of asymptomatic infections, immune threshold, and antibody titer reduction on the spread of the epidemic in their modeling due to an inadequate understanding of the transmission mechanisms and clinical characteristics of COVID-19 (33, 34). Our SQEIAHR model was inspired by the key factors mentioned above and accommodated the influence of the time-varying transmission rate, time-varying quarantine rate and reinfection, so the prediction results were highly robust.
The four key indicators predicted by our model were (1) the epidemic peak on October 6, 2022, (2) dynamic zero-COVID on October 15, 2022, (3) the number of peak cases of 629, and (4) the cumulative number of infections of 4,963, all of which were in fairly good agreement with the actual situation in Hohhot. Compared to the outbreak also caused by Omicron BF.7, the number of infections in Beijing far exceeded that in Hohhot (35). The reason for this is that at the time of the outbreak in Hohhot, China was still employing the “dynamic zero-COVID policy,” whereas the outbreak in Beijing occurred during the transition stage from the announcement of 20 measures to the gradual liberalization of the epidemic, so the intervention intensity was much more lenient than before, leading to a surge in infections. The effective reproduction number is a critical threshold parameter in epidemiology that can be used to measure the real-time transmissibility of an outbreak (36). Initially, R0 was a constant greater than 7. After the implementation of a series of control measures, Re showed a rapid downward trend, and it took only nine days from the discovery of the first case to achieve an Re below 1.0. After the outbreak of COVID-19 in Shanghai on March 1, 2022, Re did not drop below 1.0 until day 45 (37). This reflects the remarkable achievement of epidemic prevention and control efforts in Hohhot.
Non-pharmaceutical interventions such as decreasing the transmission rate and increasing the quarantine rate have been recommended in the battle against COVID-19. We conducted a quantitative comparison of different intervention strategies and found significant effects of a combination of both in shortening the time to peak, the time to dynamic zero-COVID and the time to an Re below 1.0, while substantially reducing the number of peak cases and accumulated cases. These results emphasized the importance of decreasing the transmission rate by travel restrictions and the necessity of increasing the quarantine rate by close-contact tracing. Liu W et al. also recommended that isolation measures be implemented in communities and outbreak sites in a timely manner to ensure social distancing between people, thereby reducing the level of human contact (38). It is worth noting that the values of and in the scenario design only increased by a very small amount, and we have reason to believe that with the further strengthening of prevention and control measures, even better results will be achieved.
Admittedly, this study has some limitations. First, our model did not take into account the difference between the rate of reinfection among recovered individuals and the rate of infection in the general population. Second, in addition to decreasing the transmission rate and increasing the quarantine rate, other interventions, such as promoting a social consensus on self-protection and expanding environmental decontamination, may also have a potential impact on the development of the epidemic. In reality, the end of the outbreak may come earlier than we predicted. In future work, efforts must be made to optimize the SQEIAHR model by introducing additional parameters that can reflect different infection rates and non-pharmaceutical interventions. Work is also needed to test the model in various geographical and demographic contexts.
In this paper, we developed a time-varying SQEIAHR compartmental model to investigate the transmission dynamics of COVID-19. Our projections suggested that this model was well suited to capture key epidemic indicators, including the time to reach the peak, the time to achieve dynamic zero-COVID, the number of peak cases, and the cumulative number of infections. Moreover, decreasing the transmission rate by travel restrictions and increasing the quarantine rate by close-contact tracing could achieve remarkable results in curbing the spread of COVID-19. These findings can not only help health departments prepare in advance for a possible outbreak of COVID-19 but also provide an important reference for optimizing non-pharmaceutical intervention programs.
The original contributions presented in the study are included in the article/Supplementary material, further inquiries can be directed to the corresponding authors.
JX, HY, and TW conceived the study and revised the manuscript critically. JL, LL, and LH collected the data. YM prepared the first draft of the manuscript. YM, SX, and YL developed the model and analyzed the results. SX and YQ prepared the tables and figures. All authors contributed to the article and approved the submitted version.
This study was supported by the National Key Research and Development Program of China (2021YFC2301603), the Major Science and Technology Project of Shanxi Province (202102130501003 and 202005D121008), and the Special Foundation on COVID-19 of Shanxi Health Commission (16).
The authors would like to thank all group members for their helpful comments on the manuscript and valuable assistance in coordinating the data collection.
The authors declare that the research was conducted in the absence of any commercial or financial relationships that could be construed as a potential conflict of interest.
All claims expressed in this article are solely those of the authors and do not necessarily represent those of their affiliated organizations, or those of the publisher, the editors and the reviewers. Any product that may be evaluated in this article, or claim that may be made by its manufacturer, is not guaranteed or endorsed by the publisher.
The Supplementary material for this article can be found online at: https://www.frontiersin.org/articles/10.3389/fpubh.2023.1175869/full#supplementary-material
1. Gao, Z, Xu, Y, Sun, C, Wang, X, Guo, Y, Qiu, S, et al. A systematic review of asymptomatic infections with COVID-19. J Microbiol Immunol Infect. (2021) 54:12–6. doi: 10.1016/j.jmii.2020.05.001
2. Singh, RK, Rani, M, Bhagavathula, AS, Sah, R, Rodriguez-Morales, AJ, Kalita, H, et al. Prediction of the COVID-19 pandemic for the top 15 affected countries: advanced autoregressive integrated moving average (ARIMA) model. JMIR Public Health Surveill. (2020) 6:e19115. doi: 10.2196/19115
3. World Health Organization. (2021). Classification of Omicron (B.1.1.529): SARS-CoV-2 variant of concern. Available at: https://www.who.int/news/item/26-11-2021-classification-of-omicron-(b.1.1.529)-sars-cov-2-variant-of-concern (Accessed January 20, 2023).
4. Cai, J, Deng, X, Yang, J, Sun, K, Liu, H, Chen, Z, et al. Modeling transmission of SARS-CoV-2 Omicron in China. Nat Med. (2022) 28:1468–75. doi: 10.1038/s41591-022-01855-7
5. Oeser, C, Whitaker, H, Borrow, R, Linley, E, Tonge, S, Rowe, C, et al. Following the Omicron wave, the majority of children in England have evidence of previous COVID infection. J Infect. (2023) 86:256–308. doi: 10.1016/j.jinf.2022.12.012
6. Wang, L, Berger, NA, Kaelber, DC, Davis, PB, Volkow, ND, and Xu, R. COVID infection rates, clinical outcomes, and racial/ethnic and gender disparities before and after Omicron emerged in the US. medRxiv. (2022):22271300. doi: 10.1101/2022.02.21.22271300
7. Wangping, J, Ke, H, Yang, S, Wenzhe, C, Shengshu, W, Shanshan, Y, et al. Extended SIR prediction of the epidemics trend of COVID-19 in Italy and compared with Hunan, China. Front Med (Lausanne). (2020) 7:169. doi: 10.3389/fmed.2020.00169
8. He, S, Peng, Y, and Sun, K. SEIR modeling of the COVID-19 and its dynamics. Nonlinear Dyn. (2020) 101:1667–80. doi: 10.1007/s11071-020-05743-y
9. Zu, J, Li, ML, Li, ZF, Shen, MW, Xiao, YN, and Ji, FP. Transmission patterns of COVID-19 in the mainland of China and the efficacy of different control strategies: a data- and model-driven study. Infect Dis Poverty. (2020) 9:83. doi: 10.1186/s40249-020-00709-z
10. Huarachi Olivera, RE, and Lazarte RIvera, AM. Modelo SIR de la tendencia pandémica de COVID-19 en Perú. Rev Fac Cien Med Univ Nac Cordoba. (2021) 78:236–42. doi: 10.31053/1853.0605.v78.n3.31142
11. Hao, X, Cheng, S, Wu, D, Wu, T, Lin, X, and Wang, C. Reconstruction of the full transmission dynamics of COVID-19 in Wuhan. Nature. (2020) 584:420–4. doi: 10.1038/s41586-020-2554-8
12. Shin, HY. A multi-stage SEIR(D) model of the COVID-19 epidemic in Korea. Ann Med. (2021) 53:1160–70. doi: 10.1080/07853890.2021.1949490
13. Kuniya, T. Prediction of the epidemic peak of coronavirus disease in Japan, 2020. J Clin Med. (2020) 9:789. doi: 10.3390/jcm9030789
14. Aouissi, HA, Hamimes, A, Ababsa, M, Bianco, L, Napoli, C, Kebaili, FK, et al. Bayesian modeling of COVID-19 to classify the infection and death rates in a specific duration: the case of Algerian provinces. Int J Environ Res Public Health. (2022) 19:9586. doi: 10.3390/ijerph19159586
15. Matta, J, Wiernik, E, Robineau, O, Carrat, F, Touvier, M, Severi, G, et al. Association of Self-reported COVID-19 infection and SARS-CoV-2 serology test results with persistent physical symptoms among French adults during the COVID-19 pandemic. JAMA Intern Med. (2022) 182:19–25. doi: 10.1001/jamainternmed.2021.6454
16. Leveau, CM, Aouissi, HA, and Kebaili, FK. Spatial diffusion of COVID-19 in Algeria during the third wave. GeoJournal. (2022) 88:1175–80. doi: 10.1007/s10708-022-10608-5
17. Sharov, KS. Creating and applying SIR modified compartmental model for calculation of COVID-19 lockdown efficiency. Chaos Solitons Fractals. (2020) 141:110295. doi: 10.1016/j.chaos.2020.110295
18. Campillo-Funollet, E, van Yperen, J, Allman, P, Bell, M, Beresford, W, Clay, J, et al. Predicting and forecasting the impact of local outbreaks of COVID-19: use of SEIR-D quantitative epidemiological modelling for healthcare demand and capacity. Int J Epidemiol. (2021) 50:1103–13. doi: 10.1093/ije/dyab106
19. Nyabadza, F, Chirove, F, Chukwu, CW, and Visaya, MV. Modelling the potential impact of social distancing on the COVID-19 epidemic in South Africa. Comput Math Methods Med. (2020) 2020:5379278–12. doi: 10.1155/2020/5379278
20. Mbuvha, R, and Marwala, T. Bayesian inference of COVID-19 spreading rates in South Africa. PLoS One. (2020) 15:e0237126. doi: 10.1371/journal.pone.0237126
21. Nakhaeizadeh, M, Chegeni, M, Adhami, M, Sharifi, H, Gohari, MA, Iranpour, A, et al. Estimating the number of COVID-19 cases and impact of new COVID-19 variants and vaccination on the population in Kerman, Iran: a mathematical modeling study. Comput Math Methods Med. (2022) 2022:6624471–11. doi: 10.1155/2022/6624471
22. Zhang, H, Jia, Y, Ji, Y, Cong, X, Liu, Y, Yang, R, et al. Studies on the level of neutralizing antibodies produced by inactivated COVID-19 vaccines in the real world. (2021). Available at: https://www.medrxiv.org/content/10.1101/2021.08.18.21262214v1.
23. Tang, B, Wang, X, Li, Q, Bragazzi, NL, Tang, S, Xiao, Y, et al. Estimation of the transmission risk of the 2019-nCoV and its implication for public health interventions. J Clin Med. (2020) 9:462. doi: 10.3390/jcm9020462
24. van den Driessche, P, and Watmough, J. Reproduction numbers and sub-threshold endemic equilibria for compartmental models of disease transmission. Math Biosci. (2002) 180:29–48. doi: 10.1016/s0025-5564(02)00108-6
25. Zhao, S, Lin, Q, Ran, J, Musa, SS, Yang, G, Wang, W, et al. Preliminary estimation of the basic reproduction number of novel coronavirus (2019-nCoV) in China, from 2019 to 2020: a data-driven analysis in the early phase of the outbreak. Int J Infect Dis. (2020) 92:214–7. doi: 10.1016/j.ijid.2020.01.050
26. Lin, SN, Rui, J, Chen, QP, Zhao, B, Yu, SS, Li, ZY, et al. Effectiveness of potential antiviral treatments in COVID-19 transmission control: a modelling study. Infect Dis Poverty. (2021) 10:53. doi: 10.1186/s40249-021-00835-2
27. Li, Y, Li, M, Rice, M, Su, Y, and Yang, C. Phased implementation of COVID-19 vaccination: rapid assessment of policy adoption, reach and effectiveness to protect the most vulnerable in the US. Int J Environ Res Public Health. (2021) 18:7665. doi: 10.3390/ijerph18147665
28. Zhou, F, Yu, T, du, R, Fan, G, Liu, Y, Liu, Z, et al. Clinical course and risk factors for mortality of adult inpatients with COVID-19 in Wuhan, China: a retrospective cohort study. Lancet. (2020) 395:1054–62. doi: 10.1016/S0140-6736(20)30566-3
29. Wang, Q, Zhao, X, Yue, Z, Bai, X, Rao, H, Han, N, et al. Increasing SARS-CoV-2 nucleic acid testing capacity during the COVID-19 epidemic in Beijing: experience from a general hospital. Emerg Microbes Infect. (2020) 9:2358–60. doi: 10.1080/22221751.2020.1837016
30. Wu, JT, Leung, K, and Leung, GM. Nowcasting and forecasting the potential domestic and international spread of the 2019-nCoV outbreak originating in Wuhan, China: a modelling study. Lancet. (2020) 395:689–97. doi: 10.1016/S0140-6736(20)30260-9
31. Zhang, Y, Li, L, Jiang, Y, and Huang, B. Analysis of COVID-19 prevention and control effects based on the SEITRD dynamic model and Wuhan epidemic statistics. Int J Environ Res Public Health. (2020) 17:9309. doi: 10.3390/ijerph17249309
32. Liu, W, Ye, W, Zhao, Z, Liu, C, Deng, B, Luo, L, et al. Modelling the emerging COVID-19 epidemic and estimating intervention effectiveness – Taiwan, China, 2021. China CDC Wkly. (2021) 3:716–9. doi: 10.46234/ccdcw2021.177
33. López, L, and Rodó, X. A modified SEIR model to predict the COVID-19 outbreak in Spain and Italy: simulating control scenarios and multi-scale epidemics. Results Phys. (2021) 21:103746. doi: 10.1016/j.rinp.2020.103746
34. Khyar, O, and Allali, K. Global dynamics of a multi-strain SEIR epidemic model with general incidence rates: application to COVID-19 pandemic. Nonlinear Dyn. (2020) 102:489–509. doi: 10.1007/s11071-020-05929-4
35. Leung, K, Lau, EHY, Wong, CKH, Leung, GM, and Wu, JT. Estimating the transmission dynamics of SARS-CoV-2 Omicron BF.7 in Beijing after adjustment of the zero-COVID policy in November-December 2022. Nat Med. (2023) 29:579–82. doi: 10.1038/s41591-023-02212-y
36. Wan, H, Cui, JA, and Yang, GJ. Risk estimation and prediction of the transmission of coronavirus disease-2019 (COVID-19) in the mainland of China excluding Hubei province. Infect Dis Poverty. (2020) 9:116. doi: 10.1186/s40249-020-00683-6
37. Ma, Y, Xu, S, An, Q, Qin, M, Li, S, Lu, K, et al. Coronavirus disease 2019 epidemic prediction in Shanghai under the “dynamic zero-COVID policy” using time-dependent SEAIQR model. J Biosaf Biosecur. (2022) 4:105–13. doi: 10.1016/j.jobb.2022.06.002
Keywords: COVID-19, epidemiological characteristics, transmission dynamics, time-varying SQEIAHR model, effective reproduction number, higher stringency measures
Citation: Ma Y, Xu S, Luo Y, Qin Y, Li J, Lei L, He L, Wang T, Yu H and Xie J (2023) Epidemiological characteristics and transmission dynamics of the COVID-19 outbreak in Hohhot, China: a time-varying SQEIAHR model analysis. Front. Public Health. 11:1175869. doi: 10.3389/fpubh.2023.1175869
Edited by:
Reza Lashgari, Shahid Beheshti University, IranReviewed by:
Hani Amir Aouissi, Scientific and Technical Research Center on Arid Regions (CRSTRA), AlgeriaCopyright © 2023 Ma, Xu, Luo, Qin, Li, Lei, He, Wang, Yu and Xie. This is an open-access article distributed under the terms of the Creative Commons Attribution License (CC BY). The use, distribution or reproduction in other forums is permitted, provided the original author(s) and the copyright owner(s) are credited and that the original publication in this journal is cited, in accordance with accepted academic practice. No use, distribution or reproduction is permitted which does not comply with these terms.
*Correspondence: Tong Wang, dG9uZ3dhbmdAc3htdS5lZHUuY24=; Hongmei Yu, eXVAc3htdS5lZHUuY24=; Jun Xie, anVueGllc3htdUAxNjMuY29t
Disclaimer: All claims expressed in this article are solely those of the authors and do not necessarily represent those of their affiliated organizations, or those of the publisher, the editors and the reviewers. Any product that may be evaluated in this article or claim that may be made by its manufacturer is not guaranteed or endorsed by the publisher.
Research integrity at Frontiers
Learn more about the work of our research integrity team to safeguard the quality of each article we publish.