
95% of researchers rate our articles as excellent or good
Learn more about the work of our research integrity team to safeguard the quality of each article we publish.
Find out more
ORIGINAL RESEARCH article
Front. Public Health , 18 April 2023
Sec. Environmental Health and Exposome
Volume 11 - 2023 | https://doi.org/10.3389/fpubh.2023.1166056
 Yongcheng Zhu1Yudong Mao2
 Yanling Li1Tianwei Tang2Huilin Jiang1Sicheng Qiao1
 Shaopeng Lin1Zhimin Zheng2
 Zhaosong Fang2*
 Xiaohui Chen1*
Since the advent of coronavirus disease 2019 (COVID-19), healthcare workers (HCWs) wearing personal protective equipment (PPE) has become a common phenomenon. COVID-19 outbreaks overlap with heat waves, and healthcare workers must unfortunately wear PPE during hot weather and experience excessive heat stress. Healthcare workers are at risk of developing heat-related health problems during hot periods in South China. The investigation of thermal response to heat stress among HCWs when they do not wear PPE and when they finish work wearing PPE, and the impact of PPE use on HCWs’ physical health were conducted. The field survey were conducted in Guangzhou, including 11 districts. In this survey, HCWs were invited to answer a questionnaire about their heat perception in the thermal environment around them. Most HCWs experienced discomfort in their back, head, face, etc., and nearly 80% of HCWs experienced “profuse sweating.” Up to 96.81% of HCWs felt “hot” or “very hot.” The air temperature had a significant impact on thermal comfort. Healthcare workers’ whole thermal sensation and local thermal sensation were increased significantly by wearing PPE and their thermal sensation vote (TSV) tended towards “very hot.” The adaptive ability of the healthcare workers would decreased while wearing PPE. In addition, the accept range of the air temperature (Ta) were determined in this investigation.
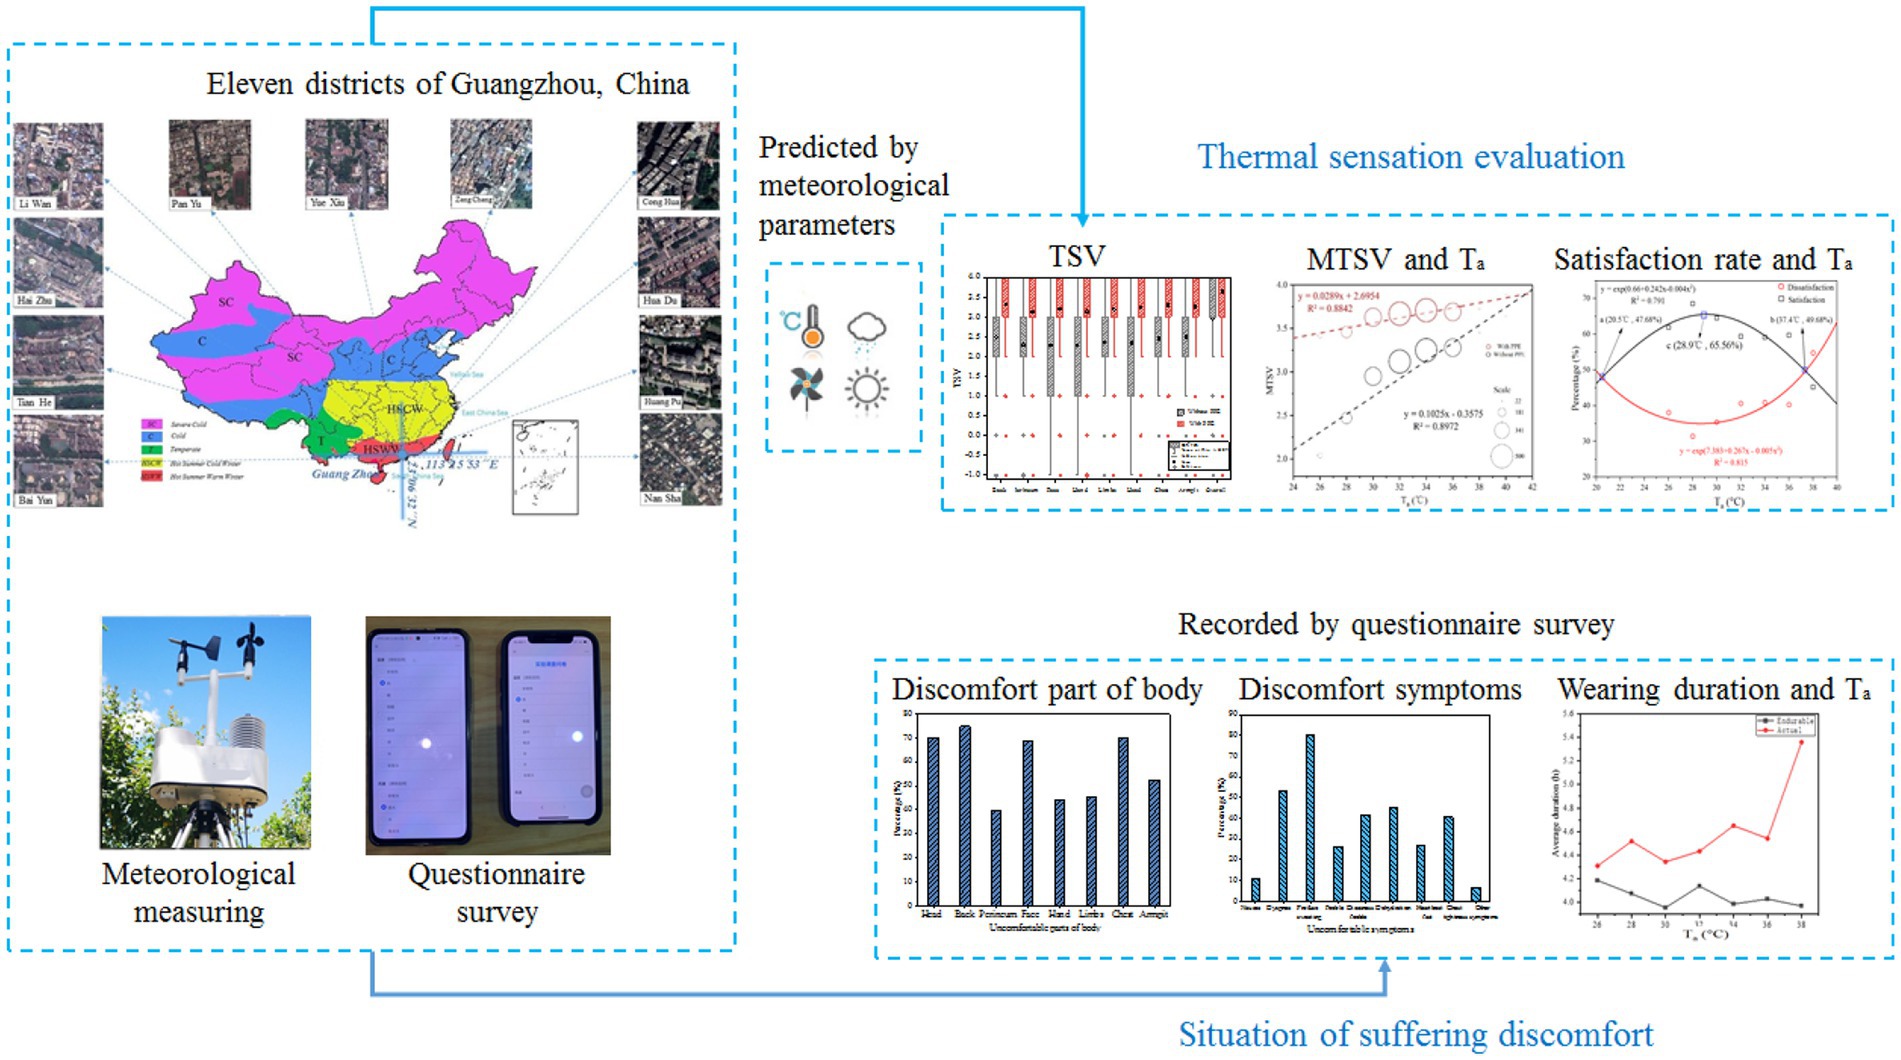
Graphical Abstract
Occupational health problems are gaining public attention as the global temperature rises and heatwaves become more frequent (1, 2). Many previous investigations (3, 4) proved workers’ exposure to hot weather with an increased risk of workplace injuries and accidents at high temperatures and during heat waves. Thus, the health of worker exposing to hot weather needs attention. In addition, the World Health Organization (WHO) announced the coronavirus disease 2019 (COVID-19) outbreak as a pandemic On March 11, 2020 (5). It is one of the largest global health emergencies since the Second World War, and has had an unprecedented impact around the world and resulted in a 2–3% increased fatality rate (6). Highly infectious diseases are transmitted by inhalation or by contact with infected droplets, thereby causing mild to moderate respiratory illness that progresses to pneumonia, septic shock, acute respiratory distress syndrome, and cytokine release syndrome (7). COVID-19 can be transmitted through contact with an infected person and through infected secretions such as saliva, respiratory secretions, or droplets emitted by an infected person (8–10). Therefore, a large number of HCWs become infected after contact with patients. This factor has led to the increased use of personal protective equipment (PPE) in healthcare settings. As one of the only isolation equipment between HCWs and patients, PPE is of great importance in reducing the risks of infection among HCWs (11). PPE includes equipment or specific clothing (e.g., respiratory and eye protection, gown, and gloves) that protect health staff against infectious materials. PPE can effectively protect health staff; however, it increases the thermal discomfort of health staff working in a high-temperature and humid environment, thereby resulting in reduced work efficiency and possible health problems if worn for a long time (12). Therefore, studying heat stress in healthcare workers wearing PPE is important.
The evaluation of thermal sensation is an important method for studying the thermal comfort of the human body in special environments ((13); Lai and Chen, 2019b; (14–16)) artificially analyzed the changes in air disturbance and conducted walking speed experiments. Liu et al. (14) studied the effects of four important microclimate parameters on outdoor thermal sensation and neutral temperature and determined that seasonal and regional differences exist in outdoor neutral temperature. Fang et al. (13) studied the thermal stress and thermal safety of workers at construction sites by using a thermal evaluation method. Therefore, previous studies provide a basis and reference for this study.
In addition, collecting nucleic acid samples can be difficult for healthcare workers wearing PPE. Working in a high-temperature and humid environment for a long time can easily lead to physical exhaustion, severe dehydration, dizziness, retching, etc. (13, 17–19). Therefore, studying the sensation of the air temperature and humidity of the health staff is very important. When the human body senses that the temperature is too high or the humidity is too high, the body will experience heat stress (20, 21). After sweating substantially, the body will have a sense of discomfort, thereby decreasing work efficiency (13, 22–25). Wu et al. (26) found that, without a cooling process, the air temperature in a microenvironment is higher than 32°C, which cannot meet the requirements of thermal comfort. Therefore, the working conditions and hours of healthcare workers require more attention.
At present, some scholars have conducted some research on heat stress and the use of PPE (27–30). Jegodka et al. (28) found that 91% of the medical staff participating in the survey had various symptoms after wearing PPE, such as back pain, headache, fatigue, lack of sleep, etc. In addition, 46% of the participants were suffering from hypertension, depression, diabetes and other existing diseases. These problems may cause more serious mental and physical burdens on work in addition to being uncomfortable in high temperatures. Davey et al. (27) pointed out that approximately 65% of respondents reported that one or more cognitive tasks were impaired when wearing PPE. This impairment in cognition may not only affect performance, but also compromises the health and safety of HCWs and patients. Heat stress impairs cognition and physical performance. Most respondents said that wearing PPE would make their work more difficult. In addition, studies have shown that ultrasound exposure has a health impact (32). In conclusion, even in the health sector, standards, guidelines and codes of practice need to be developed to provide high-temperature protection for HCWs [(29, 30); Jacklitsch et al., 2016 (31)].
In summary, this study aimed to investigate the differences in thermal sensation evaluation of healthcare workers before and after wearing personal protective equipment, to analyze the change regulation of human thermal sensation under different air temperatures, and to establish a regression model of thermal evaluation. First, the change distribution of thermal sensation vote and wet sensation vote of whole and local (i.e., face, head, back, chest, limbs, and hands) before and after wearing PPE was analyzed using statistical analysis. Second, the difference between each part was determined by analyzing the overall and local (i.e., face, head, back, chest, limbs, and hands) thermal sensation evaluation and the change in air temperature. Finally, the neutral temperature and acceptable temperature ranges were studied by analyzing the unacceptability of the air temperature of health care workers when they wore protective clothing.
Guangzhou is in the Pearl River Delta in South China and has a typical subtropical climate (112°E to 114.2°E and 22.3°N to 24.1°N; Figure 1). The questionnaire was collected from each nucleic acid testing site in Guangzhou. Nucleic acid testing is often conducted in outdoor environments. The working environment of the health staff is very poor, and they have to wear PPE. Therefore, health problems are more likely to occur. Guangzhou has high temperature and humidity in June. As shown in Figure 2, based on the data of Guangzhou Meteorological Station, the average temperature reached 30°C in Guangzhou in June, the maximum outdoor temperature reached 37°C, and the average relative humidity was 70%. Therefore, people often experience the outdoors as muggy.
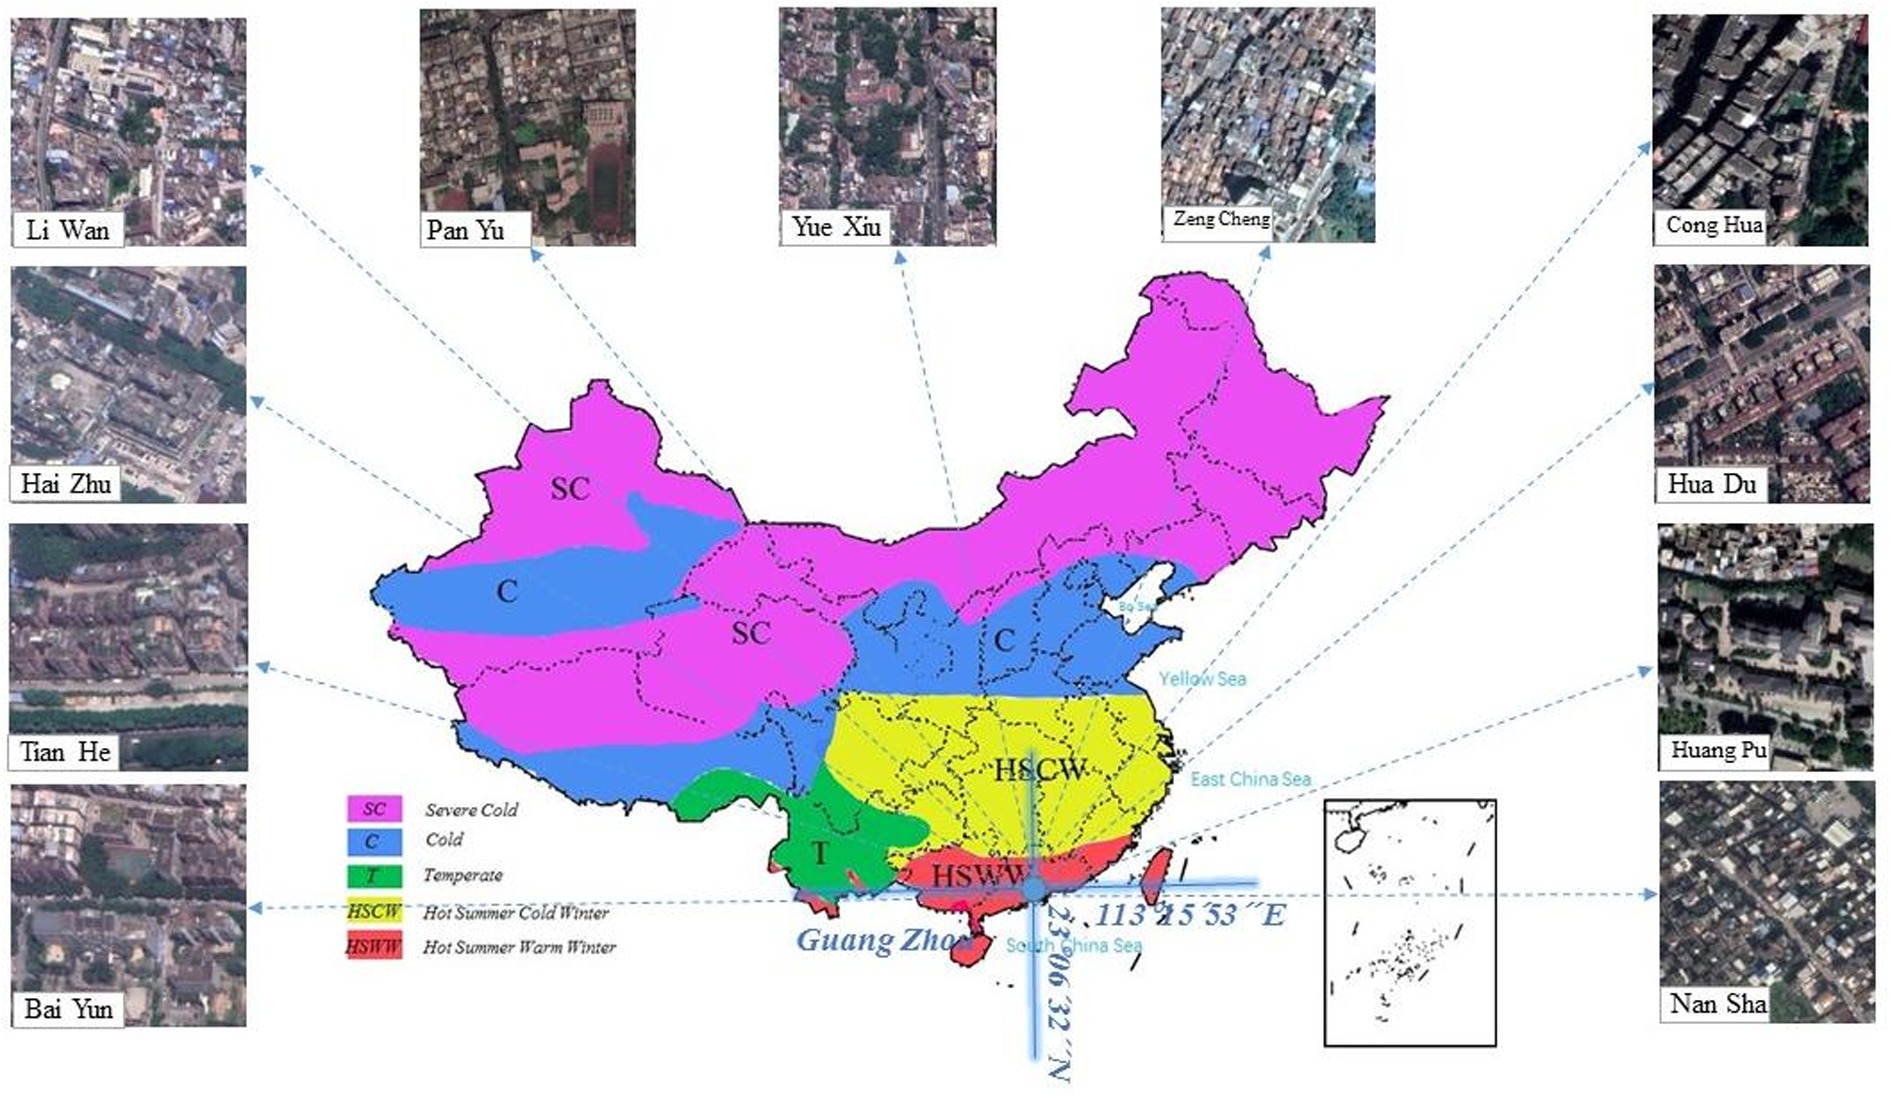
Figure 1. The location of Guangzhou and its districts.
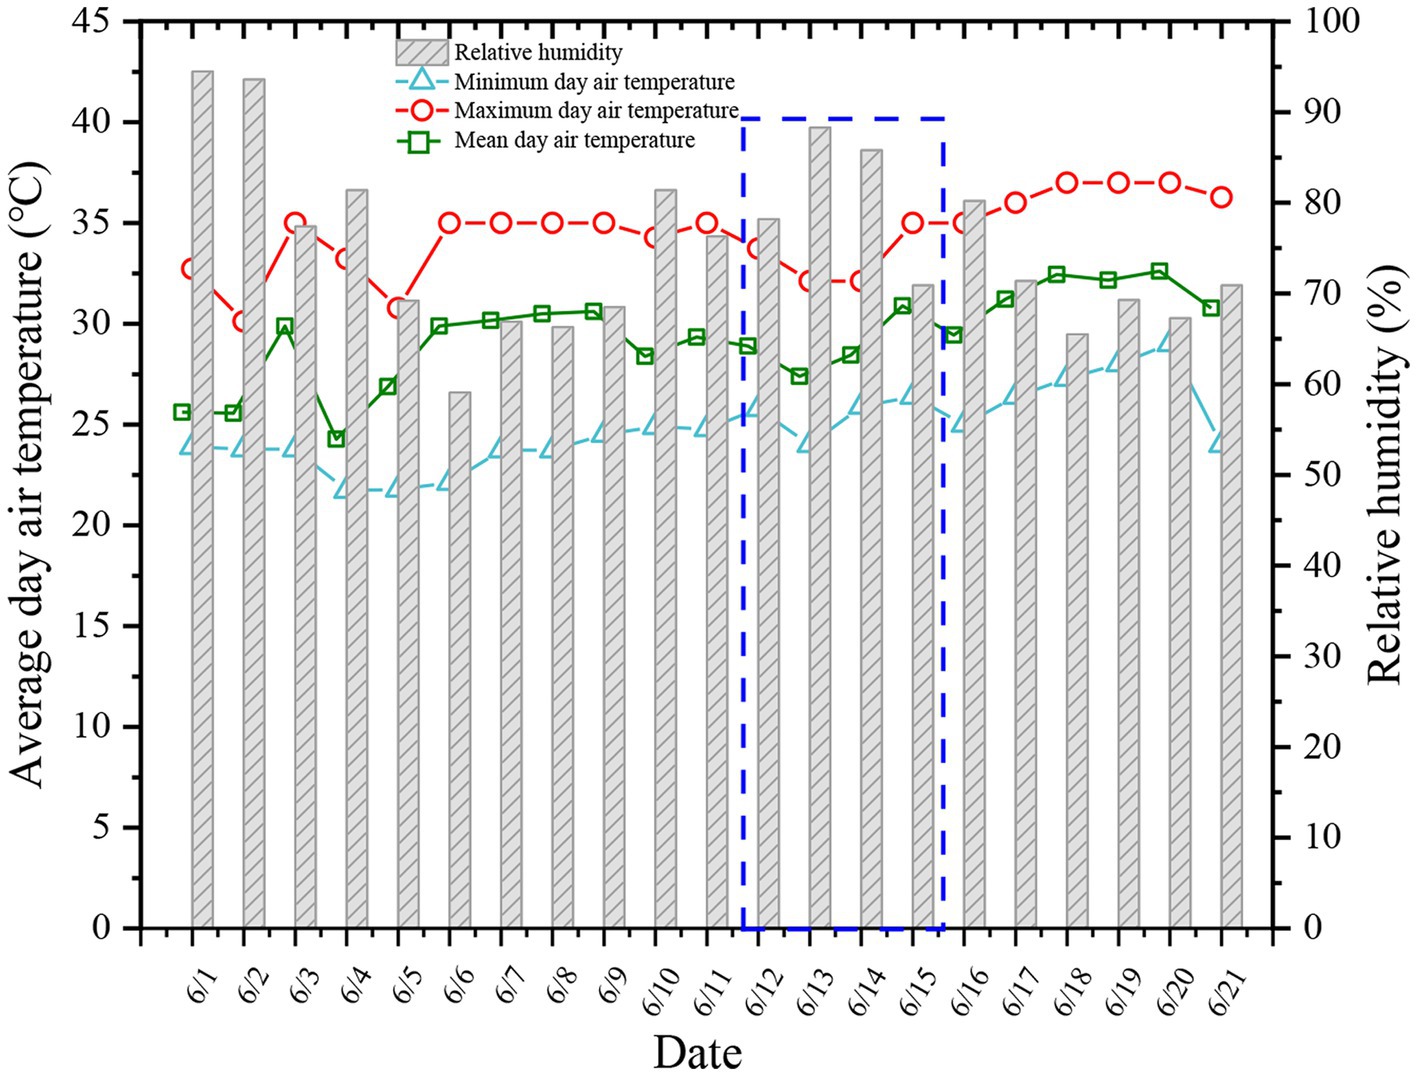
Figure 2. Distribution of temperature and humidity in Guangzhou in June 2021.
A total of 2,191 questionnaires were collected from 373 (17%) male participants and 1818 (83%) female participants. Their job duty was to collect nucleic acids at stationary points. The distribution of the HCWs in each district is presented in Table. 1. In general, HCWs are very busy at work; therefore, throughout the survey period, the HCWs completed questionnaires before work (i.e., without PPE) and after work (i.e., with PPE). In China, the PPE used conforms to the standard YY/T 1799–2020 (2020). Photographs taken during the field survey are shown in Figure 3. The anthropometric information of the participants is shown in Table 2.

Table 1. The distribution in each district of the healthcare workers (HCWs).
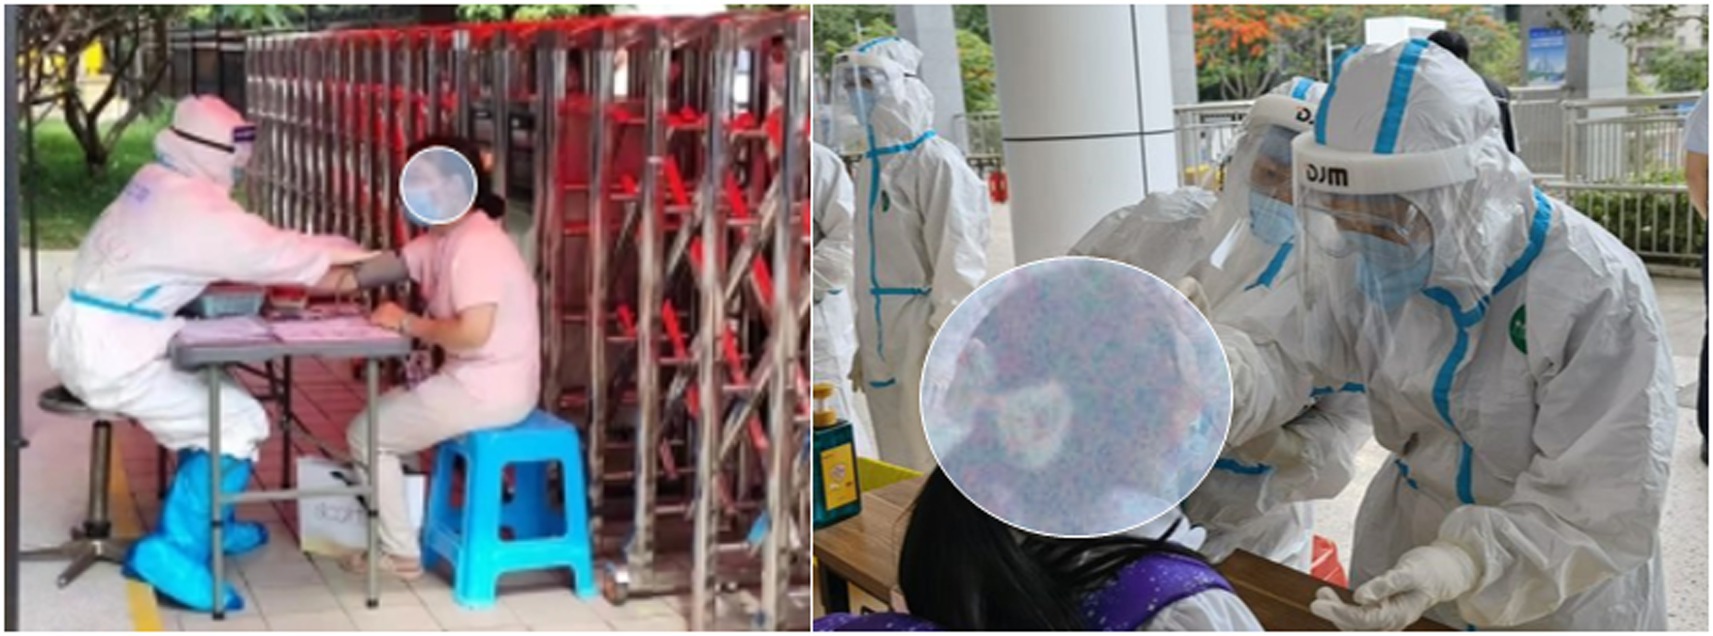
Figure 3. Health staff conducting nucleic acid sampling at a site.
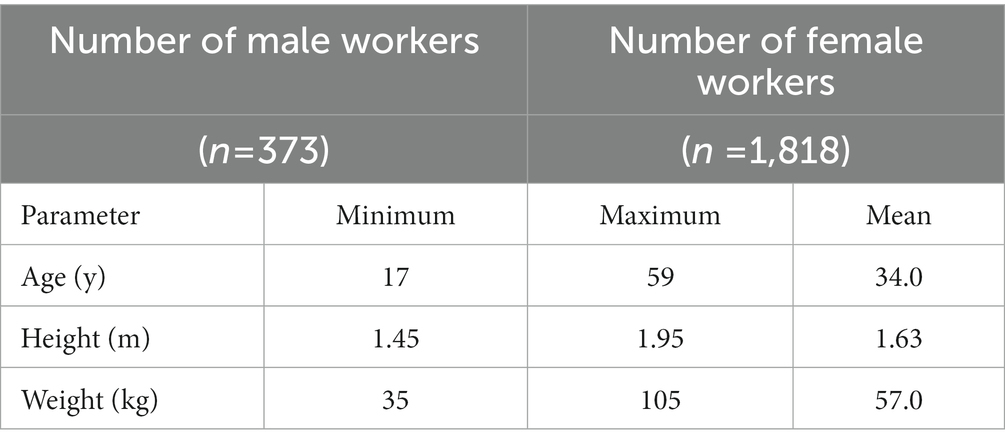
Table 2. Anthropometric data of the study participants.
In hot and humid conditions, the air temperature (Ta), relative humidity (RH), air velocity (Va) had a significant impact on most human physiological response and other responses such as behavioral. In this study, Ta, RH, and Va around the workers were hard to record under working conditions. However, the healthcare workers always work in semi open space. Ta was recorded by the local Meteorological Station online,1 shown in Figure 4.
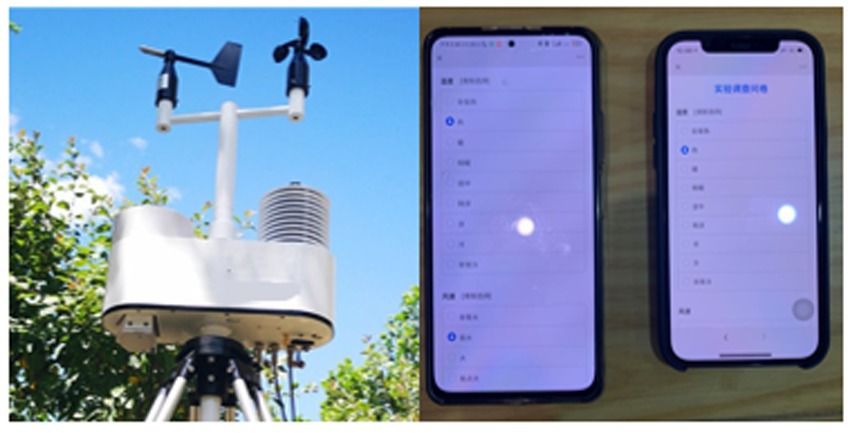
Figure 4. Meteorological station and survey online.
The questionnaire used in the experiment consisted of four parts. The first part collected basic information about the participants such as sex, age, height, weight, health history, and workplace. The second part primarily asked about the participants’ perception and evaluation of environmental temperature and humidity, including air temperature, whole body and local evaluation, etc. The third part primarily evaluates the thermal sensation of the environment after the workers wore PPE. The fourth part asked about the workers’ symptoms after work and their satisfaction with the thermal environment. In general, the questionnaire adopted in this survey referred to ASHRAE Standard 55 [American Society of Heating, Refrigerating and Air-Conditioning Engineers (33) and ISO 7730 (34)], and local evaluation was added on this basis with the purpose of discussing the difference between whole and local thermal comfort.
Linear regression is the most widely used approach for assessing the performance of thermal indices (13, 15, 16, 35). All data were input into Excel (Microsoft, Redmond, WA, USA) for preliminary analysis and calculation, which included sorting and obtaining the maximum and average values. All statistical analyses (figures and charts) were conducted using SPSS Statistics 20 (IBM, Inc., Armonk, NY, USA) and Origin 2021 (OriginLab Corporation, Northampton, MA, USA), based on the calculated thermal comfort responses, including the fitting of linear regression equations and the calculation of the linear regression correlation index R2.
During the survey, the number of workers whose body parts felt uncomfortable and their uncomfortable symptoms were recorded. As can be seen from Table 2, the proportion of male subjects (n = 373; number of female workers is 1,818) was too small to distinguish between genders. Considering the effect of age on the results, the age of the subjects was divided into three sections, less than 30 years, between 30 and 40 years, and more than 40 years, as shown in Table 3. The uncomfortable situation of people wearing PPE is shown in Figures 5A–C. The results found that the overall trend in voting was relatively consistent across the three age groups. Therefore, age discrimination was not required in subsequent analyses and some values are described using the average of the three age ages. They felt uncomfortable in many parts of the body while wearing personal protective equipment. As demonstrated in Figure 5A, the percentage of “back,” the largest body part, accounted for 75.3% in total, followed by “head,” “chest,” and “face,” the proportions of which were 70.2, 70.3, and 68.4%, respectively. Approximately one-half (53.3%) of the workers reported that their armpits felt uncomfortable.
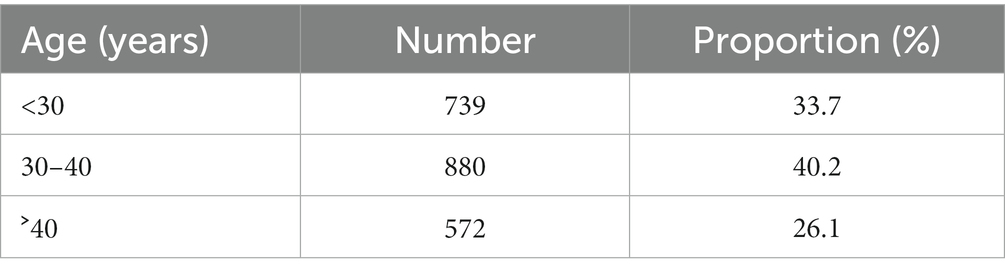
Table 3. Age distribution of the subjects.
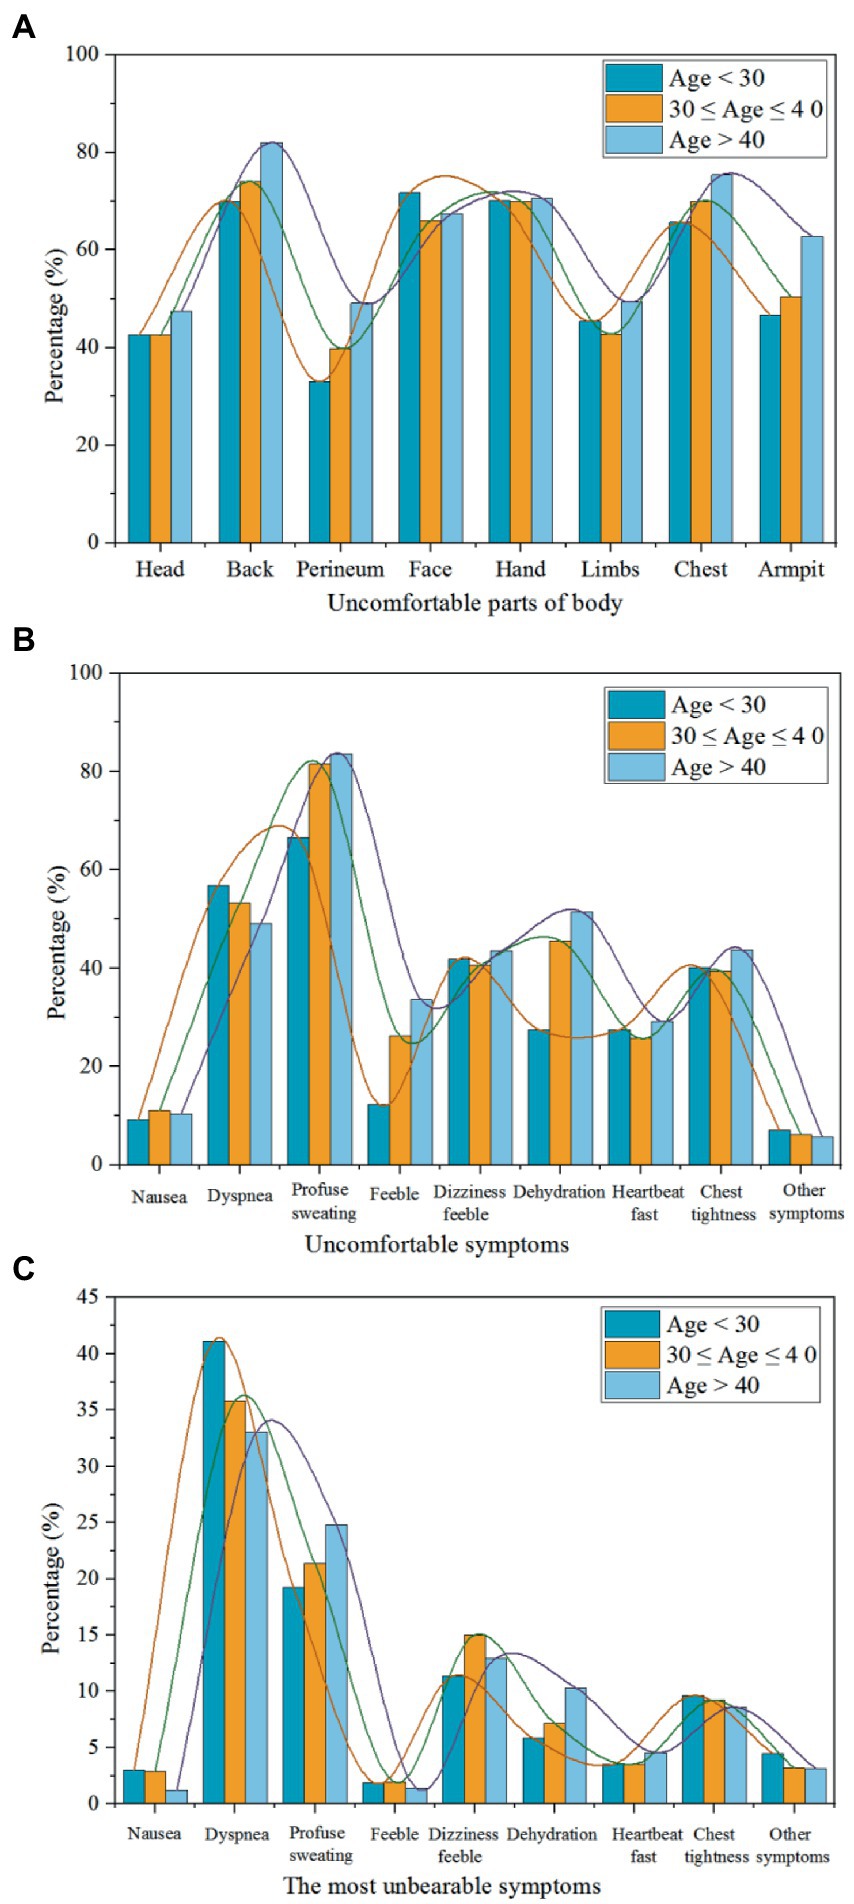
Figure 5. Distribution of uncomfortable parts of the body and symptoms (with PPE) under different age groups.
Figure 5B presents the distribution of uncomfortable symptoms while workers wore PPE. Most (77.2%) workers experienced “profuse sweating” and the least proportion (6.2%) of workers experienced “other symptoms” (headache, skin itch, thirst, etc.). Figure 5B clearly shows that 53.0% of workers reported dyspnea, and the percentages of workers who experienced the symptoms of “weakness” and “fast heartbeat” were each approximately one-half that of workers experiencing “dyspnea.” The proportions of volunteers who experienced “dehydration,” “dizziness” and “chest tightness” were 41.5, 42.0, and 41.0%, respectively. Figure 5C shows the distribution of the most unbearable symptoms when workers wore PPE. The largest proportion was for “dyspnea,” which accounted for 36.7% of the total votes, followed by “profuse sweating” (21.8%) and “dizziness feeble” (13.1%). Nearly 10% of volunteers reported “chest tightness” as the most unbearable symptom. The percentages of “fast heartbeat” and “dehydration” were 3.9 and 7.8%, respectively.
The percentages of thermal sensation votes (TSV) for the workers’ whole body and other body parts are shown in Figures 6A–H. Regardless of the whole thermal sensation or the local thermal sensation, most volunteers reported feeling hot, voting “hot” or “very hot.” In general, >60% of volunteers voted “hot” or “very hot” before wearing PPE, whereas, after wearing PPE, the proportion of volunteers voting “hot” and “very hot” was >80%. A notable difference was that the proportion of workers who voted “very hot” (i.e., “4″) increased significantly when they wore PPE. The largest and smallest increases were 39.89% [for whole-body thermal sensation vote (TSV) and 29.08% (for limbs TSV)], respectively. Moreover, after wearing PPE, the proportions of workers voting “neutral,” “slightly warm,” and “warm” all showed a downward trend. In particular, the number of people who felt thermally neutral declined significantly. For example, in the distribution of whole-body TSVs (Figure 5A), 86.0% of workers voted “hot” or “very hot” when not wearing PPE and only 8.85% of workers felt thermally neutral. After wearing PPE, the percentage of workers voting “hot” notably decreased from 55.7 to 26.7%. By contrast, the percentage of “very hot” votes increased from 30.2 to 70.1%. An important finding is that up to 96.8% workers felt “hot” and “very hot,” whereas only 1% of workers felt thermally neutral.
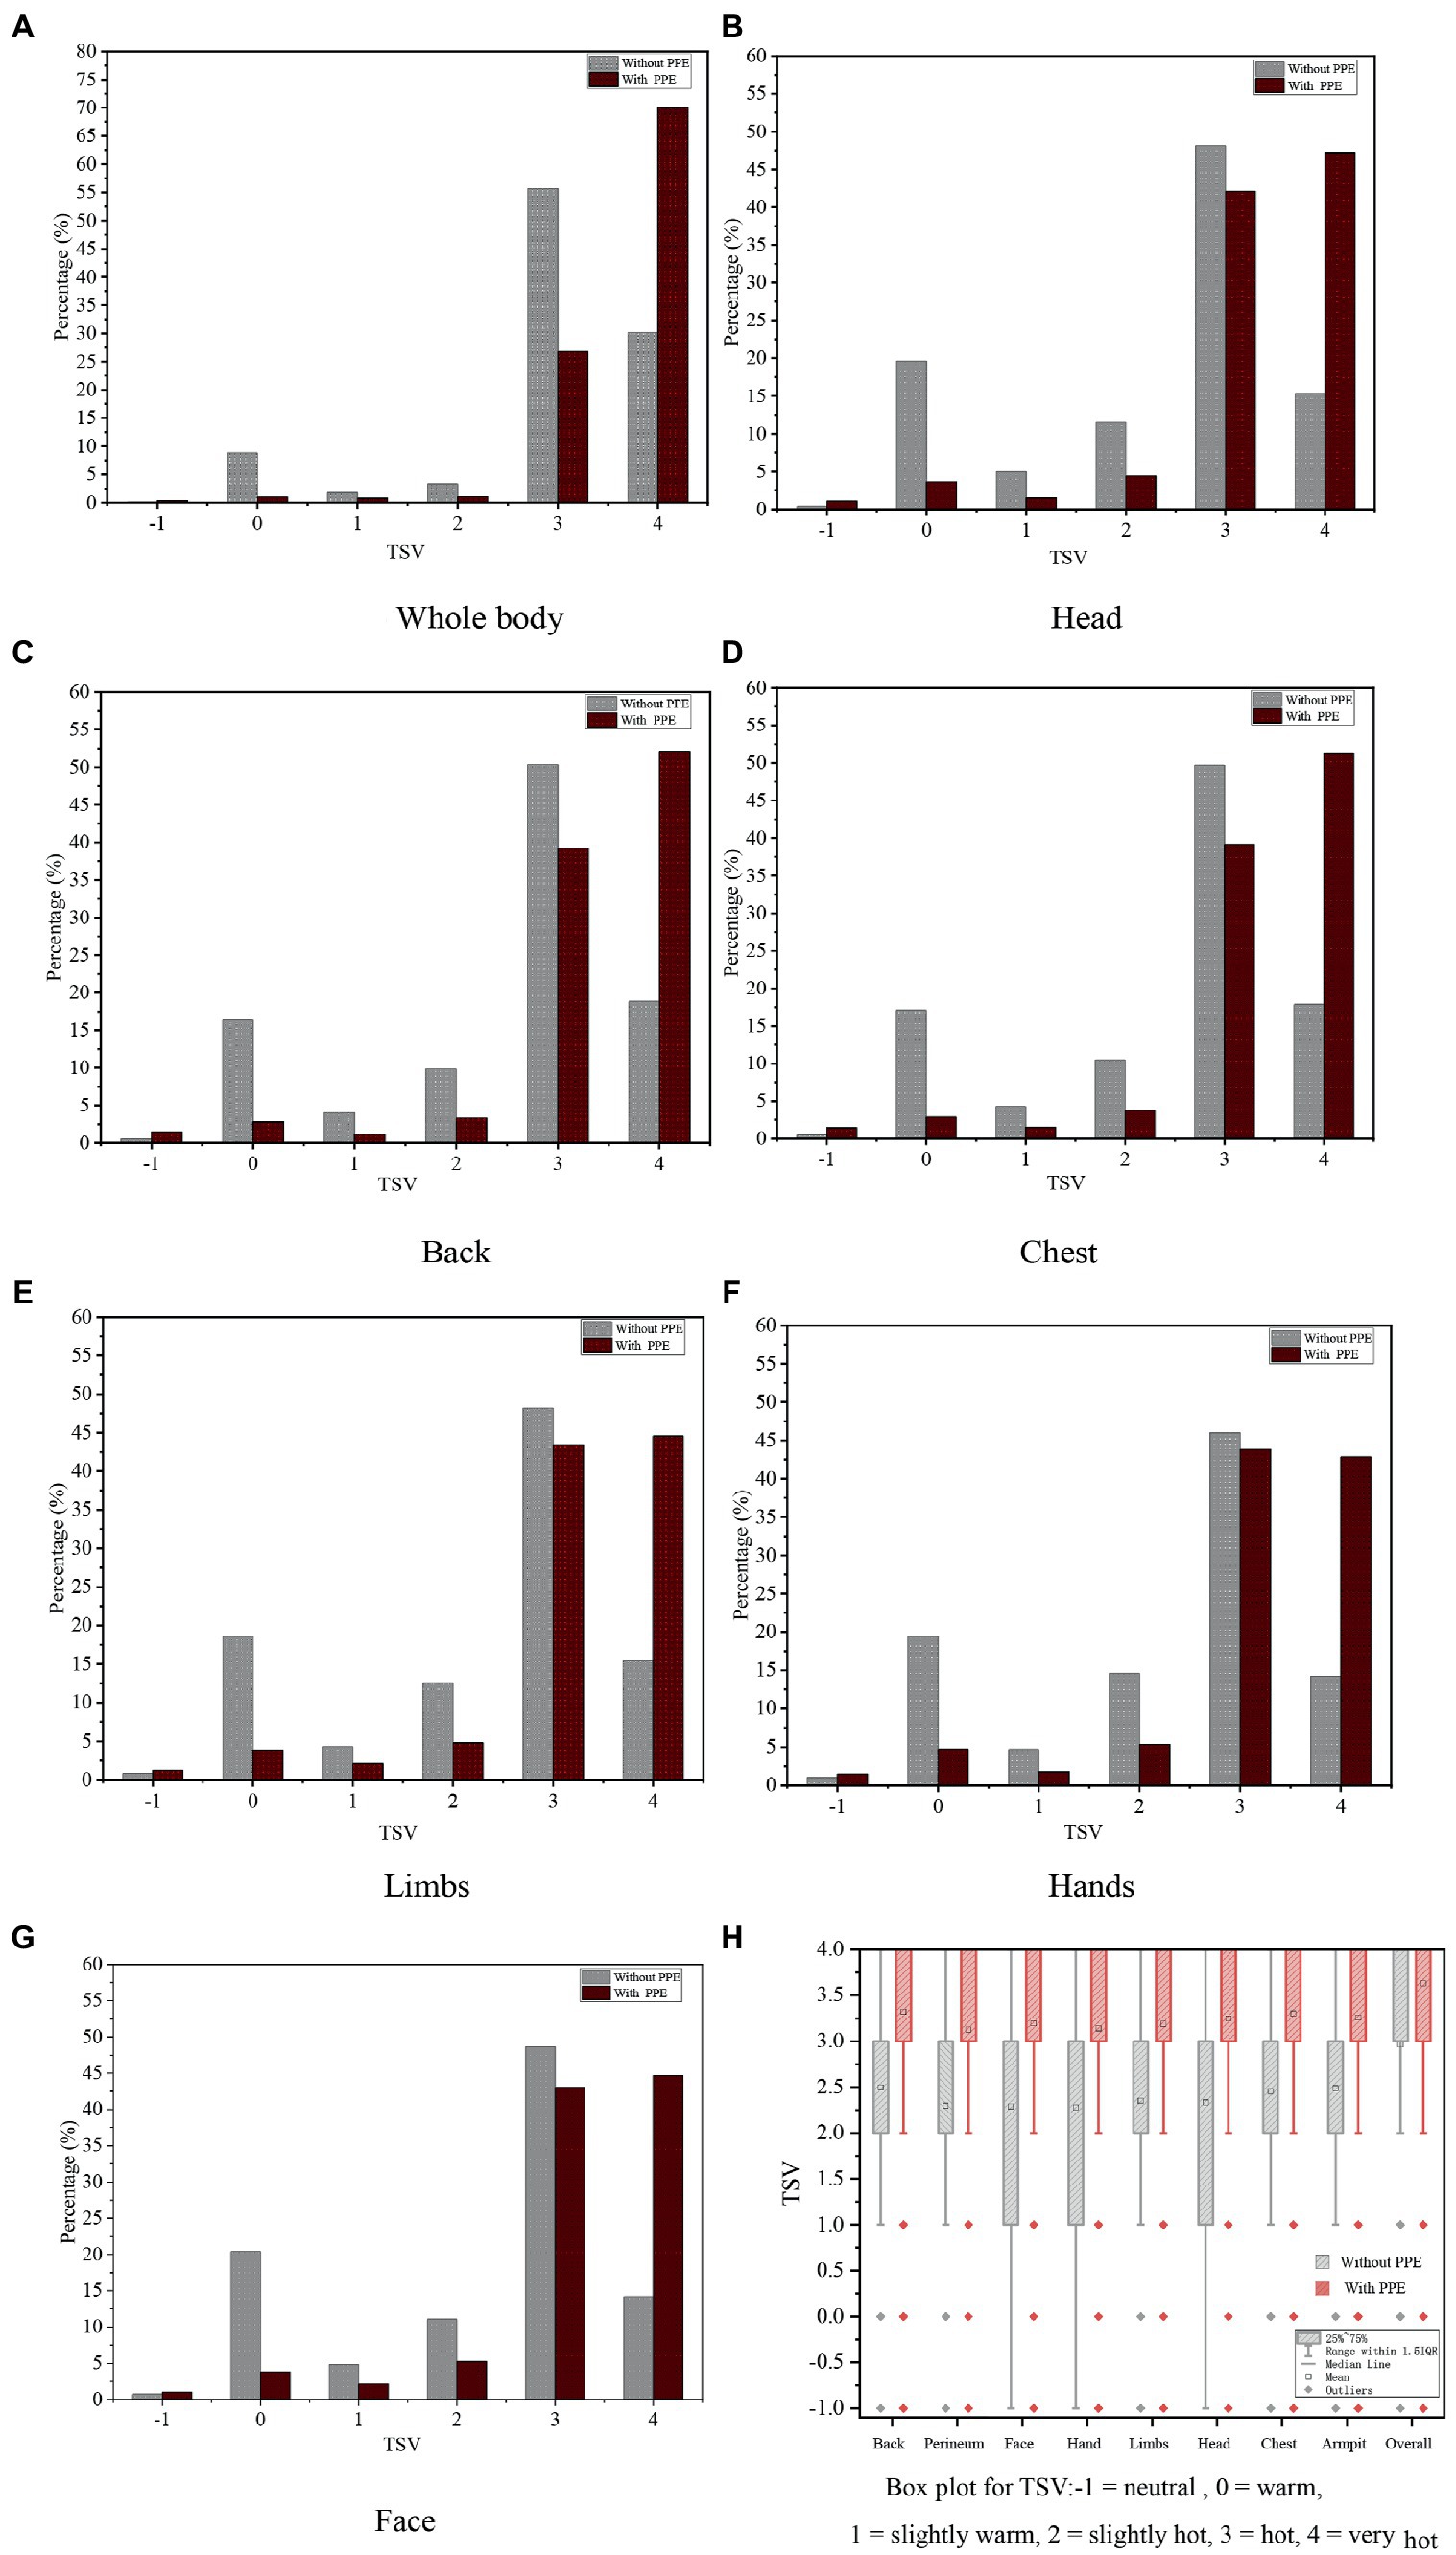
Figure 6. Distribution of the TSVs.
The box plot of TSV for the whole body and other parts of the body is presented in Figure 6H. During this field survey, wearing PPE had a significant impact on human thermal sensation (p < 0.0001). The results of the hypothesis test are summarized in Table 3. As revealed by the box plot of TSV, the mean thermal sensation vote (MTSV) of other parts of the body was 2.37 and the MTSV of the whole body was 2.96 when workers did not wear PPE. An upward trend was seen in the MTSV when they wore PPE. The MTSV of other parts of body was increased by 0.85 (2.37 → 3.22) and the MTSV of whole body was increased by 0.67 (2.96 → 3.63). Based on the aforementioned analysis, human whole thermal sensation and local thermal sensation were increased significantly by wearing PPE and their TSV tended towards “very hot.”
The distribution of air temperature (Ta) is shown in Figure 7. To analyze the sensitivity of Ta with thermal sensation for the hot and humid subtropical area of southern China in wearing protective clothing conditions, the MTSV of the respondents in each 2°C Ta interval group was calculated. Therefore, the relationships (including wearing and not wearing PPE) between Ta were plotted, as shown in Figure 7.
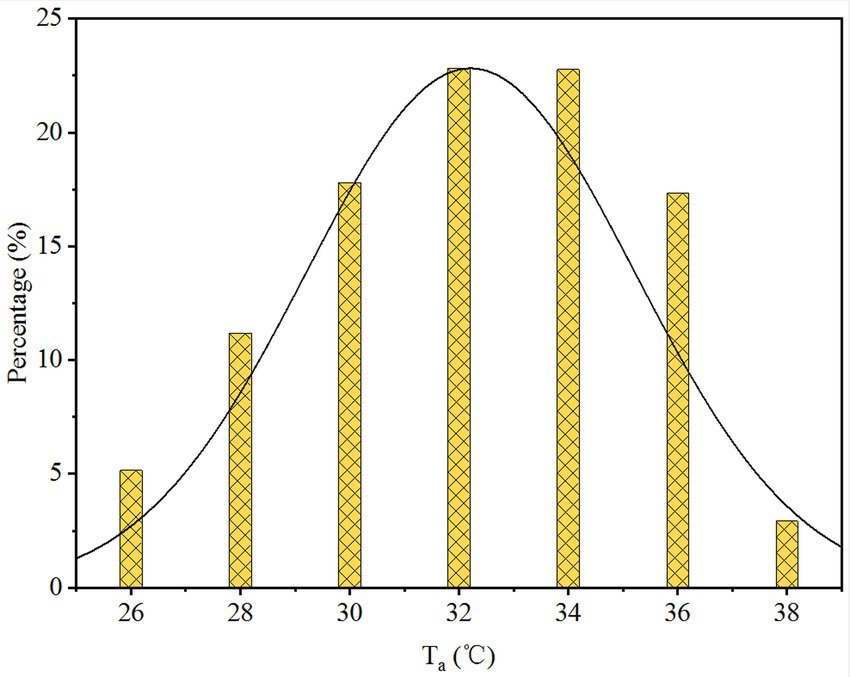
Figure 7. Distribution of air temperature. Ta, air temperature.
Figure 8 shows the linear regression results for the MTSVs of the 2,191 workers as a function of Ta. A significant linear relationship was observed. The linear regression model was strong and statistically significant. The results indicated that, based on the survey data, the Ta was significantly correlated with the MTSV. Linear regression equations of the relationship between Ta and MTSV for the whole body and other parts of the body are presented in Table 4. All R2 ˃ 0.7, indicating that Ta has a significant correlation with MTSV (with PPE and without PPE). The MTSV increased with the Ta. The slopes of the regression lines represent the sensitivity of the volunteers to alterations in the Ta. The slopes for workers wearing PPE were much lower than the slopes for workers not wearing PPE. For example, in the linear regression equations of whole-body MTSV against Ta, the slope for workers wearing PPE was 0.0289, which was much lower than the slope for workers not wearing PPE (0.1025). The findings indicate a 34.5°C change in the state of wearing PPE and a 9.8°C change in the state of not wearing PPE per MTSV unit. Thus, the sensitivity of not wearing PPE to the MTSV was much more significant than that of wearing PPE. Furthermore, by analogy, the sensitivity of other body parts to the MTSV was more significant than the sensitivity of whole body.
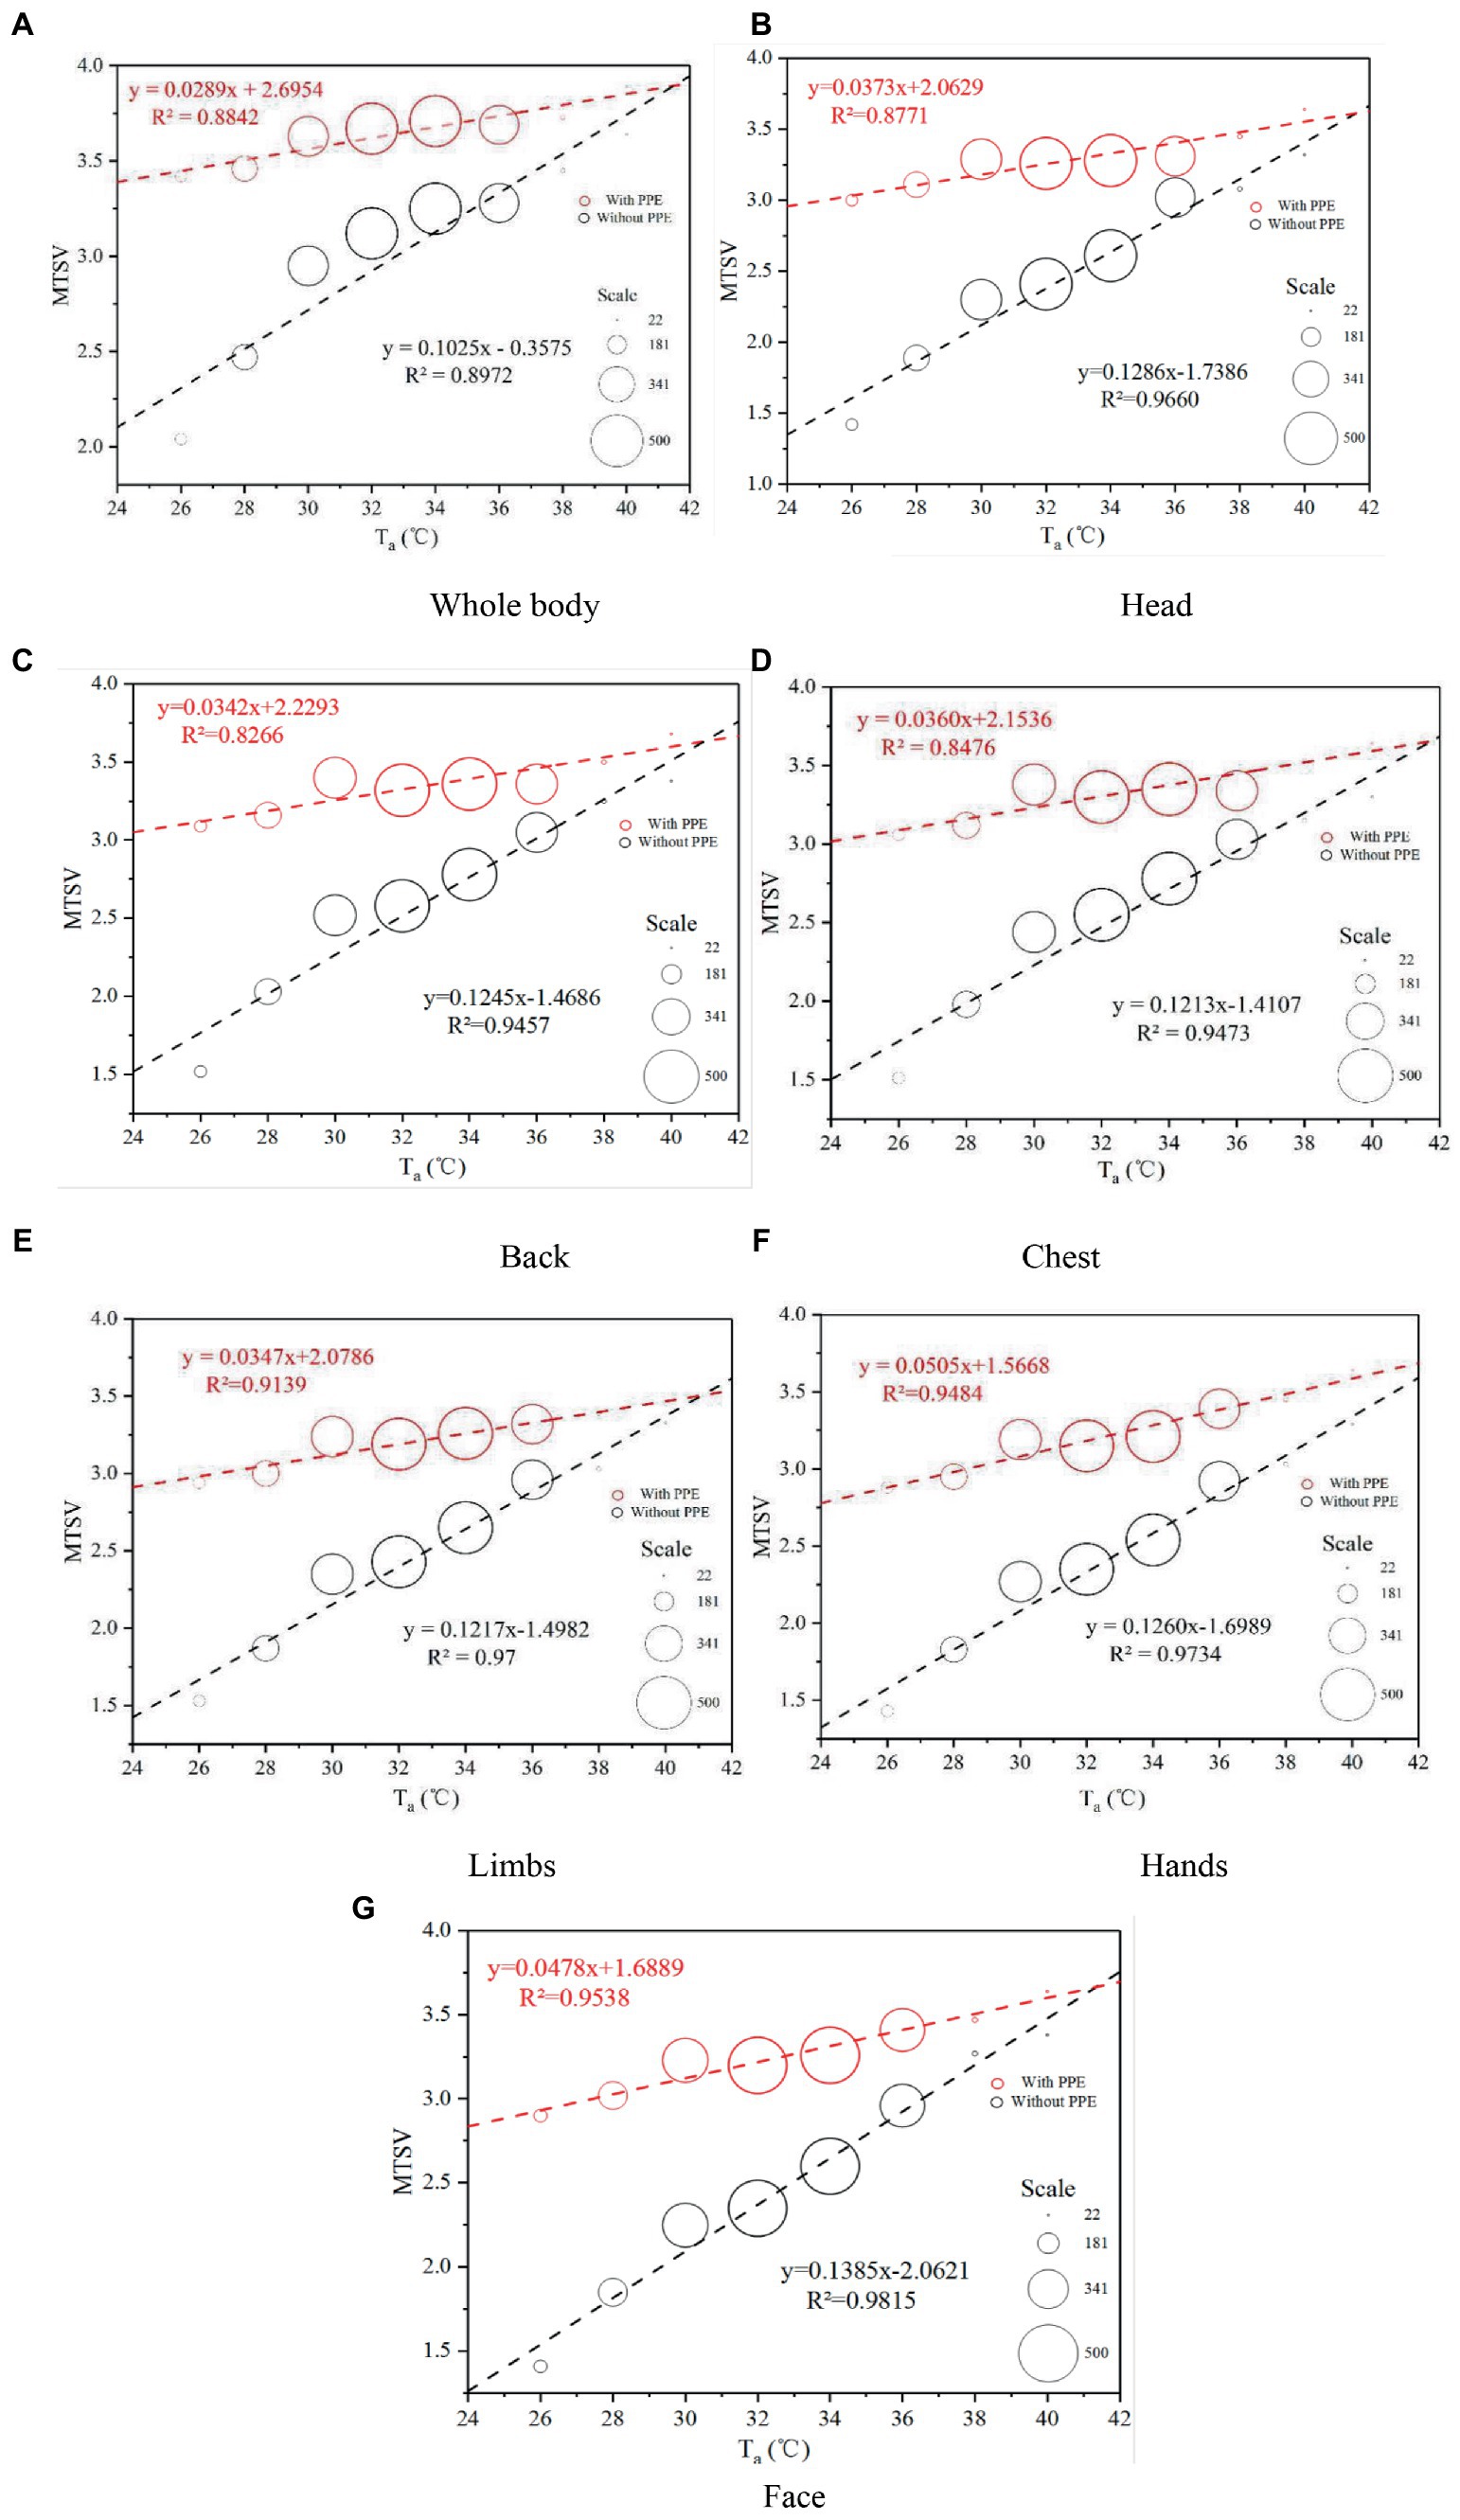
Figure 8. Variations in MTSV against Ta. PPE, personal protective equipment; MTSV, mean thermal sensation vote; Ta, air temperature.
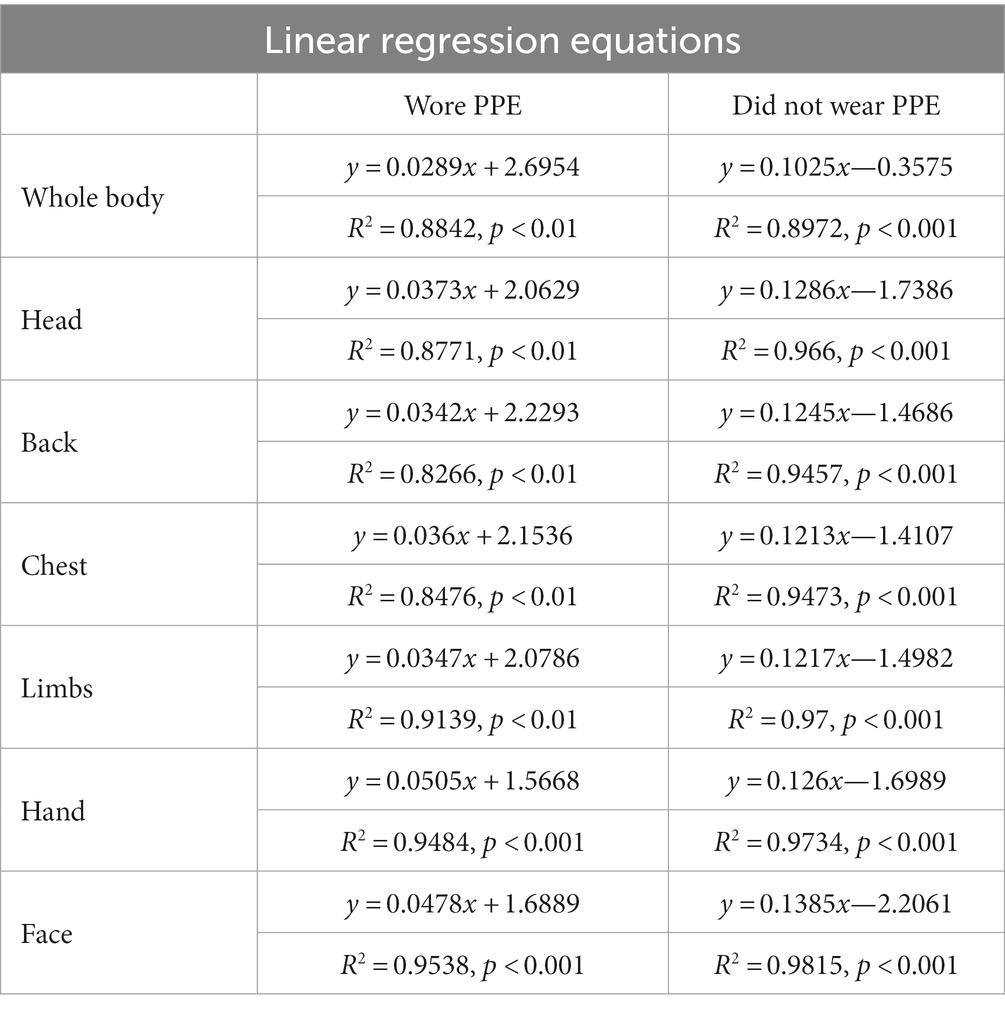
Table 4. Results of linear regression equations for mean thermal sensation vote (MTSV) against Ta.
The variations in the change in MTSV (ΔMTSV) over Ta are shown in Figures 9A–G. The ΔMTSV was the average value of TSV-wore PPE minus TSV-did not wear PPE. Linear regression equations of the relationship between Ta and ΔMTSV for the whole body and other parts of the body are summarized in Table 5. The relationships between ΔMTSV and Ta were significantly correlated. The ΔMTSV decreased with Ta. As presented in the plot, as the Ta, increased, the ΔMTSV continued to decrease and was close to zero. As the environmental temperature increases, the effect of wearing PPE on human thermal sensation becomes less.
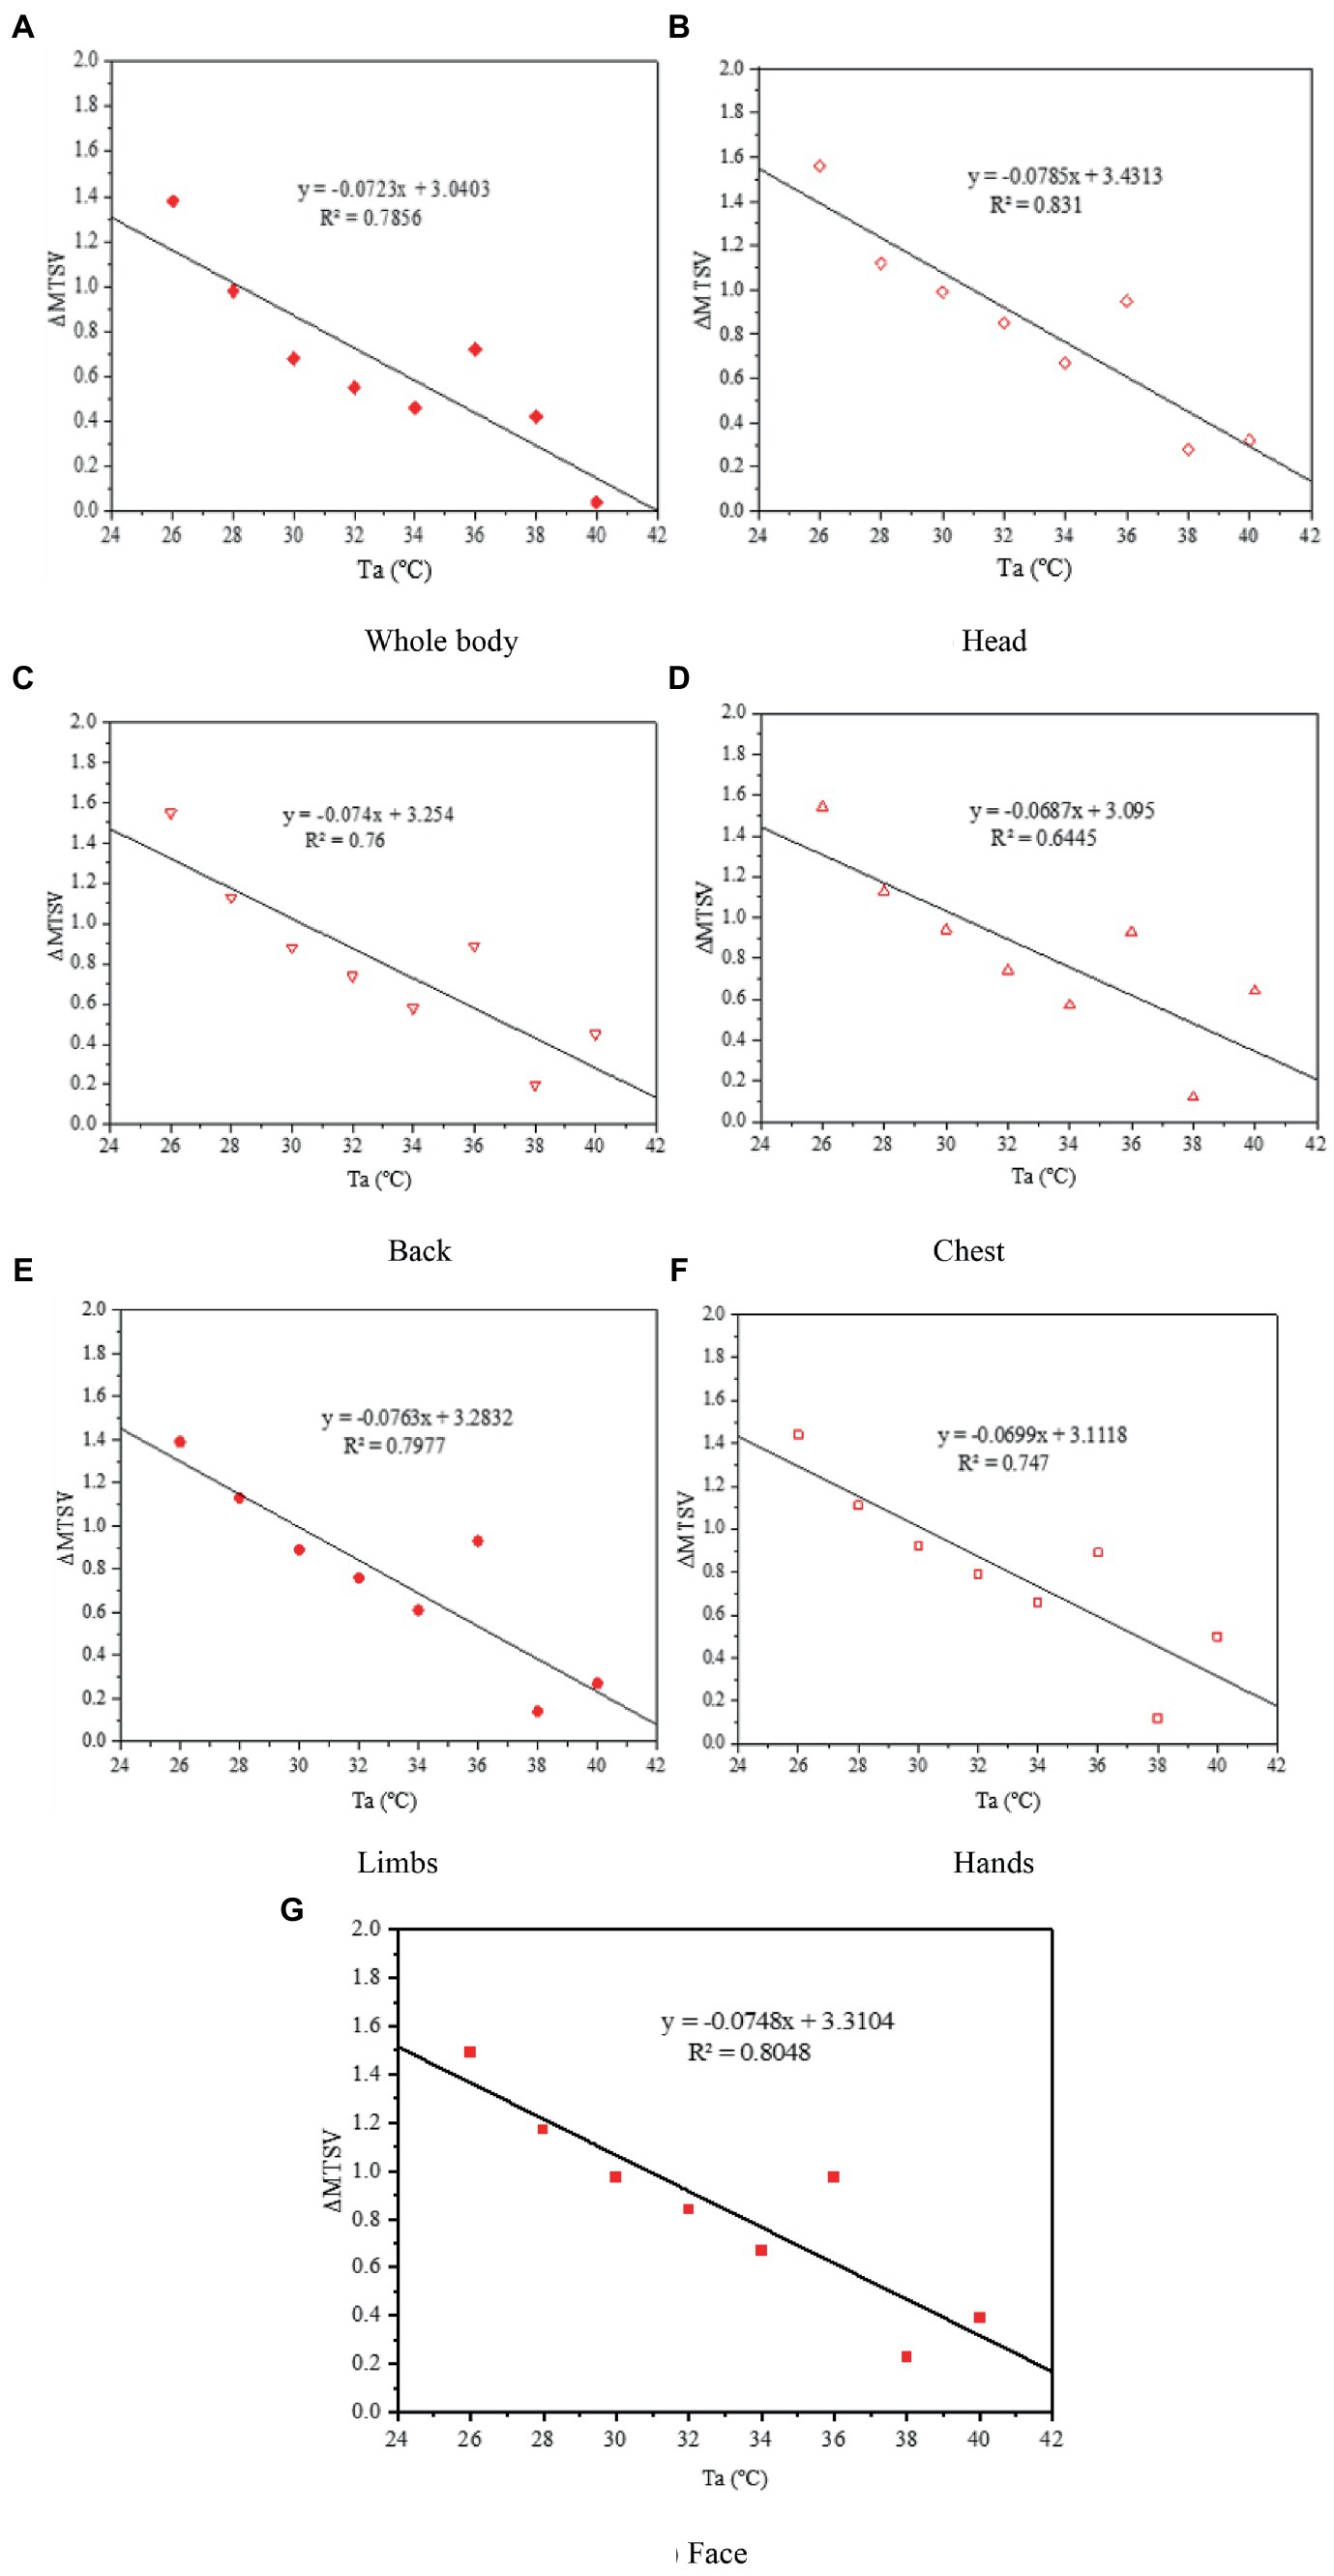
Figure 9. Variations in ΔMTSV against Ta. ΔMTSV, change in the mean thermal sensation vote; Ta, air temperature.
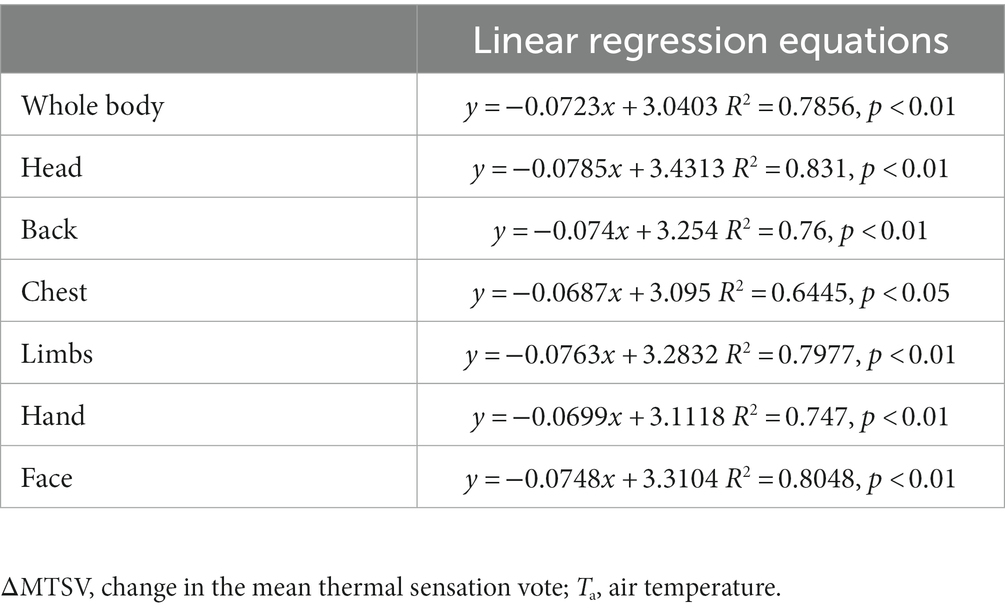
Table 5. Results of linear regression equations for ΔMTSV against Ta.
In this COVID-19 fight, the duration of wearing PPE by healthcare workers was recorded by means of questionnaires, and included actual duration and endurable duration. The variations in the average duration of wearing PPE against Ta are shown in Figure 10. The actual average duration was close the endurable duration. The difference between the average endurable duration and the average actual duration for all participants was 0.54 h (range, 4.59–4.05 h). The primary reason is that, in some cases, the working hours were hard to be controlled. The workers would take off the PPE until the works were finished. Thus, many healthcare workers wore PPE for more than 4 h when collecting nucleic acid samples.

Figure 10. Variations in the average duration of wear PPE against Ta.
In this study, we aimed to investigate the thermal response to heat stress among HCWs when they do not wear PPE or finish work wearing PPE, and to assess the impact of PPE use on HCWs’ physical health. Previous studies have improved the waterproofing and moisture permeability of protective clothing by improving the PPE materials [(36); Pan et al., 2019 (37); (38, 39), Yang, 2019 (40); (41)]. Some studies report installing fans on PPE for cooling and ventilation (11, 26, 42–45). However, those methods may increase the risk of infection. Therefore, PPE is not suitable in many practical situations because of their complexity. Based on the feedback of a large number of health staff wearing protective clothing during a work shift, the clothes were almost wet and felt very hot after continuous intense work. In addition, based on Figure 10, the overall and local thermal sensation evaluations had a very significant linear relationship with the body temperature before wearing protective clothing. Based on the vote distribution of the Ta, the MTSV was greater than 1.5; therefore, it was not in the comfort zone. At the end of the work shift, the health staff were all in a state of excessive heat stress with an MTSV > 3. When the MTSV = 3.5, Ta = 37.6°C (without PPE), and Ta = 27.8°C (wearing PPE). In heat stress studies (46, 47), a living environment with temperatures above 35°C and a production environment with temperatures above 32°C constitute high-temperature environments. According to Figure 7, the working environment of more than 20% of the time is above 36°C. The literature indicate [Tang et al., 2021 (48)] that work must be stopped when Ta is greater than 39°C. For HCWs, their heat resistance may not be as strong as site workers, so they need to stop working at Ta = 37.6°C. One study for PPE showed that demonstrated that the Heat stress and liquid loss were perceived as restrictive 28°C (49), this is generally consistent with the present study. Based on the two regression curves in Figure 10, the intersection point can be calculated as (41.5, 3.90). In Figure 10, the comparison between the ΔMTSV and the Ta of each part revealed that, as Ta increased, the ΔMTSV decreased. When Ta is less than 34°C, ΔMTSV has a significant decreasing relationship with Ta. When Ta was greater than 34°C, the value of ΔMTSV tended towards zero in fluctuating changes. This indicates that the influence of wearing PPE on human thermal sensation is gradually close to that of the surrounding environment.
Owing to climate change, more frequent and prolonged extremely hot weather is expected to have catastrophic consequences on urban human settlements. Hot weather increases the risk of heat-related health injuries (heat stress, heat exhaustion, etc.) and diseases such as skin cancer, allergic diseases, cardiovascular disease, and kidney failure (20, 21, 50, 51). Many countries already have a heat-related mortality burden that manifests during heat waves but is insidious throughout the summer (52). The effects of heat have been characterized in various settings, are stronger early in the summer season, and can vary within a city because of spatial variations in temperature [(53); Hajat et al., 2006b (54); (55)]. Heat waves and COVID-19 outbreak unfortunately overlap in that this pandemic has continued during the summer of 2021. This survey was conducted at the beginning of summer during the time of stopping the transmission of the virus that causes COVID in Guangzhou, a typical subtropical city in China. As indicated in Figure 1, the weather situation contributes to creating thermal conditions, characterized by moderate and strong heat stress. However, as stated in Section 3.1, many healthcare workers experienced various symptoms such as dyspnea (53.0%), dehydration (41.5%), profuse sweating (77.2%), and feeling uncomfortable. This finding implies that healthcare workers working in an environment like the environment at the time of this survey will develop physical health problems if they wear PPE. Respondents in both India and Singapore (29) reported thirst (n = 144, 87%), excessive sweating (n = 145, 88%), fatigue (n = 128, 78%), and wanting to go to a comfort zone (n = 136, 84%). In Singapore, reports of air conditioning in the workplace (n = 34, 62%), availability of dedicated rest areas (n = 55, 100%), and taking off PPE during breaks (n = 54, 98.2%) were higher than in India (n = 27, 25%; n = 46, 42%; and n = 66, 60%; p < 0.001). A web-based survey in Italy in 2020 (30), respondents declared that the effect of PPE on heat stress perception was very high in the body parts directly covered by these devices (78% of workers). Workers who used masks for more than 4 h per day perceived PPE as more uncomfortable (p < 0.001) and reported greater productivity loss (p < 0.001) compared to others. Based on the findings of previous studies (56–58), breathing discomfort due to a facemask has also been reported in the literature, which confirmed our finding that dyspnea due to wearing PPE is common among healthcare workers. Heavy sweating is a risk factor in human health (59). However, the percentage of Ta > 32°C was more than 60%, which indicated that more workers were at risk of heatstroke. In addition, extended sweating depletes the plasma volume and its osmotically important electrolytes. Thus, a slowly decreasing blood volume may compromise the mean arterial pressure. If systemic pressure can no longer be defended, uncompensable hypotension will ensue (60). Thus, based on related research (61, 62), heat exhaustion in workers wearing protective clothing in hot-humid conditions (e.g., a subtropical climate) more likely will be of cardiovascular origin (e.g., cardiovascular insufficiency) and associated with uncompensable hypotension.
During this survey, the average actual duration for healthcare workers wearing PPE was more than 4 h, which was longer than the duration they could endure and certainly increased a potential risk to their health. The prolonged duration of PPE usage is associated with headache, which was confirmed in a previous study (63). In addition, the longer the PPE wearing time, the more sweaty is a person. Heavy sweating stimulates the skin, and thereby causes redness, itching, and pain (59). Other studies (64–66) also found that the duration of PPE use is an important risk factor among healthcare workers. For these reasons, developing effective adaptation measures to manage heat stress while taking anti-COVID-19 measures is necessary.
Owing to actual situation, it is hard to measuring the variation of temperature in protective clothing and the surrounding environmental parameters. In this investigation, only the subjective air temperatures of the workers were considered. Therefore, the results of this study need to require further verification. The field survey were conducted in hot summer, only considering the influence of extreme heat environment on the thermal comfort of HCWs wearing PPE. Other seasons conditions would be considered in the future work. In this survey, we mainly analyzed the symptoms of the participants after work and the heat stress before and after work. In future studies, subjects will be recruited for simulated experiments, controlling for labor intensity and time for analysis. In addition, this study did not distinguish the impact of sex on voting results, which should be considered.
During the fight against COVID-19, an online questionnaire survey was conducted on June 12 and June 15, 2021 in all districts of Guangzhou. The weather data for the outdoor thermal environment were collected, and questionnaires on actual human heat perceptions were collected. By analyzing the characteristics of the weather data and questionnaires, the following results were obtained:
1. Our survey results regarding the thermal response to heat stress among HCWs when wearing PPE revealed that most HCWS felt uncomfortable in various parts of their body and most HCWS experienced “profuse sweating” while wearing PPE. These findings have implications for HCWs’ physical health (e.g., hypotension) and stress the importance of developing effective adaptation measures to manage heat stress while taking anti-COVID-19 measures.
2. Most HCWs experienced heat stress. In addition, the local thermal sensation was closely associated with the whole-body thermal sensation. Before wearing PPE, most of HCWs felt “hot” (55.7%) or “very hot” (30.2%). However, after wearing PPE and finishing work, the percentage of “very hot” increased (70.1%, “hot”: 26.7%). Healthcare workers’ whole thermal sensation and local thermal sensation were increased significantly by wearing PPE and their TSV tended towards “very hot.”
3. Based on the relationship between MTSV and air temperature for the two states (i.e., wearing PPE and not wearing PPE), the Ta was significantly correlated with the MTSV. The sensitivity of not wearing PPE to the MTSV was much more significant than that of wearing PPE. In addition, the sensitivity of other parts of the body to the MTSV was more significant than that of the whole body. As the environmental temperature increases, the effect of wearing PPE on human thermal sensation becomes less. When the MTSV = 3.5, Ta = 37.6°C (without PPE), and Ta = 27.8°C (wearing PPE). Therefore, health care workers wearing PPE when Ta = 27.8°C are susceptible to high heat stress.
The original contributions presented in the study are included in the article/supplementary material, further inquiries can be directed to the corresponding author/s.
The studies involving human participants were reviewed and approved by Guangzhou Medical University. The patients/participants provided their written informed consent to participate in this study.
YZ: conceptualization, methodology. YM: data curation, writing-original draft preparation. YL: data curation, english editing. TT: data curation. HJ: data curation. SQ: data curation. SL: data curation. ZZ: english editing. XC: conceptualization, supervision. ZF: conceptualization, writing-reviewing. All authors contributed to the article and approved the submitted version.
This work was supported by the National Natural Science Foundation of China (Project Nos. 52278097 and 51978180), Guangdong Basic and Applied Basic Research Foundation (2021A1515011671), the Major Project of Guangzhou Health Science and Technology (No. 2020A031005), and the Key Medical Disciplines and Specialties Program of Guangzhou, and the Key Medical Disciplines and Specialties Program of Guangzhou.
Thanks to the coordinators and medical staff at the participating hospitals.
The authors declare that the research was conducted in the absence of any commercial or financial relationships that could be construed as a potential conflict of interest.
All claims expressed in this article are solely those of the authors and do not necessarily represent those of their affiliated organizations, or those of the publisher, the editors and the reviewers. Any product that may be evaluated in this article, or claim that may be made by its manufacturer, is not guaranteed or endorsed by the publisher.
ASHRAE, American society of heating, refrigerating and air-conditioning engineers; COVID-19, Coronavirus disease 2019; HCW, Health care worker; MTSV, Mean thermal sensation vote; PPE, Personal protective equipment; RH, Relative humidity; Ta, Air temperature; TSV, Thermal sensation vote; WHO, World Health Organization.
1. Heidari, H, Golbabaei, F, Shamsipour, A, Rahimi, FA, and Gaeini, A. Outdoor occupational environments and heat stress in Iran. J Environ Health Sci Eng. (2015) 13:48–55. doi: 10.1186/s40201-015-0199-6
2. Lundgren, K, Kuklane, K, Gao, C, and Holmér, I. Effects of heat stress on working populations when facing climate change. Ind Health. (2013) 51:3–15. doi: 10.2486/indhealth.2012-0089
3. Varghese, BM, Barnett, AG, Hansen, AL, Bi, P, Heyworth, JS, Sim, MR, et al. Geographical variation in risk of work-related injuries and illnesses associated with ambient temperatures: a multi-city case-crossover study in Australia, 2005–2016. Sci Total Environ. (2019) 687:898–906. doi: 10.1016/j.scitotenv.2019.06.098
4. Xiang, J, Bi, P, Pisaniello, D, Hansen, A, and Sullivan, T. Association between high temperature and work-related injuries in Adelaide, South Australia, 2001-2010. Occup Environ Med. (2014) 71:246–52. doi: 10.1136/oemed-2013-101584
5. WHO, WHO director-General's opening remarks at the media briefing on COVID-19-11 march 2020. (2020). https://www.who.int/dg/speeches/detail/who-director-general-s-opening-remarks-at-the-media-briefing-on-covid-19---11-march-2020.
6. Rodriguez-Morales, AJ, Katterine Bonilla-Aldana, D, Tiwari, R, Sah, R, Rabaan, AA, and Dhama, K. Covid-19, an emerging coronavirus infection: current scenario and recent developments—an overview. J Pure Appl Microbiol. (2020). doi: 10.22207/JPAM.14.1.02
7. Centers for Disease Control and Prevention. What you should know about COVID-19 to protect yourself and others. Cdc.gov/coronavirus.Cdc (2020).
8. Chan, JFW, Yuan, S, Kok, KH, K.K.W. To, Chu, H, et al. A familial cluster of pneumonia associated with the 2019 novel coronavirus indicating person-to-person transmission: a study of a family cluster. Lancet. (2020) 395:514–23. doi: 10.1016/S0140-6736(20)30154-9
9. Ghinai, I, McPherson, TD, Hunter, JC, Kirking, HL, Christiansen, D, Joshi, K, et al. First known person-to-person transmission of severe acute respiratory syndrome coronavirus 2 (SARS-CoV-2) in the USA. Lancet. (2020) 395:1137–44. doi: 10.1016/S0140-6736(20)30607-3
10. Liu, J, Liao, X, Qian, S, Yuan, J, Wang, F, Liu, Y, et al. Community transmission of severe acute respiratory syndrome coronavirus 2, Shenzhen, China, 2020. Emerg Infect Dis. (2020) 26:1320–3. doi: 10.3201/eid2606.200239
11. Su, X, Tian, S, Li, H, Zhang, X, Shao, X, Gao, J, et al. Thermal and humid environment improvement of the protective clothing for medical use with a portable cooling device: analysis of air supply parameters. Energ Build. (2021) 240:110909. doi: 10.1016/j.enbuild.2021.110909
12. Agarwal, N, Meena, CS, Raj, BP, Saini, L, Kumar, A, Gopalakrishnan, N, et al. Indoor air quality improvement in COVID-19 pandemic. Sustain Cities Soc. (2021) 70:102942. doi: 10.1016/j.scs.2021.102942
13. Fang, Z, Tang, T, Zheng, Z, Zhou, X, Liu, W, and Zhang, Y. Thermal responses of workers during summer: an outdoor investigation of construction sites in South China. Sustain. Cities Soc. (2021) 66:102705.
14. Liu, W, Zhang, Y, and Deng, Q. The effects of urban microclimate on outdoor thermal sensation and neutral temperature in hot-summer and cold-winter climate. Energ Build. (2016) 128:190–7. doi: 10.1016/j.enbuild.2016.06.086
15. Zhang, Y, Liu, J, Zheng, Z, Fang, Z, Zhang, X, Gao, Y, et al. Analysis of thermal comfort during movement in a semi-open transition space. Energ Build. (2020a) 225:110312. doi: 10.1016/j.enbuild.2020.110312
16. Zhang, Y, Zhou, X, Zheng, Z, Oladokum, MO, and Fang, Z. Experimental investigation into the effects of different metabolic rates of body movement on thermal comfort (2020b) 168:106489. doi: 10.1016/j.buildenv.2019.106489,
17. Fang, Z, Xu, X, Zhou, X, Deng, S, Wu, H, Liu, J, et al. Investigation into the thermal comfort of university students conducting outdoor training build. Environment. (2019) 149:26–38. doi: 10.1016/j.buildenv.2018.12.003
18. Zamanian, Z, Sedaghat, Z, Hemehrezaee, M, and Khajehnasiri, F. Evaluation of environmental heat stress on physiological parameters. J Environ Health Sci Eng. (2017) 15:24. doi: 10.1186/s40201-017-0286-y
19. Zare, S, Shirvan, HE, Hemmatjo, R, Nadri, F, Jahani, Y, Jamshidzadeh, K, et al. A comparison of the correlation between heat stress indices (UTCI, WBGT, WBDT, TSI) and physiological par3ameters of workers in Iran. Weather Climate Extremes. (2019) 26:100213. doi: 10.1016/j.wace.2019.100213
20. Nerbass, FB, Pecoits-Filho, R, Clark, WF, Sontrop, JM, McIntyre, CW, and Moist, L. Occupational heat stress and kidney health: from farms to factories. Kidney Int Reports. (2017) 2:998–1008. doi: 10.1016/j.ekir.2017.08.012
21. Takakura, J, Fujimori, S, Takahashi, K, Hijioka, Y, Hasegawa, T, and Honda, Y. Toshihiko masui, “cost of preventing workplace heat-related illness through worker breaks and the benefit of climate-change mitigation”. Environ Res. (2017) 12:1–15.
22. Ali, SB, and Patnaik, S. Thermal comfort in urban open spaces: objective assessment and subjective perception study in tropical city of Bhopal. India Urban Clim. (2018) 24:954–67. doi: 10.1016/j.uclim.2017.11.006
23. Tian, X, Fang, Z, and Liu, W. Decreased humidity improves cognitive performance at extreme high indoor temperature. Indoor Air. (2020) 10
24. Vellei, M, Herrera, M, Fosas, D, and Natarajan, S. The influence of relative humidity on adaptive thermal comfort. Build Environ. (2017) 124:171–85. doi: 10.1016/j.buildenv.2017.08.005
25. Yu, C, Mei, T, and Wei, L. High temperature impairs cognitive performance during a moderate intensity activity. Build Environ. (2020) 186:107372. doi: 10.1016/j.buildenv.2020.107372
26. Wu, J., Hao, L., Wang, R., Yi, Y., and Qi, J., Research of positive-pressure bio-protective suit for Ebola disease. Chinese Med Equip J, 35 (2014), pp. 93–96 (in Chinese)
27. Davey, SL, Lee, BJ, Robbins, T, Randeva, H, and Thake, CD. Heat stress and PPE during COVID-19: impact on healthcare workers' performance, safety and well-being in NHS settings. J Hosp Infect. (2021) 108:185–8. doi: 10.1016/j.jhin.2020.11.027
28. Jegodka, Y, Lagally, L, Mertes, H, Deering, K, Schoierer, J, Buchberger, B, et al. Hot days and Covid-19: online survey of nurses and nursing assistants to assess occupational heat stress in Germany during summer 2020. J Climate Change Health. (2021) 3:100031. doi: 10.1016/j.joclim.2021.100031
29. Lee, J, Venugopal, V, Latha, PK, Alhadad, SB, Leow, CHW, Goh, NYD, et al. Heat stress and thermal perception amongst healthcare workers during the COVID-19 pandemic in India and Singapore. Int J Environ Res Public Health. (2020) 17:8100. doi: 10.3390/ijerph17218100
30. Messeri, A, Bonafede, M, Pietrafesa, E, Pinto, I, de’Donato, F, Crisci, A, et al. A web survey to evaluate the thermal stress associated with personal protective equipment among healthcare workers during the COVID-19 pandemic in Italy. Int J Environ Res Public Health. (2021) 18:3861. doi: 10.3390/ijerph18083861
31. Jacklitsch, BL, Williams, WJ, Musolin, K, Coca, A, Kim, JH, and Turner, N. Occupational exposure to heat and hot environments: revised criteria 2016. DHHS publication. (2016) Available at https://stacks.cdc.gov/view/cdc/
32. Moyano, DB, Paraiso, DA, and González-Lezcano, RA. Possible effects on health of ultrasound exposure, risk factors in the work environment and occupational safety review. Healthcare MDPI. (2022) 10:423. doi: 10.3390/healthcare10030423
34. Nishi, Y. Measurement of thermal balance of man. Stud Environ Sci. (1981) 10:29–39. doi: 10.1016/S0166-1116(08)71079-3
35. Fu, C, Zheng, Z, Mak, CM, Fang, Z, Oladokun, MO, Zhang, Y, et al. Thermal comfort study in prefab construction site office in subtropical China. Energ Build. (2020) 217:109958. doi: 10.1016/j.enbuild.2020.109958
36. Li, M, and Tu, J. Overall evaluation and prediction of heat-moisture comfort of Coolmax/cotton double-faced effect fabric. J Textile Res. (2010) 31:39–43. doi: 10.13475/j.fzxb.2010.11.008.0.11.008
37. Pan, Y, Xian, G, and Li, H. Numerical modeling of moisture diffusion in an unidirectional fiber‐rein forced polymer composite. Polymer Composites. (2019) 40:401–413. doi: 10.1002/pc.24664
38. Wang, J, Li, Y, Tian, H, Sheng, J, Yu, J, and Ding, B. Waterproof and breathable membranes of waterborne fluorinated polyurethane modified electrospun polyacrylonitrile fibers. RSC Adv. (2014) 4:61068–76. doi: 10.1039/C4RA09129A
39. Yang, J, Wang, X, and Li, B. Study on moisture permeability of medical protective clothing fabric under different temperature and humidity conditions. Basic Sci J Textile Univ. (2005) 18:389–94. (in Chinese).
40. Yang, Y, Chen, L, Naveed, T, Zhang, P, and Farooq, A. Influence of fabric structure and finishing pattern on the thermal and moisture management properties of unidirectional water transport knitted polyester fabrics. Text Res J. (2018) 89:1983–96. doi: 10.1177/0040517518783349
41. Zhang, L, Li, Y, Yu, J, and Ding, B. Fluorinated polyurethane macroporous membranes with waterproof, breathable and mechanical performance improved by lithium chloride. RSC Adv. (2015) 5:79807–14. doi: 10.1039/C5RA15302F
42. Edwards, P, Tesch, K, Karayiannis, TG, Collins, MW, Atherton, MA, Young, P, et al. Design optimisation of air-fed full pressurised suits. Fusion Eng Des. (2009) 84:716–21. doi: 10.1016/j.fusengdes.2009.02.048
43. Tesch, K, Collins, MW, Karayiannis, TG, Atherton, MA, and Edwards, P. Heat and mass transfer in air-fed pressurised suits. Appl Therm Eng. (2009) 29:1375–82. doi: 10.1016/j.applthermaleng.2008.03.045
44. Tian, F, Cheng, G, Wang, Z, Yang, J, Yang, J, and Liu, S. Mlerolmvirlmm~t of posalve pressure powered air pll mescal protective equipmen. Chin J Ind Hygiene Occup Dis. (2006) 24:151–3.
45. Ueda, H, Inoue, Y, Matsudaira, M, Araki, T, and Havenith, G. Regional microclimate humidity of clothing during light work as a result of the interaction between local sweat production and ventilation. Int J Clothing Sci Technol. (2006) 18:225–34. doi: 10.1108/09556220610668473
46. Shi, X, Zhu, N, and Zheng, G. The combined effect of temperature, relative humidity and work intensity on human strain in hot and humid environments. Build Environ. (2013) 69:72–80. doi: 10.1016/j.buildenv.2013.07.016
47. Zhao, J, Zhu, N, and Lu, S. Productivity model in hot and humid environment based on heat tolerance time analysis. Build Environ. (2009) 44:2202–7. doi: 10.1016/j.buildenv.2009.01.003
48. Tang, T, Zhang, Y, Zheng, Z, Zhou, X, Fang, Z, and Liu, W. Detailed thermal indicators analysis based on outdoor thermal comfort indices in construction sites in South China. Building and Environment. (2021) 205:108191. doi: 10.1016/j.buildenv.2021.108191
49. Loibner, M, Hagauer, S, Schwantzer, G, Berghold, A, and Zatloukal, K. Limiting factors for wearing personal protective equipment (PPE) in a health care environment evaluated in a randomised study. PLoS One. (2019) 14:e0210775. doi: 10.1371/journal.pone.0210775
50. Maeda, T, Kaneko, SY, Ohta, M, Tanaka, K, Sasaki, A, and Fukushima, T. Risk factors for heatstroke among Japanese forestry workers. J Occup Health. (2006) 48:223–9. doi: 10.1539/joh.48.223
51. Szewczyk, M, Pazdrowski, J, Golusinski, P, Danczak-Pazdrowska, A, Łuczewski, Ł, Marszałek, S, et al. Basal cell carcinoma in farmers: an occupation group at high risk. Int Arch Occup Environ Health. (2016) 89:497–501. doi: 10.1007/s00420-015-1088-0
52. Hajat, S, Armstrong, B, Baccini, M, Biggeri, A, Bisanti, L, Russo, A, et al. Impact of high temperatures on mortality: is there an added heat wave eff ect? Epidemiology. (2006) 17:632–8. doi: 10.1097/01.ede.0000239688.70829.63
53. Baccini, M, Biggeri, A, Accetta, G, Kosatsky, T, Katsouyanni, K, Analitis, A, et al. Heat eff ects on mortality in 15 European cities. Epidemiology. (2008) 19:711–9. doi: 10.1097/EDE.0b013e318176bfcd
54. Hajat, S, Kovats, RS, and Lachowycz, K. Heat related and cold related deaths in England and Wales: who is at risk?. Occupational and environmental medicine. (2007) 64:93–100. doi: 10.1136/oem.2006.029017
55. Smargiassi, A, Goldberg, MS, Plante, C, Fournier, M, Baudouin, Y, and Kosatsky, T. Variation of warm season mortality as a function of micro-urban heat islands. J Epidemiol Community Health. (2009) 63:659–64. doi: 10.1136/jech.2008.078147
56. Chughtai, AA, Stelzer-Braid, S, Rawlinson, W, Pontivivo, G, Wang, Q, Pan, Y, et al. Contamination by respiratory viruses on outer surface of medical masks used by hospital healthcare workers. BMC Infect Dis. (2019) 19:491. doi: 10.1186/s12879-019-4109-x
57. Khoo, KL, Leng, PH, Ibrahim, IB, and Lim, T. The changing face of healthcare worker perceptions on powered air-purifying respirators during the SARS outbreak. Respirology. (2005) 10:107–10. doi: 10.1111/j.1440-1843.2005.00634.x
58. Rebmann, T, Carrico, R, and Wang, J. Physiologic and other effects and compliance with long-term respirator use among medical intensive care unit nurses. Am J Infect Control. (2013) 41:1218–23. doi: 10.1016/j.ajic.2013.02.017
59. Tabah, A, Ramanan, M, Laupland, KB, Buetti, N, Cortegiani, A, Mellinghoff, J, et al. Personal protective equipment and intensive care unit healthcare worker safety in the COVID-19 era (PPE-SAFE): an international survey. J Crit Care. (2020) 59:70–5. doi: 10.1016/j.jcrc.2020.06.005
60. Krediet, CTP, Wilde, AA, Wieling, W, and Halliwill, R. Exercise related syncope, when it’s not the heart. Clin Auton Res. (2004) 14 Suppl 1:25–36. doi: 10.1007/s10286-004-1005-1
61. Noakes, TD. A modern classification of the exercise-related heat illnesses. J Sci Med Sport. (2008a) 11:33–9. doi: 10.1016/j.jsams.2007.02.009
62. Taylor, NAS, Dodds, MJ, Taylor, EA, and Donohoe, AM. A retrospective evaluation of injuries to Australian urban firefighters (2003 to 2012): injury types, locations and causal mechanisms. J Occup Environ Med. (2015) 57:757–64. doi: 10.1097/JOM.0000000000000438
63. Lim, ECH, Seet, RCS, Lee, KH, Wilder-Smith, EPV, Chuah, BYS, and Ong, BKC. Headaches and the N95 face-mask amongst healthcare providers. Acta Neurol Scand. (2006) 113:199–202. doi: 10.1111/j.1600-0404.2005.00560.x
64. Lin, P, Zhu, S, Huang, Y, Li, L, Tao, J, Lei, T, et al. Adverse skin reactions among healthcare workers during the coronavirus disease 2019 outbreak: a survey in Wuhan and its surrounding regions. Br J Dermatol. (2020) 183:190–2. doi: 10.1111/bjd.19089
65. Ong, JJY, Bharatendu, C, Goh, Y, Tang, JZY, Sooi, KWX, Tan, YL, et al. Headaches associated with personal protective equipment—a cross-sectional study among frontline healthcare workers during COVID-19. Headache. (2020) 60:864–77. doi: 10.1111/head.13811
66. Zuo, Y, Hua, W, Luo, Y, and Li, L. Skin reactions of N95 masks and medial masks among healthcare workers: a self-report questionnaire survey in China. Contact Derm. (2020) 83:145–7. doi: 10.1111/cod.13555
67. Lai, D, and Chen, C. Comparison of the linear regression, multinomial logit, and ordered probability models for predicting the distribution of thermal sensation. Energ Build. (2019) 188:269–77.
68. Pan, Y, Xian, G, and Li, H. Numerical modeling of moisture diffusion in an unidirectional fiber-reinforced polymer composite. Polym Compos. (2017) 40:401–13.
69. Tang, et al. Detailed thermal indicators analysis based on outdoor thermal comfort indices in construction sites in South China. Build Environ. (2021) 205:108191.
70. Yang, Y, Chen, L, Naveed, T, Zhang, P, and Farooq, A. Influence of fabric structure and finishing pattern on the thermal and moisture management properties of unidirectional water transport knitted polyester fabrics. Text Res J. (2018) 89:1983–96. doi: 10.1177/0040517518783349
Keywords: coronavirus disease 2019, healthcare workers, thermal stress, personal protective, thermal comfort
Citation: Zhu Y, Mao Y, Li Y, Tang T, Jiang H, Qiao S, Lin S, Zheng Z, Fang Z and Chen X (2023) Field investigation of the heat stress in outdoor of healthcare workers wearing personal protective equipment in South China. Front. Public Health. 11:1166056. doi: 10.3389/fpubh.2023.1166056
Edited by:
Ciro Fernando Bustillo LeCompte, Toronto Metropolitan University, CanadaReviewed by:
Roberto Alonso González-Lezcano, CEU San Pablo University, SpainCopyright © 2023 Zhu, Mao, Li, Tang, Jiang, Qiao, Lin, Zheng, Fang and Chen. This is an open-access article distributed under the terms of the Creative Commons Attribution License (CC BY). The use, distribution or reproduction in other forums is permitted, provided the original author(s) and the copyright owner(s) are credited and that the original publication in this journal is cited, in accordance with accepted academic practice. No use, distribution or reproduction is permitted which does not comply with these terms.
*Correspondence: Xiaohui Chen, Y3hoZ3oxNjhAMTI2LmNvbQ==; Zhaosong Fang, emhhb3NvbmcwMTAyQGd6aHUuZWR1LmNu
Disclaimer: All claims expressed in this article are solely those of the authors and do not necessarily represent those of their affiliated organizations, or those of the publisher, the editors and the reviewers. Any product that may be evaluated in this article or claim that may be made by its manufacturer is not guaranteed or endorsed by the publisher.
Research integrity at Frontiers
Learn more about the work of our research integrity team to safeguard the quality of each article we publish.