 Yang Wu
 Yingmu Tong2
 Hai Wang
 Xing Zhang
 Yunxiang Long
 Chang Liu
- 1Department of Hepatobiliary Surgery, The First Affiliated Hospital of Xi'an Jiaotong University, Xi'an, China
- 2Department of General Surgery, The First Affiliated Hospital of Xi'an Jiaotong University, Xi'an, China
- 3Department of SICU, The First Affiliated Hospital of Xi'an Jiaotong University, Xi'an, China
Background: Central obesity was closely associated with hypertension. Middle-aged and older adult females, defined as those aged 45 and above, were more likely to suffer from central obesity. For waist-to-height ratio (WHtR) was used as central obesity assessment, the object of this study was to illustrate the relationship between WHtR and the incidence of hypertension in middle-aged and older adult females in China.
Methods: Data used in this prospective cohort study was derived from the China Health and Retirement Longitudinal Study (CHARLS) in a baseline survey from 2011 to 2012 with a follow-up duration of 4 years. The waist-to-height ratio was calculated as waist circumstance divided by height, and the cohort was divided into different groups based on WHtR level. The outcome variable was new-onset hypertension.
Results: Of the 2,438 participants included in the study, 1,821 (74.7%) had high WHtR levels (WHtR ≥ 0.5). As WHtR was closely related to new-onset hypertension in a multivariable logistics regression mode [OR: 7.89 (95% CI: 2.10–29.67)], individuals with high WHtR were also more likely to suffer from hypertension compared with low WHtR levels [OR: 1.34 (95% CI: 1.06–1.69)].
Conclusion: WHtR is positively related to the risk of hypertension incidents among middle-aged and older adult females. Individuals with WHtR ≥ 0.5 were more likely to suffer from hypertension.
Background
In recent years, the problem of global aging has continued to intensify. As individuals get older, organ function and metabolism levels decreased significantly, both of which led to metabolic-related disease. Several studies illustrated the positive relationship between aging and hypertension incidence (1). Besides these, physiological changes during menopause made a great role in regulating blood pressure (2, 3). Middle-aged and older adult females, defined as females aged 45 and above, were at high risk of suffering from hypertension.
Central obesity, manifesting as extra fat collected in the abdomen and stomach, raised attention worldwide for its rapidly increased incidence. However, the growth of age was also closely related to central obesity (4, 5). For a higher proportion of body fat and sex hormones difference, the incidence of central obesity was higher among females than males (6–8). As general obesity showed little relationship, higher relevance between central obesity and different metabolic-related diseases was illustrated (9–11). Moreover, the positive relationship between central obesity and hypertension was also revealed (12).
As middle-aged and older adult females were at high risk of suffering from hypertension, which often led to a bad outcome. There was an urgent need for risk evaluation. Waist-to-height ratio (WHtR), a proxy index for central obesity assessment, has been widely accepted as a valuable tool for a health assessment with a cut-off point of 0.5 (13). Though there were some investigations that revealed the relationship between WHtR and the incidence of metabolism-related disease (14–16), few studies explored the association between WHtR and the incidence of hypertension among middle-aged and older adult females in China. Therefore, in this study, we aimed to explore the relationship between WHtR and the incidence of hypertension and testing the usefulness of the cut-off points for health assessment in WHtR.
Methods
Study design and population
The cohort of this study originated from the China Health and Retirement Longitudinal Study (CHARLS) from 2011 to 2015, which is in charge of the National Development Institute of Peking University. CHARLS is an ongoing representative survey targeting individuals aged 45 and above from 450 villages and 150 counties or districts within 28 provinces in mainland China. The baseline wave was conducted between June 2011 and March 2012 and 17,708 individuals were involved. Among all the participants, 13,013 provided venous blood. All the participants were followed every 2 years. Previous research papers (17) have shown information about this.
Individuals: (1) with complete information of venous blood sample in wave 1; (2) followed up at least once in wave 2, 3; (3) with complete information on WHtR met inclusion criteria. Individuals: (1) who were male; (2) combined with hypertension in wave 1; (3) with missing data on age or age <45; (4) who were not interviewed in 2015 were excluded from the study. A total of 2,438 individuals were enrolled in the study. As WHtR = 0.5 was used as a cut-off point for health assessment in the previous study, the cohort was divided into two groups based on WHtR level (Figure 1).
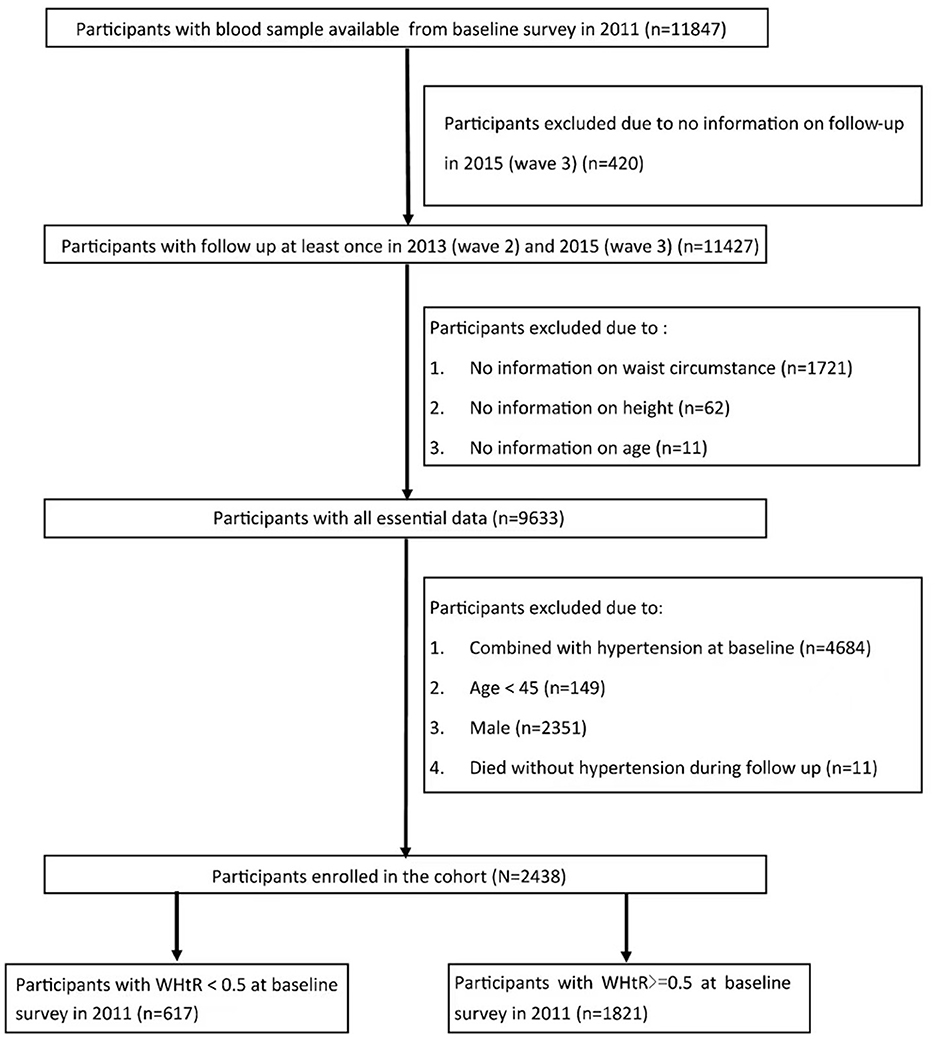
Figure 1. Flow chart of the study.
Follow-up duration and new-onset hypertension
As all the baseline characteristic was collected from 2011 to 2012 in wave 1, all the participants followed two waves every 2 years (wave 2 and 3) until 2015. During the follow-up in waves 2 and 3, new-onset hypertension was assessed by the following criteria: (1) an SBP higher than 140 mm Hg or a DBP higher than 90 mmHg; (2) self-report of a doctor diagnosis; and (3) self-report of antihypertensive treatment.
Other covariates
The interviewers trained by CHARLS collected information on demographic background, health status, and biomarkers according to the questionnaire. Demographic background including age, gender (male/female), education level (illiteracy, primary school, middle school, high school, and above), residence (urban/rural), marital status (married/single) were recorded, Health status consisting of 14 comorbidities (hypertension, diabetes, dyslipidemia, cancer, kidney disease, stroke, heart problem, liver disease, chronic lung disease, digestive disease, nervous problem, memory-related diseases, arthritis, and asthma) and comorbidity-related treatment taken by respondents. The options used to assess the history of alcohol drinking during the interview included: (1) I never had a drink; (2) I used to drink less than once a month; and (3) I used to drink more than once a month. In our study, option 2 and option 3 were regarded as a history of alcohol drinking. Biomarkers, including weight, height, waist circumstance, systolic pressure, and diastolic pressure, were all tested standardly by the interviewer. The blood collection, transported at 4°C temperature and sent to the local laboratory, was executed by the staff of the Chinese Center for Disease Control and Prevention (China CDC) during baseline survey. Then the plasma and buff coat were both frozen at −20°C, transported to Beijing within 2 weeks, and they would be placed in a deep freezer and stored at −80°C until assay before all the serum markers were assayed. eGFR was calculated using the CKD-EPI creatinine formula.
WHtR was calculated as waist circumstance divided by height. Height was measured by the height measuring instrument vertically. Training surveyors circled a soft tape at the navel level to measure waist circumstance. Diabetes was diagnosed as one of the following criteria: (1) self-report of a diagnosis by a doctor; (2) HbA1c ≥ 6.5%; (3) plasma glucose ≥ 11.1 mmol/L (casual) or plasma glucose ≥ 7.0 mmol/L (fasting); (4) self-report of the diabetes-related treatment. Dyslipidemia was diagnosed as one of the following criteria: (1) self-report of a diagnosis by a doctor; (2) total cholesterol (TC) ≥ 240 mg/dl; (3) high-density lipoprotein cholesterol (HDL) ≤ 40 mg/dl; (4) low-density lipoprotein cholesterol (LDL) ≥ 160 mg/dl; (5) triglycerides (TG) ≥ 150 mg/dl; (6) self-report of the anti-dyslipidemia treatment. Kidney disease was diagnosed as one of the following criteria: (1) self-report of a diagnosis by a doctor; (2) self-report of the kidney disease-related treatment; (3) Estimated glomerular filtration rate (eGFR) <60 ml/min/1.73 m2.
Statistical analysis
All variables were shown as follows: continuous variables with median (IQR) and counts percentages for categorical variables. Mann-Whitney U and Chi-squared tests were used to compare baseline characteristics among cohorts with different levels of WHtR. Univariable and multivariable logistics regression was used to estimate the relationship between WHtR and new-onset hypertension. Four models were constructed, including model 1 (crude), model 2 (adjusted for age), model 3 (adjusted by age, SBP, DBP, residence, education level, digestive disease, smoking) and model 4 (adjusted by age, SBP, DBP, residence, education level, marital status, diabetes, dyslipidemia, kidney disease, cancer, chronic lung disease, liver disease, heart problem, stroke, digestive disease, nervous problems, memory-related disease, arthritis, asthma, smoking, and alcohol drinking). The interaction of different variables on new-onset hypertension was also calculated in model 4. Restrict cubic spline (RCS) functions and smooth curve fitting (penalized spline method) were used to assess the dose-response relationship and the potential non-linear relationship between WHtR and new-onset hypertension. Receiver Operating Characteristic (ROC) analyses were used to compare the effectiveness of new-onset hypertension prediction between WHtR and BMI. As the age of 60 was regarded as criterion for older people, so cut-off of age at 60 was chosen to assess the relationship between WHtR and new onset hypertension in different age groups. Both sensitivity and subgroup analysis were used to test the robustness of our findings.
Statistical analyses were performed using the R package (version 4.2.1), and p < 0.05 was considered statisticallysignificant.
Results
Baseline characteristics of study participants
There were 2,438 individuals included in the final cohort. As the baseline characteristics were shown in Table 1, the median age was 55.5 years old. Individuals with WHtR ≥ 0.5 accounted for 1,821 (74.7%) of the cohort. Compared to individuals with WHtR <0.5, individuals with WHtR ≥ 0.5 were older (56.0 vs. 55.0, p = 0.022), had a higher level in both systolic pressures (121.0 vs. 118.0 mmHg; p < 0.001) and diastolic pressure (72.0 vs. 70.0 mmHg; p < 0.001) at baseline. Besides these, individuals with low WHtR had a significantly lower prevalence of diabetes (7.1% vs. 13.0%, p < 0.001) and dyslipidemia (30.8% vs. 47.2%, p < 0.001).
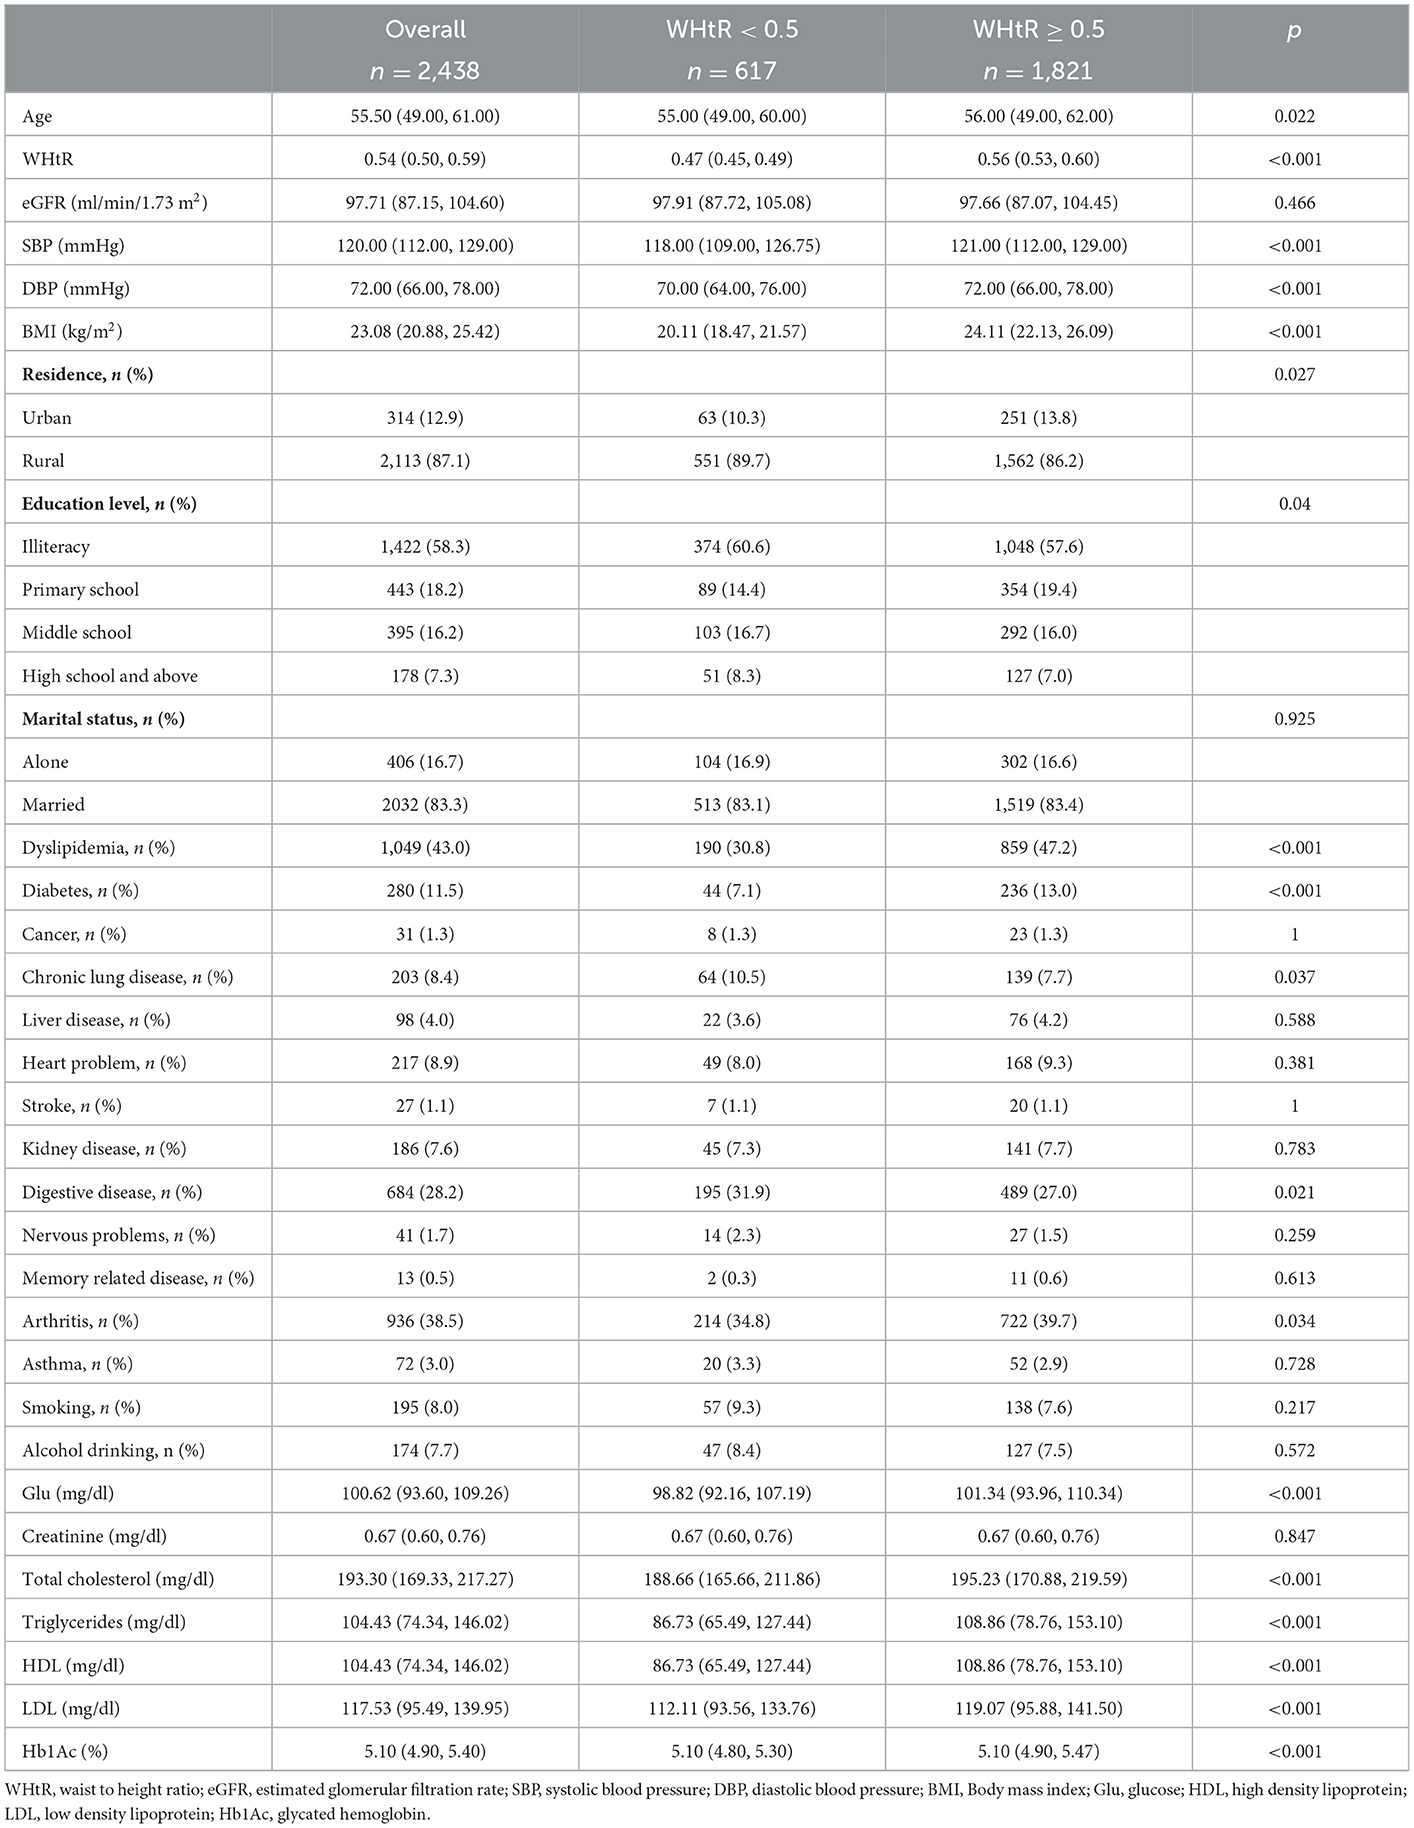
Table 1. Baseline characteristic of cohort.
Relationship between WHtR and new-onset hypertension
The relationship between WHtR and new-onset hypertension was assessed in logistics regression. As the result showed, WHtR showed a positive relationship with new-onset hypertension [OR: 21.34 (95% CI: 6.49–72.93)] (Table 2) in logistics regression. The restricted cubic spline model showed a U-shape relationship between WHtR and new-onset hypertension (Figure 2) with the lowest relationship of hypertension at WHtR = 0.49.
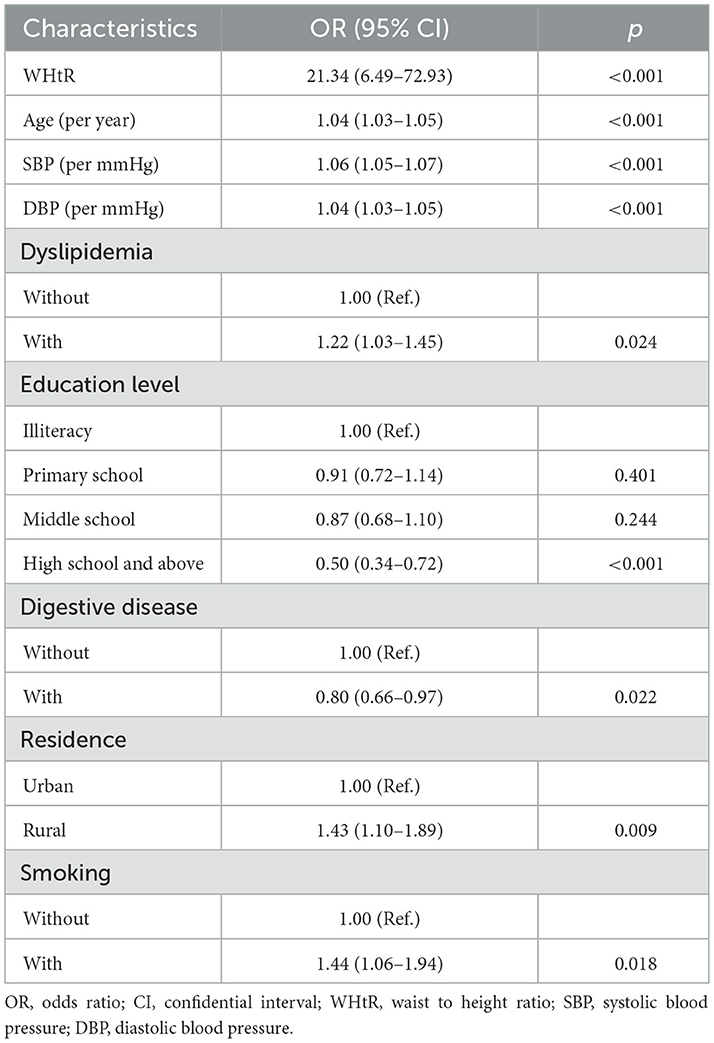
Table 2. Risk factors for new-onset hypertension in univariable logistics regression.
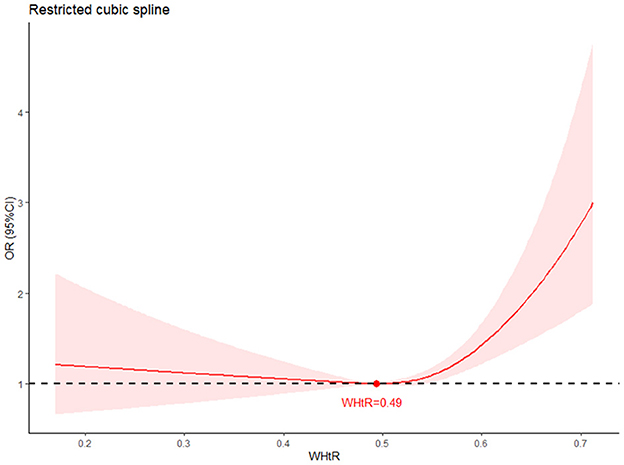
Figure 2. Restricted cubic spline (RCS) of the association between WHtR and new-onset hypertension. The association was adjusted for age, SBP, DBP, residence, education level, marital status, diabetes, dyslipidemia, kidney disease, cancer, chronic lung disease, liver disease, heart problem, stroke, digestive disease, nervous problems, memory related disease, arthritis, asthma, smoking and drinking. The plot showed a U-shape of WHtR and new-onset hypertension, which reached the lowest risk around 0.49 (reference). RCS, restrict cubic spline; OR, odds ratio; CI, confidence intervals.
As WHtR was used as a marker of health assessment with the cut-off point at 0.5, the relationship between different level of WHtR and new-onset hypertension were further analyzed. Different models were also used to assess the relationship between WHtR and new-onset hypertension. Individuals with WHtR ≥ 0.5 were 1.34 times higher in suffering from hypertension [OR: 1.34 (95% CI: 1.06–1.69)] (Table 3).
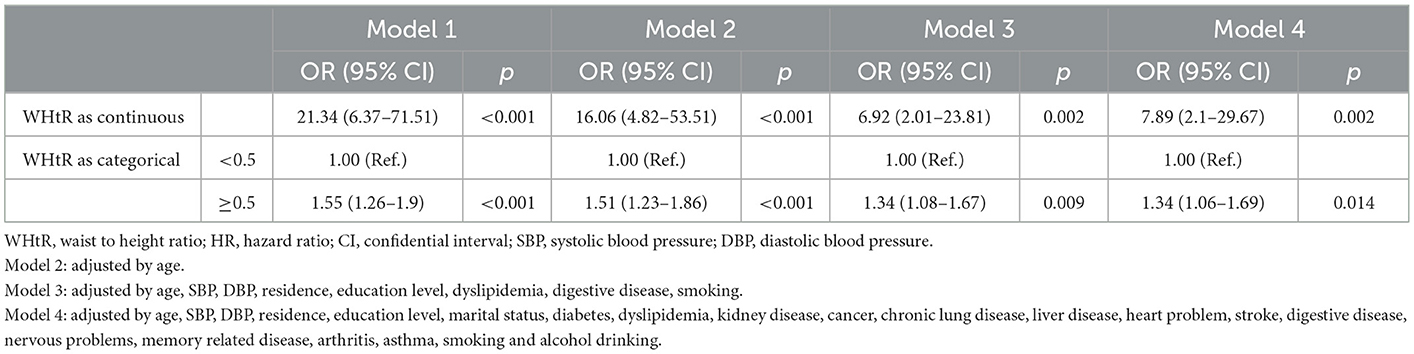
Table 3. Association between WHtR and new-onset hypertension in logistics regression.
Subgroup and sensitivity analysis
As is shown, participants with WHtR ≥ 0.5 were more likely to suffer from hypertension when age ≥60 [OR: 1.64 (95% CI: 1.09–2.47)], living in rural [OR: 1.32 (95% CI: 1.03–1.69)], not combined with diabetes [OR: 1.33 (95% CI: 1.04–1.70)], combined with dyslipidemia [OR: 1.61 (95% CI: 1.08–2.39)] and not combined with kidney disease [OR: 1.30 (95% CI: 1.03–1.66)] (Figure 3). WHtR was also more positively related to new-onset hypertension (Supplementary Figure 1). Sensitivity analysis was in accordance with the results (Supplementary Tables 1–3).
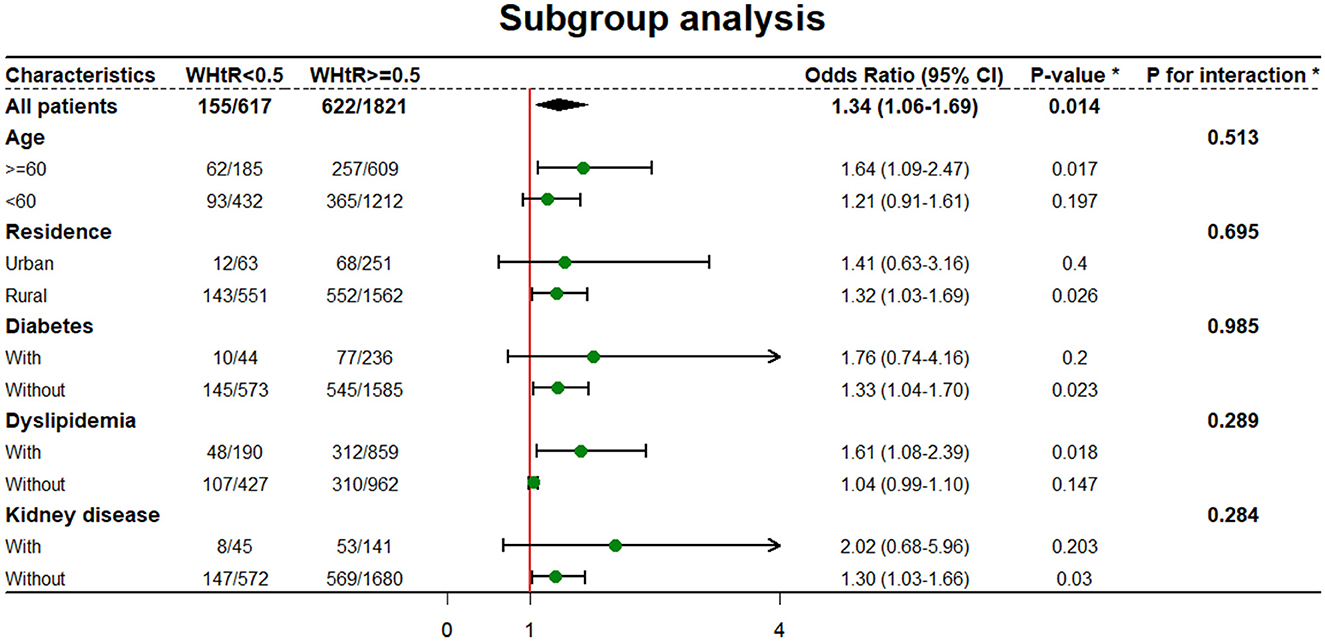
Figure 3. Subgroup analysis of relationship between WHtR and new-onset hypertension. *WHtR as categorical. *All model was adjusted by age, SBP, DBP, residence, education level, marital status, diabetes, dyslipidemia, kidney disease, cancer, chronic lung disease, liver disease, heart problem, stroke, digestive disease, nervous problems, memory related disease, arthritis, asthma, smoking and drinking unless the variable was used as a subgroup variable.
Discussion
We investigated the relationship between WHtR and new-onset hypertension among middle-aged and older women in China. As the results showed, WHtR showed a positive relationship with new-onset hypertension. Besides these, the cut-off point at 0.5 was practical for health assessment. Individuals with WHtR more than 0.5 had a significantly higher incidence of hypertension when compared to others.
Though the relationship between obesity and the risk of hypertension was well-established, the mechanism of this relation was quite complex. Several mechanisms were contributing to hypertension development. As adipose tissue accumulated, the renin–angiotensin–aldosterone system (RAAS) was highly promoted, leading to high sodium and water retention (18, 19). Besides these, changes in endocrine level also played an important role (20). Decreased adiponectin secretion could also lead to insulin resistance. A high level of leptin could also result in the inflammatory response upregulating. Moreover, fatty acid accumulation was typical among obesity combined with dyslipidemia. All of these endocrine transformations could result in increased blood vessel stiffness, which is the early histology change in hypertension. Decreased estrogen levels in middle-aged and older women also played an important role in hypertension development. The level of ANP and Ang II were elevated for the reason estrogen decreased, both of which could increase the activity of RAAS (21). However, a low level of estrogen could also lead to a reduction in lipid clearance, accelerating dyslipidemia formation (22). Decreased levels of estrogen and endocrine dysfunction contributed significantly to hypertension development.
As global aging has been accelerating in recent years, age-related diseases raised more attention from all around the world. For the low level of metabolism, obesity and overweight were one of the most common comorbidities threatening the quality of life among the aged. Different obesity subtypes were further studied in recent years. The relationship between abdominal fat accumulation and increased endocrine dysfunction led to a higher incidence of cardiovascular risk among central obesity (23, 24). Besides these, central obesity was also related to a reduction in quality of life and an increment in health expenses. As the incidence of central obesity raised rapidly during recent years (7, 25), several studies indicated a higher proportion of central obesity among females than males (6, 8), which could be attributed to fertility and decreased estrogen levels. The relationship between obesity and hypertension was well-studied. Yuri et al. (26) revealed the relationship between obesity and hypertension among women in Indonesia. In a cross-section study held by Wang et al. (27), a synergistic effect of BMI and waist circumstance on the incidence of HBP (defined as SBP ≥ 140 mmHg/or DBP ≥ 90 mmHg or use of antihypertensive medication within 2 weeks) was confirmed in the aged.
Though BMI was recognized as an obesity-related marker for a long time, some investigators argued its limitation on not considering the adverse effect of intra-abdominal fat (28). WHtR was highly recommended for central obesity assessment for its easy measurement, elimination of the impact of height, and universality among different gender, and races. The effectiveness of metabolism-related disease prediction, including metabolic syndrome, hypertension, diabetes, dyslipidemia, and cardiovascular diseases, was compared among different obesity markers (29–31). According to a multicenter cross-section study held by Akbari et al. (30), WHtR performed better in hypertension prediction than WHR and BMI. Lee et al. compared the influence of different anthropometric indices on metabolic risk. WHtR was more strongly associated with hypertension in females (32). Our study used the ROC curve to assess the predicate ability and WHtR showed a higher predictive ability than BMI (Supplementary Figure 2), BMI was associated with a lower increment in new-onset hypertension when compared with WHtR (Supplementary Table 4). Besides these, our study also showed a significantly lower tendency of suffering from hypertension in WHtR <0.5 groups, which supports the usage of WHtR = 0.5 as a cut-off point for health assessment.
Obesity was closely related to the incidence of hypertension, which brought a heavy burden to public health. Our study showed a close relationship between WHtR and new-onset hypertension. Though WHtR showed a better ability for hypertension prediction than other markers among middle-aged and older females, new markers or formulas were urgently needed for much more precise prediction. Besides this, how to prevent hypertension among middle-aged and older females was also an essential factor that needs further research.
One significant advantage of our study was that this was the first study to analyze the relationship between WHtR and new-onset hypertension among middle-aged and older adult females in China. However, there were still some limitations that should be noticed. First, all the health information was collected according to self-report by participants. However, some participants might be unaware of their diseases, which could lead to bias in baseline information and the outcome variable. Second, some participants had no information about WHtR, leading to being excluded from the final cohort. These might make an impact on results.
Conclusion
This study explored the relationship between WHtR and new-onset hypertension among middle-aged and older adult females in China. As the result shows, WHtR was positively related to hypertension. More attention should be paid to individuals with high WHtR.
Data availability statement
The raw data supporting the conclusions of this article will be made available by the authors, without undue reservation.
Ethics statement
The studies involving human participants were reviewed and approved by Biomedical Ethics Review Committee of Peking University (IRB00001052-11015). The patients/participants provided their written informed consent to participate in this study.
Author contributions
YW, HW, and YT: methodology, writing, and revision. XZ, YL, QL, and JR: data curation and investigation. CL: supervision, reviewing, and editing the manuscript. All authors contributed to the article and approved the submitted version.
Funding
This study was supported by funding from the Shaanxi Provincial Foundation University Joint Project (Grant No. 2021GXLH-Z-099).
Acknowledgments
The authors would like to thank the China Health and Retirement Longitudinal Study team for providing the data.
Conflict of interest
The authors declare that the research was conducted in the absence of any commercial or financial relationships that could be construed as a potential conflict of interest.
Publisher's note
All claims expressed in this article are solely those of the authors and do not necessarily represent those of their affiliated organizations, or those of the publisher, the editors and the reviewers. Any product that may be evaluated in this article, or claim that may be made by its manufacturer, is not guaranteed or endorsed by the publisher.
Supplementary material
The Supplementary Material for this article can be found online at: https://www.frontiersin.org/articles/10.3389/fpubh.2023.1122995/full#supplementary-material
Supplementary Table 1. Sensitivity analysis excluded individuals combined with kidney disease for association of WHtR and new-onset hypertension in CAHRLS (2011–2015).
Supplementary Table 2. Sensitivity analysis excluded individuals combined with diabetes for association of WHtR and new-onset hypertension in CAHRLS (2011–2015).
Supplementary Table 3. Sensitivity analysis excluded individuals combined with dyslipidemia for association of WHtR and new-onset hypertension in CAHRLS (2011–2015).
Supplementary Table 4. Association between BMI and new-onset hypertension in logistics regression.
Supplementary Figure 1. Subgroup analysis of relationship between WHtR level and new-onset hypertension. *WHtR as continuous; *All model was adjusted by age, SBP, DBP, residence, education level, marital status, diabetes, dyslipidemia, kidney disease, cancer, chronic lung disease, liver disease, heart problem, stroke, digestive disease, nervous problems, memory related disease, arthritis, asthma, smoking and drinking unless the variable was used as a subgroup variable.
Supplementary Figure 2. ROC curves for new-onset hypertension by WHtR and BMI.
References
1. Buford TW. Hypertension and aging. Ageing Res Rev. (2016) 26:96–111. doi: 10.1016/j.arr.2016.01.007
2. Prevention D. Evaluation, and management of high blood pressure in adults: a report of the American College of Cardiology/American Heart Association Task Force on Clinical Practice Guidelines. Hypertension. (2018) 71:e13–e115. doi: 10.1161/HYP.0000000000000065
3. Mozaffarian D, Benjamin EJ, Go AS, Arnett DK, Blaha MJ, Cushman M, et al. Heart disease and stroke statistics-−2015 update: a report from the American Heart Association. Circulation. (2015) 131:e29–322. doi: 10.1161/CIR.0000000000000152
4. Moriarty JP, Branda ME, Olsen KD, Shah ND, Borah BJ, Wagie AE, et al. The effects of incremental costs of smoking and obesity on health care costs among adults: a 7-year longitudinal study. J Occup Environ Med. (2012) 54:286–91. doi: 10.1097/JOM.0b013e318246f1f4
5. Misganaw A, Mariam DH, Araya T, Aneneh A. Validity of verbal autopsy method to determine causes of death among adults in the urban setting of Ethiopia. BMC Med Res Methodol. (2012) 12:130. doi: 10.1186/1471-2288-12-130
6. Feng WY, Li XD, Li J, Shen Y, Li Q. Prevalence and risk factors of central obesity among adults with normal BMI in Shaanxi, China: a cross-sectional study. Int J Environ Res Public Health. (2021) 18:11439. doi: 10.3390/ijerph182111439
7. Wong MCS, Huang J, Wang J, Chan PSF, Lok V, Chen X, et al. Global, regional and time-trend prevalence of central obesity: a systematic review and meta-analysis of 13.2 million subjects. Eur J Epidemiol. (2020) 35:673–83. doi: 10.1007/s10654-020-00650-3
8. Israel E, Hassen K, Markos M, Wolde K, Hawulte B. Central obesity and associated factors among urban adults in Dire Dawa Administrative City, Eastern Ethiopia. Diab Metab Syndr Obes. (2022) 15:601–14. doi: 10.2147/DMSO.S348098
9. Goh VHH, Hart WG. Excess fat in the abdomen but not general obesity is associated with poorer metabolic and cardiovascular health in premenopausal and postmenopausal Asian women. Maturitas. (2018) 107:33–8. doi: 10.1016/j.maturitas.2017.10.002
10. Cameron AJ, Magliano DJ, Shaw JE, Zimmet PZ, Carstensen B, Alberti KG, et al. The influence of hip circumference on the relationship between abdominal obesity and mortality. Int J Epidemiol. (2012) 41:484–94. doi: 10.1093/ije/dyr198
11. Piché ME, Poirier P, Lemieux I, Després JP. Overview of epidemiology and contribution of obesity and body fat distribution to cardiovascular disease: an update. Prog Cardiovasc Dis. (2018) 61:103–13. doi: 10.1016/j.pcad.2018.06.004
12. Niu J, Seo DC. Central obesity and hypertension in Chinese adults: a 12-year longitudinal examination. Prev Med. (2014) 62:113–8. doi: 10.1016/j.ypmed.2014.02.012
13. Browning LM, Hsieh SD, Ashwell M, A. systematic review of waist-to-height ratio as a screening tool for the prediction of cardiovascular disease and diabetes: 0.5 could be a suitable global boundary value. Nutr Res Rev. (2010) 23:247–69. doi: 10.1017/S0954422410000144
14. Choi JR, Koh SB, Choi E. Waist-to-height ratio index for predicting incidences of hypertension: the ARIRANG study. BMC Public Health. (2018) 18:767. doi: 10.1186/s12889-018-5662-8
15. Hou X, Chen S, Hu G, Chen P, Wu J, Ma X, et al. Stronger associations of waist circumference and waist-to-height ratio with diabetes than BMI in Chinese adults. Diabetes Res Clin Pract. (2019) 147:9–18. doi: 10.1016/j.diabres.2018.07.029
16. Shen S, Lu Y, Qi H, Li F, Shen Z, Wu L, et al. Waist-to-height ratio is an effective indicator for comprehensive cardiovascular health. Sci Rep. (2017) 7:43046. doi: 10.1038/srep43046
17. Zhao Y, Hu Y, Smith JP, Strauss J, Yang G. Cohort profile: the China Health and Retirement Longitudinal Study (CHARLS). Int J Epidemiol. (2014) 43:61–8. doi: 10.1093/ije/dys203
18. Mende CW. Obesity and hypertension: a common coexistence. J Clin Hypertens (Greenwich). (2012) 14:137–8. doi: 10.1111/j.1751-7176.2011.00578.x
19. Wofford MR, Hall JE. Pathophysiology and treatment of obesity hypertension. Curr Pharm Des. (2004) 10:3621–37. doi: 10.2174/1381612043382855
20. Gnatiuc L, Alegre-Díaz J, Halsey J, Herrington WG, López-Cervantes M, Lewington S, et al. Adiposity and blood pressure in 110 000 Mexican adults. Hypertension. (2017) 69:608–14. doi: 10.1161/HYPERTENSIONAHA.116.08791
21. O'Donnell E, Floras JS, Harvey PJ. Estrogen status and the renin angiotensin aldosterone system. Am J Physiol Regul Integr Comp Physiol. (2014) 307:R498–500. doi: 10.1152/ajpregu.00182.2014
22. Jiao L, Machuki JO, Wu Q, Shi M, Fu L, Adekunle AO, et al. Estrogen and calcium handling proteins: new discoveries and mechanisms in cardiovascular diseases. Am J Physiol Heart Circ Physiol. (2020) 318:H820–h829. doi: 10.1152/ajpheart.00734.2019
23. Després JP. Body fat distribution and risk of cardiovascular disease: an update. Circulation. (2012) 126:1301–13. doi: 10.1161/CIRCULATIONAHA.111.067264
24. Chuang SY, Hsu YY, Chen RC, Liu WL, Pan WH. Abdominal obesity and low skeletal muscle mass jointly predict total mortality and cardiovascular mortality in an elderly Asian population. J Gerontol A Biol Sci Med Sci. (2016) 71:1049–55. doi: 10.1093/gerona/glv192
25. Li X, Niu H, Bai X, Wang Y, Wang W. Association of obesity and hypertension: a cohort study in China. Int J Hypertens. (2021) 2021:1607475. doi: 10.1155/2021/1607475
26. Nurdiantami Y, Watanabe K, Tanaka E, Pradono J, Anme T. Association of general and central obesity with hypertension. Clin Nutr. (2018) 37:1259–63. doi: 10.1016/j.clnu.2017.05.012
27. Zhang W, He K, Zhao H, Hu X, Yin C, Zhao X, et al. Association of body mass index and waist circumference with high blood pressure in older adults. BMC Geriatr. (2021) 21:260. doi: 10.1186/s12877-021-02154-5
29. Ma YL, Jin CH, Zhao CC, Ke JF, Wang JW, Wang YJ, et al. Waist-to-height ratio is a simple and practical alternative to waist circumference to diagnose metabolic syndrome in type 2 diabetes. Front Nutr. (2022) 9:986090. doi: 10.3389/fnut.2022.986090
30. Akbari-Khezrabadi A, Zibaeenezhad MJ, Shojaeefard E, Naseri A, Mousavi S, Sarejloo S, et al. Can anthropometric indices predict the chance of hypertension? A multicentre cross-sectional study in Iran. BMJ Open. (2022) 12:e062328. doi: 10.1136/bmjopen-2022-062328
31. Ashwell M, Gunn P, Gibson S. Waist-to-height ratio is a better screening tool than waist circumference and BMI for adult cardiometabolic risk factors: systematic review and meta-analysis. Obes Rev. (2012) 13:275–86. doi: 10.1111/j.1467-789X.2011.00952.x
Keywords: WHtR, CHARLS, hypertension, central obesity, female
Citation: Wu Y, Tong Y, Wang H, Zhang X, Long Y, Li Q, Ren J and Liu C (2023) Waist-to-height ratio and new-onset hypertension in middle-aged and older adult females from 2011 to 2015: A 4-year follow-up retrospective cohort study from the China Health and Retirement Longitudinal Study. Front. Public Health 11:1122995. doi: 10.3389/fpubh.2023.1122995
Received: 13 December 2022; Accepted: 30 January 2023;
Published: 28 February 2023.
Edited by:
Liliana Giraldo Rodríguez, Instituto Nacional de Geriatría, MexicoReviewed by:
Agnieszka Pac, Jagiellonian University Medical College, PolandBang Nguyen Pham, Papua New Guinea Institute of Medical Research, Papua New Guinea
Copyright © 2023 Wu, Tong, Wang, Zhang, Long, Li, Ren and Liu. This is an open-access article distributed under the terms of the Creative Commons Attribution License (CC BY). The use, distribution or reproduction in other forums is permitted, provided the original author(s) and the copyright owner(s) are credited and that the original publication in this journal is cited, in accordance with accepted academic practice. No use, distribution or reproduction is permitted which does not comply with these terms.
*Correspondence: Chang Liu, bGl1Y2hhbmdmaEB4anR1LmVkdS5jbg==