 Jian Zhou
 Yuxin Chen
 Hui Chen
 Manoj Khandelwal
 Masoud Monjezi4
- 1School of Resources and Safety Engineering, Central South University, Changsha, China
- 2School of Geological and Mining Engineering, Xinjiang University, Urumqi, China
- 3Institute of Innovation, Science and Sustainability, Federation University Australia, Ballarat, VIC, Australia
- 4Faculty of Engineering, Tarbiat Modares University, Tehran, Iran
Pillar stability is an important condition for safe work in room-and-pillar mines. The instability of pillars will lead to large-scale collapse hazards, and the accurate estimation of induced stresses at different positions in the pillar is helpful for pillar design and guaranteeing pillar stability. There are many modeling methods to design pillars and evaluate their stability, including empirical and numerical method. However, empirical methods are difficult to be applied to places other than the original environmental characteristics, and numerical methods often simplify the boundary conditions and material properties, which cannot guarantee the stability of the design. Currently, machine learning (ML) algorithms have been successfully applied to pillar stability assessment with higher accuracy. Thus, the study adopted a back-propagation neural network (BPNN) and five elements including the sparrow search algorithm (SSA), gray wolf optimizer (GWO), butterfly optimization algorithm (BOA), tunicate swarm algorithm (TSA), and multi-verse optimizer (MVO). Combining metaheuristic algorithms, five hybrid models were developed to predict the induced stress within the pillar. The weight and threshold of the BPNN model are optimized by metaheuristic algorithms, in which the mean absolute error (MAE) is utilized as the fitness function. A database containing 149 data samples was established, where the input variables were the angle of goafline (A), depth of the working coal seam (H), specific gravity (G), distance of the point from the center of the pillar (C), and distance of the point from goafline (D), and the output variable was the induced stress. Furthermore, the predictive performance of the proposed model is evaluated by five metrics, namely coefficient of determination (R2), root mean squared error (RMSE), variance accounted for (VAF), mean absolute error (MAE), and mean absolute percentage error (MAPE). The results showed that the five hybrid models developed have good prediction performance, especially the GWO-BPNN model performed the best (Training set: R2 = 0.9991, RMSE = 0.1535, VAF = 99.91, MAE = 0.0884, MAPE = 0.6107; Test set: R2 = 0.9983, RMSE = 0.1783, VAF = 99.83, MAE = 0.1230, MAPE = 0.9253).
1. Introduction
The bord and pillar method has the advantages of less equipment investment, flexible equipment operation, fast production, short construction period, and simple support. It is widely used in the United States, Australia, India, South Africa, and other countries, and is the dominant method of coal mining. Among them, the stability of the pillar determines the stability of the room-and-pillar goaf site and is one of the prerequisites for the safe working conditions of the room-and-pillar mine (1). Pillar design is the key to the success of bord and pillar coal mining. Estimating the stress at different positions in a pillar is very important to work out the pillar size under the coal pillar strength conditions (2). The mining induced stresses of the pillars constantly change and are highly influenced by the dynamics of the formation equilibrium during the development and depilating phases of coal mining.
There are various methods to evaluate mining-induced stresses on coal pillars, such as empirical (3–7) and numerical methods (8–12). An empirical method is a method of inductive analysis by collecting some previous cases. Singh et al. (13) modified the earlier developed empirical relationship to estimate the extent of influence and the value of the final mining-induced stress on a coal pillar. Although these empirical formulas are used to predict pillar stress, they take fewer factors into account and have been validated in only a few engineering sites, and cannot be applied well beyond the original environmental characteristics. Numerical modeling techniques based on the finite element method (FEM), boundary element method (BEM), finite difference method (FDM), and discrete element method, etc. are more advantageous than the empirical methods in the complex stress conditions caused by coal seam mining with compound geometric shapes (14). Some researchers used numerical simulation methods to study pillar stress state, pillar stability, and other characteristics (15–21). However, despite the low cost and ease of operation of numerical methods, there are many assumptions in the simulation process that require simplified boundary conditions and material properties, leading to idealized results that differ from the actual ones. In addition, the results and accuracy vary due to the different forms of structural discretization, which does not guarantee the accuracy of predictions, and it is difficult to successfully apply this specially developed model to other situations.
Recently, various machine learning algorithms have been increasingly used in the engineering field and have shown excellent predictive performance (21–32). A study by Cavaleri et al. (33) demonstrated the good performance of BPNN in predicting the average surface roughness of EDM surfaces. Psyllaki et al. (34) used artificial neural networks (ANN) to conduct the corresponding study. Armaghani et al. (35) constructed a hybrid model of a particle swarm optimization neural network to predict the settlement of pile foundations. Lu et al. (36) used tree prediction models and as well as feature selection techniques to predict the punching shear capacity of steel fiber reinforced concrete. Asteris et al. (37–40) also used different machine learning models for prediction in their study and the results proved that these machine learning models have excellent prediction performance. The values of induced stresses on coal pillars are related to several factors, and the influencing factors are complex non-linear relationships with each other. Machine learning can overcome the limitations caused by the non-linear high-dimensional problems involved in engineering, has powerful data processing capabilities, and develops machine learning algorithm models with high applicability and flexibility. Based on this, machine learning algorithms have been used to predict the relative performance of pillars. Zhou et al. (41) applied Support Vector Machines (SVMs) to determine pillar stability for underground mines selected from various coal and stone mines by using various indicators, such as width (W), height (H), W/H ratio, uniaxial compressive strength of rock and pillar stress. It was found that the SVMs showed good performance and can be applied as a practical tool for predicting pillar stability. Ahmad et al. (42) proposed random trees and C4.5 decision trees algorithms to predict pillar stability in underground coal and quarry mines, and both models were able to predict pillar stability with reasonable accuracy. Liang et al. (43) used Gradient Boosting Decision Tree (GBDT), Extreme Gradient Boosting (XGBoost), and Light Gradient Boosting Machine (LightGBM) algorithms to predict hard rock pillar stability and found good prediction capability of the models. Monjezi et al. (2) used an artificial neural network (ANN) to predict the stress of the mine pillar in the room-pillar method and found the coefficient of determination (R2) 0.988 between the calculated and predicted pillar stresses. The results were also compared with the BEM and found that the predictive competence of the artificial neural network was far better than that of the BEM numerical solution.
Currently, neural-metaheuristic hybrid models are considered and developed in many fields with high reliability (44–50). Therefore, in this study, five hybrid models were constructed to estimate the induced stresses at different locations within the coal pillar by combining back-propagation neural network (BPNN) and metaheuristic algorithms. Since the selection of weights and thresholds of BPNN has a great impact on the network training, and the random selection of hyper-parameters can lead to unstable prediction performance of BPNN models, the optimal weights and thresholds are selected by optimization techniques to ensure that the models have the best performance. The five metaheuristics selected for this study are the sparrow search algorithm (SSA), gray wolf optimizer (GWO), butterfly optimization algorithm (BOA), tunicate swarm algorithm (TSA), and multi-verse optimizer (MVO).
2. Methods
2.1. Sparrow search algorithm
SSA was inspired by the foraging behavior and anti-predation behavior of sparrows (51) and has been applied to solve many complex engineering optimization problems (52–55). A brief description of SSA is as follows.
Sparrow population members are divided into three categories: finders, entrants, and scouts. The role of finders is to find food, providing all entrants with a foraging area and direction. The position update of the finder during each iteration is described by Equation (1).
where t represents the current iteration number, Tmax is the maximum number of iterations, is the position of the i sparrow in the j dimension, α is a uniform random number between [0, 1], Q is a random number that follows a standard normal distribution, L is a 1 × d matrix whose elements are all 1. R2 ∈ [0, 1], represents the warning value; ST ∈ [0.5, 1], represents the safety value.
Entrants will follow the finders for foraging in order to obtain food, and its position update is described by Equation (2).
where represents the best position of the finder at the t + 1 iteration; represents the global worst position at the t iteration; A is a matrix of size 1 × d with elements randomly assigned to 1 or −1, and A+ = AT(AAT)−1; N is the population size.
Scouts are responsible for reconnaissance and early warning, alerting the entire population to give up foraging when danger is detected. The position update of the scout is described by Equation (3).
Where represents the global optimal position at the t iteration; β is the step size parameter, which obeys the normal distribution random number with mean 0 and variance 1; K is a random number in the range [−1, 1]. fi, fw and fg are the individual fitness value, the global worst fitness value, and the global optimal fitness value of the current sparrow, respectively. ε is an extremely small constant that prevents the denominator from being zero.
2.2. Gray wolf optimizer
GWO is a novel swarm intelligence optimization algorithm inspired by the group predation behavior of gray wolves (56), which has been applied in many engineering fields (57–60). There is a strict hierarchy within the gray wolf group, and the entire wolf group is divided into four levels, namely α, β, δ, and ω. As shown in Figure 1, α is the optimal gray wolf, which is the leader of the wolf group and has the right to decide all major issues of the entire wolf group; β is the second-best gray wolf, assisting the leader wolf to make decisions; δ is at the third level, responsible for sentry, reconnaissance and other tasks; ω is the lowest level wolf and is under the command of the first three levels of gray wolves in action. More descriptions of the principle of GWO can be found in the literature (56, 61).
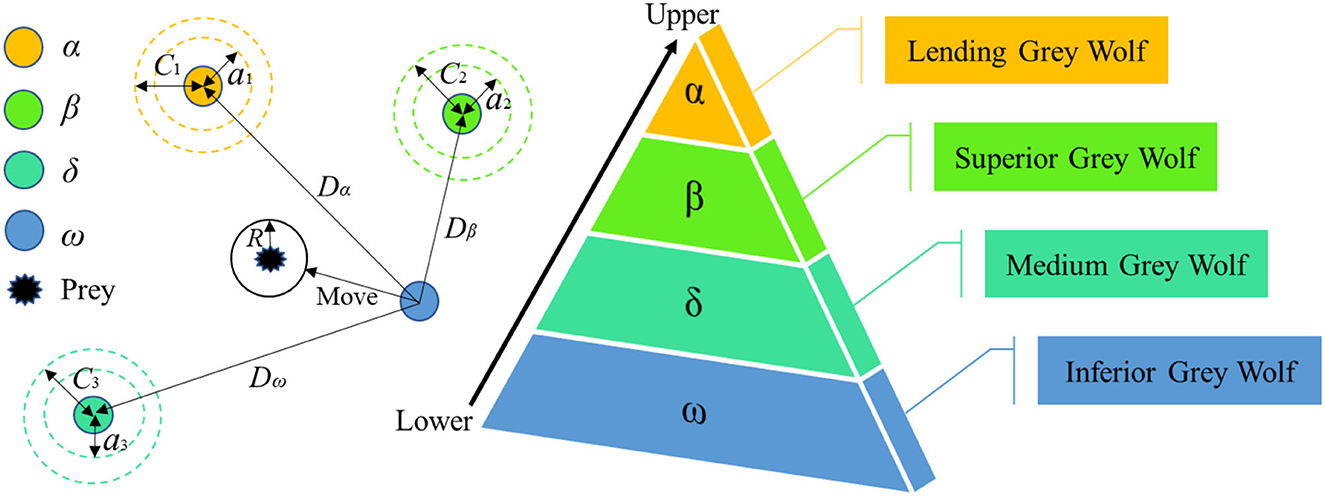
Figure 1. Schematic diagram of GWO.
The predation process of gray wolves is divided into three processes: search, surround, and attack. During the hunting process, the individual gray wolf realizes the update of the position according to the following formula to round up the prey.
Where, t is the current number of iterations; D is the distance between the individual gray wolf and its prey; is the position vector of the individual gray wolf; is the position vector of the prey; and are coefficient vectors; is the convergence factor that decreases linearly from 2 to 0 with the number of iterations; and are vectors of random numbers between [0,1].
2.3. Butterfly optimization algorithm
BOA is a metaheuristic algorithm proposed based on the foraging and courtship behavior of butterflies (62). Assume that each butterfly releases a certain intensity of scent and the concentration of the released scent is related to its adaptation, while each butterfly senses the scent of other butterflies around it and moves toward those that emit more scent. The intensity of the fragrance produced by butterflies is represented by Equation (8).
where fi is the scent intensity perceived by the i-th individual butterfly, c is the sensory modality of the butterfly, T is the stimulus intensity, α is a power exponential parameter that depends on the sensory modality.
When the individual butterfly feels that a certain butterfly emits more fragrance in this area, it will conduct a global search toward the source of the fragrance. This process is represented by Equation (9).
where is the solution vector of the i-th butterfly in the t-th iteration; g* represents the optimal solution among all solutions in the current iteration; r is a random number between [0, 1].
When a butterfly cannot perceive a scent higher than its own, it will fly randomly and perform a local search. The local search can be expressed by Equation (10).
where and represent the solution vectors of the j-th and k-th butterflies in the solution space of the t-th iteration. If and belong to the same population, and r is a random number within (0, 1), it means a local random walk.
2.4. Tunicate swarm algorithm
TSA is a metaheuristic algorithm based on the jet propulsion and swarm behavior of tunicates in the ocean during foraging (63). Tunicates use two of their own behaviors to find food sources, jet propulsion and swarm intelligence. A specific description of the principle of the algorithm can be found in the literature (63). For mathematical modeling of jet propulsion behavior, tunicates should satisfy the following three conditions.
Avoid conflicts between search populations. To avoid the conflict between tunicates, TSA calculates the new tunicate position through Equation (11).
Where is the new tunic position; Vmin and Vmax are the minimum and maximum initial speed of social interaction, respectively, and are generally set as [1, 4]; c1, c2, c3 are random numbers between [0,1].
Move to the position of the best search individual.
where is the distance between the food and the searched individual; is the position of the table food; x is the number of iterations; represents the position of the tunicate individual in the x-th iteration. r is a random number between [0,1].
Converge to the optimal position.
where is the updated position.
After modeling the individual jet propulsion behavior, the swarm behavior is modeled. TSA saves the first two optimal solutions and updates the positions of other search individuals according to the position of the best search individual. Group behavior can be defined using Equation (14).
2.5. Multi-verse optimizer
MVO is a metaheuristic optimization algorithm, which has been widely used in many fields (64–67). It is based on the principle that matter in the universe is simulated by transferring from a white hole to a black hole through a wormhole, which can be described in the literature (64). Here are some brief introductions about MVO.
Assuming that the universe matrix exists in the search space is:
Where d is the spatial dimension, n is the number of universes.
Due to the different inflation rates of each individual universe, the individuals in the universe are able to transfer through white or black holes, chosen randomly using the roulette wheel method, as shown in Equation (16).
Where is the j-th variable of the i-th universe, is the j-th variable of the i-th universe selected by a roulette wheel selection mechanism, Ui shows the i-th universe, NI(Ui) is a normalized inflation rate of the i-th universe, r1 is a random number in [0,1].
The random transport of matter between universes through wormholes to ensure population diversity and the movement of individual universes toward the current optimal universe to increase the inflation rate is given by the following equation.
where Xj is the j-th variable of the optimal position found so far, ubj and lbj respectively represent the upper and lower boundaries of the search space where the j-th parameter is located, r2, r3, and r4 are all random numbers between [0, 1]. WEP and TDR are the wormhole existence probability and the travelling distance rate, respectively, and their expressions are as follows.
Where WEPmin and WEPmax are the minimum and maximum values of parameter WEP, l, and L are the current number of iterations and the maximum number of iterations, p is the exploit precision in the algorithm.
2.6. Back propagation neural network
The back propagation neural network (BPNN) is a multi-layer network that forwards signals and propagates errors backwards. BP neural network has been studied and applied to solve many problems (68–72), and is one of the most widely used networks at present. It can simulate the information transmission mode of human brain neurons, perform non-linear transformation and regression processing on complex information variables, and obtain operation results with a high fitting degree. The structure of the BP neural network consists of three layers: input layer, hidden layer, and output layer (52). The number of hidden layers is not fixed, it can be one layer or multiple layers.
Suppose the number of nodes in the input layer, hidden layer, and output layer are l, m, n. The weight from the input layer to the hidden layer is ωij, the weight from the hidden layer to the output layer is , the threshold from the input layer to the hidden layer is qj, and the weight from the hidden layer to the output layer is . The excitation function g(t) is taken as a Sigmoid function with the following equation.
Then the output of the neuron in each layer is:
where Hj is the output of the jth neuron in the hidden layer, Ok is the output of the neural network, and xi is the input data.
Just like the information transmission between neurons in the brain, after the input variables are input in the input layer, a linear combination of the input variables will be obtained according to the initially set weights. When the weights are continuously modified such that the linear combination value exceeds the threshold, the information is passed to the output layer (73). Figure 2 illustrates the BPNN model framework for predicting induced stress at different locations within the pillar in this study based on 5 input variables and 1 output variable.
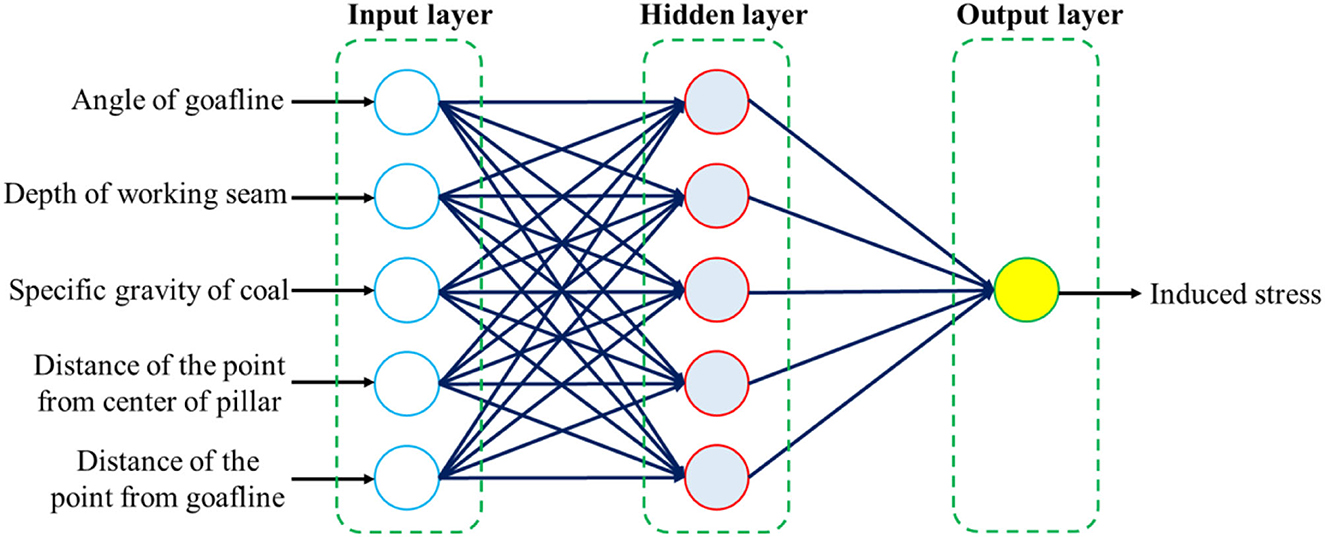
Figure 2. BPNN model framework for estimating induced stress.
3. Materials
3.1. Data description
The data used in this study refer to reference (2), and the database used is from several coal mines whose geological and geometrical conditions are basically the same and which are excavated by bord and pillar method. The main purpose of this study is to predict the induced stress at different locations within the same pillars. Figure 3 shows the plan of the sub-panel, in which Arabic numerals are used to represent different locations within the same pillars. The parameters affecting the induced stress level in the point are the angle of goafline (A), depth of the working coal seam (H), specific gravity of the coal (G), distance of the point from the center of the pillar (C), and distance of the point from goafline (D). These five parameters have been taken as input variables and the induced stress (S) within the coal pillar point as the output variable in this study.
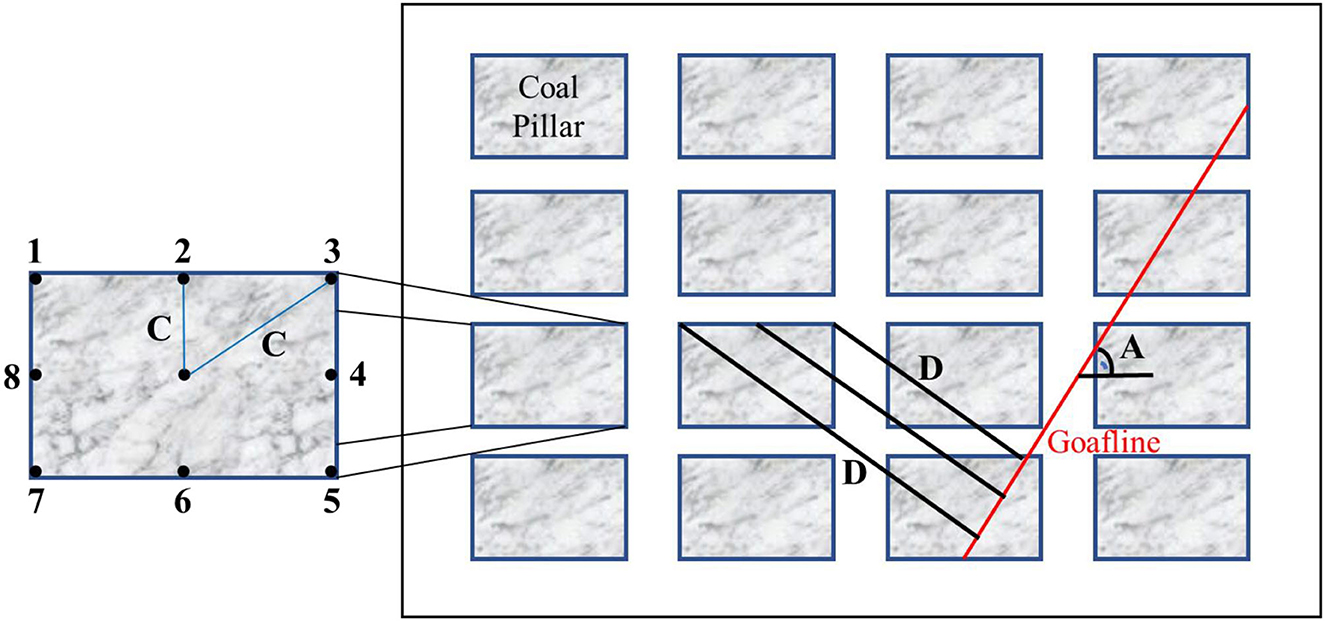
Figure 3. Plan of a sub-panel (2).
A total of 149 datasets were collected in this study to predict stress magnitudes. Table 1 presents some statistics about the input and output parameters (mean, range, and standard deviation) along with their units and descriptions to better illustrate the used data samples. In addition, in order to train and test the model, the database is randomly divided into a training set and a test set, and their data distribution status is represented by a violin plot, as shown in Figure 4. The violin plot is a combination of a box plot and a kernel density plot, where the black boxes indicate the range from the lower quartile to the upper quartile and the red dots in the middle represent the mean (61). From the figure, it can be seen that the parameter data distributions of the training set and testing set are approximately the same in order to ensure that the results obtained in this study will be reliable.
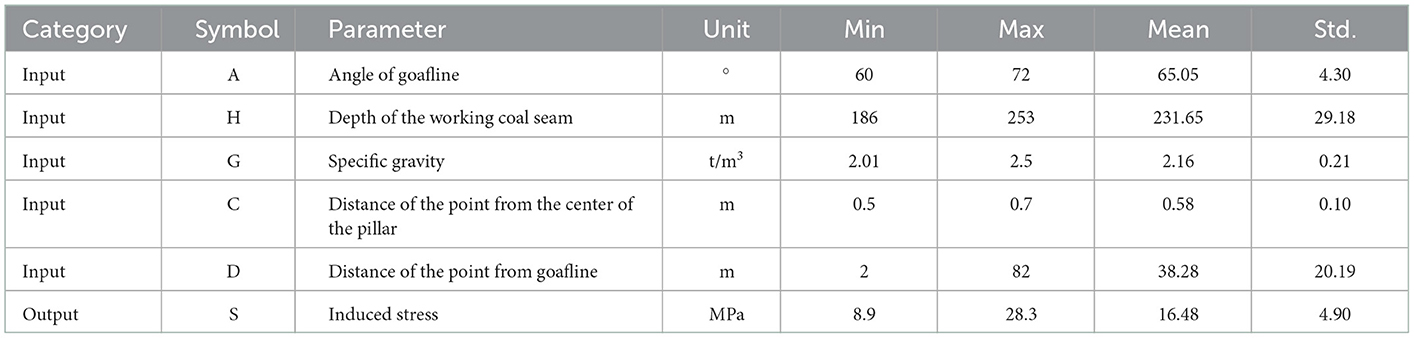
Table 1. Descriptive statistics for input and output parameters.
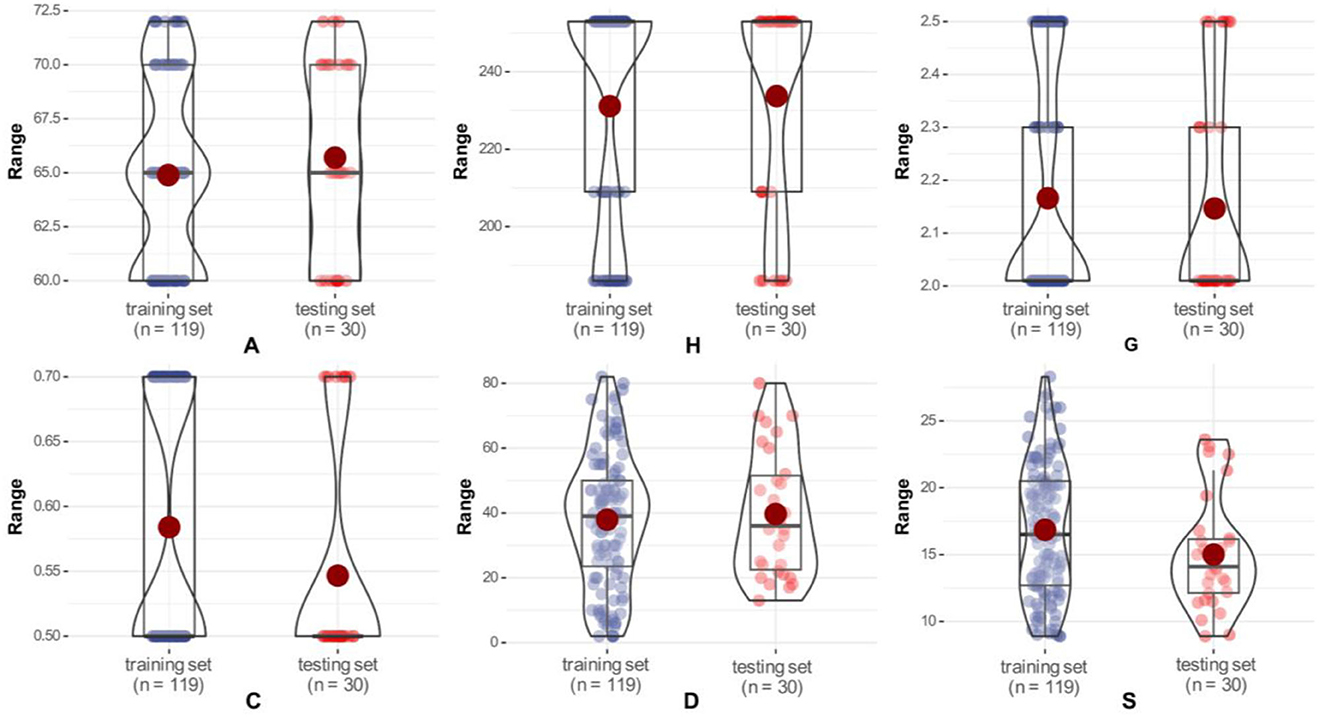
Figure 4. Data distribution of the training set and testing set for the model.
The overall analysis and modeling process of the five hybrid models is shown in Figure 5. All data sets were normalized to the range [−1, 1] in order to improve prediction accuracy and avoid redundant computational costs. To build the mixture model effectively, the collected database was randomly divided into 80% training set and 20% test set based on the Pareto principle (74). The weights and thresholds of the BPNN were then optimized using five metaheuristic algorithms, and the mean absolute error (MAE) was used as the fitness value in the optimization process to determine whether to stop, and the optimal weights and thresholds were assigned to the network predictions. Finally, the predictive performance of the developed neural-metaheuristic hybrid model was evaluated for the training and test sets using five evaluation indicators (R2, RMSE, VAF, MAE, and MAPE).
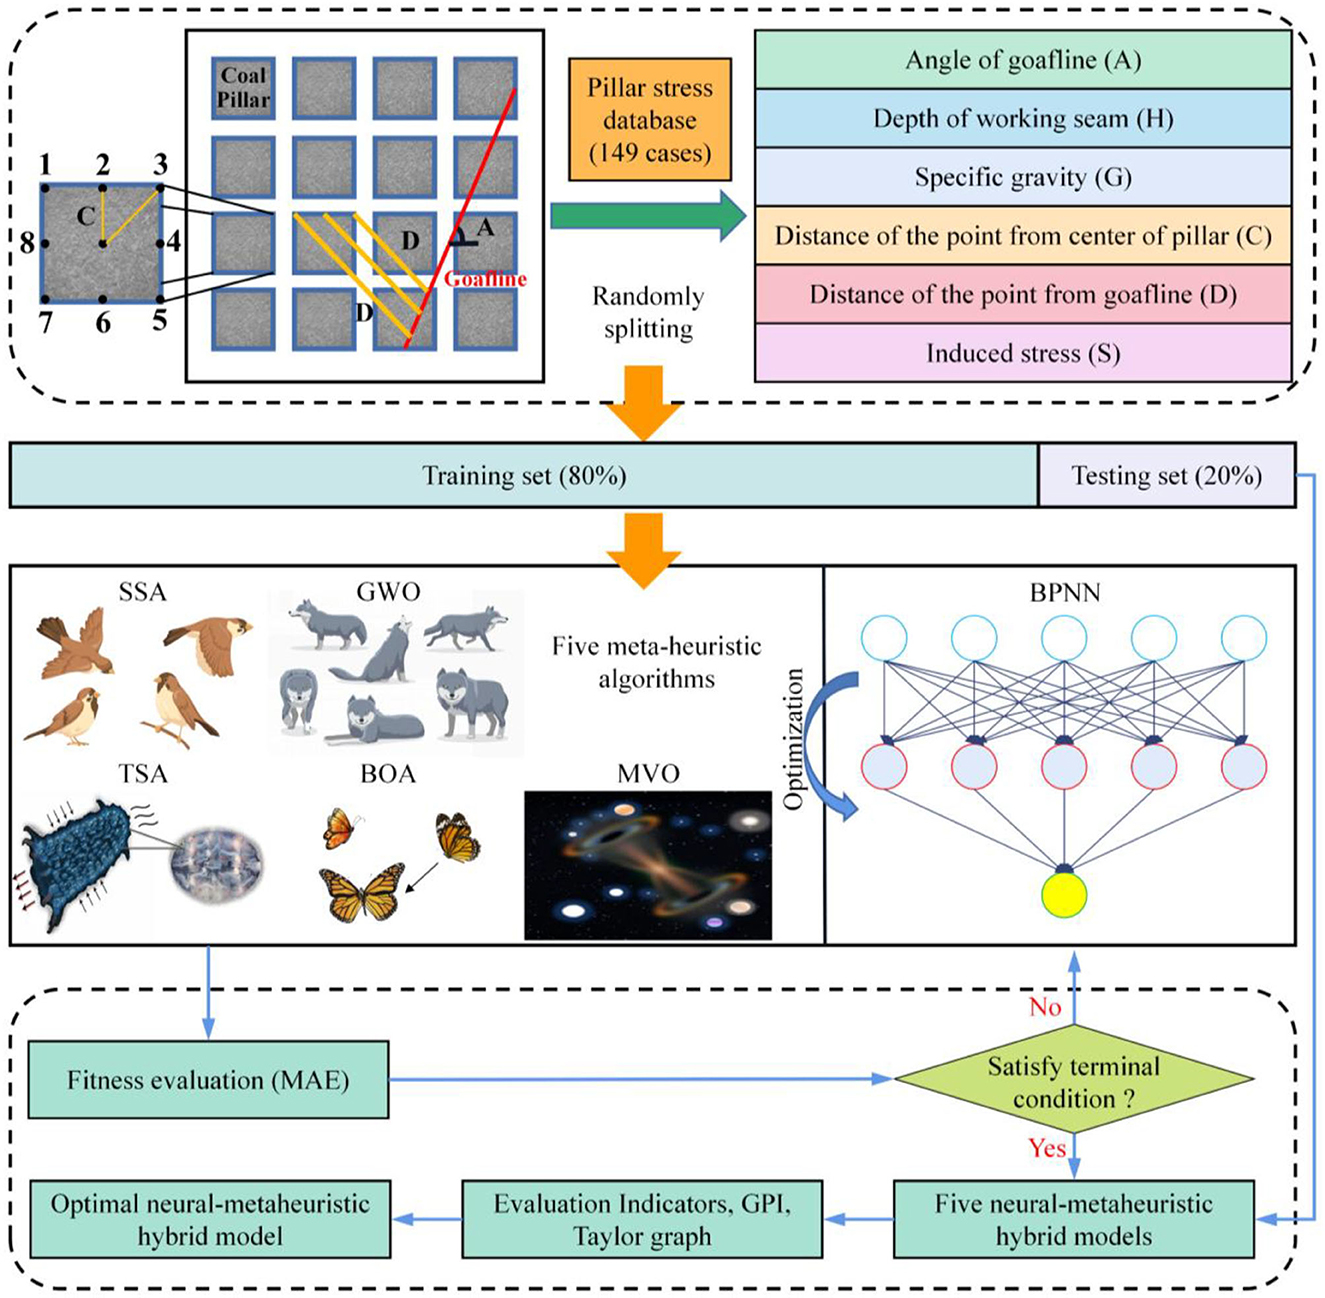
Figure 5. Flowchart of SSA-BP, GWO-BP, BOA-BP, TSA-BP, and MVO-BP prediction models.
3.2. Model validation and evaluation
3.2.1. Evaluation indicators
Validation and evaluation of model performance play an important role in the model building process. Therefore, in order to effectively evaluate the quality of five hybrid prediction models, namely SSA-BPNN, GWO-BPNN, TAS-BPNN, BOA-BPNN, and MVO-BPNN, this study adopts coefficient of determination (R2), root mean squared error (RMSE), variance accounted for (VAF), mean absolute error (MAE), and mean absolute percentage error (MAPE) as the evaluation indicators of the models. Generally, R2 and VAF values equal to 100, and RMSE, MAE, and MAPE values equal to 0 indicate the best predictive performance of a model. The interpretation of these indicators is given in the literature (75–89), and their expressions are shown in Equations (22–26).
where n is the number of input-output data pairs, S is the actual column stress, Ŝ is the predicted column stress, and is the average value of the actual column stress.
3.2.2. Global performance indicator
To avoid complex and tedious integration of scoring rankings, this study uses the global performance indicator (GPI) for the comprehensive evaluation of the model (75, 90). Before calculating the GPI, each evaluation indicator needs to be normalized in the interval [0, 1], after calculating according to the following equation.
where βj is equal to 1 for RMSE, MAE, and MAPE, and −1 for R2 and VAF. j is the median of the scaled values of indicator j and yij is the scaled value of indicator j of model i. The less the RMSE, MAE, and MAPE are than the median value, and the higher the R2 and VAF are above the median value, the higher the GPI value is. It can be seen that the better the performance of the model, the higher its GPI value.
4. Results and discussion
4.1. Determination of the optimal population size for the model
To determine the optimal weights and thresholds to obtain the best column stress prediction performance, five meta-heuristic algorithms (SSA, GWO, BOA, TSA, and MVO) were used to tune the weights and thresholds in the BPNN model, and the mean absolute error (MAE) was used as the fitness. In this study, six population sizes of 50, 100, 150, 200, 250, and 300 were designed for each of the five hybrid models. the maximum number of iterations was set to 500 to select the best optimal parameters. Figures 6A–E shows the fitness curves of the five hybrid models with different population sizes, and it can be seen that the optimal process is different for different population sizes, and the MAE value decreases with the increase of the number of iterations. The lowest fitness values of SSA-BPNN, GWO-BPNN, BOA-BPNN, TSA-BPNN, and MVO-BPNN were 1.0827, 0.92683, 1.03569, 1.10515, and 0.99775, corresponding to the mixed models with population sizes of 200, 300, 200, 200, and 250, in that order. It indicates that these hybrid models perform best in the training set. Of course, the fitness curve alone is not sufficient to determine the optimal population size. Therefore, to determine the optimal population size, we evaluated the model performance with five indicators and calculated the GPI values of each model based on the evaluation indicators, and the results are shown in Table 2. Better models have higher GPI values, so the optimal population size of SSA-BPNN is 50 (Training set: R2 = 0.9984, RMSE = 0.2009, VAF = 99.84, MAE = 0.1262, and MAPE = 0.8477; Test set: R2 = 0.9980, RMSE = 0.1846, VAF = 99.80, MAE = 0.1400, and MAPE = 1.0736), the optimal population size of GWO-BPNN is 300 (training set: R2 = 0.9991, RMSE = 0.1535, VAF = 99.91, MAE = 0.0884, MAPE = 0.6107; test set: R2 = 0.9983, RMSE = 0.1783, VAF = 99.83, MAE = 0.1230, and MAPE = 0.9253), the optimal population size of BOA-BPNN is 200 (training set: R2 = 0.9988, RMSE = 0.1750, VAF = 99.88, MAE = 0.0934, and MAPE = 0.6607; test set: R2 = 0.9973, RMSE = 0.2207, VAF = 99.71, MAE = 0.1543, and MAPE = 1.1900), and the optimal population size of TSA-BPNN is 150 (Training set: R2 = 0.9989, RMSE = 0.1667, VAF = 99.89, MAE = 0.1041, and MAPE = 0.7292; Test set: R2 = 0.9975, RMSE = 0.2234, VAF = 99.75, MAE = 0.1642, and MAPE = 1.2421), the optimal population size of MVO-BPNN is 250 (training set: R2 = 0.9989, RMSE = 0.1692, VAF = 99.88, MAE = 0.1076, and MAPE = 0.7078; test set: R2 = 0.9968, RMSE = 0.2498, VAF = 99.67, MAE = 0.1754, and MAPE = 1.2480).
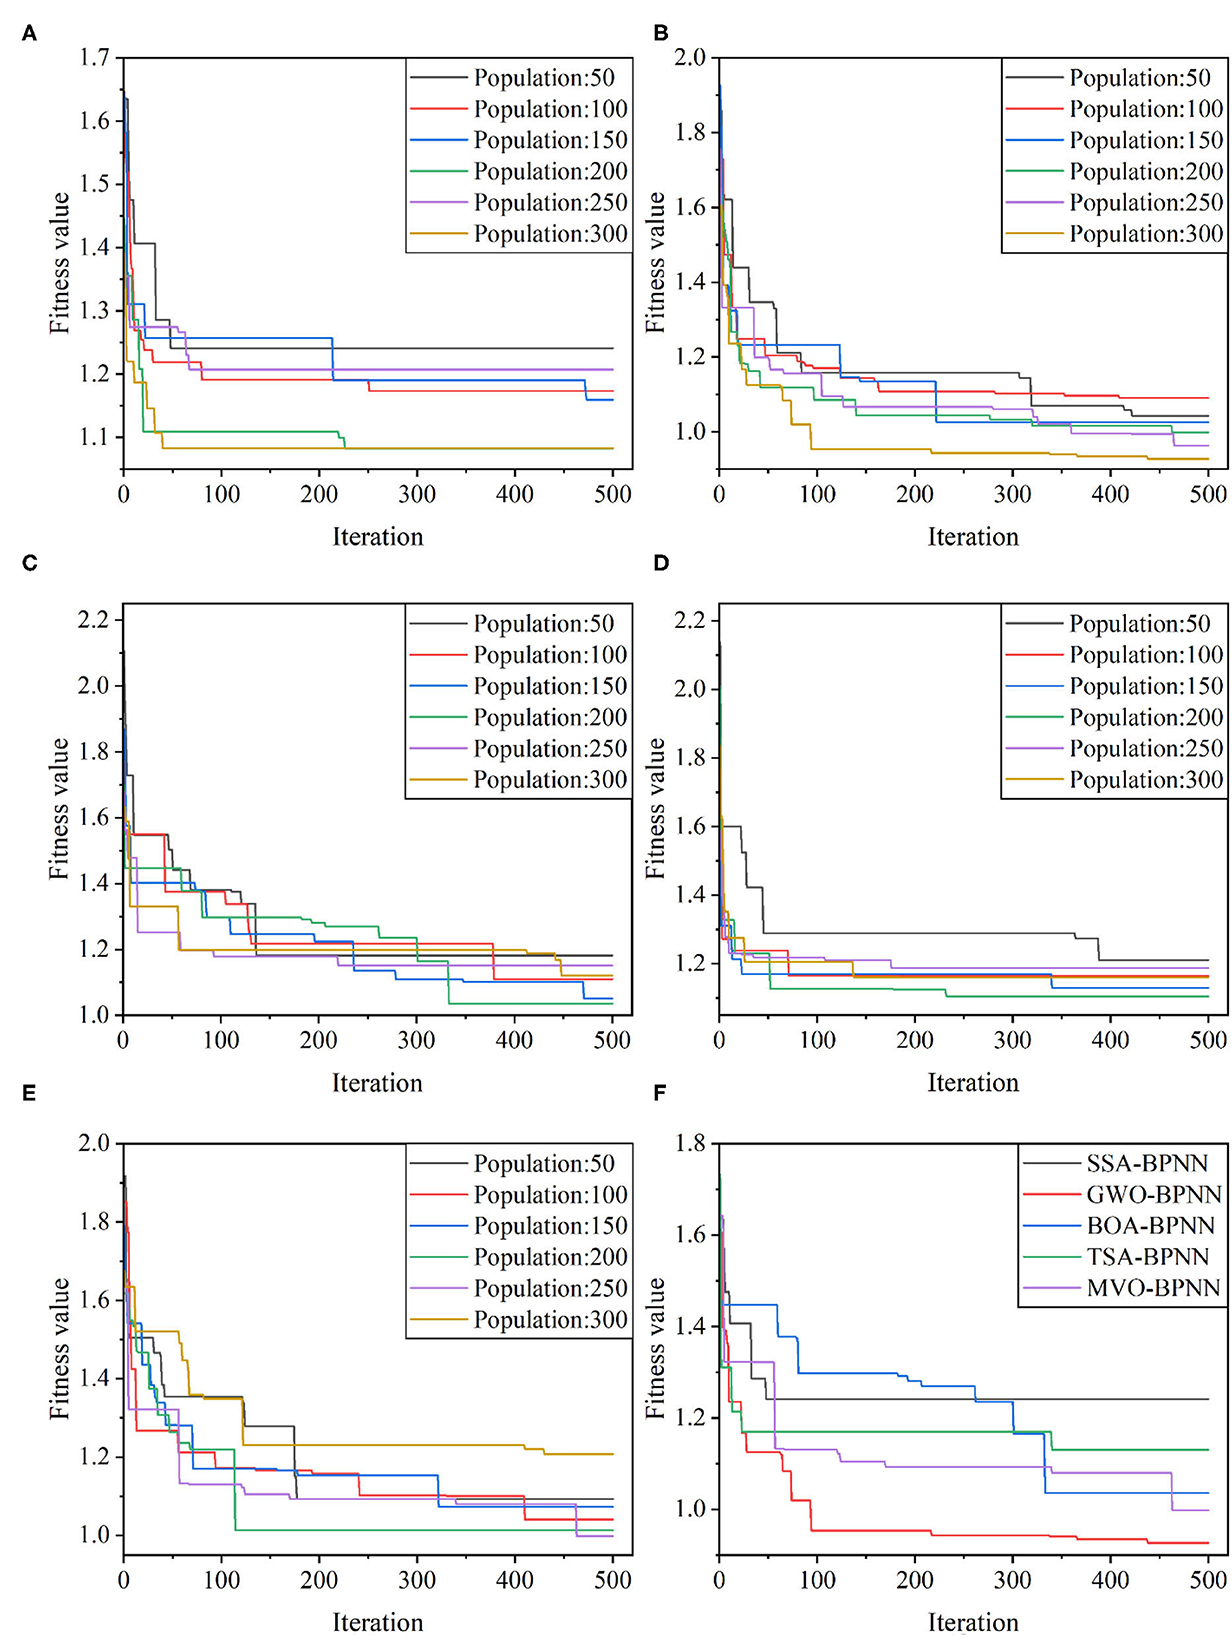
Figure 6. Changes in the fitness values of hybrid models: (A) SSA-BP; (B) GWO-BP; (C) BOA-BP; (D) TSA-BP; (E) MVO-BP; (F) the fitness values of five different optimal population size models.
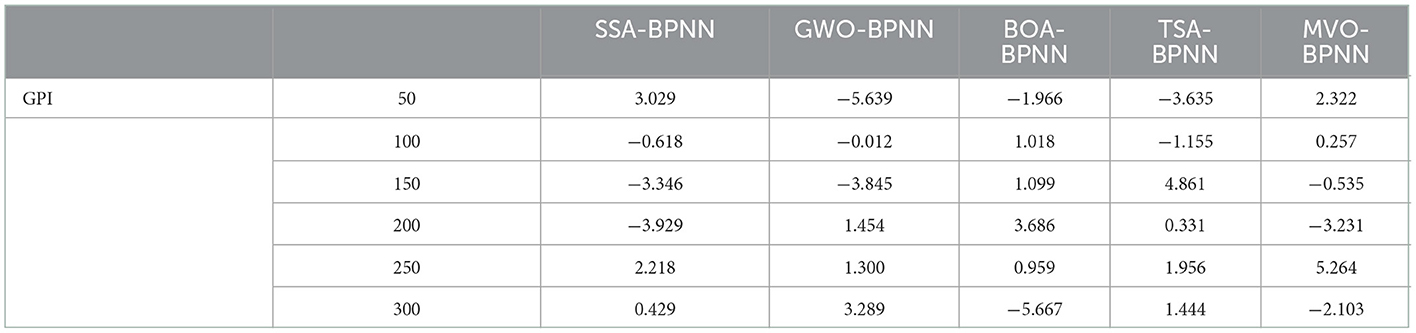
Table 2. GPI values for different population sizes of the hybrid models.
4.2. Comparative analysis of hybrid models
The correlations between predictions and measured induced stresses for the five optimal mixed model training and test datasets are shown in Figure 7. It can be seen from the figure that the training and testing sample points of these hybrid models are basically distributed near the perfect fitting line (“measured stress value = predicted stress value”), and the R2 values are above 0.99, indicating that the five optimization techniques based on BP neural network proposed in this paper can achieve high training and testing outcome results.
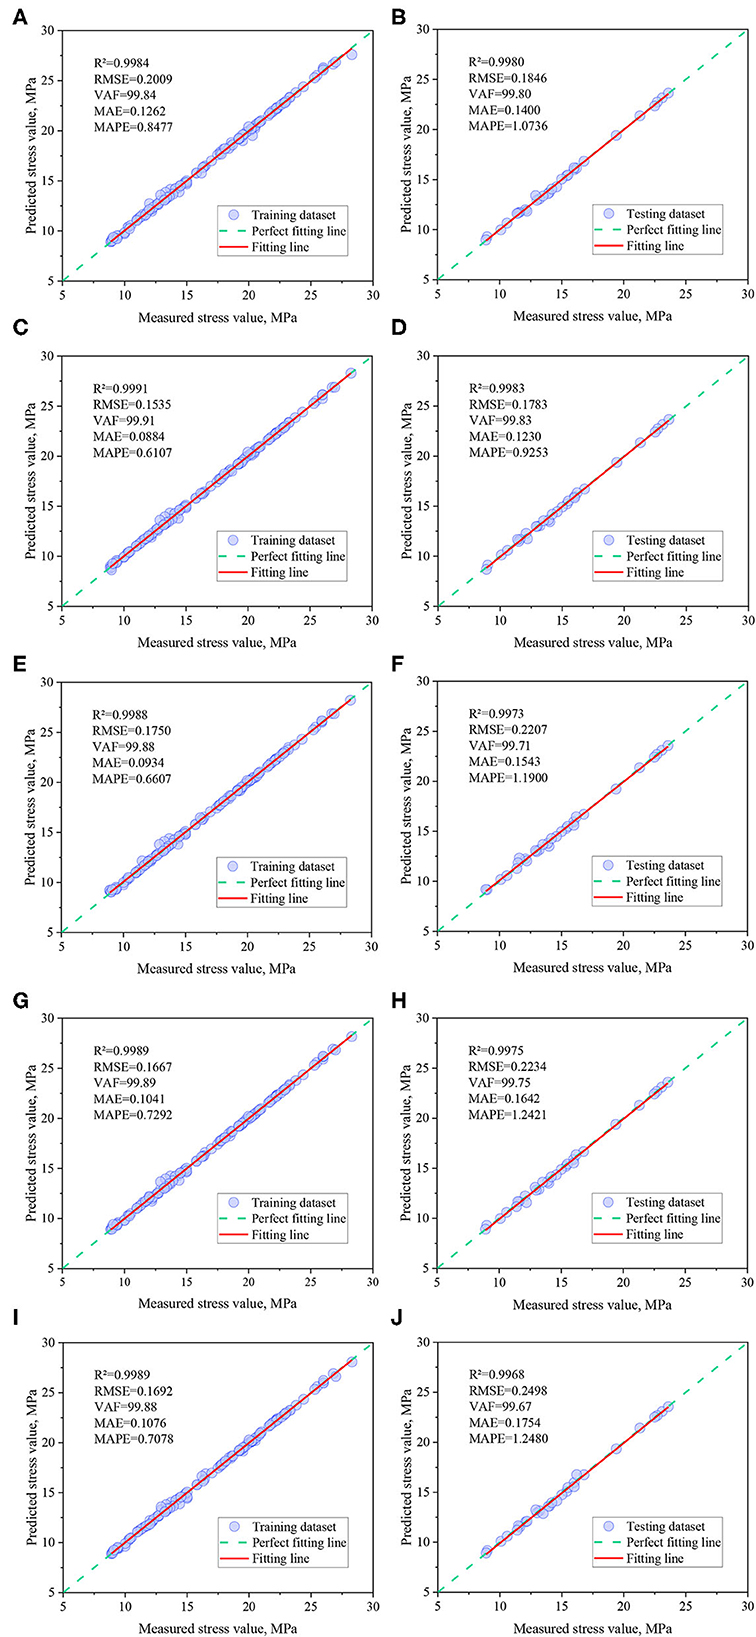
Figure 7. Correlation analysis between measured and predicted induced stress. (A) SSA-BP (Training). (B) SSA-BP (Testing). (C) GWO-BP (Training). (D) GWO-BP (Testing). (E) BOA-BP (Training). (F) BOA-BP (Testing). (G) TSA-BP (Training). (H) TSA-BP (Testing). (I) MVO-BP (Training). (J) MVO-BP (Testing).
In order to compare and evaluate the prediction performance of the hybrid models, based on the previous discussion, three classical machine learning models, BPNN, random forest (RF) and radial basis function network (RBF), were also introduced in this study for comparison, and the GPI values of each model were calculated, and the detailed data are listed in Table 3. from the table, it can be seen that the GWO-BPNN model has the best prediction performance (on the training set, R2 = 0.9991, RMSE = 0.1535, VAF = 99.91, MAE = 0.0884, and MAPE = 0.6107; on the test set, R2 = 0.9983, RMSE = 0.1783, VAF = 99.83, MAE = 0.1230, and MAPE = 0.9253). Figure 6F gives an iterative graph of the objective optimization of the five hybrid models, from which it can be seen that the GWO-BPNN hybrid model shows the best results on the training set. In addition, to further demonstrate the superiority of the hybrid model, the Taylor graph is utilized to more visually show the performance of the model on the test set (as shown in Figure 8). The Taylor graph shows the correlation coefficient, RMSE, and standard deviation between the actual and predicted values of the model (65, 75, 91–93). The Taylor graph shows that the hybrid model significantly outperforms the un-optimized classical model. In conclusion, while all hybrid models performed well in predicting induced stress with high accuracy, the GWO-BPNN showed the best predictive performance overall. It is therefore recommended to apply GWO-BPNN to predict the induced stress at different locations within the pillar.

Table 3. Ranking of different models according to GPI.
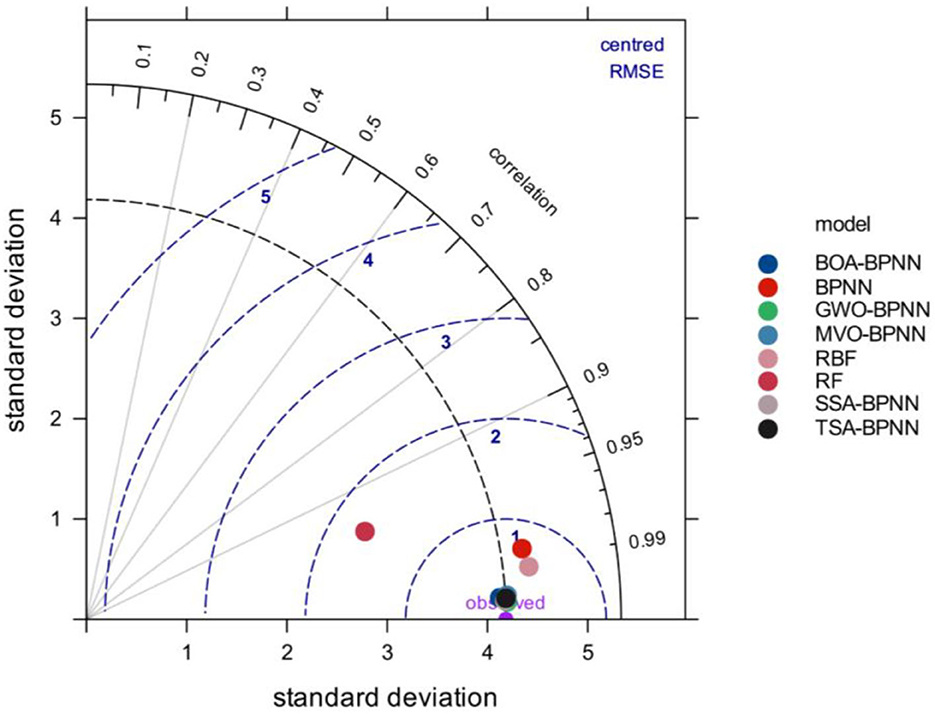
Figure 8. Model performance comparison in Taylor graph.
It is important to note that the data used in this article are from a study conducted with Monjezi et al. (2). They developed an ANN model to predict induced stress at different locations in pillar and pillar recovery. They report that in the testing phase, the optimal ANN model has an R2 value of 0.988, an RMSE value of 0.056233, an MAE value of 0.309281, and a MAPE value of 2.337007. Compared with this study, the proposed GWO-BPNN model has an R2 value of 0.9983, RMSE value of 0.1783, MAE value of 0.1230, and MAPE value of 0.9253, which is better than the ANN model developed by Monjezi et al. (2).
5. Conclusions
Estimation of pillar stress plays an important role in determining pillar size, room width and roof conditions. Thus, in order to predict the induced stress at different positions within the coal pillar in room-and-pillar mining method, five hybrid models based on BPNN and metaheuristic algorithms were constructed in this study. The five hybrid models (SSA-BPNN, GWO-BPNN, BOA-BPNN, TSA-BPNN, and MVO-BPNN) were trained and tested using the established database. The angle of goafline (A), Depth of the working coal seam (H), specific gravity (G), distance of the point from the center of the pillar (C), and distance of the point from goafline (D) were taken as input variables, whereas the induced stress (S) were taken as output variable. Model prediction performance was evaluated using five evaluation indicators, GPI, and Taylor diagrams. The experimental results show that the prediction performance of the five hybrid models is significantly better than that of the un-optimized models, and were better than the prediction results of the earlier developed ANN model developed. Among them, the GWO-BPNN model performed the best in both the training phase and the testing phase (Training set: R2 = 0.9991, RMSE = 0.1535, VAF = 99.91, MAE = 0.0884, MAPE = 0.6107; Test set: R2 = 0.9983, RMSE = 0.1783, VAF = 99.83, MAE = 0.1230, MAPE = 0.9253).
It is worth noting that the prediction model developed in this study can only be used to predict the induced stress in the mine pillar, but the algorithms used can be applied to other engineering practices. In addition, the limitation of using the mixed model to predict induced stress in this research is that the data set is small, and the modeling process only involves 149 cases. In the future, a database with more samples and features needs to be established to ensure the performance and stability of the prediction model.
Data availability statement
The raw data supporting the conclusions of this article will be made available by the authors, without undue reservation.
Author contributions
JZ: validation, resources, formal analysis, visualization, software, writing—review and editing, supervision, and funding acquisition. YC: conceptualization, methodology, validation, software, investigation, visualization, and writing—original draft. HC: validation, formal analysis, writing—review and editing, and supervision. MK: formal analysis, validation, visualization, and writing—review and editing. MM: data curation, visualization, and writing and editing. KP: formal analysis, validation, investigation, and writing—review and editing. All authors contributed to the article and approved the submitted version.
Funding
This research was partially supported by the National Natural Science Foundation Project of China (42177164), the Distinguished Youth Science Foundation of Hunan Province of China (2022JJ10073), and the Accurate Delay Rock Breaking Mechanism and Key Technology Innovation Team (2020D14043).
Conflict of interest
The authors declare that the research was conducted in the absence of any commercial or financial relationships that could be construed as a potential conflict of interest.
Publisher's note
All claims expressed in this article are solely those of the authors and do not necessarily represent those of their affiliated organizations, or those of the publisher, the editors and the reviewers. Any product that may be evaluated in this article, or claim that may be made by its manufacturer, is not guaranteed or endorsed by the publisher.
References
1. Ghasemi E, Ataei M, Shahriar K. An intelligent approach to predict pillar sizing in designing room and pillar coal mines. Int J Rock Mech Min Sci. (2014) 65:86–95. doi: 10.1016/j.ijrmms.2013.11.009
2. Monjezi M, Hesami SM, Khandelwal M. Superiority of neural networks for pillar stress prediction in bord and pillar method. Arabian J Geosci. (2011) 4:845–53. doi: 10.1007/s12517-009-0101-x
3. Hauquin T, Deck O, Gunzburger Y. Average vertical stress on irregular elastic pillars estimated by a function of the relative extraction ratio. Int J Rock Mech Min Sci. (2016) 83:122–34. doi: 10.1016/j.ijrmms.2015.12.004
4. Singh R, Singh AK, Maiti J, Mandal PK, Singh R, Kumar R. An observational approach for assessment of dynamic loading during underground coal pillar extraction. Int J Rock Mech Min Sci. (2011) 48:794–804. doi: 10.1016/j.ijrmms.2011.04.003
5. Chen T, Mitri HS. Strategic sill pillar design for reduced hanging wall overbreak in longhole mining. Int J Mining Sci Technol. (2021) 31:975–82. doi: 10.1016/j.ijmst.2021.09.002
6. Walton G, Sinha S. Improved empirical hard rock pillar strength predictions using unconfined compressive strength as a proxy for brittleness. Int J Rock Mech Min Sci. (2021) 148:104934. doi: 10.1016/j.ijrmms.2021.104934
7. Du K, Li X, Su R, Tao M, Lv S, Luo J, et al. Shape ratio effects on the mechanical characteristics of rectangular prism rocks and isolated pillars under uniaxial compression. Int J Mining Sci Technol. (2022) 32:347–62. doi: 10.1016/j.ijmst.2022.01.004
8. Gu MX, Cui J, Yuan J, Wu Y, Li YD, Mo HZ. The stress and deformation of stone column-improved soft clay by discrete element modelling. Eur J Environ Civil Eng. (2020) 26:1544–60. doi: 10.1080/19648189.2020.1715851
9. Malli T, Yetkin ME, Ozfirat MK, Kahraman B. Numerical analysis of underground space and pillar design in metalliferous mine. J African Earth Sci. (2017) 134:365–72. doi: 10.1016/j.jafrearsci.2017.07.018
10. Mohammadi H, Darbani H. A three dimensional geometrical model for calculation of induced stresses surrounding longwall working. J Min Environ. (2018) 9: 727–40. doi: 10.22044/jme.2018.7084.1551
11. Suchowerska AM, Carter JP, Merifield RS. Horizontal stress under supercritical longwall panels. Int J Rock Mech Min Sci. (2014) 70:240–51. doi: 10.1016/j.ijrmms.2014.03.009
12. Yu Y, Deng KZ, Chen SE. Mine size effects on coal pillar stress and their application for partial extraction. Sustainability. (2018) 10:792. doi: 10.3390/su10030792
13. Singh AK, Singh R, Maiti J, Kumar R, Mandal PK. Assessment of mining induced stress development over coal pillars during depillaring. Int J Rock Mech Min Sci. (2011) 48:805–18. doi: 10.1016/j.ijrmms.2011.04.004
14. Jaiswal A, Sharma SK, Shrivastva BK. Numerical modeling study of asymmetry in the induced stresses over coal mine pillars with advancement of the goaf line. Int J Rock Mech Min Sci. (2004) 41:859–64. doi: 10.1016/j.ijrmms.2004.01.007
15. Li G, Mizuta Y, Ishida T, Li H, Nakama S, Sato T. Stress field determination from local stress measurements by numerical modelling. Int J Rock Mech Min Sci. (2009) 46:138–47. doi: 10.1016/j.ijrmms.2008.07.009
16. Das K, Kumar GS. Optimum extraction of pillars by FLAC-3D where surface features is the major constrain. Rock Eng Rock Mech. (2014) 591–5. doi: 10.1201/b16955-101
17. Li CQ, Zhou J, Armaghani DJ, Li XB. Stability analysis of underground mine hard rock pillars via combination of finite difference methods, neural networks, and Monte Carlo simulation techniques. Underground Space. (2021) 6:379–95. doi: 10.1016/j.undsp.2020.05.005
18. Ahmed SS, Gunzburger Y, Renaud V, AlHeib M. Initialization of highly heterogeneous virgin stress fields within the numerical modeling of large-scale mines. Int J Rock Mech Min Sci. (2017) 99:50–62. doi: 10.1016/j.ijrmms.2016.04.006
19. Sepehri M, Apel D, Liu W. Stope Stability Assessment and Effect of Horizontal to Vertical Stress Ratio on the Yielding and Relaxation Zones around Underground Open Stopes Using Empirical and Finite Element Methods. Arch Min Sci. (2017) 62:653–69. doi: 10.1515/amsc-2017-0047
20. Sherizadeh T, Pinnaduwa, Kulatilake HSW. Assessment of roof stability in a room and pillar coal mine in the US using three-dimensional distinct element method. Tunnell Underground Space Technol. (2016) 59:24–37. doi: 10.1016/j.tust.2016.06.005
21. Li XY, Kim E, Walton G. A study of rock pillar behaviors in laboratory and in-situ scales using combined finite-discrete element method models. Int J Rock Mech Min Sci. (2019) 118:21–32. doi: 10.1016/j.ijrmms.2019.03.030
22. Pu YY, Apel DB, Prusek S, Walentek A, Cichy T. Back-analysis for initial ground stress field at a diamond mine using machine learning approaches. Nat Hazards. (2021) 105:191–203. doi: 10.1007/s11069-020-04304-1
23. Harandizadeh H, Armaghani DJ, Asteris PG, Gandomi AH. TBM performance prediction developing a hybrid ANFIS-PNN predictive model optimized by imperialism competitive algorithm. Neural Comput Appl. (2021) 33:16149–79. doi: 10.1007/s00521-021-06217-x
24. Zhou J, Li XB, Mitri HS. Comparative performance of six supervised learning methods for the development of models of hard rock pillar stability prediction. Nat Hazards. (2015) 79:291–316. doi: 10.1007/s11069-015-1842-3
25. Zhou J, Shi XZ, Du K, Qiu XY, Li XB, Mitri HS. Feasibility of random-forest approach for prediction of ground settlements induced by the construction of a shield-driven tunnel. Int J Geomechanics. (2017) 17:04016129. doi: 10.1061/(ASCE)GM.1943-5622.0000817
26. Zhou J, Qiu YG, Khandelwal M, Zhu SL, Zhang XL. Developing a hybrid model of Jaya algorithm-based extreme gradient boosting machine to estimate blast-induced ground vibrations. Int J Rock Mech Min Sci. (2021) 145:104856. doi: 10.1016/j.ijrmms.2021.104856
27. Zhou J, Qiu YG, Zhu SL, Armaghani DJ, Khandelwal M, Mohamad ET. Estimation of the TBM advance rate under hard rock conditions using XGBoost and Bayesian optimization. Underground Space. (2021) 6:506–15. doi: 10.1016/j.undsp.2020.05.008
28. Qiu YG, Zhou J, Khandelwal M, Yang HT, Yang PX, Li CQ. Performance evaluation of hybrid WOA-XGBoost, GWO-XGBoost and BO-XGBoost models to predict blast-induced ground vibration. Eng Comput. (2021) 38:4145–62. doi: 10.1007/s00366-021-01393-9
29. Ding HX, Li GH, Dong X, Lin Y. Prediction of pillar stability for underground mines using the stochastic gradient boosting technique. IEEE Access. (2018) 6:69253–64. doi: 10.1109/ACCESS.2018.2880466
30. Huang JD, Asteris PG, Pasha SMK, Mohammed AS, Hasanipanah M. A new auto-tuning model for predicting the rock fragmentation: a cat swarm optimization algorithm. Eng Comput. (2022) 38:2209–20. doi: 10.1007/s00366-020-01207-4
31. Gavriilaki E, Asteris PG, Touloumenidou T, Koravou EE, Koutra M, Papayanni PG, et al. Genetic justification of severe COVID-19 using a rigorous algorithm. Clin Immunol. (2021) 226:108726. doi: 10.1016/j.clim.2021.108726
32. Maraveas C, Asteris PG, Arvanitis KG, Bartzanas T, Loukatos D. Application of bio and nature-inspired algorithms in agricultural engineering. Arch Comput Methods Eng. (2022) 1–34. doi: 10.1007/s11831-022-09857-x
33. Cavaleri L, Chatzarakis GE, Di Trapani F, Douvika MG, Foskolos FM, Fotos A, et al. Surface roughness prediction of electro-discharge machined components using artificial neural networks. In: Irf2016: 5th International Conference Integrity-Reliability-Failure. (2016) 1301–18. Available online at: https://paginas.fe.up.pt/~irf/Proceedings_IRF2016/data/papers/6421.pdf
34. Psyllaki P, Stamatiou K, Iliadis I, Mourlas A, Asteris P, Vaxevanidis N. Surface treatment of tool steels against galling failure. In: MATEC Web of Conferences. (2018) p. 188. doi: 10.1051/matecconf/201818804024
35. Armaghani DJ, Asteris PG, Fatemi SA, Hasanipanah M, Tarinejad R, Rashid ASA, et al. On the use of neuro-swarm system to forecast the pile settlement. Appl Sci Basel. (2020) 10:1904. doi: 10.3390/app10061904
36. Lu SS, Koopialipoor M, Asteris PG, Bahri M, Armaghani DJ. A novel feature selection approach based on tree models for evaluating the punching shear capacity of steel fiber-reinforced concrete flat slabs. Materials. (2020) 13:3902. doi: 10.3390/ma13173902
37. Asteris PG, Douyika MG, Karamani CA, Skentou AD, Chlichlia K, Cayaleri L, et al. A Novel Heuristic Algorithm for the Modeling and Risk Assessment of the COVID-19 Pandemic Phenomenon. Cmes-Comput Model Eng Sci. (2020) 125:815–28. doi: 10.32604/cmes.2020.013280
38. Asteris PG, Gavriilaki E, Touloumenidou T, Koravou EE, Koutra M, Papayanni PG, et al. Genetic prediction of ICU hospitalization and mortality in COVID-19 patients using artificial neural networks. J Cell Mol Med. (2022) 26:1445–55. doi: 10.1111/jcmm.17098
39. Asteris PG, Lemonis ME, Le TT, Tsavdaridis KD. Evaluation of the ultimate eccentric load of rectangular CFSTs using advanced neural network modeling. Eng Struct. (2021) 248:113297. doi: 10.1016/j.engstruct.2021.113297
40. Asteris PG, Mamou A, Hajihassani M, Hasanipanah M, Koopialipoor M, Le TT, et al. Soft computing based closed form equations correlating L and N-type Schmidt hammer rebound numbers of rocks. Transp Geotech. (2021) 29:100588. doi: 10.1016/j.trgeo.2021.100588
41. Zhou J, Li XB, Shi XZ, Wei W, Wu BB. Predicting pillar stability for underground mine using Fisher discriminant analysis and SVM methods. Trans Nonferrous Metals Soc China. (2011) 21:2734–43. doi: 10.1016/S1003-6326(11)61117-5
42. Ahmad M, Al-Shayea NA, Tang XW, Jamal A, Al-Ahmadi HM, Ahmad F. Predicting the pillar stability of underground mines with random trees and C45 decision trees. Appl Sci Basel. (2020) 10:6486. doi: 10.3390/app10186486
43. Liang WZ, Luo SZ, Zhao GY, Wu H. Predicting hard rock pillar stability using GBDT, XGBoost, and LightGBM algorithms. Mathematics. (2020) 8:765. doi: 10.3390/math8050765
44. Wang CZ, Li M, Wang RX, Yu H, Wang SP. An image denoising method based on BP neural network optimized by improved whale optimization algorithm. Eurasip J Wirel Communic Netw. (2021) 2021:1–22. doi: 10.1186/s13638-021-02013-2
45. Xu XQ, Gu YW, Huang W, Chen DK, Zhang C, Yang X. Structural optimization of steel-epoxy asphalt pavement based on orthogonal design and GA-BP algorithm. Crystals. (2021) 11:417. doi: 10.3390/cryst11040417
46. Rao H, Li MZ, Hu QR. Fault diagnosis method based on PSO-optimized H-BP neural network. In: 2009 Third International Symposium on Intelligent Information Technology Application. (2009). p. 272.
47. Li HT. Network traffic prediction of the optimized BP neural network based on Glowworm Swarm algorithm. Syst Sci Control Eng. (2019) 7:64–70. doi: 10.1080/21642583.2019.1626299
48. Ren G. Application of neural network algorithm combined with bee colony algorithm in english course recommendation. Comput Intell Neurosci. (2021) 2021:5307646. doi: 10.1155/2021/5307646
49. Nasimi R, Irani R, Moradi B. An improved ant colony algorithm-based ANN for bottom hole pressure prediction in underbalanced drilling. Pet Sci Technol. (2012) 30:1307–16. doi: 10.1080/10916466.2010.497790
50. Liang XP, Guo ZJ, Zhu CH. BP neural network fuzzy image restoration based on brain storming optimization algorithm. J Electr Inf Technol. (2019) 41:2980–6. doi: 10.11999/JEIT190261
51. Xue JK, Shen B. A novel swarm intelligence optimization approach: sparrow search algorithm. Syst Sci Control Eng. (2020) 8:22–34. doi: 10.1080/21642583.2019.1708830
52. Xu XM, Peng LY, Ji ZS, Zheng SP, Tian ZX, Geng SP. Research on substation project cost prediction based on sparrow search algorithm optimized BP neural network. Sustainability. (2021) 13:13746. doi: 10.3390/su132413746
53. Lee YD, Lin WC, Jiang JL, Cai JH, Huang WT, Yao KC. Optimal individual phase voltage regulation strategies in active distribution networks with high PV penetration using the sparrow search algorithm. Energies. (2021) 14:8370. doi: 10.3390/en14248370
54. Gai JB, Zhong KY, Du XJ, Yan K, Shen JX. Detection of gear fault severity based on parameter-optimized deep belief network using sparrow search algorithm. Measurement. (2021) 185:110079. doi: 10.1016/j.measurement.2021.110079
55. Abdulhammed OY. Load balancing of IoT tasks in the cloud computing by using sparrow search algorithm. J Supercomp. (2021) 78:3266–87. doi: 10.1007/s11227-021-03989-w
56. Mirjalili S, Mirjalili SM, Lewis A. Gray wolf optimizer. Adv Eng Softw. (2014) 69:46–61. doi: 10.1016/j.advengsoft.2013.12.007
57. Grace RK, Manimegalai R. Design of Neural Network Based Wind Speed Prediction Model Using GWO. Comput Syst Sci Eng. (2022) 40:593–606. doi: 10.32604/csse.2022.019240
58. Ghalambaz M, Yengejeh RJ, Davami AH. Building energy optimization using Gray Wolf Optimizer (GWO). Case Stud Thermal Eng. (2021) 27:101250. doi: 10.1016/j.csite.2021.101250
59. Makhadmeh SN, Khader AT, Al-Betar MA, Naim S, Abasi AK, Alyasseri ZAA. A novel hybrid gray wolf optimizer with min-conflict algorithm for power scheduling problem in a smart home. Swarm Evolut Comp. (2021) 60:100793. doi: 10.1016/j.swevo.2020.100793
60. Zhou J, Qiu YG, Zhu SL, Armaghani DJ, Li CQ, Nguyen H, et al. Optimization of support vector machine through the use of metaheuristic algorithms in forecasting TBM advance rate. Eng Appl Artif Intell. (2021) 97:104015. doi: 10.1016/j.engappai.2020.104015
61. Li E, Yang F, Ren M, Zhang X, Zhou J, Khandelwal M. Prediction of blasting mean fragment size using support vector regression combined with five optimization algorithms. J Rock Mech Geotech Eng. (2021) 13:1380–97. doi: 10.1016/j.jrmge.2021.07.013
62. Arora S, Singh S. Butterfly optimization algorithm: a novel approach for global optimization. Soft Comput. (2019) 23:715–34. doi: 10.1007/s00500-018-3102-4
63. Kaur S, Awasthi LK, Sangal AL, Dhiman G. Tunicate Swarm Algorithm: A new bio-inspired based metaheuristic paradigm for global optimization. Eng Appl Artif Intell. (2020) 90:103541. doi: 10.1016/j.engappai.2020.103541
64. Mirjalili S, Mirjalili SM, Hatamlou A. Multi-Verse Optimizer: a nature-inspired algorithm for global optimization. Neural Comput Appl. (2016) 27:495–513. doi: 10.1007/s00521-015-1870-7
65. Zhou J, Qiu YG, Armaghani DJ, Zhang WG, Li CQ, Zhu SL, et al. Predicting TBM penetration rate in hard rock condition: A comparative study among six XGB-based metaheuristic techniques. Geosci Front. (2021) 12:101091. doi: 10.1016/j.gsf.2020.09.020
66. Talaat M, Said T, Essa MA, Hatata AY. Integrated MFFNN-MVO approach for PV solar power forecasting considering thermal effects and environmental conditions. Int J Electr Power Energy Syst. (2022) 135:107570. doi: 10.1016/j.ijepes.2021.107570
67. Jamali A. Improving land use land cover mapping of a neural network with three optimizers of multi-verse optimizer, genetic algorithm, and derivative-free function. Egyptian J Remote Sens Space Sci. (2021) 24:373–90. doi: 10.1016/j.ejrs.2020.07.001
68. Fan YJ, Mai JY, Shen YG. Study of the safety assessment model of coal mine based on BP neural network. In: Icicta: 2009 Second International Conference on Intelligent Computation Technology and Automation. (2009). p. 103-−106. doi: 10.1109/ICICTA.2009.34
69. Ma SX, Shi XX, Yu CL, Ren YJ, Ma RX, Tian XQ, et al. Research on improved prediction model of blasting vibration speed by BP neural network. In: Proceedings of 2020 Ieee 5th Information Technology and Mechatronics Engineering Conference. (2020) 1149–54. doi: 10.1109/ITOEC49072.2020.9141802
70. Yu XG, Han J, Shi LQ, Wang Y, Zhao YP. Application of a BP neural network in predicting destroyed floor depth caused by underground pressure. Environ Earth Sci. (2017) 76:1–12. doi: 10.1007/s12665-017-6878-0
71. Tu JS, Liu YZ, Zhou M, Li RX. Prediction and analysis of compressive strength of recycled aggregate thermal insulation concrete based on GA-BP optimization network. J Eng Design Technol. (2021) 19:412–22. doi: 10.1108/JEDT-01-2020-0022
72. Guo XC, Ren ZQ, Wang QS, Cui CC. Prediction of Gas Emission by BP Neural Network Based On Wavelet Analysis. In: 2018 4th International Conference on Environmental Science and Material Application. (2019). p. 252. doi: 10.1088/1755-1315/252/5/052046
73. Li XF, Xiang SY, Zhu PF, Wu M. Establishing a dynamic self-adaptation learning algorithm of the BP neural network and its applications. Int J Bifurcation Chaos. (2015) 25:1540030. doi: 10.1142/S0218127415400301
74. Bunkley N. Joseph Juran, 103, pioneer in quality control, dies. New York Times. (2008) 3:50–55. Available online at: http://www.richardswanson.com/textbookresources/wp-content/uploads/2013/08/Ch-8-Joseph-Juran.pdf
75. Zhou J, Dai Y, Du K, Khandelwal M, Li CQ, Qiu YG. COSMA-RF: New intelligent model based on chaos optimized slime mould algorithm and random forest for estimating the peak cutting force of conical picks. Transp Geotech. (2022) 36:100806. doi: 10.1016/j.trgeo.2022.100806
76. Zhou J, Dai Y, Khandelwal M, Monjezi M, Yu Z, Qiu YG. Performance of hybrid SCA-RF and HHO-RF models for predicting backbreak in open-pit mine blasting operations. Nat Resour Res. (2021) 30:4753–71. doi: 10.1007/s11053-021-09929-y
77. Zhou J, Asteris PG, Armaghani DJ, Pham BT. Prediction of ground vibration induced by blasting operations through the use of the Bayesian Network and random forest models. Soil Dyn Earthquake Eng. (2020) 139:106390. doi: 10.1016/j.soildyn.2020.106390
78. Xie C, Nguyen H, Bui X-N, Nguyen V-T, Zhou J. Predicting roof displacement of roadways in underground coal mines using adaptive neuro-fuzzy inference system optimized by various physics-based optimization algorithms. J Rock Mech Geotech Eng. (2021) 13:1452–65. doi: 10.1016/j.jrmge.2021.07.005
79. Li C, Zhou J, Khandelwal M, Zhang X, Monjezi M, Qiu Y. Six novel hybrid extreme learning machine–swarm intelligence optimization (ELM–SIO) models for predicting backbreak in open-pit blasting. Nat Resour Res. (2022) 31:3017–39. doi: 10.1007/s11053-022-10082-3
80. Zhou J, Huang S, Tao M, Khandelwal M, Dai Y, Zhao M. Stability prediction of underground entry-type excavations based on particle swarm optimization and gradient boosting decision tree. Underground Space. (2022) 9:234–49. doi: 10.1016/j.undsp.2022.08.002
81. Koopialipoor M, Fahimifar A, Ghaleini EN, Momenzadeh M, Armaghani DJ. Development of a new hybrid ANN for solving a geotechnical problem related to tunnel boring machine performance. Eng Comput. (2020) 36:345–57. doi: 10.1007/s00366-019-00701-8
82. Paji MK, Gordan B, Biklaryan M, Armaghani DJ, Zhou J, Jamshidi M. Neuro-swarm and neuro-imperialism techniques to investigate the compressive strength of concrete constructed by freshwater and magnetic salty water. Measurement. (2021) 182:109720. doi: 10.1016/j.measurement.2021.109720
83. Yu Q, Monjezi M, Mohammed AS, Dehghani H, Armaghani DJ, Ulrikh DV. Optimized support vector machines combined with evolutionary random forest for prediction of back-break caused by blasting operation. Sustainability. (2021) 13:12797. doi: 10.3390/su132212797
84. Zhou J, Chen Y, Yong W. Performance evaluation of hybrid YYPO-RF, BWOA-RF and SMA-RF models to predict plastic zones around underground powerhouse caverns. Geomechan Geophys Geo-Energy Geo-Resour. (2022) 8:179. doi: 10.1007/s40948-022-00496-x
85. Chen Y, Yong W, Li C, Zhou J. Predicting the thickness of an excavation damaged zone around the roadway using the DA-RF hybrid model. In: CMES-Computer Modeling in Engineering & Sciences. (2023). doi: 10.32604/cmes.2023.025714
86. Wang SM, Zhou J, Li CQ, Armaghani DJ, Li XB, Mitri HS. Rockburst prediction in hard rock mines developing bagging and boosting tree-based ensemble techniques. J Central South Univ. (2021) 28:527–42. doi: 10.1007/s11771-021-4619-8
87. Zhou J, Huang S, Qiu Y. Optimization of random forest through the use of MVO, GWO and MFO in evaluating the stability of underground entry-type excavations. Tunnell Underground Space Technol. (2022) 124:104494. doi: 10.1016/j.tust.2022.104494
88. Zhou J, Huang S, Zhou T, Armaghani DJ, Qiu Y. Employing a genetic algorithm and gray wolf optimizer for optimizing RF models to evaluate soil liquefaction potential. Artif Intell Rev. (2022) 55:5673–705. doi: 10.1007/s10462-022-10140-5
89. Zhou J, Shen X, Qiu Y, Shi X, Khandelwal M. Cross-correlation stacking-based microseismic source location using three metaheuristic optimization algorithms. Tunnell Underground Space Technol. (2022) 126:104570. doi: 10.1016/j.tust.2022.104570
90. Despotovic M, Nedic V, Despotovic D, Cvetanovic S. Review and statistical analysis of different global solar radiation sunshine models. Renew Sustain Energy Rev. (2015) 52:1869–80. doi: 10.1016/j.rser.2015.08.035
91. Zhou J, Dai Y, Huang S, Armaghani DJ, Qiu YG. Proposing several hybrid SSA-machine learning techniques for estimating rock cuttability by conical pick with relieved cutting modes. Acta Geotech. (2022) 1–16. doi: 10.1007/s11440-022-01685-4
92. Indraratna B, Armaghani DJ, Correia AG, Hunt H, Ngo T. Prediction of resilient modulus of ballast under cyclic loading using machine learning techniques. Transp Geotech. (2023) 38:100895. doi: 10.1016/j.trgeo.2022.100895
Keywords: pillar stress, BP neural network, meta-heuristic algorithms, prediction model, optimization
Citation: Zhou J, Chen Y, Chen H, Khandelwal M, Monjezi M and Peng K (2023) Hybridizing five neural-metaheuristic paradigms to predict the pillar stress in bord and pillar method. Front. Public Health 11:1119580. doi: 10.3389/fpubh.2023.1119580
Received: 09 December 2022; Accepted: 03 January 2023;
Published: 24 January 2023.
Edited by:
Danial Jahed Armaghani, South Ural State University, RussiaReviewed by:
Tao Zhou, Shenzhen University, ChinaMingzheng Wang, Laurentian University, Canada
Panagiotis G. Asteris, School of Pedagogical & Technological Education, Greece
Copyright © 2023 Zhou, Chen, Chen, Khandelwal, Monjezi and Peng. This is an open-access article distributed under the terms of the Creative Commons Attribution License (CC BY). The use, distribution or reproduction in other forums is permitted, provided the original author(s) and the copyright owner(s) are credited and that the original publication in this journal is cited, in accordance with accepted academic practice. No use, distribution or reproduction is permitted which does not comply with these terms.
*Correspondence: Manoj Khandelwal,  bS5raGFuZGVsd2FsQGZlZGVyYXRpb24uZWR1LmF1; bWtoYW5kZWx3YWwxQGdtYWlsLmNvbQ==; Kang Peng, cGVuZ2thbmcyMDIwQGNzdS5lZHUuY24=