 Akito Takada1
 Sachiko Kodera1
 Koji Suzuki2
 Mio Nemoto3Ryusuke Egawa4,5Hiroyuki Takizawa5
 Akimasa Hirata1*
- 1Department of Electrical and Mechanical Engineering, Nagoya Institute of Technology, Nagoya, Japan
- 2Architecture, Design, Civil Engineering, and Industrial Management Engineering, Nagoya Institute of Technology, Nagoya, Japan
- 3Department of Environment Systems, Graduate School of Frontier Sciences, The University of Tokyo, Chiba, Japan
- 4School of Engineering, Tokyo Denki University, Tokyo, Japan
- 5Cyberscience Center, Tohoku University, Sendai, Japan
The number of patients with heat illness transported by ambulance has been gradually increasing due to global warming. In intense heat waves, it is crucial to accurately estimate the number of cases with heat illness for management of medical resources. Ambient temperature is an essential factor with respect to the number of patients with heat illness, although thermophysiological response is a more relevant factor with respect to causing symptoms. In this study, we computed daily maximum core temperature increase and daily total amount of sweating in a test subject using a large-scale, integrated computational method considering the time course of actual ambient conditions as input. The correlation between the number of transported people and their thermophysiological temperature is evaluated in addition to conventional ambient temperature. With the exception of one prefecture, which features a different Köppen climate classification, the number of transported people in the remaining prefectures, with a Köppen climate classification of Cfa, are well estimated using either ambient temperature or computed core temperature increase and daily amount of sweating. For estimation using ambient temperature, an additional two parameters were needed to obtain comparable accuracy. Even using ambient temperature, the number of transported people can be estimated if the parameters are carefully chosen. This finding is practically useful for the management of ambulance allocation on hot days as well as public enlightenment.
1. Introduction
Global warming is making heat waves more intensive, longer-lasting, and more common worldwide (1–3). The mortality and mobility of heat-related illness caused by heat waves have been extensively studied (4–7). To assess the impact of further global warming, different climate models have been proposed at the overall warming temperatures of 1.5°C, 2°C, and 3°C (8, 9). According to Song et al. (10), the risk factors for heat-related mortality are different at the global, intermediate, and local scales.
In aging societies, heat-related morbidity and mortality are expected to increase (11). Japan has the highest proportion of the elderly in the world (12). The yearly number of cases of heat-related illness transported by ambulance over the entirety of Japan, with its total population of 125 million, has been increasing gradually, from a range of 40,000 to 60,000 from 2010 to 2017 and then reaching a record high of 95,137 in 2018. Since then, it has remained high, at 60,000–70,000 (13). The number of cases registered with the use of an ambulance is closer to the actual number of cases than is the case in other countries, as ambulance transportation is free in Japan.
A positive correlation has been reported between ambient temperature and the number of heat illness patients (14–16). The surge of transported patients on hot summer days results in a greater ambulance use, causing temporary shortages. Thus, estimating the number of heat illness patients is essential for ambulance allocation management and dynamic systems operation on hot summer days (17).
Heat-related illnesses are broadly classified according to two symptoms, namely, dehydration and collapse of heat balance (18). The thermophysiological parameters for these are water loss and core temperature, respectively, although the two are related. The time course response of thermoregulation is significantly affected by age, lifestyle, and environment, making the epidemiology and pathology of heat stroke difficult to ascertain.
Several methods of estimating numbers of cases of heat-related illness have been proposed using analysis (19, 20) and machine learning taking weather data (21, 22). In Nishimura et al. (20), we demonstrated that estimation using regression models has comparable accuracy to that produced by a machine learning architecture. Our regression model identifies that the weather condition is associated with adverse heat illness events not only on the day of the event but also on preceding days (~3days). This is particularly obvious for non-external heat-related illness in the elderly. Thus, additional efforts are needed to identify external heat-related illness or estimate total number of patients. In particular, the association between population-level estimated core temperature and water loss with the number of transported people is worth evaluating in different regions.
In this study, we developed an estimation model for the number of heat illness patients in eight metropolitan prefectures in Japan. In particular, an integrated computational technique was used that took into account multiphysics and thermophysiology to derive the thermophysiological response of a standard test subject for different weather condition. Heat adaptation at different prefectures is also considered.
2. Methods
2.1. Data sources
Eight prefectures with different climatic conditions were selected for this study, as shown in Figure 1. The northernmost, Hokkaido, is at 43°03'51” N and 141°20'49” E, and the southernmost, Fukuoka, is located at 33°36'23” N and 130°25'05”E. The climates are classified as Df and Cfa within the Köppen scheme (23).
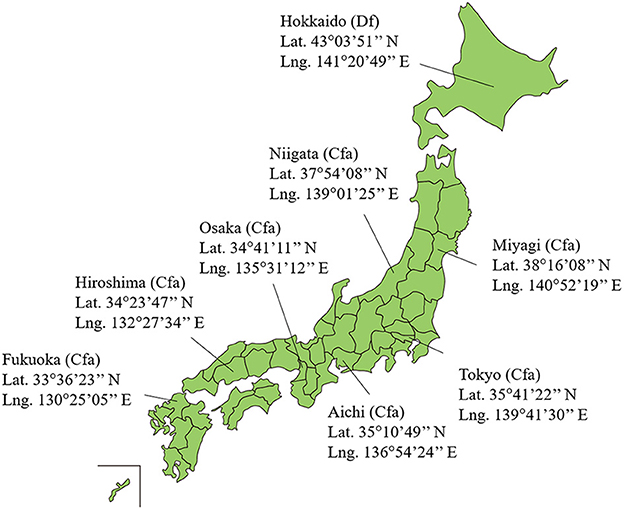
Figure 1. Location of eight prefectures in Japan selected for this study. Japan includes 47 prefectures. The Köppen climate classification in each prefecture are also presented.
Three datasets were utilized in this study. The first dataset includes the daily ambient temperature provided by Japan Meteorological Agency, Japan (24). The second describes the age composition of the population in each prefecture, as provided by Official Statistics of Japan (25).
The final dataset reports the number of people transported by ambulance owing to heat-related illnesses, provided by the Fire and Disaster Management Agency under the Ministry of Internal Affairs and Communications, Japan, between 2013 and 2019 (13). They provided the daily number of ambulance dispatches owing to heat-related illness in each prefecture from June to September annually. Data regarding the transported patients have been collected by prefectures by date and age categories (infant, child, adult, and elderly) since 2013, and the categories of occurrence location were added from 2017. The number of people transported via ambulance due to heat-related illness in Japan can be used as a surrogate marker because the number of transported people and that of the number of patients are correlated with each other (26). The dataset for the number of transportations from 2013 to 2016 that were not classified by occurrence location was substituted by dividing the total number by mean percentage transported from indoor locations/homes and outdoor locations/workplaces from 2017 to 2019.
Table 1 shows the daily average and maximum ambient temperatures per summer from June 1 to September 30 from 2013 to 2019, the average population and the population density from 2013 to 2019, and the average number of heat illness patients per million population per summer from June 1 to September 30 from 2013 to 2019 in each prefecture.
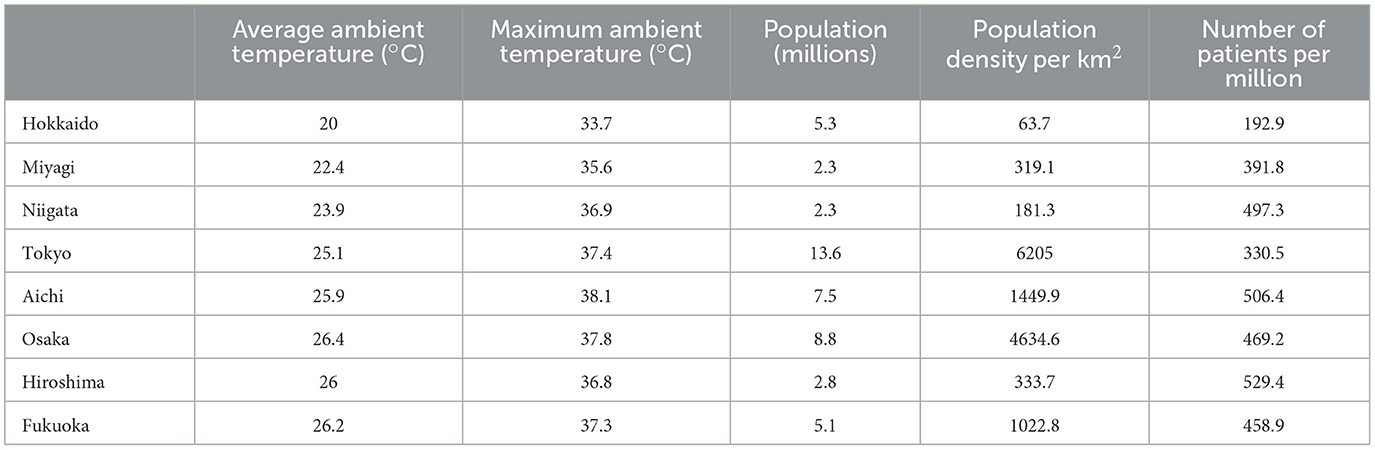
Table 1. Daily average and maximum ambient temperature per summer from June 1 to September 30, average population and population density, and average number of patients due to heat-related illness per million population per summer from June 1 to September 30, all data from 2013 to 2019.
Table 2 shows the percentage of heat illness patients transported from indoor/home and outdoor/workplace from 2017 to 2019. The variation in the ratio of the transported people from the indoor/home and outdoor/workplace over the 3 years showed a ≤ 8% variation. Unlike a definition of Fire and Disaster Management Agency, places that are not related to their homes were classified as outdoor considering the consistency of non-external heat-related illness in the elderly.
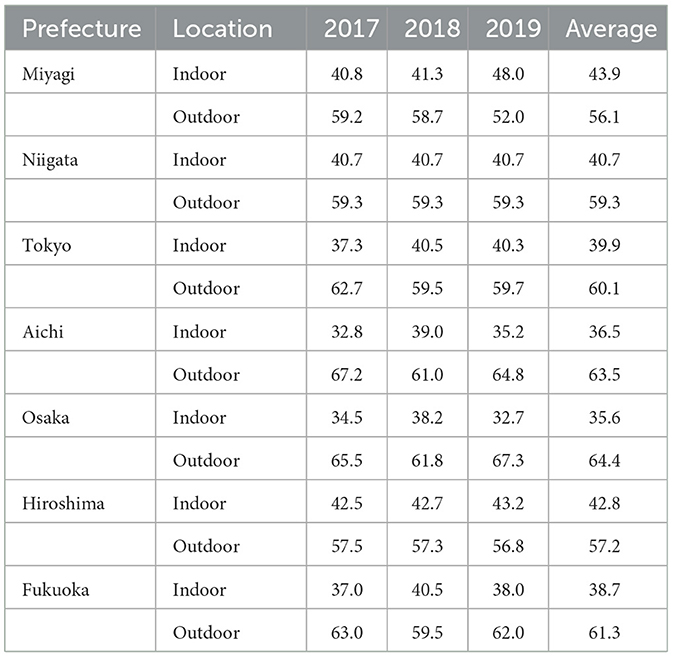
Table 2. Percentage of heat illness patients transported from indoor/home and outdoor/workplace from June 1 to September 30 from 2017 to 2019.
2.2. Equation for estimating number of transported patients owing to heat-related illness
In our previous studies (19, 20), we proposed an equation for estimating the number of transported people owing to heat-related illness. In particular, the classification of indoor/home and outdoor/workplace was considered in Nishimura et al. (20), which are approximately surrogate for non-exertional and exertional heat stroke. The number of transported people can be estimated as follows:
where yin and yout denote daily heat illness patients transported from indoor/home and outdoor/workplace, respectively. The variable xi denotes the input variable i days ago; x0 indicates the input variable for the predicted day. The parameters a, l, f , and g are fitting parameters. Three types of input variable were selected for daily average temperature, daily maximum body core temperature increase, and amount of sweating. Unlike Nishimura et al. (20), the daily maximum body core temperature increase and the amount of sweating were computed using our in-house computational code (Section 2.3).
The number of cases of heat illness with transportation from indoor locations [Equation (2)] is affected by the daily average temperature for three successive days; the weightings of x0, x1, and x2 were 0.6, 0.2, and 0.2, respectively (19), in addition to qualitative discussion in Williams et al. (27). The numbers of patients transported from outdoor [Equation (3)] are affected by the climate on the corresponding day (28). Parameter n denotes age category [five-year age intervals; n = 1 (20–24 years old), …,14 (85 years old and over)]; P(n) denotes the age composition of population in each prefecture. The function becn + d is the regression curve derived in Figure 4 in Kodera et al. (19) expressed the increase in the risk of heat-related illness with age; the parameters b (=0.171), c (=0.494), and d (=190.7) determined by the least-squares fitting method, based on the age components of heat illness patients in Japan.
Equation (4) represents the short-term heat adaption during the summer, i.e., the risk of heat-related illnesses k (coefficient of input variable xi) with a decrease from the beginning to the end of summer, affected by climate over the previous several tens of days (29, 30). J provides the number of weighting days, and parameter wi denotes weighted linear function. The input variables and optimal duration of J are evaluated in Section 3.2.
Fitting parameters a, l, f, and g were estimated to provide an expected number of cases of heat illness with transportation from indoor and outdoor locations, respectively. The parameters a and l were determined first, followed by f and g. All of the parameters were averaged over a 7-year time frame. Specifically, parameter fitting was iteratively conducted for convergence: 6 years of data (extracted over 7 years of data from 2013 to 2019) were used to determine the parameters, and then those for the remaining year were used through a leave-one-out cross-validation study (31). That is, data from 2013 to 2018 were used to determine the parameters for estimating the number of heat illness patients in 2019. Because the amount of sweating and the increase in body core temperature may be zero on days with a low heat load, we set l = −1 when these input variables were used, so that the number of transported patients converged to zero.
The estimation accuracy was evaluated in terms of the determination coefficient (R2) and mean absolute error (MAE). The F-test was carried out for Equations (2, 3) with each input variable: daily average temperature, daily maximum increase in core temperature, and amount of sweating. All statistical analysis were conducted using Python 3.9.7. The threshold for a statistical significance was set at p < 0.05 (see Section 4 in the Supplementary material).
2.3. Computation of core temperature and water loss due to sweating
Body core temperature increase and amount of sweating, which were derived by computation, were used as surrogates for estimating the daily number of transported people using the non-linear analysis, in addition to the daily average ambient temperature. Ambient temperature showed a good correlation with the mobility of heat-related illness (14–16). The increase in body core temperature and the amount of sweating were computed in the time domain using our in-house computational code, taking into account the time series of ambient temperature and relative humidity from 2013 to 2019 (see Figure S2) (24).
Our computation combines thermodynamics in biological tissues and thermoregulation, including vasodilatation and sweating due to increased body temperature. Our computational code is summarized in the Section 2 in Supplementary material. To accelerate the computation, the in-house computational code was vectorized and parallelized and subsequently implemented on an SX-Aurora TSUBASA system named AOBA (32). A detailed and validation of our in-house computational code was presented in our previous studies (33, 34).
3. Results
3.1. Computed body core temperature and sweating
Figure 2 shows the computed daily peak core temperature and daily amount of sweating for each prefecture in 2019. The thermophysiological response to ambient heat stress was significant in early August across Japan. In Hokkaido, body core temperature increase and sweating amount were low even in August. It should also be noted that the distributions of body core temperature increase and sweating resembled each other. Their correlation coefficient was more than 0.93 (p < 0.05) for each prefecture.
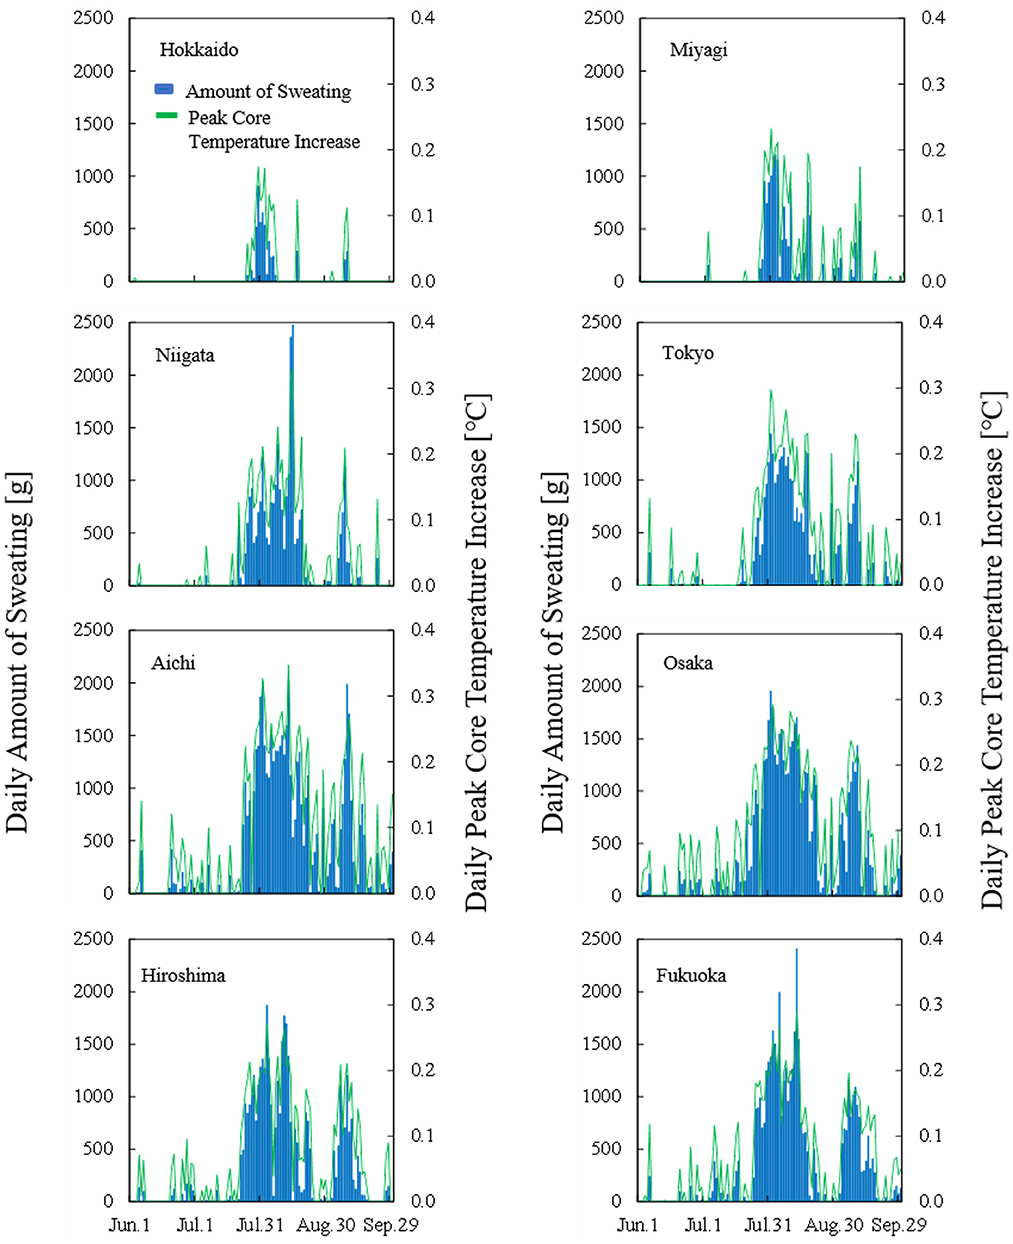
Figure 2. Time course of computed daily peak core temperature and total amount of sweating in each prefecture in 2019.
3.2. Duration of short-term heat adaptation
To clarify the duration that characterizes short-term heat adaptation, the correlation between observed and estimated numbers of patients transported from indoor/home and outdoor/workplace locations were evaluated in each prefecture for different input parameters. The evaluation period ran from June 1 to September 30 in 2013–2019. Figure 3 shows the coefficient of determination R2 averaged over the 7 years for the number of days over which an input variable is averaged, corresponding to J in Equation (4). The coefficients of determination of Hokkaido were lower than those of the remaining prefectures. The amount of sweating and core temperature increase were relatively small due to its milder climate. In the remainder of this report, our discussion focuses on the characteristics of the seven prefectures, excluding Hokkaido.
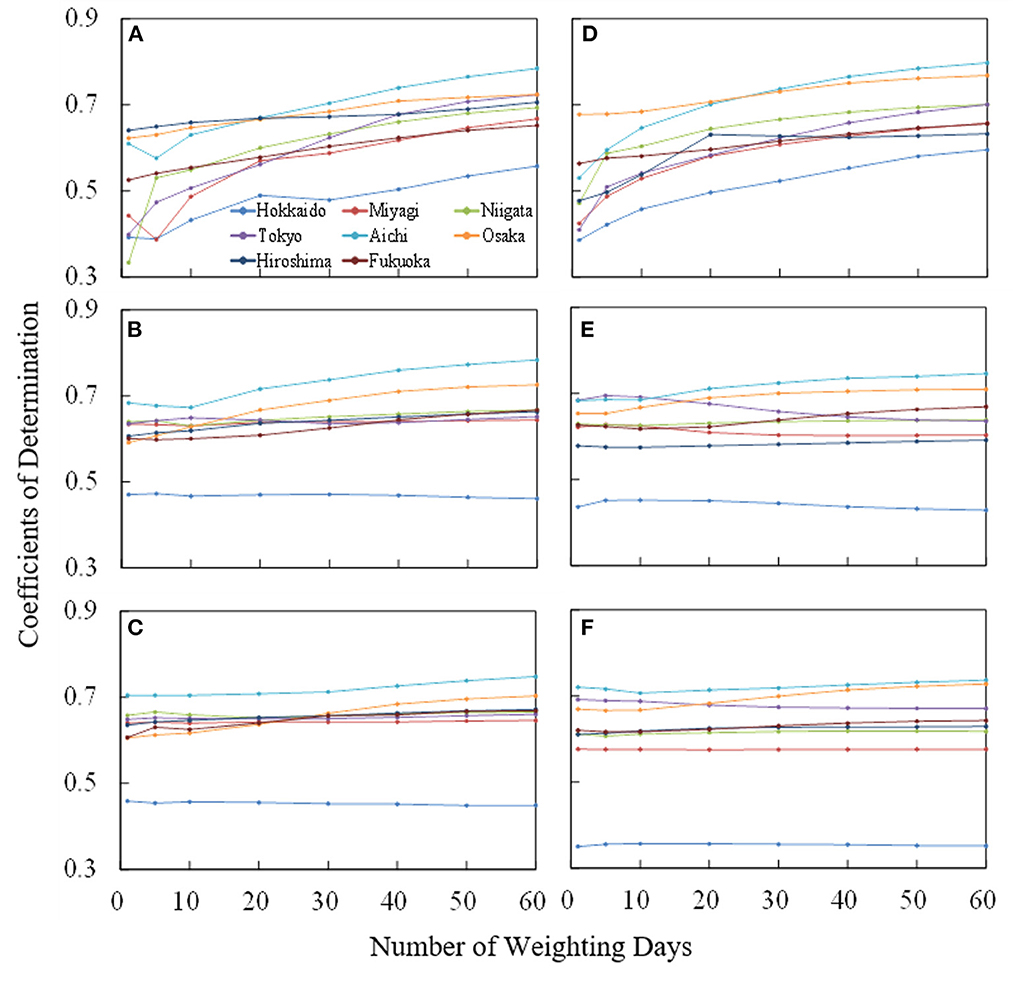
Figure 3. Variation of coefficient of determination averaged over 7 years (from June 1 to September 30 from 2013 to 2019) for the number of days over which an input variable is averaged, corresponding to J in Equation (4). For the number of patients transported the indoor locations, the (A) ambient temperature, (B) amount of sweating, and (C) body core temperature increase were considered. The same evaluation was conducted for patients transported from outdoor locations in (D–F).
For the average ambient temperature, R2 increases with increase of averaging days (J) and then reached a plateau. The value of R2 is high in Tokyo, Aichi, and Osaka, where the population density is large. Even for the remaining prefectures, high coefficients of determination were observed. R2 reached a plateau at 40 days and 30 days of weighted days for the patients from indoor/home and outdoor/workplace locations, respectively.
The R2 in terms of computed core temperature and sweating were less sensitive to the averaged days than those for average ambient temperature, regardless of whether patients were transported from indoor/home or outdoor/workplace locations. Estimation accuracy was improved only in Aichi, Osaka, Hiroshima, and Fukuoka, where average summer temperatures are higher than in the other prefectures studied (see Table 1).
The optimal parameters for the equation for estimating the number of patients transported from indoor and outdoor locations are listed in Table 3. Note that the number of parameters used for fitting was four for ambient temperature and two for the core temperature and amount of sweating. The validity of the equations using the parameters in Table 3 is shown in Section 4 of the Supplementary material.
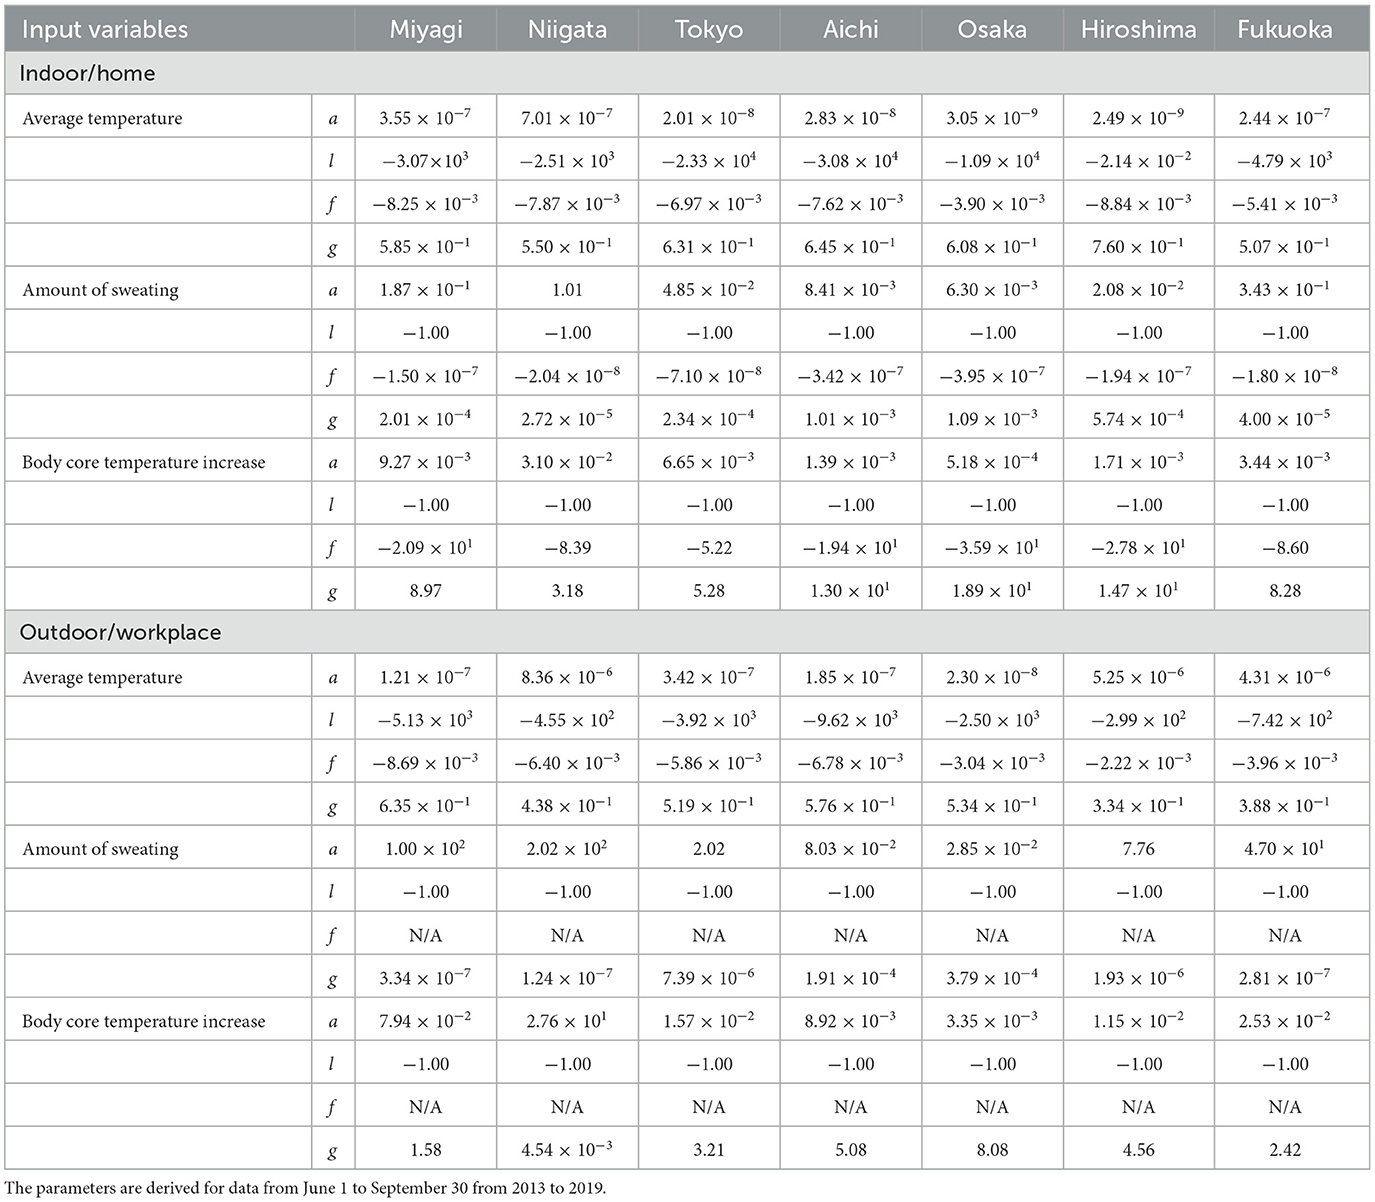
Table 3. The parameters in Equations (2–4) for estimating patients transported from indoor and outdoor locations for average ambient temperature, amount of sweating, and body core temperature increase.
3.3. Estimation of heat illness morbidity in seven prefectures
Figure 4 shows the observed and estimated numbers of daily patients, averaged over 7 years, for each prefecture. Moreover, the confidence interval region (95%) when estimating with daily amount of sweating is also presented. R2 and MAEs per million population are listed in Table 4. The coefficient of determination R2 exceeded 0.6 and was particularly high for Tokyo, Aichi, and Osaka. No significant difference was observed in R2 between input parameters. MAEs have a mild correlation with the number of patients per million population. Because more patients were transported from outdoor locations, MAEs from those locations were larger than those from indoor locations. As seen in Figure 4, the estimated number of transported people is lower than the actual value and the variation is large just after the end of the rainy season (around July 20) in each prefecture, but actual value is almost within the 95% confidence interval. The number of transported patients was overestimated around early July for the average ambient temperature, while from mid-August to mid-September, the amount of sweating and body core temperature increase.
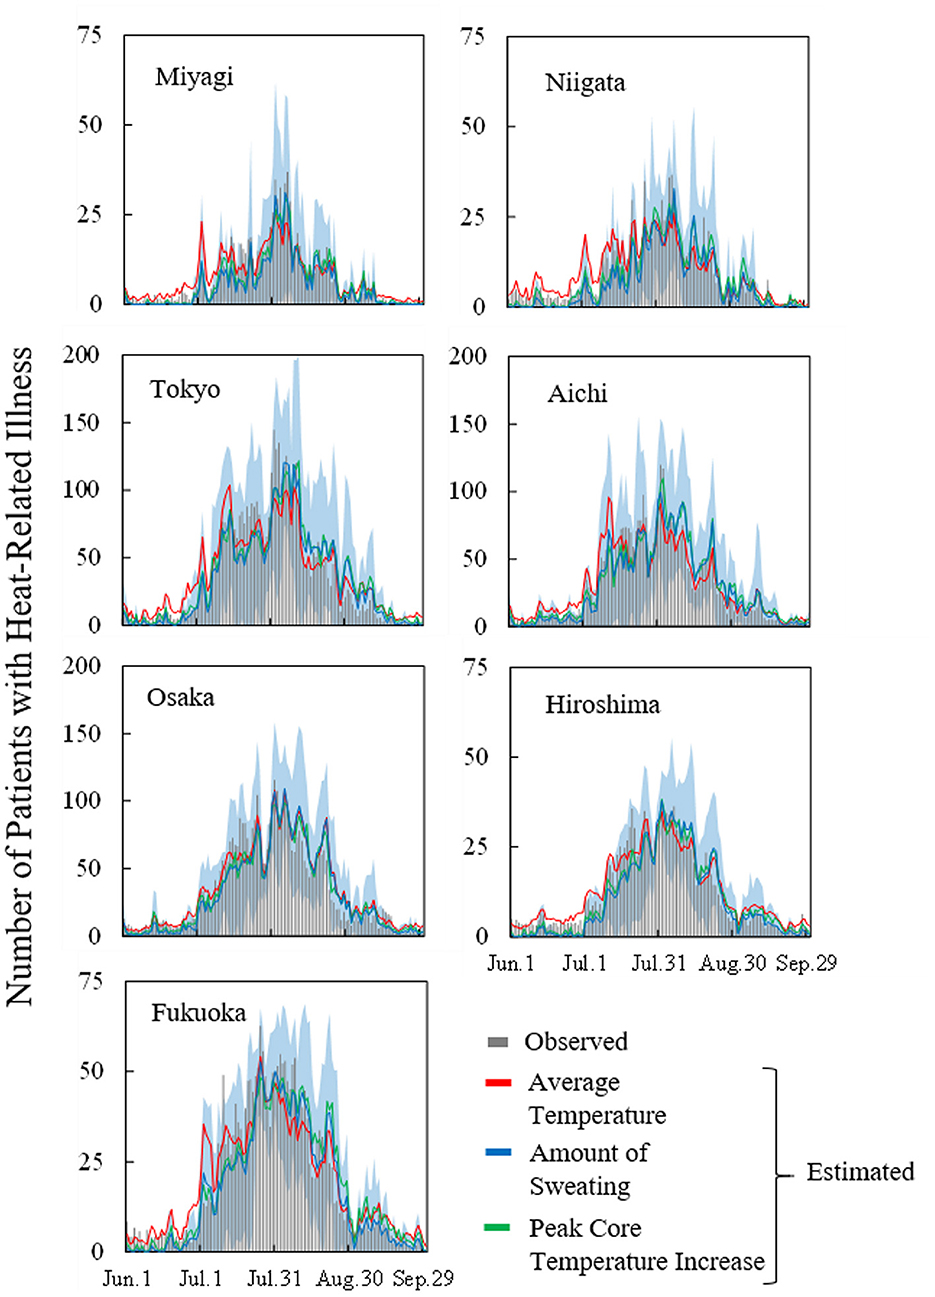
Figure 4. Observed and estimated number of patients with heat illness in seven prefectures (averaged over the period from 2013 to 2019) for average ambient temperature, amount of sweating, and body core temperature increase. Blue region represents the 95% confidence interval of estimation using computed daily amount of sweating.
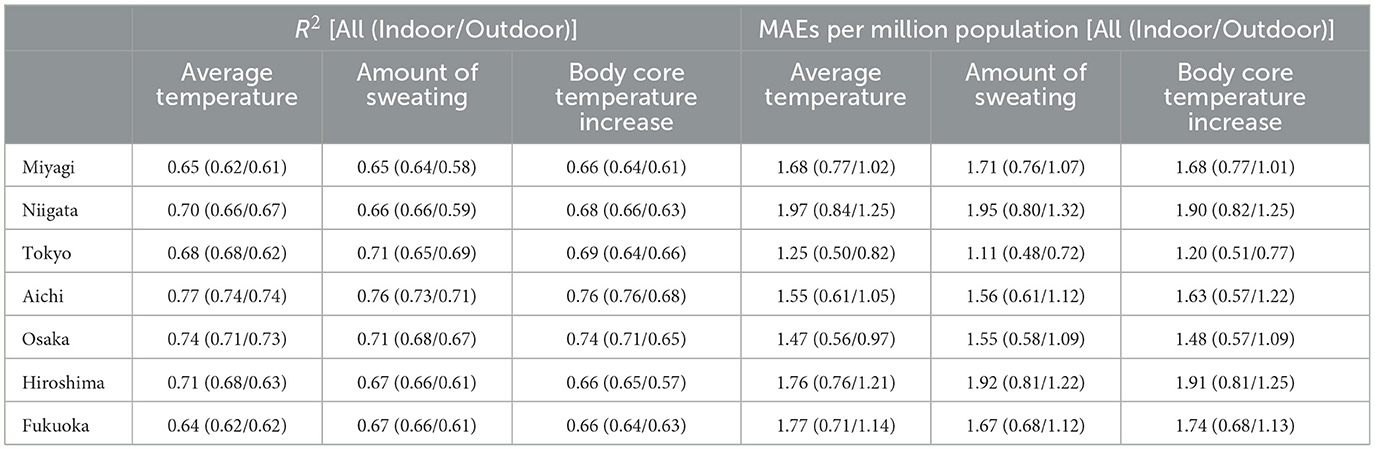
Table 4. Coefficient of determination R2 and MAEs per million population in seven prefectures (averaged over the period from 2013 to 2019).
To clarify the findings from Figures 4, 5 shows the time series of MAEs averaged over the period from 2013 to 2019 in Tokyo. MAEs were greatest from mid-July to mid-August, when the number of patients was highest. Differences in estimation accuracy were seen among the input variables, as shown by the trends identified in Figure 4. In July, the estimation accuracy was high for the computed core temperature and sweating, and in late August, the accuracy was high for ambient temperature.
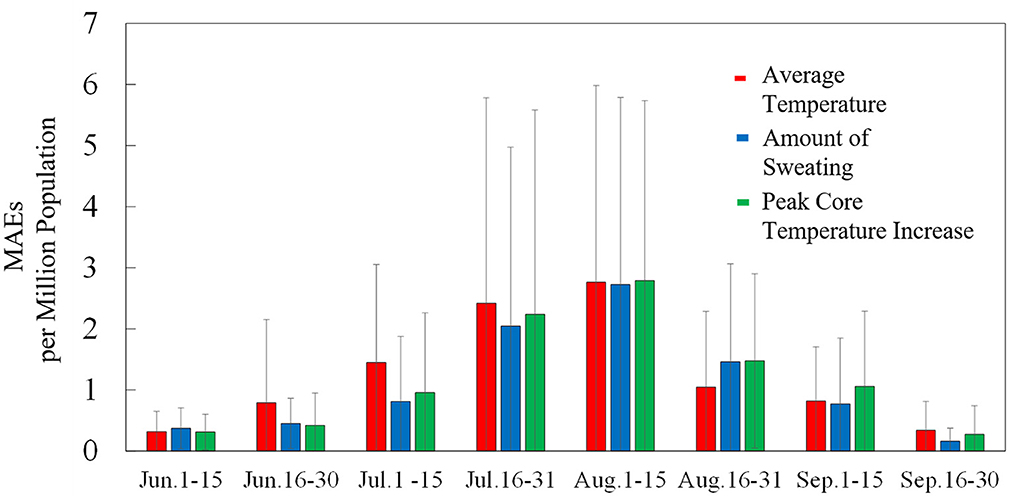
Figure 5. Time series of MAEs per million population in Tokyo for average ambient temperature, amount of sweating, and body core temperature increase (averaged over the period from 2013 to 2019). Standard deviations are indicated by error bars.
Ambulance allocation is crucial for days when the number of transported patients. To evaluate the effectiveness of the method of estimation for 3 months, we focus on accuracy where the ambient temperature is large. To calculate heat-related risk, wet-bulb global temperature (WBGT) (35) is often used, a value that takes into account humidity and solar radiation in addition to ambient temperature. In Tokyo, the daily average number of heat illness cases was 136 for WBGT ≥ 31°C. In Figure 6, we present a comparison of estimation accuracy among the input variables for WBGT ≥ 31°C. The criterion approximately corresponds to ≥10 transported patients per million population.
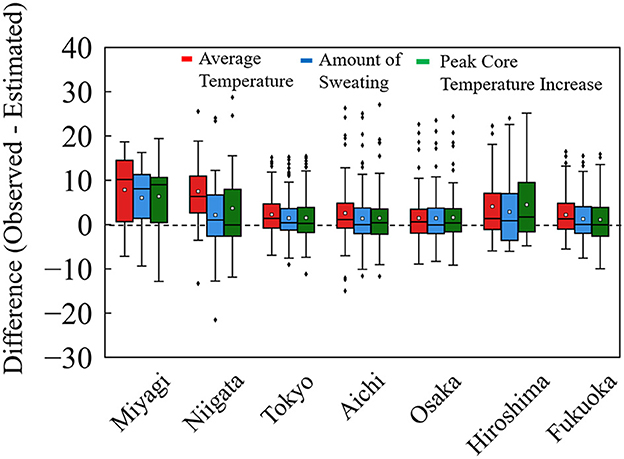
Figure 6. Difference from observed to estimated patients per million population in the days of WBGT ≥ 31°C. This approximately corresponds to a rate of transported patients per million population of ≥10 in seven prefectures from 2013 to 2019.
In Figure 6, comparable accuracy was observed for seven prefectures. The difference in MAE per million population, defined as observed value minus estimated value, was distributed on the negative side (overestimation) for computed core temperature and sweating, relative to that for average ambient temperature. Table 5 summarized the MAE per million population for the days of WBGT ≥ 31°C. From Table 5, for the amount of sweating and the increase in body core temperature, the values of MAE were marginally small, suggesting a better agreement for estimated and observed values for hot days with larger numbers of transported patients.
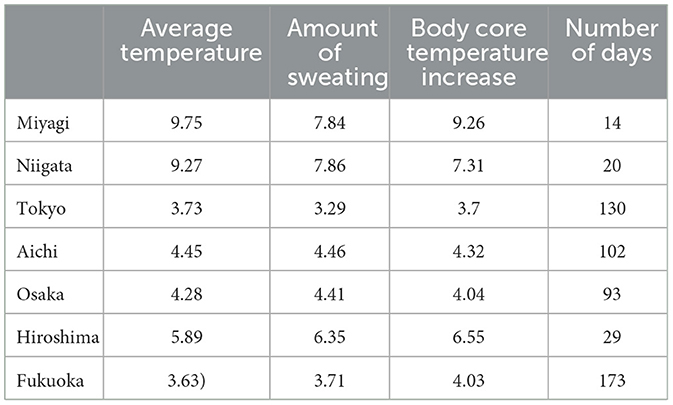
Table 5. Average MAEs per million population and number of days with WBGT ≥ 31°C for seven prefectures in Figure 6.
4. Discussion
In this study, core temperature and sweating were computed to estimate the morbidity of heat illness patients for different prefectures of Japan. Eight prefectures were used that range from humid continental to subtropical climates (see Figure 1) (23).
In our analysis, Hokkaido, which belongs to Df in the Köppen climate classification scheme, was not well correlated with any input parameters because in that prefecture, body core temperature increase and sweating were low, even in August (see Figure 2). In other words, the number of hot days was limited, and thus, heat acclimatization is different or non-existent. One potential reason for this is that Hokkaido has a mild climate with only occasional heat waves. Thus, estimations covering very mild and extreme hot temperatures have less accuracy than those in the remaining prefectures. We then excluded Hokkaido for the remainder of the analysis.
As seen in Figure 2, the difference in daily peak core temperature and daily sweating amount were similar due to the daily course of ambient conditions. For the remaining seven prefectures, we derived parameters to estimate transported people in terms of Equations (2–4) with the parameters listed in Table 3. Note that the additional two parameters (f and l) were needed to obtain comparable accuracy in estimation of ambient temperatures to that shown in the sweating and core temperature.
As shown in Figure 3, the R2 reached plateau at 40 days and 30 days of weighted days for patients from indoor and outdoor locations, respectively. This takes into account the human acclimatization to heat in the environment for a certain period (a few weeks). The R2 values for computed core temperature and sweating were less sensitive to averaging days than that for average ambient temperature, regardless of whether patients were transported from indoor or outdoor locations. The R2 values for patients transported from outside is high even at 1 day (without averaging) or at least higher than the R2 for indoor patients with weighted average of < 20 days. This suggests that the effects of heat adaptation are not crucial for outdoor patients (especially for workers). This hypothesis indicates that heat acclimatization is not crucial for outdoor patients in reality, rather adjustments to behavior, such as changing clothing with changes in the season. For the indoor patients, some heat accumulation was observed for < 3 weeks. The numbers of patients transported from indoor and outdoor locations in Nagoya, Japan, were correlated with ambient temperature averaged over 50 and 20 days, respectively, in our previous study (20). The values obtained here are comparable to those data, from one city and one input variable.
Let us review heat accumulation further. Most previous studies investigated short-term adaptation via exercise (36–38). In Nakamura et al. (29), heat accumulation in daily life was investigated in a single region of Japan with a sample of five individuals, and it was found that 10 days were needed for intermittent heat exposure and 48 days for more continuous head adaptation. By contrast, this is a population-level study, and some difference can be observed (39, 40).
Smaller numbers of parameters were needed to estimate the numbers of transported people in terms of the computed thermophysiological responses, and these estimations provided better accuracy. An additional two parameters (f and l) were used in the estimation with ambient temperature, corresponding to heat accumulation (f) and additional tuning for accuracy compensation (l). Note that no physiological rationale exists for parameter (l) or a variable for different prefectures.
The estimated numbers of heat illness patients are in good agreement with observed values in seven prefectures. The proposed equations are applicable to different prefectures once weather, thermophysiological data, population, and age are incorporated. However, the estimation accuracy was variable for different seasons, as shown in Figure 5. In particular, the estimated numbers of people were smaller than the observed values following the rainy season, as shown in Figure 4. On those hot days, estimations with thermophysiological responses provided better accuracy (Figure 6).
The proposed equations have been used more than 20 times in the TV programs in Japan for public awareness. Fire departments in Nagoya City (Aichi prefectures) have introduced this system, sharing information with hospitals. The expected number of people transported owing to heat-related illness by using the proposed equations considering long-term temperature changes and the aging of the population in each region could be useful as a manner for future emergency systems. However, this system is tentatively suspended in COVID-19 epidemic.
This study was limited by the small number of extreme hot days included in the development of equations. Specifically, in 2018, the maximum ambient temperature was recorded in some prefectures. However, the estimation obtained on such days is an extrapolation, and thus accuracy is not warranted. Intense heat waves are expected to continue in the future, and thus the formula and parameters should also be revisited in the future.
Data availability statement
Publicly available datasets were analyzed in this study. The details can be found in the article/Supplementary material.
Author contributions
Conceptualization: AH, RE, MN, and SK. Methodology and formal analysis: AH, SK, and MN. Investigation and data curation: SK and AT. Resources and writing—review and editing: RE and HT. Writing original draft preparation: AT, SK, and AH. Project administration: AH, KS, and HT. All authors contributed to the article and approved the submitted version.
Funding
This work is supported by the Joint Usage/Research Center for Interdisciplinary Large-scale Information Infrastructures and High Performance Computing Infrastructure in Japan (Project ID: jh220043).
Conflict of interest
The authors declare that the research was conducted in the absence of any commercial or financial relationships that could be construed as a potential conflict of interest.
Publisher's note
All claims expressed in this article are solely those of the authors and do not necessarily represent those of their affiliated organizations, or those of the publisher, the editors and the reviewers. Any product that may be evaluated in this article, or claim that may be made by its manufacturer, is not guaranteed or endorsed by the publisher.
Supplementary material
The Supplementary Material for this article can be found online at: https://www.frontiersin.org/articles/10.3389/fpubh.2023.1061135/full#supplementary-material
References
1. Fischer EM, Schär C. Future changes in daily summer temperature variability: driving processes and role for temperature extremes. Clim Dyn. (2008) 33:917. doi: 10.1007/s00382-008-0473-8
2. Oudin Åström D, Bertil F, Joacim R. Heat wave impact on morbidity and mortality in the elderly population: a review of recent studies. Maturitas. (2011) 69:99–105. doi: 10.1016/j.maturitas.2011.03.008
3. Seneviratne S, Nicholls N, Easterling D, Goodess C, Kanae S, Kossin J, et al. Changes in climate extremes and their impacts on the natural physical environment. In:Field C, Barros V, Stocker T, Dahe Q, , editors. Managing the Risks of Extreme Events and Disasters to Advance Climate Change Adaptation: Special Report of the Intergovernmental Panel on Climate Change. Cambridge: Cambridge University Press (2012). p. 109–230. doi: 10.1017/CBO9781139177245.006
4. Robine JM, Cheung SLK, Le Roy S, Van Oyen H, Griffiths C, Michel JP, et al. Death toll exceeded 70,000 in Europe during the summer of 2003. Comptes Rendus Biol. (2008) 331:171–8. doi: 10.1016/j.crvi.2007.12.001
5. Wilson LA, Gerard Morgan G, Hanigan IC, Johnston FH, Abu-Rayya H, Broome R, et al. The impact of heat on mortality and morbidity in the greater metropolitan sydney region: a case crossover analysis. Environ Heal A Glob Access Sci Source. (2013) 12:98. doi: 10.1186/1476-069X-12-98
6. Sheridan SC, Lin S. Assessing variability in the impacts of heat on health outcomes in new york city over time, season, and heat-wave duration. Ecohealth. (2014) 11:512–25. doi: 10.1007/s10393-014-0970-7
7. Borchers Arriagada N, Bowman DMJS, Palmer AJ, Johnston FH. Climate Change, Wildfires, Heatwaves and Health Impacts in Australia in Extreme Weather Events and Human Health: International Case Studies. Berlin: Springer International Publishing (2019), 99–116.
8. Brient F, Bony S. Interpretation of the positive low-cloud feedback predicted by a climate model under global warming. Clim Dyn. (2013) 40:2415–31. doi: 10.1007/s00382-011-1279-7
9. Marx A, Kumar R, Thober S, Rakovec O, Wanders N, Zink M, et al. Climate change alters low flows in Europe under global warming of 1.5, 2. and 3°C. Hydrol Earth Syst Sci. (2018) 22:1017–32. doi: 10.5194/hess-22-1017-2018
10. Song J, Yu H, Lu Y. Spatial-scale dependent risk factors of heat-related mortality: a multiscale geographically weighted regression analysis. Sustain Cities Soc. (2021) 74:103159. doi: 10.1016/j.scs.2021.103159
11. World Health Organization. Decade of Healthy Ageing: Baseline Report. World Health Organization (2020). Available online at: https://apps.who.int/iris/bitstream/handle/10665/338677/9789240017900-eng.pdf
12. Muramatsu N, Akiyama H. Japan: super-aging society preparing for the future. Gerontologist. (2011) 51:425–32. doi: 10.1093/geront/gnr067
13. Fire Disaster Management Agency. Number of Heat Stroke Patients (in Japanese). Fire and Disaster Management Agency (2022). Available online at: http://www.fdma.go.jp/neuter/topics/fieldList9_2.html (accessed October 4, 2022).
14. Bassil KL, Cole DC, Moineddin R, Lou W, Craig AM, Schwartz B, et al. The relationship between temperature and ambulance response calls for heat-related illness in Toronto, Ontario, 2005. J Epidemiol Community Health. (2011) 65:829–31. doi: 10.1136/jech.2009.101485
15. Kotani K, Ueda K, Seposo X, Yasukochi S, Matsumoto H, Ono M, et al. Effects of high ambient temperature on ambulance dispatches in different age groups in Fukuoka, Japan. Glob Health Action. (2018) 11:882. doi: 10.1080/16549716.2018.1437882
16. Sangkharat K, Mahmood MA, Thornes JE, Fisher PA, Pope FD. Impact of extreme temperatures on ambulance dispatches in London, UK. Environ Res. (2020) 182:109100. doi: 10.1016/j.envres.2019.109100
17. Zhou Z, Matteson DS. Predicting ambulance demand: A spatio-temporal kernel approach. In: Proceedings of the ACM SIGKDD International Conference on Knowledge Discovery and Data Mining. New York, NY: Association for Computing Machinery (2015), 2297–2303.
19. Kodera S, Nishimura T, Rashed EA, Hasegawa K, Takeuchi I, Egawa R, et al. Estimation of heat-related morbidity from weather data: a computational study in three prefectures of Japan over 2013–2018. Environ. Int. (2019) 130:104907. doi: 10.1016/j.envint.2019.104907
20. Nishimura T, Rashed EA, Kodera S, Shirakami H, Kawaguchi R, Watanabe K, et al. Social implementation and intervention with estimated morbidity of heat-related illnesses from weather data: a case study from Nagoya City, Japan. Sustain Cities Soc. (2021) 74:103203. doi: 10.1016/j.scs.2021.103203
21. Wang Y, Song Q, Du Y, Wang J, Zhou J, Du Z, et al. A random forest model to predict heatstroke occurrence for heatwave in China. Sci Total Environ. (2019) 650:3048–53. doi: 10.1016/j.scitotenv.2018.09.369
22. Ogata S, Takegami M, Ozaki T, Nakashima T, Onozuka D, Murata S, et al. Heatstroke predictions by machine learning, weather information, and an all-population registry for 12-hour heatstroke alerts. Nat Commun. (2021) 121:1–11. doi: 10.1038/s41467-021-24823-0
23. Peel MC, Finlayson B, McMahon TA. Updated world map of the Köppen-Geiger climate classification. Hydrol Earth Syst Sci. (2007) 11:1633–44. doi: 10.5194/hess-11-1633-2007
24. Japan Meteorological Agency. Weather Database (in Japanese). (2022). Available online at: http://www.fdma.go.jp/neuter/topics/fieldList9_2.html (accessed October 1, 2022).
25. Portal Site of Official Statistics of Japan (e-Stat). Available online at: https://www.e-stat.go.jp/en (accessed October 1, 2022).
26. Shimazaki J, Hifumi T, Shimizu K, Oda Y, Kanda J, Kondo Y, et al. Clinical characteristics, prognostic factors, and outcomes of heat-related illness (Heatstroke Study 2017–2018). Acute Med Surg. (2020) 7:1–9. doi: 10.1002/ams2.516
27. Williams S, Nitschke M, Weinstein P, Pisaniello DL, Parton KA, Bi P, et al. The impact of summer temperatures and heatwaves on mortality and morbidity in Perth, Australia 1994–2008. Environ Int. (2012) 40:33–8. doi: 10.1016/j.envint.2011.11.011
28. Medicine. Heat related illness in Japan: the final report of Heatstroke STUDY 2012 (in Japanese). J Japanese Assoc Acute Med. (2014) 25:846–62.
29. Nakamura Y, Okamoto T, Yasunari Y. Understanding the actual states of adaptation to heat arising in daily life based on experiments in a climate chamber. Trans AIJ J Environ Eng. (2009) 74:115–24. doi: 10.3130/aije.74.115
30. Brown HA, Topham TH, Clark B, Smallcombe JW, Flouris AD, Ioannou LG, et al. Seasonal heat acclimatisation in healthy adults: a systematic review. Sport Med. (2022) 52:2111–28. doi: 10.1007/s40279-022-01677-0
31. Berrar D. Cross-validation. Encycl Bioinforma Comput Biol ABC Bioinforma. (2019) 1:542–5. doi: 10.1016/B978-0-12-809633-8.20349-X
32. Egawa R, Fujimoto S, Yamashita T, Sasaki D, Isobe Y, Shimomura Y, et al. Exploiting the Potentials of the Second Generation SX-Aurora TSUBASA. in 2020 IEEE/ACM Performance Modeling, Benchmarking and Simulation of High Performance Computer Systems (PMBS). GA: IEEE (2020), 39–49. doi: 10.1109/PMBS51919.2020.00010
33. Kojima K, Hirata A, Hasegawa K, Kodera S, Laakso I, Sasaki D, et al. Risk management of heatstroke based on fast computation of temperature and water loss using weather data for exposure to ambient heat and solar radiation. IEEE Access. (2018) 6:3774–85. doi: 10.1109/ACCESS.2018.2791962
34. Kamiya T, Kodera S, Hasegawa K, Egawa R, Sasaki H, Hirata A, et al. Different thermoregulatory responses of people from tropical and temperate zones: a computational study. Build Environ. (2019) 159:106152. doi: 10.1016/j.buildenv.2019.05.030
35. Budd GMM. Wet-bulb globe temperature (WBGT)—its history and its limitations. J Sci Med Sport. (2008) 11:20–32. doi: 10.1016/j.jsams.2007.07.003
36. Pandolf KB. Time course of heat acclimation and its decay. Int J Sports Med. (1998) 19:S157–60. doi: 10.1055/s-2007-971985
37. Garrett AT, Goosens NG, Rehrer NG, Patterson MJ, Cotter JD. Induction and decay of short-term heat acclimation. Eur J Appl Physiol. (2009) 107:659. doi: 10.1007/s00421-009-1182-7
38. Périard JD, Racinais S, Sawka MN. Adaptations and mechanisms of human heat acclimation: applications for competitive athletes and sports. Scand J Med Sci Sports. (2015) 25:20–38. doi: 10.1111/sms.12408
39. Taniguchi Y, Sugenoya J, Nishimura N, Iwase S, Matsumoto T, Shimizu Y, et al. Contribution of central versus sweat gland mechanisms to the seasonal change of sweating function in young sedentary males and females. Int J Biometeorol. (2011) 55:203–12. doi: 10.1007/s00484-010-0325-1
Keywords: ambient heat, ambulance dispatch, heat adaptation, heat illness, global warming
Citation: Takada A, Kodera S, Suzuki K, Nemoto M, Egawa R, Takizawa H and Hirata A (2023) Estimation of the number of heat illness patients in eight metropolitan prefectures of Japan: Correlation with ambient temperature and computed thermophysiological responses. Front. Public Health 11:1061135. doi: 10.3389/fpubh.2023.1061135
Received: 04 October 2022; Accepted: 31 January 2023;
Published: 17 February 2023.
Edited by:
Ruoyu Wang, University of Edinburgh, United KingdomReviewed by:
Sumona Mondal, Clarkson University, United StatesGuowen Song, Iowa State University, United States
Copyright © 2023 Takada, Kodera, Suzuki, Nemoto, Egawa, Takizawa and Hirata. This is an open-access article distributed under the terms of the Creative Commons Attribution License (CC BY). The use, distribution or reproduction in other forums is permitted, provided the original author(s) and the copyright owner(s) are credited and that the original publication in this journal is cited, in accordance with accepted academic practice. No use, distribution or reproduction is permitted which does not comply with these terms.
*Correspondence: Akimasa Hirata,  YWhpcmF0YUBuaXRlY2guYWMuanA=