- Department of Biology, McMaster University, Hamilton, ON, Canada
Aspergillus fumigatus is a common environmental mold and a major cause of opportunistic infections in humans. It's distributed among many ecological niches across the globe. A major virulence factor of A. fumigatus is its ability to grow at high temperature. However, at present, little is known about variations among strains in their growth at different temperatures and how their geographic origins may impact such variations. In this study, we analyzed 89 strains from 12 countries (Cameroon, Canada, China, Costa Rica, France, India, Iceland, Ireland, New Zealand, Peru, Saudi Arabia, and USA) representing diverse geographic locations and temperature environments. Each strain was grown at four temperatures and genotyped at nine microsatellite loci. Our analyses revealed a range of growth profiles, with significant variations among strains within individual geographic populations in their growths across the temperatures. No statistically significant association was observed between strain genotypes and their thermal growth profiles. Similarly geographic separation contributed little to differences in thermal adaptations among strains and populations. The combined analyses among genotypes and growth rates at different temperatures in the global sample suggest that most natural populations of A. fumigatus are capable of rapid adaptation to temperature changes. We discuss the implications of our results to the evolution and epidemiology of A. fumigatus under increasing climate change.
1. Introduction
Among the vast diversity of biotic and abiotic factors that can impact the evolution of organisms, temperature has undoubtedly captured more than its share of attention. Biologists have linked variations in temperature to everything from temporal patterns of growth, survival, and reproduction of individual organisms to broad spatial patterns of population density and species distributions across a range of geographic scales. These studies have shown that the same change in temperature often affect different organisms differently. Even for the same organism, temperature does not affect all life stages equally. However, most thermal adaptation studies so far have focused on plants and animals. Relatively little is known about how temperature impact the spatial and temporal distributions of microbial populations, including populations of human fungal pathogens. With increasing climate change and global warming, there is a pressing need to understand the thermal adaptation of these organisms in order to better prepare for potential future epidemics and pandemics (1).
The ascomycete mold Aspergillus fumigatus is among the most common opportunistic human pathogens (1, 2). It's ubiquitously distributed in a diversity of ecological niches such as air, water, compost, and soil across the globe. A. fumigatus can cause a broad spectrum of opportunistic infections collectively termed aspergillosis that affects approximately 8 million individuals worldwide (3). Among aspergillosis infections, invasive aspergillosis is the most severe, responsible for ~250,000 deaths worldwide each year (1–3). At risk-populations include immunocompromised patients such as patients receiving immunosuppressive drugs due to haematopoietic stem cell or solid organ transplants, patients with severe neutropenia, and as co-infections in patients with coronavirus disease 2019 (COVID-19) (2, 4). Different from other human fungal pathogens, A. fumigatus can grow at temperatures above 50°C (3). However, the selective forces and genetic mechanisms govern its high thermotolerance remains largely unknown.
Population genetic surveys have shown that the global population of A. fumigatus consists of at least three distinct clades and multiple genetic clusters (5–7). These genetic clusters were likely historically differentiated from each other due to geographic separations. However, evidence for gene flow and clonal dispersal have been found across countries and continents, resulting in most regional geographic populations containing strains of different clades and different genetic clusters (5, 8–10). Some of these dispersals were most likely driven by contemporary anthropogenic activities, including human travel and commercial trade (8, 10). In addition, agricultural fungicides are creating significant selective pressure where drug-resistant strains are rapidly spreading (11). The identification of successful recent migrants across broad geographic scales and ecological niches with different temperature spectra suggests that there might be little or no variation in thermal adaptation among strains of A. fumigatus. Alternatively, the individual genomes of A. fumigatus may have high adaptive potential and/or that immigrants may be readily recombining with local strains to acquire a thermal response profile adapted to local environments. At present, little is known about the geographic and ecological patterns of thermal adaptation of A. fumigatus populations.
With the effects of climate change in a diversity of areas being increasingly felt, an important question to consider is how climate change may affect natural A. fumigatus populations in different areas around the world. With increasing temperatures, potentially more thermotolerant strains will likely emerge and that A. fumigatus may further expand to colder regions. Indeed, global warming is the major suspected cause of the newly emerged and highly antifungal resistant pathogen Candida auris that has already caused many outbreaks across the world (12–14). The emergence of C. auris occurred simultaneously across multiple continents and is hypothesized to be the first documented occurrence of a pathogen emerging due to global warming (15, 16).
In this study, we aim to characterize the variations among strains in their growths at different temperatures and investigate how their geographic origins and genetic relationships may impact such variations. To achieve the goals, we selected strains that originated from 12 countries. The phenotypic plasticity of these strains to temperature, which we termed as strain thermal adaptation, was measured via growth in liquid media at four incubation temperatures. Elucidating the impact of temperature on strain growth variation will provide insights on how A. fumigatus may adapt to global climate change. Such knowledge should help us develop better understanding of A. fumigatus epidemiology and minimize the disease burden on humans.
2. Methodology
2.1. Geographic populations of A. fumigatus
In total, 89 A. fumigatus strains were analyzed in this study. These strains were obtained from a variety of ecological niches and geographic locations (Table 1). They were selected from our strain collections to represent different mating types, antifungal susceptibilities, and ecological and geographic origins. Among the 89 strains, 77 were isolated from soil samples collected from 11 countries: Cameroon (11 strains), Canada [Northwest Territories (NWT) (3 strains) and Hamilton, Ontario (11 strains)], China (10 strains), Costa Rica (6 strains), France (3 strains), India (4 strains), Iceland (3 strains), Ireland (1 strains), New Zealand (11 strains), Peru (3 strains), and Saudi Arabia (11 strains). Environmental strains from Cameroon, Canada, China, Costa Rica, France, Iceland, New Zealand, Peru and Saudi Arabia have been described in previous studies (5, 8, 10). Environmental strains from soil samples were isolated following the procedures described in Samarasinghe et al. (17). The remaining 12 strains were from patients in Hamilton, Ontario (5 strains), New Delhi, India (6 strains), and the US (1 strain) (18, 19). Two strains, one from Ireland (environmental) and the other from US (clinical), represented two super-maters of this species and they were included in our study (20). For additional strain information, please refer to Supplementary Table S1.
2.2. Experimental conditions
To identify variations in growth among A. fumigatus strains at different temperatures, strains were grown at the following five temperatures in triplicates per temperature, 4°C, 15°C, 22°C, 35°C, and 41°C. For each strain, an inoculum was created and used to assess growth at all temperatures. To prepare the inoculum, A. fumigatus strains were cultured on malt extract agar (MEA) for 2–3 days at 37°C. Conidia were then harvested by dispensing 1 ml of a sterile 0.85% saline solution onto the culture and aspirating the conidial suspension to a sterile 1.5 ml tube. Conidial density was measured using a Countess® II FL automated cell counter and adjusted to 1 × 10⁸ conidia/ml in saline. Conidial suspensions were diluted in RPMI 1,640 to a concentration of 1 × 10⁶ conidia/ml. In total 200 μL of this suspension was then aliquoted in triplicates into a 96 well microtiter plate for each temperature. Relative growth was estimated using the optical density (OD) values at 600 nm absorbance using the Biotek Epoch™ 2 Microplate Spectrophotometer. Growth measurements were taken at four time points: immediately after inoculation, and 24 h, 48 h, and 72 h post inoculation. For each 96-well microtiter plate, three wells with medium but without any fungal culture were used as negative controls.
2.3. Strain genotyping and geographic climate data
Each A. fumigatus strain was genotyped at nine highly polymorphic short tandem repeat (STR) loci (also called microsatellite loci) and at the mating type (MAT) locus. Strain genotyping at the nine STR loci followed the protocol described by De Valk et al. (21). The mating type of each strain was identified following the protocol described by Paoletti et al. (22).
Atmospheric temperature profiles of the geographical locations where individual strains were isolated were obtained using the website Weatherbase (weatherbase.com). Specifically, the closest city to the sampling site with recorded data was used as a proxy of the temperature at each location. The average temperature, highest and lowest monthly average temperature across all months of a year, and the temperature range between the highest and lowest monthly average temperatures were collected.
2.4. Statistical analysis
The growth of each strain under each temperature condition was obtained at three time points. To identity differences in growth between strains and populations, pairwise t-tests were conducted. Post hoc corrections followed the Holm method. No growth was observed for any strain at 4°C. Thus, our analyses of growths were conducted on data at the remaining four temperatures 15°C, 22°C, 35°C, and 41°C. All analyses were conducted in R version 4.2.1 (23). Specifically, the following analyses were conducted.
In the first, we constructed reaction norm plots for all strains across four temperatures to show if there are strain x temperature interactions. The mean OD value of each strain at each temperature was used to construct the reaction norm plot.
Second, the broad sense heritability contributing to growth differences among strains was calculated using the below formula.
where H2 is the broad sense heritability, VP is the phenotypic variance calculated as the total variance in growth across all strains, and VG is the genotypic variance, calculated as the difference between VP and environmental variance (VE). VE is calculated as the average of the variances in growth between replicates over all strains. H2 was calculated for each temperature on each of the 3 days.
Third, a mixed ANOVA was conducted to determine the contribution of country, temperature, and day post incubation on strain growth. The r package rstatix was used to conduct the ANOVA.
Forth, for each strain, we quantified the extent of variation in their growths among temperatures, using the measure of coefficient of variation. The coefficient of variation (CV), shown below,
is the ratio of standard deviation (σ) to the mean (μ). A large CV represents big differences in growth rates among temperatures. In contrast, a small CV represents relative uniformity in growths among temperatures for the specific strain. The CV was calculated for each A. fumigatus strain using growth values across all four temperatures.
Fifth, the contributions of mating type, temperature range and average temperature where strain came from on the CV of each strain on each day were estimated as follows. For each independent variable, the assumptions of normality were verified using Shapiro–Wilk's test and homoscedasticity using the Breusch–Pagan test. For mating type, we used both the parametric Student's T-test and the non-parametric Mann-Whitney test to compare the differences between them. For temperature range and average temperature, a linear regression model was generated to determine significance in the relationship between the temperature parameters in their native environments on CV.
Lastly, we tested whether the difference in CV among strains were related to their genotypic relationships as determined based on the nine STR loci. Specifically, we obtained two matrices and conducted non-parametric Mantel test between them. In one matrix, we calculated the absolute difference in CV between all pairs of strains. In the other matrix, Bruvo's genetic distance between all pairwise combination of strains was calculated using bruvo.dist in the R package poppr (24). Bruvo's genetic distance is specific for STR loci and it incorporates the stepwise mutation model during genetic distance calculations. A Shapiro-Wilk's test was conducted on the residuals to determine whether the distributions of the two matrices were normal. A linear regression model was used to determine the relationship between differences in genetic distance and in CV between pairs of strains. All 3,916 pairwise strain combinations were included in the analysis. Additionally, using the Bruvo's genetic distance matrix, a neighbor joining tree was generated using the R package ape (25). The tree was edited and visualized through the Interactive Tree of Life (iTOL) website (26).
3. Results
3.1. Growth is significantly influenced by temperature but remains highly varied within four of the five tested temperatures
In this study, we determined the growths of 89 strains for 3 days at 5 different temperatures. No growth was found at the 4°C environment for any of the 89 strains. Thus, our analyses will be focused on the remaining four temperatures. The growth profiles for all strains at the four temperatures are shown in Figure 1 as the reaction norm plots. For better visualization and comparison among strains within each country, growth profiles of strains separated by country of origin were also generated (Supplementary Figure 1). Among the four temperatures, significant growth differences between temperatures were observed (Figure 1). Overall, among these four temperatures, limited growths were observed at 15°C for most strains over all 3 days. Similarly, there was limited growth within 24 h at 22°C. However, broad variations among strains were observed at both the 35°C and 41°C environments. Interestingly, many strains showed similar growths at 35°C and 41°C.
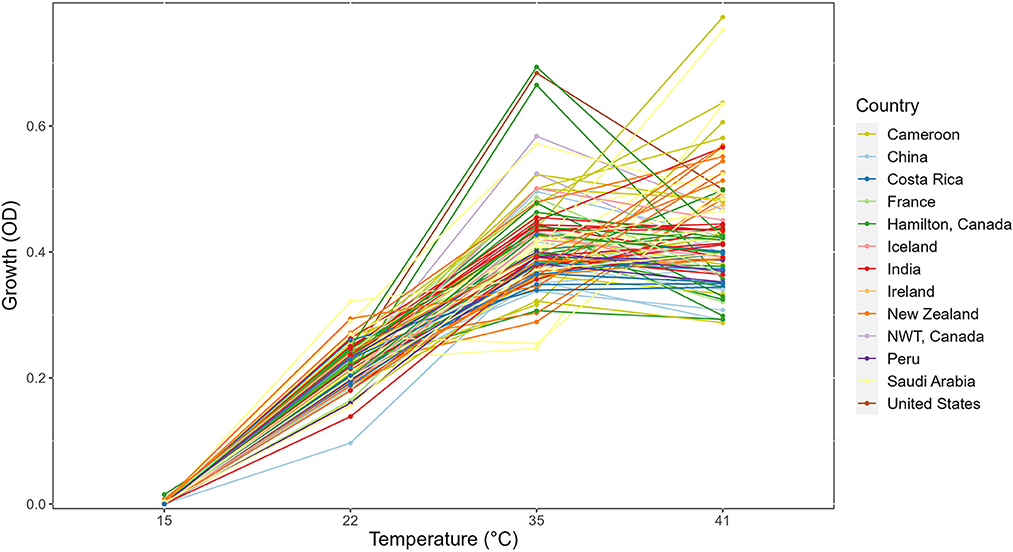
Figure 1. Reaction norm plot showing strain × temperature interactions in the day 3 growth profiles of 89 strains across four temperatures. NWT, Northwest Territories, Canada.
To investigate how much of the differences in growth at each temperature at each of the three time points were due to genetic differences among strains, we calculated the broad sense heritability (BSH) of the growth observed among our strains (Table 2). Our analyses revealed that in 10 of the 12 temperature × date combinations, their BSH values were all greater than 0.5. The only two combinations with BSH <0.5 were growths at 35°C during day 2 and day 3. Overall, at each of the 3 days, the 35°C environment showed the lowest BSH while the 22°C and 41°C showed the highest. However, there was no obvious pattern among the 3 days at each of the four temperatures.
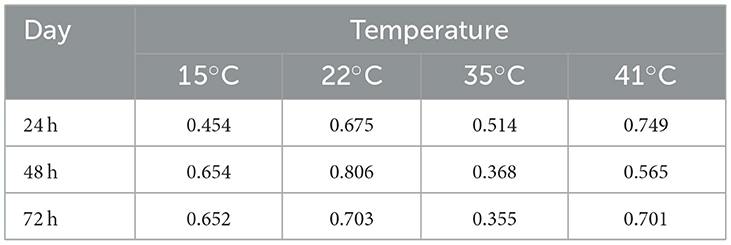
Table 2. Broad sense heritability (BSH, H2) calcuated using the observed growth of the 89 A. fumigatus strains across the 3 days and four temperatures.
At each temperature, we observed substantial variations in growth among strains (Figures 1, 2). As the temperature increases, the range of growth rates became wider among strains. Similarly, as time progresses, the growth differences among most strains became more obvious and the standard deviations correspondingly increased. To highlight some of the differences, Figure 3 shows the growths of the top six fastest growing and the bottom six slowest growing strains over the 3 days at each of the four temperatures. Further, to visualize the differences in growth between 72 and 24 h, we calculated the difference in growth of each A. fumigatus strain at each temperature between day 3 and day 1 (Figure 4). Within each temperature, strains showed high variability in growth difference between the days. Interestingly, except between 35°C and 41°C where no difference in change between growth at day 1 and day 3 was observed in our sample, the remaining pairwise temperature comparisons all showed statistically significant differences (p-value < 0.001). Together, our results indicate tremendous variations in growth profiles among strains across the four temperatures and among the 3 days.
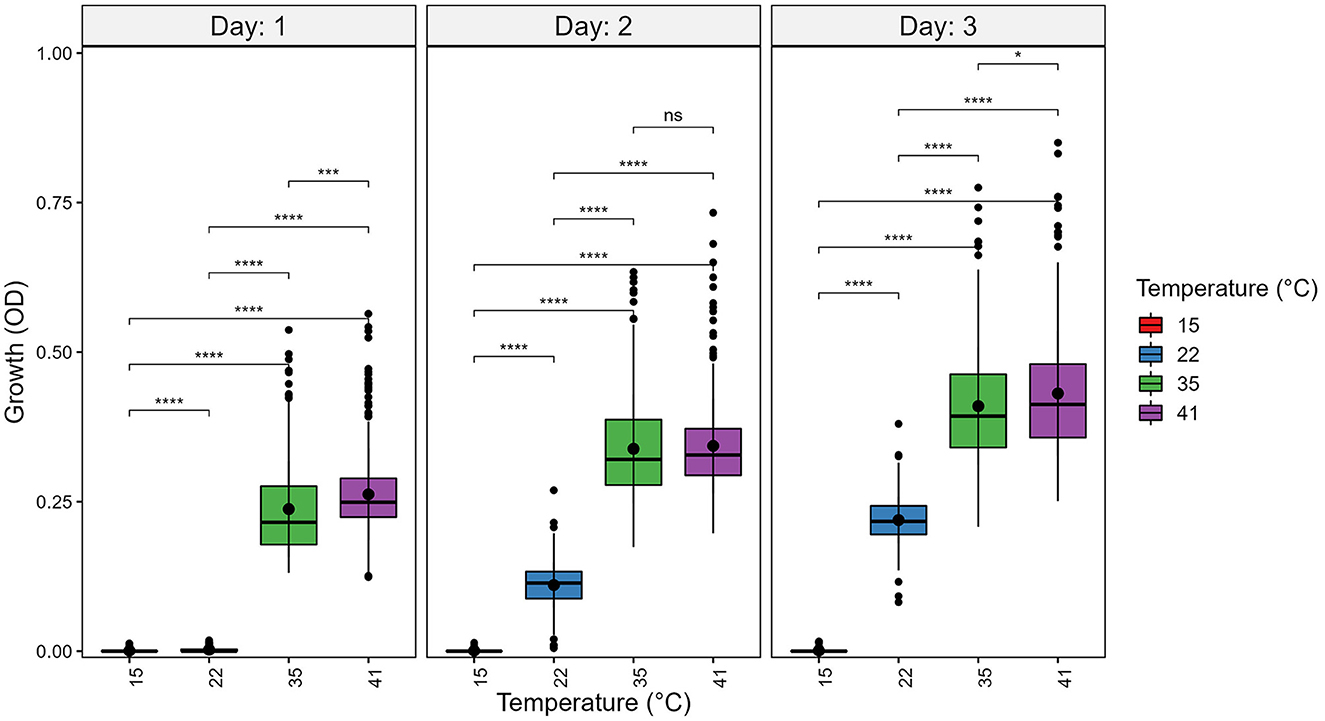
Figure 2. Temperature significantly contributes to growth differences among strains of A. fumigatus. A. fumigatus strains were grown at four temperatures: 15°C, 22°C, 35°C, and 41°C during a 3-day period. To quantify growth, the optical density (OD) at 600 nm of each strain was measured. Significance was determined through pairwise t-tests with post hoc correction via Holm's method. Boxplot center line represent the median and the top and bottom represent interquartile range. *p-value < 0.05, ***p-value < 0.001, ****p-value < 0.0001.
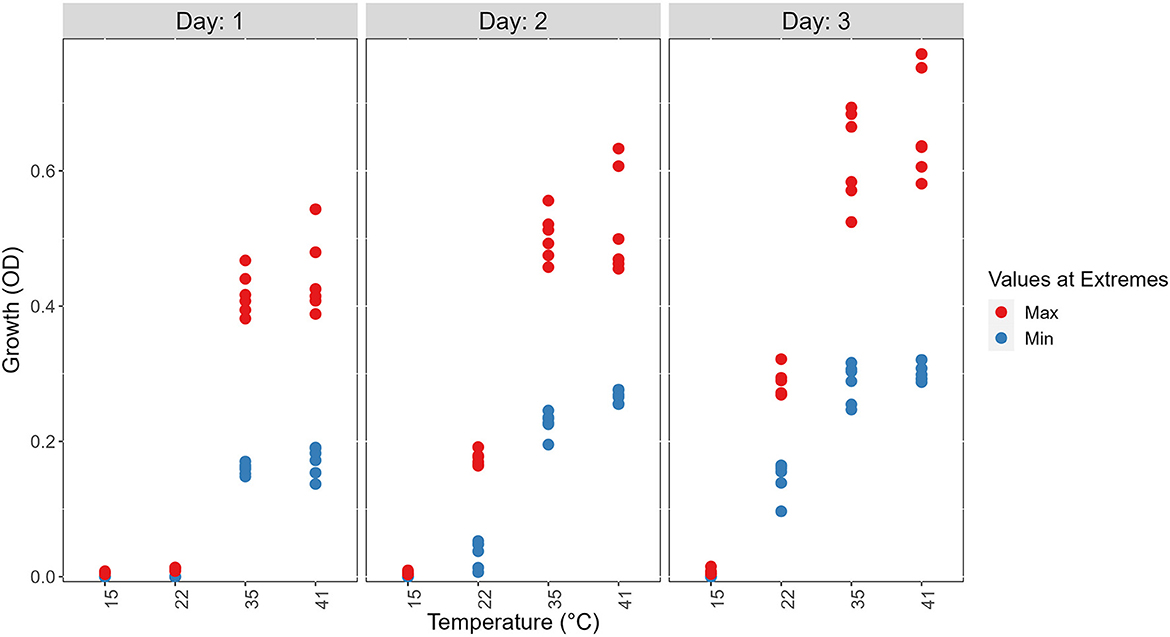
Figure 3. Visual representations of the top six fastest growing strains and the bottom six slowest growing ones at each of the four temperatures on 3 days to show the range of growth difference of A. fumigatus strains. The top 6 (Max) are shown in red and the bottom 6 (Min) are shown in blue.
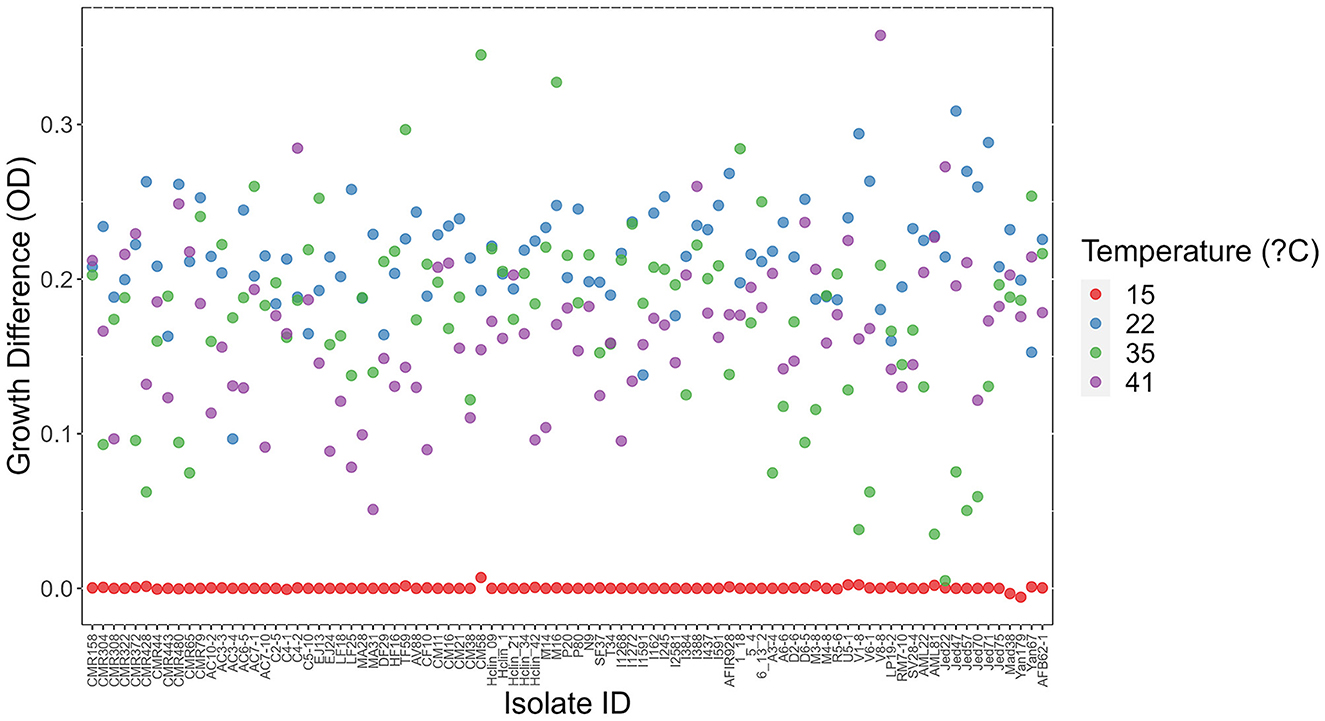
Figure 4. Difference in growth between day 3 and day 1 at each of four temperatures among 89 A. fumigatus strains. X-axis represents strain names. Y-axis represents in OD value differences between day 3 and day 1.
3.2. A. fumigatus strains demonstrate highly variable thermal adaptability to different temperatures
The broad range of growth between strains seen in Figures 1–4 suggest that there are high variations in growths between strains in their responses to different temperatures. To effectively analyze the broad variations and partition the observed variations to different contributors, we calculated the coefficient of variation (CV), a dimensionless and unitless measure for each strain for each of the 3 days (Figure 5). Our results showed overall highest CV values in Day 1, followed by those in Day 2 and with Day 3 being the lowest. The results suggest big differences in strains' initial responses to different temperatures. However, as time progresses and the strains adapt, the differences in growth among the temperatures decreased. Interestingly, most of the delayed growth occurred at 22°C where limited growths were seen for most strains during the first 24 h but significant growths were observed over the following 48 h at day 2 and day 3 (Figure 5A). Indeed, upon removal of the 22°C data from the dataset, the three-day data showed no significant contribution to differences in CV at the whole sample level (p-value = 0.722; Figure 5B). However, obvious variations in CVs among strains were observed (Day 1 range = 0.299, Day 2 range = 0.160, Day 3 range = 0.208).
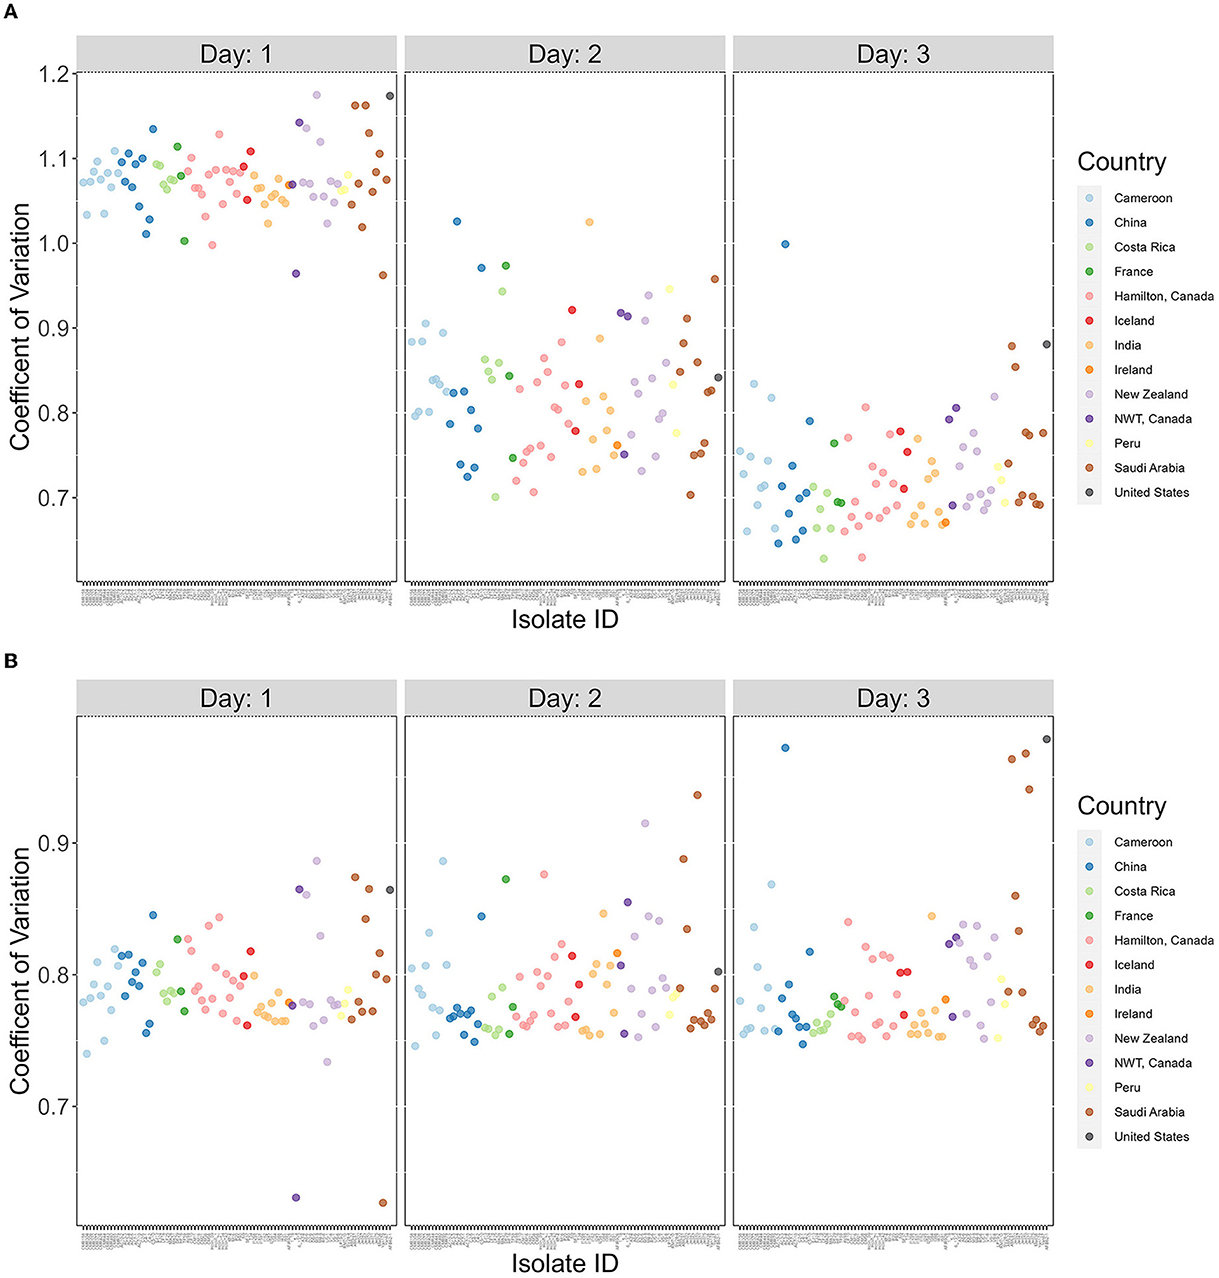
Figure 5. The coefficients of variation are highly variable among A. fumigatus strains but decreased over time. X-axis represents 89 A. fumigatus. Y-axis represents coefficient of variation (CV) values for each strain. (A) CV calculated based on all four temperatures (15°C, 22°C, 35°C, and 41°C). (B) CV calculated based on three temperatures (15°C, 35°C, and 41°C).
3.3. Geographic origin and the atmospheric temperature at isolation sites have no significant contribution to the high CV between strains
To determine the potential environmental factors that may contribute to the broad variability in growth and CV among strains, we investigated the impact of geographic origin, the average temperature present at each soil sample site, as well as the range between the highest and lowest temperatures at each sampling site (Table 3 and Figure 6). For geographic origin, strains were grouped by their country of origin. Countries that had < 3 strains were excluded from the analyses. We conducted a mixed ANOVA to determine the contributions of country of origin, temperature, and day post-incubation on strain growth as well as their interaction effects (Table 3). Our ANOVA analyses revealed a significant but relatively minor effect of country of origin on strain growth alone and in its interactions with day post-incubation and temperature. However, though an overall significant contribution based on country of origin was observed, none of the pairwise country comparisons showed significant difference in the growth (Figure 6A) and CV between their strains (Figure 6B).
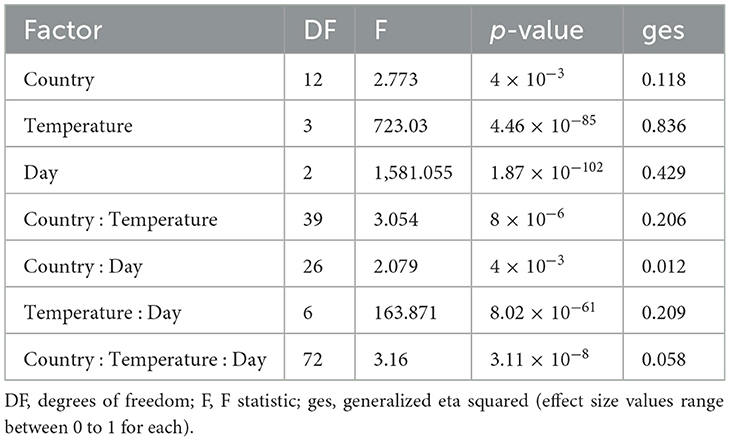
Table 3. Mixed ANOVA on the contributions of country of origin, temperature, and day post incubation and their interactions on the growth of A. fumigatus strains.
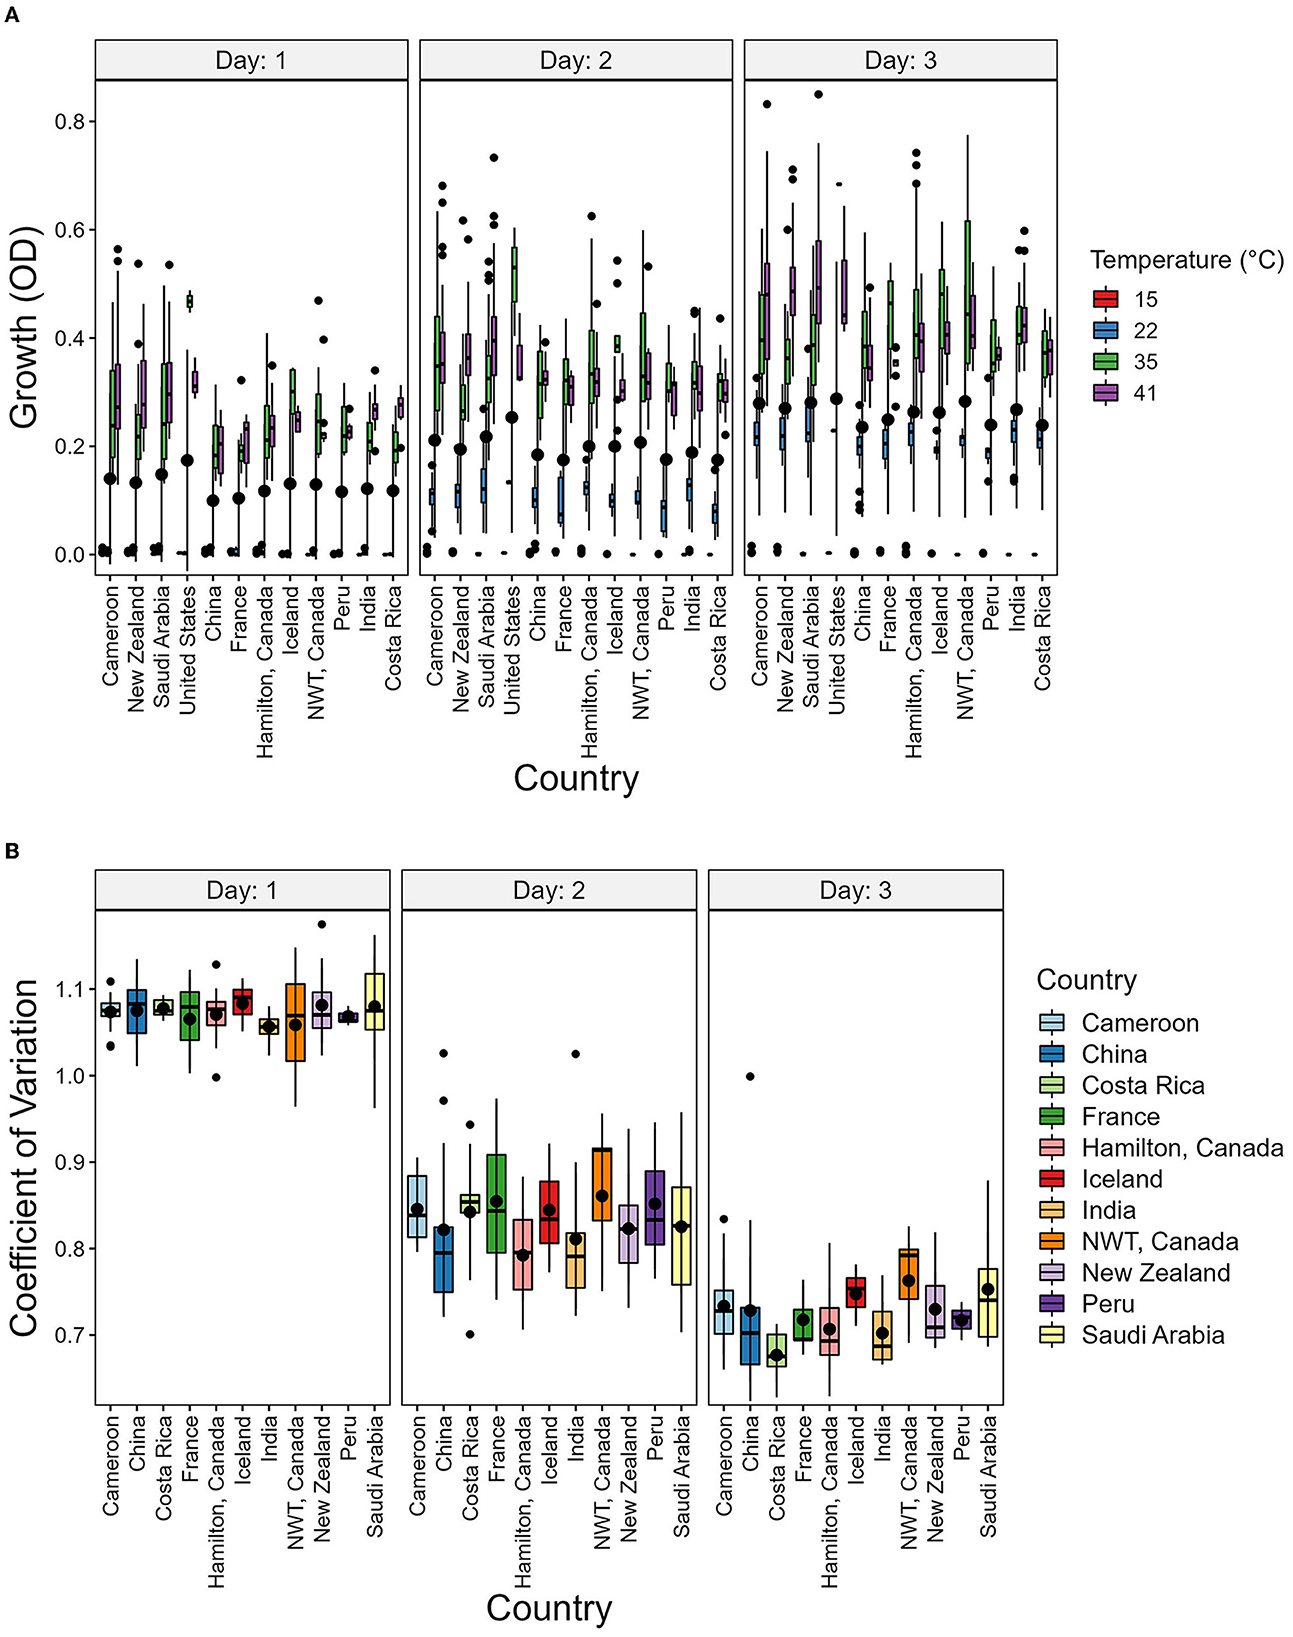
Figure 6. Country of origin has no significant contribution to strain growth and to coefficient of variation (CV). (A) Boxplot showing the growth of strains grouped by country and Temperature. (B) Boxplot showing the CV of strains grouped by country. The CV was calcuated as the ratio of variance to the mean using the growth values of each temperature.
In our data, a low CV represents the ability of a strain to grow similarly at different temperatures. We hypothesized that strains from geographic regions with less varied temperature changes throughout the year will show greater CV than those experiencing more variable temperatures. To investigate this, we obtained atmospheric temperature near the geographic origin of each strain. The contribution of the average temperature and the range between the highest and lowest temperature at each geographic location on CV was analyzed (Figure 7). However, we found no support for this hypothesis.
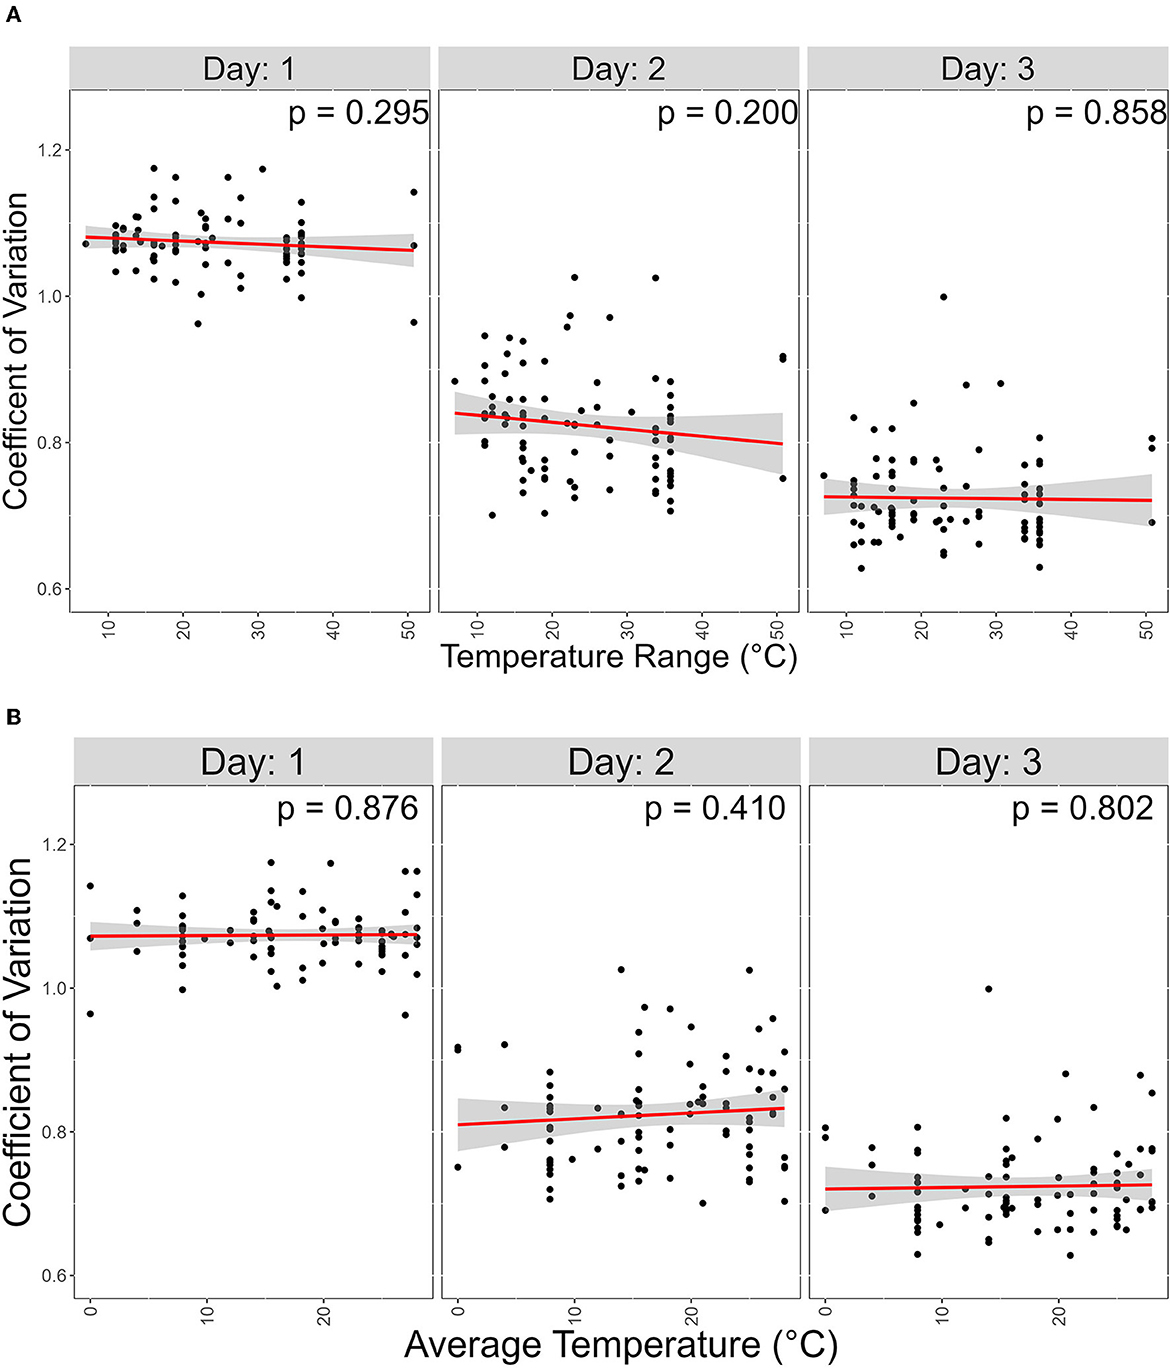
Figure 7. Atmospheric temperature at isolation sites has no significant contribution on coefficient of variation (CV). X-axis represents temperature range; Y-axis represents coefficient variations. Linear regression was used to determine signifcance between the two variables. (A) Scater plot of the effect of the Average temperature of each isolation site on CV. (B) Scater plot of the effect of the temperature range, which is the difference between the high and lowest average temperature of each isolation site, on CV.
3.4. Strain mating type has minimal contribution to growth and no significant contribution to CV
We investigated the potential effects of mating type on growth and CV among temperatures and days post incubation. A. fumigatus has two mating type idiomorphs, MAT1-1 and MAT1-2. Mating between strains of opposite idiomorphs are required for sexual reproduction. The details of our analyses results are shown in Figure 8. Overall, our comparisons showed limited difference between the two mating types, in either growth or CV (Figure 8). Except in one comparison, we observed no significant influence of mating type on either growth or CV. The only marginally significant difference observed here were growth at 35°C on day 3 where strains of MAT1-2 overall grew slightly more and had higher CV than strains of MAT1-1.
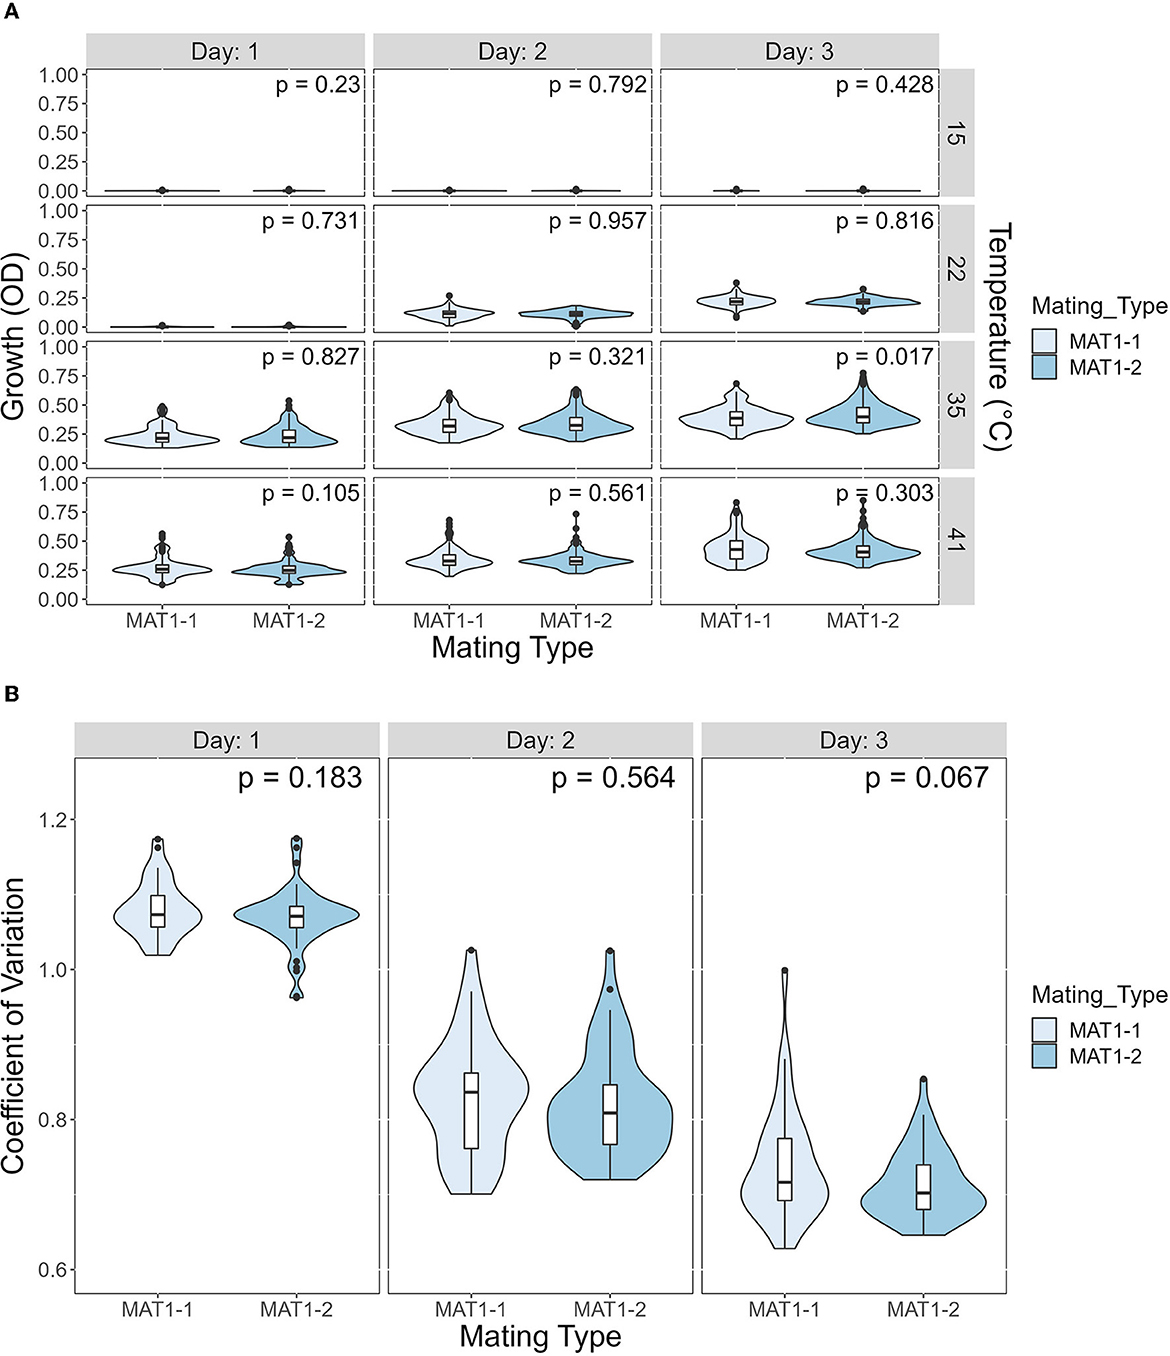
Figure 8. The mating type of A. fumigatus strains has a minimal contribution to growth difference and to coefficient of variation (CV). (A) Violin plot showing difference in growth between MAT1-1 and MAT1-2 at each temperature on each day. Significance was determined through Mann-Whitney test. (B) Violin plot showing difference in CV between MAT1-1 and MAT1-2 at each day. Significance was determined through Student's t-test.
3.5. Genetic distances between strains has no significant association to the pairwise difference in CV
We also tested the hypothesis that strains with similar STR genotypes would have similar CV. Specifically, we used a linear regression model to determine if the difference in CV between all pairwise combinations of strains grown for 72 h were correlated to their genetic distances. A cubic root transformation on the CV difference was done to achieve a Gaussian distribution among residuals. Our results indicate that the genetic distance between strains was not significantly correlated to CV difference between pairs of strains (Figure 9). Interestingly, the Chinese strain AC3-4 contributed to the top 64 CV difference values. The CV value of strain AC3-4 was 0.999 for day 3, the highest among all strains. Figure 10 shows the relationships among the 89 strains based on their genetic distances inferred from genotypes at nine STR loci.
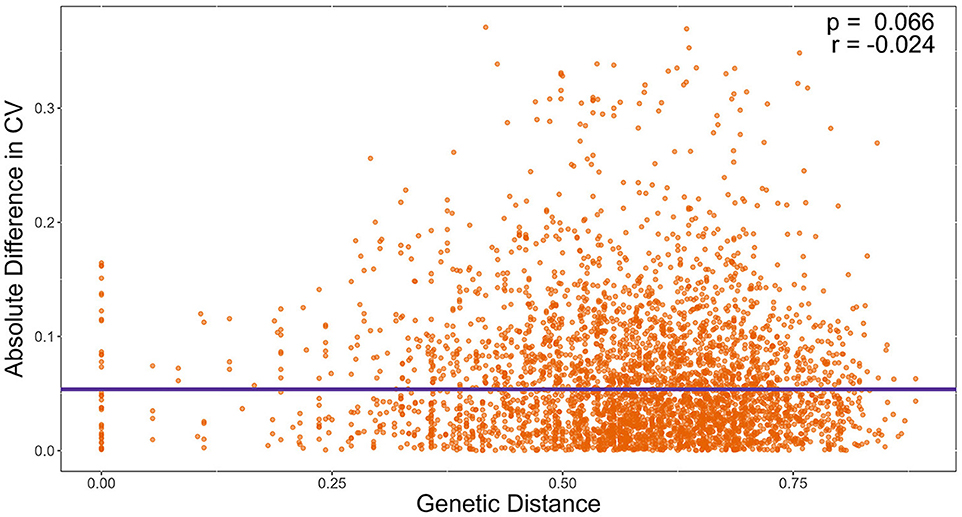
Figure 9. Genetic distance is not significantly correlated with the coefficient of variation (CV) in growths among temperatures. X-axis refers to pairwise genetic distance between strains based on Bruvo's distance. Y-axis refers to pairwise absolute difference in CV on Day 3. Significance was determined through a linear regression model.
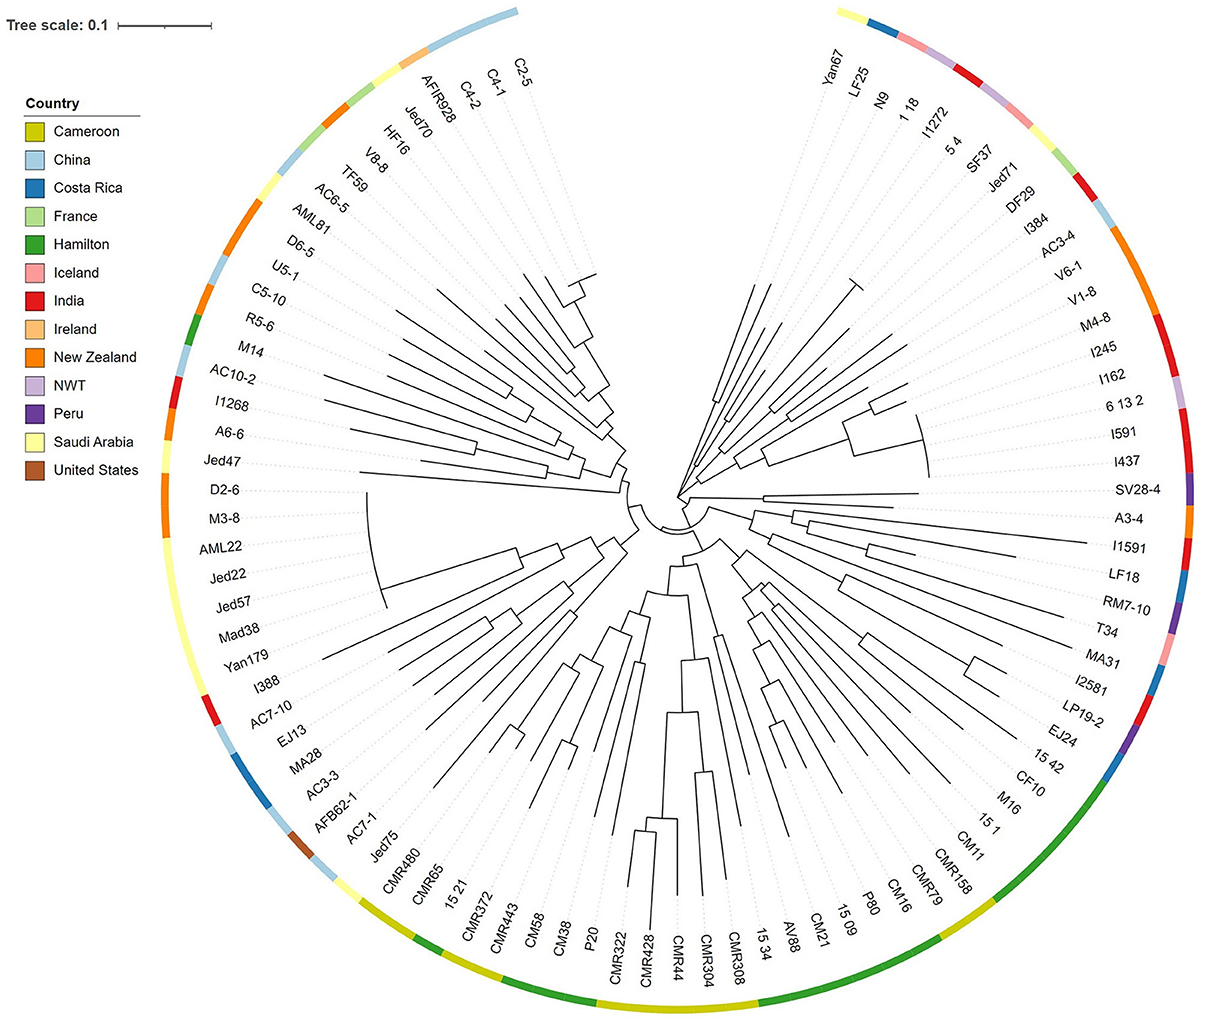
Figure 10. Neighbor joining tree among strains of A. fumigatus based on STR genotypes. The phylogram was constructed using the Bruvo's genetic distances at nine STR loci. Color strips at each individual node represent the country of origin.
4. Discussion
In our study, we characterized the thermal adaptation of 89 A. fumigatus strains from 12 countries representing different climatic areas. After incubation at four temperatures for 3 days, high variation in growth and CV was seen among A. fumigatus strains through all 3 days. We then investigated whether genetic and geographic factors contributed to the observed variations in growth and CV. We found that geographic factors such as country of origin, average temperature at isolation site, and the temperature range of the isolation site had no significant contribution to growth or to CV within and among each of the 3 days. Among genetic factors, the MAT1-2 strains showed a slightly higher growth at 35°C on day 3 than the MAT1-1 strains. However, genetic distances as determined based on nine STR loci between strains showed no correlation with their CV differences. Our results highlight the remarkable variation in thermal adaptation displayed among A. fumigatus populations regardless of their genotypic similarity and geographic origin. Below we discuss the relevance of our findings to previous studies and their contributions to understanding the evolution and epidemiology of A. fumigatus in the future.
Growth differences among strains at different temperatures have been investigated in several fungi, including species of Aspergillus, Penicillium, Paecilomyces, and Metarhizium (27–31). For filamentous fungi, previous studies measured the radial growth of colonies on solid media at different temperatures as indicators of their growths (32–34). Larger colonies represent higher tolerance to the environmental conditions tested. However, radial growth measures two-dimensional growth via colony surface area or colony diameter (32). In comparison, relative optical densities measure three-dimensional growth in liquid media and therefore is likely a more accurate reflection of the total mycelial growth of A. fumigatus strains (33). Indeed, liquid culture and OD reading has been used as an indicator for measuring A. fumigatus growth for determining their susceptibilities to antifungal drugs (34). In addition, liquid culturing and OD measurements provided us a high throughput method to measure the thermal adaptability of a large number of strains under diverse temperatures through multiple days. However, we note that the liquid culture in the lab can't reflect the dynamic environmental conditions of A. fumigatus in nature and that, despite efforts to maintain uniformity, variations among batches and among wells in microtiter plates likely existed that could have contributed to variations in OD among replicates within and among strains.
Aspergillus fumigatus is highly thermophilic and has been isolated from soil microenvironments from diverse geographic locations and climates. However, our growth and CV results suggested no significant association between the geographic origins of A. fumigatus strains and strain growth patterns at different temperatures. Our results contrast those observed in several other fungal species that showed associations between geographic origin and growth pattern (28, 29, 35–37). For example, Paecilomyces fumosoroseusis was shown to have intraspecific variability in growth at different temperatures (28), with increased radial growth at temperatures similar to their climate of origin. The level of yeast pigmentation was also observed to be latitudinally distributed and associated with varying levels of thermal tolerance (37). Dark pigmented yeasts were more commonly found in high latitude regions with lower temperatures whereas light pigmented yeasts were associated with equatorial regions with higher temperatures. Similar to the observed variability in radial growth among strains on solid medium in P. fumosoroseusis, we observed tremendous intraspecific variabilities in both growth and CV among our strains. However, in contrast to the growth patterns observed among P. fumosoroseusis populations, geographic origin had no significant contribution to the observed variations in our samples. This suggests the individual geographic populations of A. fumigatus contain strains with variable levels of adaptability to temperature.
At present, how individual populations of A. fumigatus maintain such variabilities is unknown. However, there are three possibilities that may explain the observed variability. In the first, the variabilities in thermal adaptations might be maintained in response to daily and seasonal temperature fluctuations. Within each country and at each site, the daily and seasonal air temperatures can vary widely (38, 39). Second, different ecological niches within a local site can also have different temperature patterns. For example, the inside of a compost pile consisting of decomposing dead organic matter can exceed 50°C while outside of the compost pile the temperature may be <20°C or even lower (40). Third, gene flow could bring strains adapted at temperatures in other sites into new locations (5, 6, 8–10). Indeed, strains with high CV may have originated from geographic regions with limited variability in temperature, such as regions closer to the equator. Gene flow has been observed between distant geographic populations of A. fumigatus and such gene flow could contribute to the limited difference among geographic populations in their thermal response profiles (5, 6, 8–10). These three possibilities are not mutually exclusive and all three could have contributed to the observed variabilities, with potentially different contributions to different geographic populations. Greater sampling of diverse ecological niches within specific geographic regions combined with temperature-based experimental evolution studies could help determine the extent of their contributions to A. fumigatus growth variations at different temperatures (1, 41).
The genetic mechanisms underlying thermal tolerance have been examined in several fungal species. Though some genes and mutations can have major effects on thermal tolerance (41), most studies have shown that thermotolerance is a polyphyletic trait that emerged multiple times throughout the fungal phylogeny (30, 42). Our BSH results suggested genetic differences between strains contributed to variations in thermal growth profiles among strains of A. fumigatus. Therefore, we tested the contribution of strain mating type and STR genotype on strain thermal adaptivity. Our results suggested mating type had minimal effect on growth and no effect on CV, where the only significant association was for day 3 at 35°C. For ascomycete fungi, mating type idiomorphs predominantly function as transcription factors that regulate the sexual cycle (43). However, in some fungi, genetic pathways influenced by mating type intersected with other pathways including those for conidiation, stress response, and pathogenicity (44, 45). In A. fumigatus, a temperature around 65°C is required to germinate sexual ascospores (46). Sexual reproduction within composting plant-waste material has recently been observed between A. fumigatus strains, where temperature above 65°C readily occur (47). Given that the sexual reproductive pathways intersect with many other pathways and sexual reproduction requires elevated temperatures to occur in A. fumigatus, there may exist a possible link between sexual pathways and thermal adaptability. Although no signification correlation between mating type and thermal adaptability was observed in our study population, an association may exist in some strains. An example of this potential association was the Chinese strain AC3-4. In our study, AC3-4 showed the highest CV and contributed to the highest CV differences between strains. Interestingly, our previous work showed that strain AC3-4 was among the most fertile in the samples we tested (48). Given the data we presented here, it's templating to speculate that there may be an association between high mating ability and high CV for growth at different temperatures for a subset of strains within many geographic populations of A. fumigatus. Interestingly, another supermater strain AFB62-1 also had a similarly high CV value (20, 48). Further investigation is required to identify if and how mating ability influences thermal adaptability.
Interestingly, the genetic distance between strains estimated through nine STR markers showed no relationship to their CV differences. This lack of association suggests that the STR markers were indeed neutral with regard to thermal growth profile differences among strains and therefore they were unable to explain the observed variance in CV among strains. Frequent recombination between strains within and between many A. fumigatus populations would erode any linkage disequilibrium between the nine STR markers and genes associated with growth at different temperatures (5, 6, 8). Indeed, a recent study by Auxier et al. found that A. fumigatus has the highest number of crossovers during meiosis among eukaryotic species, approximately 29 crossovers per chromosome during each meiosis (49). This high recombination rate will allow genetically unique migrants, upon entering a local population, to quickly acquire and/or spread genes that promote adaptation to the native climate. While the neutrality of the nine STR markers are ideal for characterizing A. fumigatus population structure, further research is required to genetically explain the observed variance in thermal adaptation in our A. fumigatus population. Multiple A. fumigatus genetic pathways are known to be upregulated during thermal stress (38–41). For example, the nucleolar protein CgrA is upregulated in A. fumigatus and is thought to increase the production of proteins related to heat response (50). More recently, proteins that regulate aspects of the cell wall integrity pathway have been shown to provide resistance to heat shock, such as protein chaperone HSP90 and the heat shock transcription factor HsfA (51, 52). In another model filamentous fungus Neurospora crassa, mutants of calcium/calmodulin-dependent kinases were observed to have reduced thermotolerance (53). In future studies, a GWAS analysis may locate previously identified and/or novel gene regions under selection for thermotolerance and provide candidate genes for gene expression quantification that may explain the observed variance in growth among strains. Additionally, a proteomic analysis of the strains may further elucidate the impact of thermal stresses on the A. fumigatus proteome (54).
5. Conclusions
Rising global temperatures due to climate change will promote the expansion of microbial pathogens toward higher and lower latitudes, as well as cause the emergence of novel pathogenic species (1). More research is required to better understand the impact that rising global temperatures may have on microbial populations. Populations of A. fumigatus have broad global distributions, and therefore have the potential to adapt to a wide range of climatic temperatures present in these diverse ecological niches. Our findings of high variance in growth among strains across temperatures irrespective of geographic origin and genetic distance suggest the extreme capacity of local populations of A. fumigatus to adapt to the changing climate and global warming. Coupled with the high speed at which A. fumigatus disperse, strains and populations with highly adaptive mutations to thermal stresses could spread rapidly and be integrated into local populations across the globe (18, 49). In additional to rising global temperatures, climate change will alter other abiotic factors within soil environmental, such as water availability and solute concentrations that fungi will need to adapt to in the coming years (27). Therefore, further investigation into the adaptability of A. fumigatus strains to abiotic stressors will provide insights on the remarkable ability of A. fumigatus populations to acquire and spread highly fit genotypes, including those that provide resistance to antifungal drugs.
Data availability statement
The datasets presented in this study can be found in online repositories. The names of the repository/repositories and accession number(s) can be found in the article/Supplementary material.
Author contributions
GK led the study, contributed to the data collection, analyses, interpretation, and manuscript drafting. EH contributed to the data collection and manuscript writing and edits. JX conceptualized the study design, contributed to data interpretation, and manuscript writing and finalization. All authors read and approved the final manuscript.
Funding
This research was supported by grants from the Natural Sciences and Engineering Research Council of Canada (Grant No. ALLRP 570780-21) and by the Institute of Infectious Diseases Research (IIDR) Antibiotic Resistance Initiative and the Faculty of Science's Global Science Initiative of McMaster University. The APC was funded by IIDR and David Braley Centre for Antibiotic Discovery. GK was supported by NSERC PGS-D Scholarship.
Conflict of interest
The authors declare that the research was conducted in the absence of any commercial or financial relationships that could be construed as a potential conflict of interest.
Publisher's note
All claims expressed in this article are solely those of the authors and do not necessarily represent those of their affiliated organizations, or those of the publisher, the editors and the reviewers. Any product that may be evaluated in this article, or claim that may be made by its manufacturer, is not guaranteed or endorsed by the publisher.
Supplementary material
The Supplementary Material for this article can be found online at: https://www.frontiersin.org/articles/10.3389/fpubh.2023.1059238/full#supplementary-material
Supplementary Table 1. Strain genotype, mating type, and geographic information for all 89 strains analyzed in this study.
Supplementary Figure 1. Reaction norm plots showing strain × temperature interactions in the growth profiles of 89 strains after three days of incubation across four temperatures separated by country. NWT, Northwest Territories, Canada.
References
2. Latgé JP, Chamilos G. Aspergillus fumigatus and aspergillosis in 2019. Clin Microbiol Rev. (2020) 33:e00140–18. doi: 10.1128/CMR.00140-18
3. Kwon-Chung KJ, Sugui JA. Aspergillus fumigatus–what makes the species a ubiquitous human fungal pathogen? PLoS Pathog. (2013) 9:e1003743. doi: 10.1371/journal.ppat.1003743
4. Alanio A, Dellière S, Fodil S, Bretagne S, Mégarbane B. Prevalence of putative invasive pulmonary aspergillosis in critically ill patients with COVID-19. Lancet Respir Med. (2020) 8:e48–9. doi: 10.1016/S2213-2600(20)30237-X
5. Ashu EE, Hagen F, Chowdhary A, Meis JF, Xu J. Global population genetic analysis of Aspergillus fumigatus. mSphere. (2017) 2:e00019–17. doi: 10.1128/mSphere.00019-17
6. Sewell TR, Zhu J, Rhodes J, Hagen F, Meis JF, Fisher MC, et al. Nonrandom distribution of azole resistance across the global population of Aspergillus fumigatus. MBio. (2019) 10:e00392–19. doi: 10.1128/mBio.00392-19
7. Etienne KA, Berkow EL, Gade L, Nunnally N, Lockhart SR, Beer K, et al. Genomic diversity of azole-resistant Aspergillus fumigatus in the united states. MBio. (2021) 12:e01803–21. doi: 10.1128/mBio.01803-21
8. Korfanty GA, Teng L, Pum N, Xu J. Contemporary gene flow is a major force shaping the Aspergillus fumigatus population in Auckland, New Zealand. Mycopathologia. (2019) 184:479–92. doi: 10.1007/s11046-019-00361-8
9. Zhou D, Korfanty GA, Mo M, Wang R, Li X, Li H, et al. Extensive genetic diversity and widespread azole resistance in greenhouse populations of Aspergillus fumigatus in Yunnan, China. mSphere. (2021) 6:e00066–21. doi: 10.1128/mSphere.00066-21
10. Korfanty GA, Dixon M, Jia H, Yoell H, Xu J. Genetic diversity and dispersal of Aspergillus fumigatus in Arctic soils. Genes. (2021) 13:19. doi: 10.3390/genes13010019
11. Barber AE, Riedel J, Sae-Ong T, Kang K, Brabetz W, Panagiotou G, et al. Effects of Agricultural Fungicide Use on Aspergillus fumigatus Abundance, Antifungal Susceptibility, and Population Structure. MBio. (2020) 11:e02213–20. doi: 10.1128/mBio.02213-20
12. Wang Y, Xu J. Population genomic analyses reveal evidence for limited recombination in the superbug Candida auris in nature. Comput Struct Biotechnol J. (2022) 20:3030–40. doi: 10.1016/j.csbj.2022.06.030
13. Yadav A, Jain K, Wang Y, Pawar K, Kaur H, Sharma KK, et al. Candida auris on apples: Diversity and clinical significance. MBio. (2022) 13:e00518–22. doi: 10.1128/mbio.00518-22
14. Arora P, Singh P, Wang Y, Yadav A, Pawar K, Singh A, et al. Environmental isolation of Candida auris from the coastal wetlands of Andaman islands, India. MBio. (2021) 12:1–9. doi: 10.1128/mBio.03181-20
15. Casadevall A, Kontoyiannis DP, Robert V. On the emergence of Candida auris: climate change, azoles, swamps, and birds. MBio. (2019) 10:e01397–19. doi: 10.1128/mBio.01397-19
16. Casadevall A, Kontoyiannis DP, Robert V. Environmental Candida auris and the global warming emergence hypothesis. MBio. (2021) 12:1–3. doi: 10.1128/mBio.00360-21
17. Samarasinghe H, Korfanty G, Xu J. Isolation of culturable yeasts and molds from soils to investigate fungal population structure. JoVE. (2022) 2022:e63396. doi: 10.3791/63396-v
18. Chowdhary A, Kathuria S, Xu J, Sharma C, Sundar G, Singh PK, et al. Clonal expansion and emergence of environmental multiple-triazole-resistant Aspergillus fumigatus strains carrying the TR34/L98H mutations in the cyp51A gene in India. PLoS ONE. (2012) 7:e52871. doi: 10.1371/journal.pone.0052871
19. Ashu EE, Kim GY, Roy-Gayos P, Dong K, Forsythe A, Giglio V, et al. Limited evidence of fungicide-driven triazole-resistant Aspergillus fumigatus in Hamilton, Canada. Can J Microbiol. (2018) 64:119–30. doi: 10.1139/cjm-2017-0410
20. Sugui JA, Losada L, Wang W, Varga J, Ngamskulrungroj P, Abu-Asab M, et al. Identification and characterization of an Aspergillus fumigatus “supermater” pair. MBio. (2011) 2:e00234–11. doi: 10.1128/mBio.00234-11
21. de Valk HA, Meis JFGM, Curfs IM, Muehlethaler K, Mouton JW, Klaassen CHW. Use of a novel panel of nine short tandem repeats for exact and high-resolution fingerprinting of Aspergillus fumigatus isolates. J Clin Microbiol. (2005) 43:4112–20. doi: 10.1128/JCM.43.8.4112-4120.2005
22. Paoletti M, Rydholm C, Schwier EU, Anderson MJ, Szakacs G, Lutzoni F, et al. Evidence for sexuality in the opportunistic fungal pathogen Aspergillus fumigatus. Curr Biol. (2005) 15:1242–8. doi: 10.1016/j.cub.2005.05.045
23. R Core Team. R: a language environment for statistical computing. R Foundation for Statistical Computing Vienna, Austria. (2022). Available online at: https://www.r-project.org/ (accessed January 5, 2023).
24. Kamvar ZN, Tabima JF, Grünwald NJ. Poppr : an R package for genetic analysis of populations with clonal, partially clonal, and/or sexual reproduction. PeerJ. (2014) 2:e281. doi: 10.7717/peerj.281
25. Paradis E. Schliep K ape 50: an environment for modern phylogenetics and evolutionary analyses in R. Bioinformatics. (2019) 35:526–8. doi: 10.1093/bioinformatics/bty633
26. Letunic I, Bork P. Interactive tree of life (iTOL) v3: an online tool for the display and annotation of phylogenetic and other trees. Nucleic Acids Res. (2016) 44:W242–5. doi: 10.1093/nar/gkw290
27. Medina A, Schmidt-Heydt M, Rodríguez A, Parra R, Geisen R, Magan N. Impacts of environmental stress on growth, secondary metabolite biosynthetic gene clusters and metabolite production of xerotolerant/xerophilic fungi. Curr Genet. (2015) 61:325–34. doi: 10.1007/s00294-014-0455-9
28. Vidal C, Fargues J, Lacey LA. Intraspecific Variability of Paecilomyces fumosoroseus: Effect of temperature on vegetative growth. J Invertebr Pathol. (1997) 70:18–26. doi: 10.1006/jipa.1997.4658
29. Rangel DEN, Braga GUL, Anderson AJ, Roberts DW. Variability in conidial thermotolerance of Metarhizium anisopliae isolates from different geographic origins. J Invertebr Pathol. (2005) 88:116–25. doi: 10.1016/j.jip.2004.11.007
30. Mattoon ER, Casadevall A, Cordero RJ. Beat the heat: correlates, compounds, and mechanisms involved in fungal thermotolerance. Fungal Biol Rev. (2021) 36:60–75. doi: 10.1016/j.fbr.2021.03.002
31. Sangamesh MB, Jambagi S, Vasanthakumari MM, Shetty NJ, Kolte H, Ravikanth G, et al. Thermotolerance of fungal endophytes isolated from plants adapted to the Thar Desert, India. Symbiosis. (2018) 75:135–47. doi: 10.1007/s13199-017-0527-y
32. Gibson AM, Hocking AD. Advances in the predictive modelling of fungal growth in food. Trends Food Sci Technol. (1997) 8:353–8. doi: 10.1016/S0924-2244(97)01065-0
33. Granade TC, Hehmann MF, Artis WM. Monitoring of filamentous fungal growth by in situ microspectrophotometry, fragmented mycelium absorbance density, and 14C incorporation: alternatives to mycelial dry weight. Appl Environ Microbiol. (1985) 49:101–8. doi: 10.1128/aem.49.1.101-108.1985
34. Miyazawa K, Umeyama T, Hoshino Y, Abe K, Miyazaki Y. Quantitative monitoring of mycelial growth of Aspergillus fumigatus in liquid culture by optical density. Microbiol Spectr. (2022) 10:e00063–21. doi: 10.1128/spectrum.00063-21
35. Rangel DEN, Fernandes ÉKK, Dettenmaier SJ, Roberts DW. Thermotolerance of germlings and mycelium of the insect-pathogenic fungus Metarhizium spp. and mycelial recovery after heat stress. J Basic Microbiol. (2010) 50:344–50. doi: 10.1002/jobm.200900430
36. Kryukov VY, Yaroslavtseva ON, Elisaphenko EA, Mitkovets P V, Lednev GR, Duisembekov BA, et al. Change in the temperature preferences of Beauveria bassiana sensu lato isolates in the latitude gradient of Siberia and Kazakhstan. Microbiol. (2012) 81:453–9. doi: 10.1134/S002626171204011X
37. Cordero RJB, Robert V, Cardinali G, Arinze ES, Thon SM, Casadevall A. Impact of yeast pigmentation on heat capture and latitudinal distribution. Curr Biol. (2018) 28:2657. doi: 10.1016/j.cub.2018.06.034
38. Lembrechts JJ, van den Hoogen J, Aalto J, Ashcroft MB, De Frenne P, Kemppinen J, et al. Global maps of soil temperature. Glob Chang Biol. (2022) 28:3110–44. doi: 10.32942/OSF.IO/PKSQW
39. Feng Y, Zhang J, Berdugo M, Guirado E, Guerra CA, Egidi E, et al. Temperature thresholds drive the global distribution of soil fungal decomposers. Glob Chang Biol. (2022) 28:2779–89. doi: 10.1111/gcb.16096
40. Margesin R, Cimadom J, Schinner F. Biological activity during composting of sewage sludge at low temperatures. Int Biodeter Biodegrad. (2006) 57:88–92. doi: 10.1016/j.ibiod.2005.12.001
41. Xu J. Genotype-environment interactions of spontaneous mutations for vegetative fitness in the human pathogenic fungus Cryptococcus neoformans. Genetics. (2004) 168:1177–88. doi: 10.1534/genetics.104.030031
42. Bhabhra R, Askew DS. Thermotolerance and virulence of Aspergillus fumigatus: Role of the fungal nucleolus. Med Mycol. (2005) 43:87–93. doi: 10.1080/13693780400029486
43. Wilson AM, Wilken PM, Van der Nest MA, Wingfield MJ, Wingfield BD. It's all in the genes: The regulatory pathways of sexual reproduction in filamentous ascomycetes. Genes. (2019) 10:330. doi: 10.3390/genes10050330
44. Yong M, Yu J, Pan X, Yu M, Cao H, Song T, et al. Two mating-type genes MAT1-1-1 and MAT1-1-2 with significant functions in conidiation, stress response, sexual development, and pathogenicity of rice false smut fungus Villosiclava virens. Curr Genet. (2020) 66:989–1002. doi: 10.1007/s00294-020-01085-9
45. Nielsen K, Marra RE, Hagen F, Boekhout T, Mitchell TG, Cox GM, et al. Interaction between genetic background and the Mating-Type locus in Cryptococcus neoformans virulence potential. Genetics. (2005) 171:975–83. doi: 10.1534/genetics.105.045039
46. O'Gorman CM, Fuller HT, Dyer PS. Discovery of a sexual cycle in the opportunistic fungal pathogen Aspergillus fumigatus. Nature. (2009) 457:471–4. doi: 10.1038/nature07528
47. Zhang J, Verweij PE, Rijs AJMM, Debets AJM, Snelders E. Flower bulb waste material is a natural niche for the sexual cycle in Aspergillus fumigatus. Front Cell Infect Microbiol. (2022) 11:1466. doi: 10.3389/fcimb.2021.785157
48. Korfanty G, Stanley K, Lammers K, Fan YY, Xu J. Variations in sexual fitness among natural strains of the opportunistic human fungal pathogen Aspergillus fumigatus. Infect Genet Evol. (2021) 87:104640. doi: 10.1016/j.meegid.2020.104640
49. Auxier B, Becker F, Nijland R, Debets AJM, Heuvel J, van den Snelders E. Meiosis in the human pathogen Aspergillus fumigatus has the highest known number of crossovers. bioRxiv. (2022) 14:329. doi: 10.1101/2022.01.14.476329
50. Bhabhra R, Miley MD, Mylonakis E, Boettner D, Fortwendel J, Panepinto JC, et al. Disruption of the Aspergillus fumigatus gene encoding nucleolar protein CgrA impairs thermotolerant growth and reduces virulence. Infect Immun. (2004) 72:4731–40. doi: 10.1128/IAI.72.8.4731-4740.2004
51. Rocha MC, Minari K, Fabri JHTM, Kerkaert JD, Gava LM, da Cunha AF, et al. Aspergillus fumigatus Hsp90 interacts with the main components of the cell wall integrity pathway and cooperates in heat shock and cell wall stress adaptation. Cell Microbiol. (2021) 23:e13273. doi: 10.1111/cmi.13273
52. Fabri JHTM, Rocha MC, Fernandes CM, Persinoti GF, Ries LNA, Cunha AF da, et al. The heat shock transcription factor HsfA is essential for thermotolerance and regulates cell wall integrity in Aspergillus fumigatus. Front Microbiol. (2021) 12:735. doi: 10.3389/fmicb.2021.656548
53. Kumar R, Tamuli R. Calcium/calmodulin-dependent kinases are involved in growth, thermotolerance, oxidative stress survival, and fertility in Neurospora crassa. Arch Microbiol. (2014) 196:295–305. doi: 10.1007/s00203-014-0966-2
Keywords: human fungal pathogen, temperature effect, reaction norm, heritability, microsatellite genotyping, coefficient of variation, geographic population
Citation: Korfanty G, Heifetz E and Xu J (2023) Assessing thermal adaptation of a global sample of Aspergillus fumigatus: Implications for climate change effects. Front. Public Health 11:1059238. doi: 10.3389/fpubh.2023.1059238
Received: 01 October 2022; Accepted: 31 January 2023;
Published: 16 February 2023.
Edited by:
John Hay, University at Buffalo, United StatesReviewed by:
Jaime David Acosta España, Leibniz Institute for Natural Product Research and Infection Biology, GermanyCi Fu, University of Toronto, Canada
Copyright © 2023 Korfanty, Heifetz and Xu. This is an open-access article distributed under the terms of the Creative Commons Attribution License (CC BY). The use, distribution or reproduction in other forums is permitted, provided the original author(s) and the copyright owner(s) are credited and that the original publication in this journal is cited, in accordance with accepted academic practice. No use, distribution or reproduction is permitted which does not comply with these terms.
*Correspondence: Jianping Xu,  jpxu@mcmaster.ca
†These authors have contributed equally to this work and share first authorship
 Greg Korfanty
 Erin Heifetz†
 Jianping Xu