 Cam Bowie
 Karl Friston
95% of researchers rate our articles as excellent or good
Learn more about the work of our research integrity team to safeguard the quality of each article we publish.
Find out more
BRIEF RESEARCH REPORT article
Front. Public Health , 15 November 2022
Sec. Public Health Policy
Volume 10 - 2022 | https://doi.org/10.3389/fpubh.2022.999210
Objectives: Predicting the future UK COVID-19 epidemic allows other countries to compare their epidemic with one unfolding without public health measures except a vaccine program.
Methods: A Dynamic Causal Model was used to estimate key model parameters of the UK epidemic, such as vaccine effectiveness and increased transmissibility of Alpha and Delta variants, the effectiveness of the vaccine program roll-out and changes in contact rates. The model predicts the future trends in infections, long-COVID, hospital admissions and deaths.
Results: Two-dose vaccination given to 66% of the UK population prevents transmission following infection by 44%, serious illness by 86% and death by 93%. Despite this, with no other public health measures used, cases will increase from 37 million to 61 million, hospital admissions from 536,000 to 684,000 and deaths from 136,000 to 142,000 over 12 months. A retrospective analysis (conducted after the original submission of this report) allowed a comparison of these predictions of morbidity and mortality with actual outcomes.
Conclusion: Vaccination alone will not control the epidemic. Relaxation of mitigating public health measures carries several risks, which include overwhelming the health services, the creation of vaccine resistant variants and the economic cost of huge numbers of acute and chronic cases.
The recent abandonment of meaningful public health control measures in the UK in August 2021 provides a natural experiment, offering a base-line control population for other countries to assess the effects of their own public health interventions. It does so by providing a fecund opportunity for COVID-19 to spread throughout the population for months to come. How many people will be infected in the next year? How many will suffer long-COVID? How many more people will die of COVID-19? How effective are the vaccines used in the UK—BNT162b2 (38%) and ChAdOx1 (61%)? What will be the likely re-infection rate as vaccine-induced immunity wains?
Dynamic causal modeling is well-suited for predicting the effects of letting the virus sweep through the population because it combines conventional epidemiological models with behavioral modeling at the population level (i.e., it models and predicts both fluctuations in prevalence and contact rates) (1). Its predictions can provide a base-line for other countries as they monitor the effects of their public health control efforts. “If you do nothing except vaccinate—this is what will happen.”
An advantage of dynamic causal models is that they are designed to continually assimilate data and update model parameters, such as transmissibility of the virus, changes in physical distancing and vaccine coverage—to accommodate changes in population dynamics and virus behavior. The September 25th, 2021 model was used to explore the effect of increased transmission risk of the Delta variant and the likely seasonal effect of the coming winter. Vaccine effectiveness with Delta and the curtailment of physical distancing as well as the potential benefit of a successful find, test, trace, isolate and support scheme were also incorporated into the model.
The model is fully described—in accord with good practice in open science—and a weekly dashboard provides up-to-date estimates and projections (2). The annotated software is freely available and can be used to model datasets from other countries (3–7). Other researchers have used this kind of state space modeling (8–10), but not with the added features of the dynamic causal model used in our work, which includes a form of agent-based behavioral modeling. In other words, the conventional SEIR model is absorbed into a larger state space model that accounts for changes in behavior (e.g., tendency to self isolate) and testing (e.g., availability and uptake).
As such dynamic causal modeling stands apart from most modeling in epidemiology by predicting mitigated outcomes—and quantifying the uncertainty associated with those outcomes. This stands in contrast to quantitative epidemiological forecasts that do not consider the effect of prevalence on socio-behavioral responses. Usually, these projections are over few weeks—and rest upon fitting curves to the recent trajectory of various data; e.g., (11, 12). In contrast, dynamic causal modeling considers what is most likely to happen, based upon a generative model that best explains all the data available. This mandates a model of socio-behavioral responses that mitigate viral transmission, such as physical distancing, lockdown, testing and tracing. In turn, this requires a detailed consideration of how various sorts of data are generated. For example, it has to model fluctuations in testing capacity and sampling bias due to people self-selecting when symptomatic. The advantage of this kind of modeling is that any data generated by the model can be used to inform the model parameters that underwrite fluctuations in latent states, such as the prevalence of infection. Latent states refer to those states of the population that cannot be estimated directly and have to be inferred from observable data.
Dynamic causal modeling therefore focuses—not on worst-case scenarios but—on the most likely outcomes, given concurrent predictions of viral transmission, responses in terms of behavioral interventions and changes in the way that the epidemic is measured (e.g., confirmed cases, death rates, hospital admissions, and testing capacity). Crucially, dynamic causal modeling brings two things to the table. The first is the use of variational procedures to assess the quality of—or evidence for—any given model. This means that the model adapts to the available data; in the sense that the best model is taken to be the model with the greatest evidence, given the current data. As time goes on, the complexity of the model increases, in a way that is necessary to explain the data accurately. Technically, log evidence (a.k.a., marginal likelihood) is accuracy minus complexity—and both are a function of the data (13). This means there is an optimal model complexity or expressivity for any given timeseries data.
The second advantage of dynamic causal modeling is a proper incorporation of uncertainty in the estimation of conditional dependencies. In other words, it allows for the fact that uncertainty about one parameter affects uncertainty about another. This means dynamic causal models generally have a large number of parameters, such that the conditional uncertainty about all the parameters is handled together. This furnishes a model that is usually very expressive and may appear over-parameterized. However, by optimizing the prior probability density over the model parameters, one can optimize the complexity (c.f., the effective number of parameters), using Bayesian model selection (14–16). Note that the ability to pursue this form of structure learning rests on being able to estimate the model evidence or marginal likelihood, which is one of the primary raisons d'être for the variational procedures used in dynamic causal modeling (17–19).
These potential advantages can be leveraged to model a large variety of data types, to fit an expressive model of epidemiological trajectories and, implicitly, produce posterior predictive densities over measurable outcomes. In other words, parameterizing behavioral responses—such as physical distancing—as a function of latent states, enables the model to guess how we will respond in the future, with an appropriate uncertainty. This is the basis of the predictions of mitigated responses above.
The model includes all the standard SEIR (susceptible, exposed, infected, removed) features of the commonly used models of infectious disease but in addition incorporates the interactions between the population and COVID-19. For example, people are more likely to stay at home if the prevalence is high or if they have not been immunized. These dependencies are estimated and only retained if they improve the ability of the model to account for the data. Having optimized the model and model parameters, one can then proceed with scenario modeling to evaluate the effect of interventions such as the influence of an enhanced find, test, trace, isolate and support system on the epidemic.
Standard SEIR models depend on the choice of parameters, some of which are unknown empirically and must be guessed. Dynamic causal modeling is, by comparison, relatively assumption free. However, one must specify prior ranges for parameters (just like for SEIR models) but the dynamic causal model adjusts the parameters to fit the data in the most efficient and parsimonious way possible. Not only does the model provide estimates and projections of variables such as the death rate, the effective reproductive number, incidence, and prevalence but it also estimates of transmissibility, susceptibility, latent resistance, herd immunity, expected physical distancing behavior and vaccine effectiveness.
Two features provide insight into the way the model describes the interaction of the population and COVID-19. The first is the accuracy of the model in modeling the past stages of the epidemic. The second is the ability of the model to predict what will happen if we carry on as we have so far.
The latest data from Public Health England and the COVID-19 Infection Survey of the Office of National Statistics (ONS) (20, 21) were used. It is assumed that mitigation efforts in schools will not take place, that lockdown will not be re-imposed, and that no new more virulent variant will arrive despite our porous borders and minimal travel restrictions. IHME provides estimates of national incidence (22). The trend in the use of non-pharmaceutical interventions by the UK government is measured using the Oxford Tracker stringency index (23).
The changing transmissibility of the virus—as new variants emerge—is included in the model (modeled with a set of temporal basis functions). For example, the Alpha variant was estimated to be about 50% more transmissible than the original variants and the delta variant was estimated to be about 50% more transmissible than the Alpha variant. These estimates are consistent with empirical estimates (24–27). The mix of vaccines used in the UK up to September 15th, 2021 was ChAdOx1 −53%, BNT162b2 −45% and mRNA1273 (Moderna)−3% (28). The NHS vaccine scheme by September 15th, 2021 had provided two doses to 66% of the population (29).
Three scenarios were explored. The first (NPI1) provides the projections with baseline parameters. The second scenario (NPI2) improves the find, test, trace, isolate and support system from 30 to 50% effectiveness. The third scenario (NPI3) increases the find, test, trace, isolate and support system to 80% effectiveness.
The latest Office of National Statistics infection survey dated September 5th, 2021 finds 831,000 people self-reporting post-acute COVID-19 syndrome (symptoms persist more than 12 weeks after presumed COVID-19 infection) (30).
The figures in Figure 1 can be reproduced using annotated (MATLAB/Octave) code that is available as part of the free and open-source academic software SPM. The routines are called by a demonstration script that can be invoked by DEM_COVID, DEM_COVID_X, DEM_COVID_T, DEM_COVID_I, or DEM_COVID_LTLA at the MATLAB prompt. At the time of writing, these routines are available in the development version of the next SPM release. An archive of the relevant source code for each publication is available from figshare.
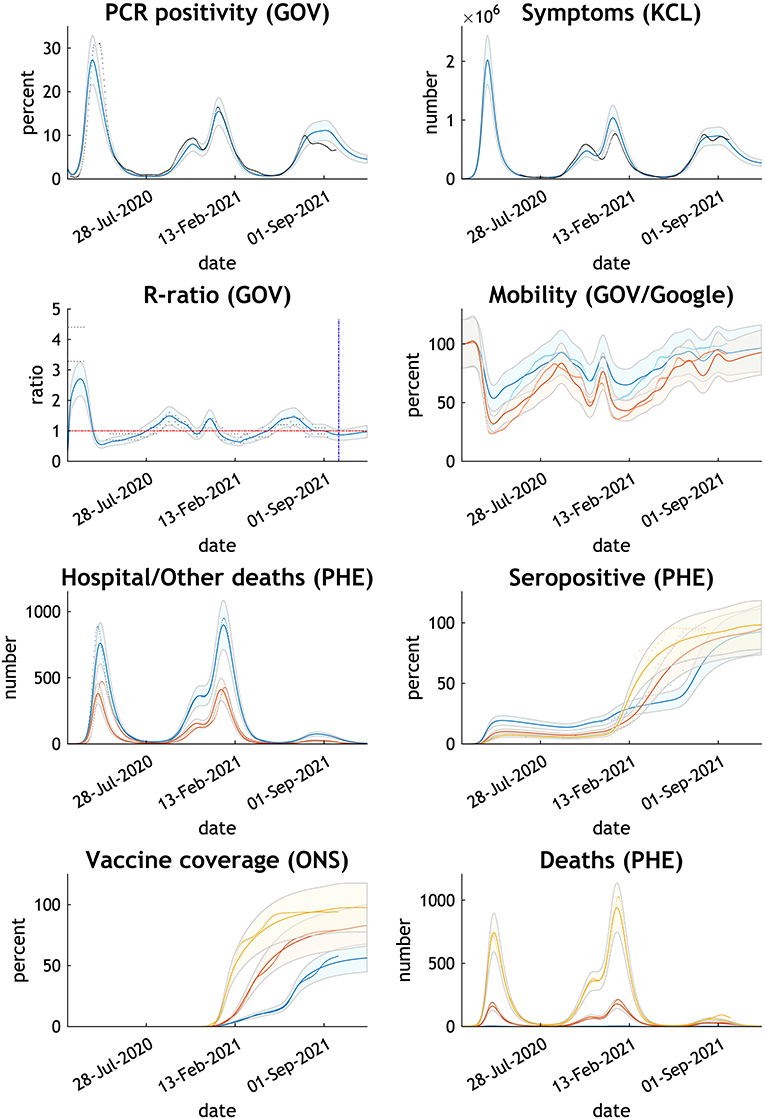
Figure 1. Comparing the actual with expected trends in eight measures of the COVID-19 epidemic UK—February 2020 to October 2021. Thick lines or dots are published data; thin lines and shades are Dynamic Causal Model estimates with 90% Bayesian credible intervals. GOV relates to NHS and Department of Health published data, KCL to Covid Health Study, PHE to Public Health England, and ONS to Office of National Statistics. Mobility GOV in blue; Google in orange. Hospital deaths in blue; other deaths in orange. Seropositive, vaccine coverage and deaths by age group - blue 15–34 years, orange 35–69 years, yellow 70+ years.
The remaining results in this paper can be reproduced using modified scripts found at https://www.dropbox.com/sh/79f9xu7dkd4kjul/AACb41iy4pjgPQlnXWG_VIZAa?dl=0.
The routine data used in the manuscripts are available from the COVID-19 Data Repository by the Center for Systems Science and Engineering at Johns Hopkins University, Coronavirus (COVID-19) UK Historical Data by Tom White and GOV.UK Coronavirus (COVID-19) in the UK. The CSV files must be available from the MATLAB path. The specific data on vaccine effectiveness are found in the Office of National Statistics and Public Health England publications (31, 32).
The chosen parameters adjusted by the model reproduce the epidemic curve and infection sequelae experienced by the UK up to the time of writing (Figure 1). The model estimates antibody immunity induced by COVID-19 infection and/or vaccine is lost in 284 days.
The projections illustrate the depth and persistence of the future epidemic in the UK in terms of morbidity and mortality, transmission characteristics, testing capacity, hospital utilization and disruption due to acute and chronic symptoms over the next 12 months if the government continues to withhold public health infection control measures (Figure 2).
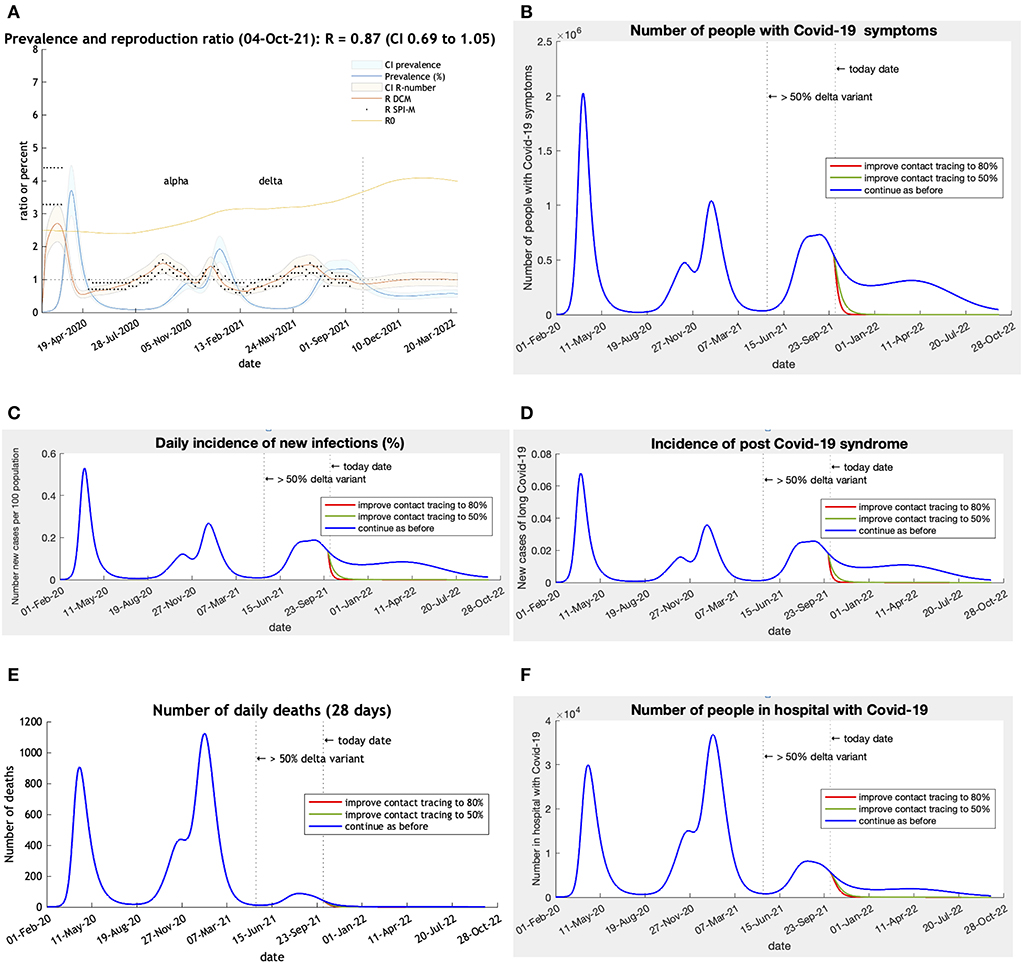
Figure 2. (A–F) CI is 90% Bayesian credible intervals. R DCM is the reproductive number calculated by the Dynamic Causal Model. R SPI-M is the published estimates of the UK government SPI-M-O committee. R0 is an estimate of the changing underlying transmissibility of the viruses in circulation. This estimate includes seasonality effects and may rise to about 6 as winter approaches. 50% Delta variant = date when Delta became the dominant variant. Scenarios: Blue—base-line predictions; Green—Find, test, trace, isolate, Support improved from 27% to 50% effective on 1st October 2021; Red—improved from 30% to 80% effective (80% close contacts isolate within 3 days) on 1st October 2021. Post-Acute Covid-19 Syndrome (using Office of National Statistics definition) assumed to occur in 3.36% of incident cases (19).
The response in the UK to a prolonged wave of COVID-19 infections into the summer of 2022 is moderated by the high vaccine coverage. The vaccines reduce transmission by half compared to the original variants in circulation and pathogenicity for serious illness by 86% and deaths by 93% (Table 1). The effect for an individual is that two-dose vaccination reduces the risk of infection from 100 to 37%, and death from 100 to 0.3%.
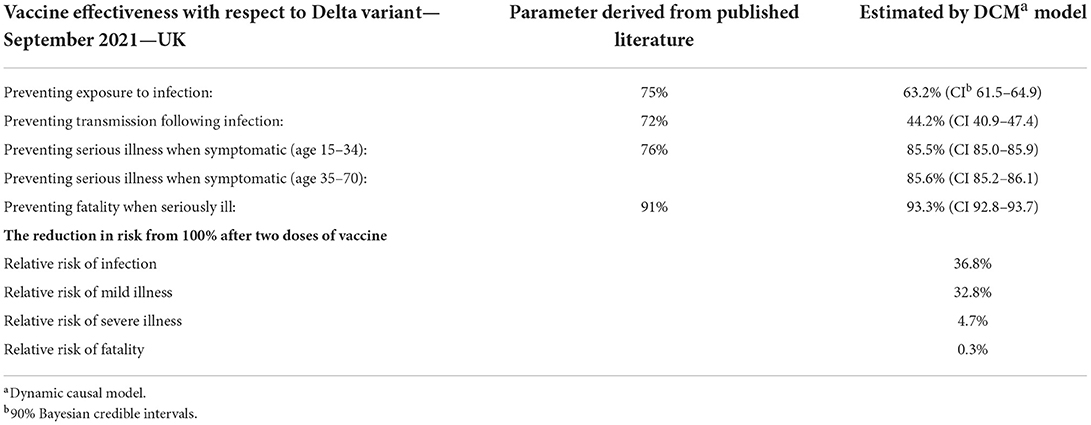
Table 1. Vaccine effectiveness against COVID-19 Delta variant estimated by the dynamic causal model in UK in August 2021.
The trends in morbidity illustrate the consequences of allowing the epidemic to run in an uncontrolled manner through the community in the UK. The model can calculate its cumulative effect on case numbers, deaths, tests and hospital admissions (Table 2). Tests double, cases increase by two-thirds, hospital admissions by a quarter and deaths by 5% over the coming 12 months. An effective find, test, trace, isolate and support system in conjunction with the vaccine program would more or less stop further cases, hospital admissions and deaths.
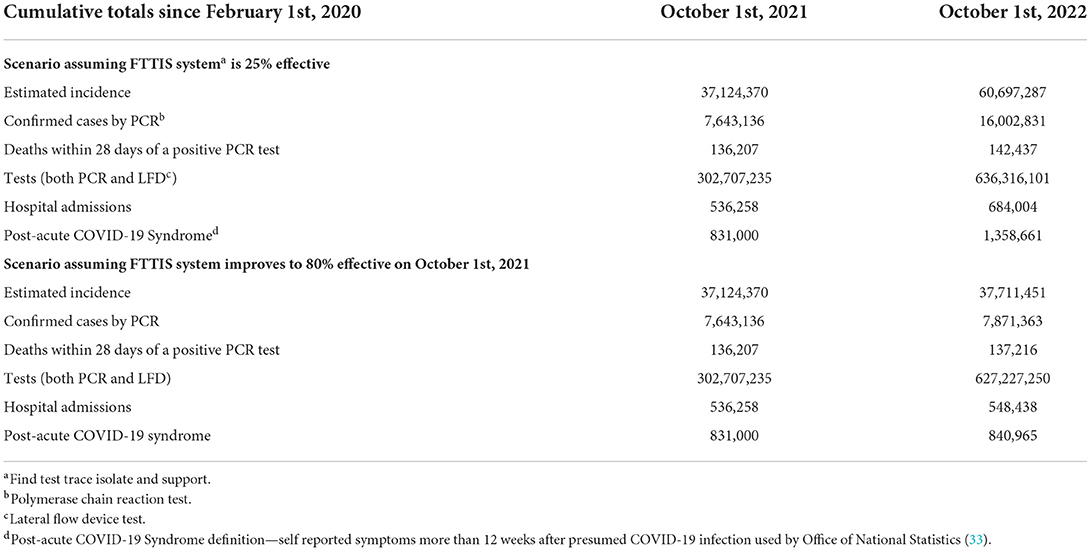
Table 2. The cumulative effect of uncontrolled spread of COVID-19 in the UK—from February 1st, 2020 to October 1st, 2021 and to October 1st, 2022.
The Dynamic Causal Model projects the past into the future assuming conditions such as increased transmission risk, and the levels of testing and non-pharmaceutical interventions remain as before. Differences between the projected and actual numbers should be able to be explained by the features of the epidemic that have changed over the 12 months (Table 3). Since October last year the use of non-pharmaceutical interventions have been abandoned as measured by the Oxford stringency index falling from 41.2 in October 2021 to 11.1 in October 2022 (23, 34). The Omicron variant was designated a variant of Concern on November 26th, 2021 and became the dominant variant in the UK on December 13th, 2021 (35).
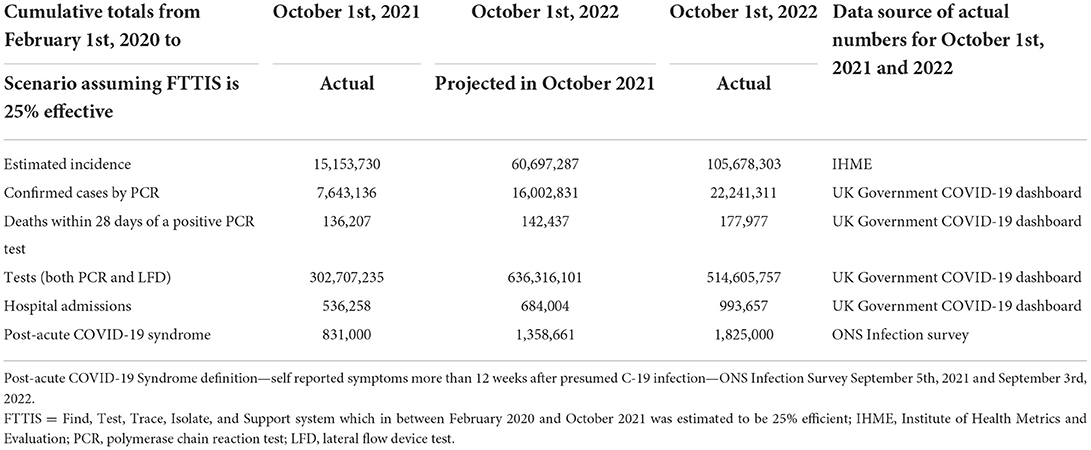
Table 3. Predicted and actual cumulative totals of incidence, deaths, tests, hospital admissions, and long COVID between February 1st, 2020 and October 1st, 2022 in the UK.
The projected total number of new COVID-19 cases was underestimated by 43%. This is likely to be due to the arrival of the Omicron variants and the removal of all public health mandates such as mask wearing and other interventions in the UK. A functioning Find, Test, Trace, Isolate and Support system was never fully established (36). Routine contact tracing ended on February 24th, 2022. In-person testing at test sites and free lateral flow device tests became no longer available on April 1st, 2022. While it was predicted that 26% of cases would be confirmed by a PCR test, in the event only 21% were so confirmed. This was due to policy change increasing reliance on stand-alone LFD tests.
Deaths were underestimated by 20% due to the very high number of cases despite a falling case fatality rate. The number of tests carried out was overestimated by 24% due to the discontinuation of free LFD tests. Hospital admissions were underestimated by 31% which is higher than the underestimation of deaths as the vaccines used in the UK protect more people from deaths than non-fatal acute respiratory distress syndrome requiring hospital admission.
Long COVID was underestimated by 21%. ONS estimated 1.29% (831,000 on September 5th, 2021) and 2.82% (1,825,000 on September 3rd, 2022) of the population had self-reported post-acute COVID-19 syndrome of more than 12 weeks duration (33). This is equivalent to 2.2% of cases in October 2021, which if staying at that proportion of cases would increase to 1,359,000 by October 2022. In fact, the latest estimate from the national COVID-19 infection survey is 1,825,000 or 1.7% of infections. So, despite a lower proportion of infections developing long term symptoms, our underestimate can be explained by the higher number of infections which actually occurred.
The UK provides a baseline of public health inactivity which can be used to compare public health controls chosen by other countries. The vaccines used in the UK seem to be extremely effective at reducing morbidity and mortality although not so effective at reducing transmission. Loss of immunity in 284 days as estimated by the model is similar to the results (extrapolated to 344 days) of the Office of National Statistics study (37) (Supplementary Table S4) suggests booster doses of vaccine may be required.
Despite these very effective vaccines, the UK can expect a large further wave of COVID-19 infections resulting in over half a million additional post-acute COVID-19 Syndrome cases, 150,000 hospital admissions and 300 million additional tests. If other mitigating public health measures were employed to support the vaccine effects this further epidemic would be eliminated. Simply making contact tracing effective would achieve that possibility.
The size of the projected wave of infections provides fertile ground for new variants and the absence of border controls will allow new variants from other countries to invade the UK. A health service already exhausted will be rapidly overwhelmed. The lack of effective public health resources will be unable to respond to current or future variants. This means that the UK government may find it has to re-introduce restrictive lockdowns. The excellent scientific institutions in the UK will be able to monitor such features as genomic sequencing, vaccine efficacy, and new vaccine trials. How long the population is prepared to be the guinea pig remains to be seen.
One of the values of using dynamic causal modeling is the ability to test pre-conceived ideas and allow the epidemic itself to inform its own modeling as it unfolds. The method also offers a factorial view of the epidemic rather than a unidimensional view as provided by standard SEIR models. The dynamic causal model allows an interplay between the various effects of behavior, epidemiology and seasonality that are key to the control of the epidemic. For instance, the non-mandatory response to an increase in COVID-19 prevalence is one of the factors used in the model. This provides insight into how individuals will respond to surges in prevalence based upon responses to previous fluctuations.
The Dynamic Causal Model can project the past into the future assuming systematic changes in the infectivity of the virus, and the levels of testing and non-pharmaceutic interventions. Differences between the projected and actual numbers should, in principle, be explained by the features of the epidemic that have changed over the 12 months. Our predictions underestimated the size of the epidemic over a 12-month period. A retrospective analysis suggests that this underestimate is due to the emergence of the Omicron variants and the abandonment of non-pharmaceutical interventions by the government.
The limitations of dynamic causal modeling predictions are non-trivial. While the model is able to factor in past behavior it cannot predict the biological characteristics of a new COVID-19 variant. However, the characteristics of new variants such as increases in transmissibility, decreases in virulence, and their response to vaccines can be included in the model—and validated against empirical estimates. Finally, it should always be acknowledged that uncertainty about the model per se is often ignored in this kind of modeling. In other words, although the model has been updated to maximize model evidence, it is just one model and other functional forms may, in principle, have a greater evidence and, implicitly, predictive validity.
In summary, the lessons for other countries are clear. Do not depend solely on vaccination. Relaxation of mitigating public health measures carries several risks—overwhelming the health service again, the creation of vaccine resistant variants, and the economic cost of huge numbers of acute and chronic cases.
The original contributions presented in the study are included in the article/supplementary material, further inquiries can be directed to the corresponding author.
CB chose the topic, wrote the scripts for the scenarios and modifications to the DCM model, and wrote the draft paper. KF designed the DCM model. Both authors wrote the final version of the paper, contributed to the article, and approved the submitted version.
KF was supported by Wellcome through core funding to the Wellcome Center for Human Neuroimaging, UCL Queen Square Institute of Neurology (203147).
The authors declare that the research was conducted in the absence of any commercial or financial relationships that could be construed as a potential conflict of interest.
All claims expressed in this article are solely those of the authors and do not necessarily represent those of their affiliated organizations, or those of the publisher, the editors and the reviewers. Any product that may be evaluated in this article, or claim that may be made by its manufacturer, is not guaranteed or endorsed by the publisher.
1. Friston KJ, Parr T, Zeidman P, Razi A, Flandin G, Daunizeau J, et al. Dynamic causal modelling of COVID-19. Wellcome Open Res. (2020) 5:89. doi: 10.12688/wellcomeopenres.15881.1
2. Karl, Friston,. Dynamic Causal Modelling of COVID-19; Dashboard. Available online at: https://www.fil.ion.ucl.ac.uk/spm/covid-19/ (accessed May 24, 2021).
3. Gandolfi D, Pagnoni G, Filippini T, Goffi A, Vinceti M, D'Angelo E, et al. Modeling early phases of COVID-19 pandemic in Northern Italy and its implication for outbreak diffusion. Front Public Health. (2021) 9:e724362. doi: 10.3389/fpubh.2021.724362
4. Moran RJ, Fagerholm ED, Cullen M, Daunizeau J, Richardson MP, Williams S, et al. Estimating required “lockdown” cycles before immunity to SARS-CoV-2: Model-based analyses of susceptible population sizes, “S0”, in seven European countries including the UK and Ireland. arXiv:200405060 [q-bio]. (2020). doi: 10.1101/2020.04.10.20060426
5. Daunizeau J, Moran R, Brochard J, Mattout J, Frackowiak R, Friston K. Modelling Lockdown-Induced 2nd COVID Waves in France. New York, NY: Cold Spring Harbor Laboratory Press (2020).
6. Dynamic Causal Modelling of COVID-19 and Australian Projections. Available online at: http://www.adeelrazi.org/predictions.html (accessed September 27, 2021).
7. Friston KJ, Parr T, Zeidman P, Razi A, Flandin G, Daunizeau J, et al. Second waves, social distancing, and the spread of COVID-19 across the USA. Wellcome Open Res. (2021) 5:103. doi: 10.12688/wellcomeopenres.15986.3
8. Osthus D, Hickmann KS, Caragea PC, Higdon D, Valle SYD. Forecasting seasonal influenza with a state-space SIR model. Ann Appl Stat. (2017) 11:202–24. doi: 10.1214/16-AOAS1000
9. Asher J. Forecasting Ebola with a regression transmission model. Epidemics. (2018) 22:50–5. doi: 10.1016/j.epidem.2017.02.009
10. Kobayashi G, Sugasawa S, Tamae H, Ozu T. Predicting intervention effect for COVID-19 in Japan: state space modeling approach. Biosci Trends. (2020) 14:174–81. doi: 10.5582/bst.2020.03133
11. MRC, Biostatistics Unit. Nowcasting and Forecasting of the COVID-19 Pandemic. In: MRC Biostatistics Unit. Available online at: https://www.mrc-bsu.cam.ac.uk/tackling-covid-19/nowcasting-and-forecasting-of-covid-19/ (accessed July 20, 2022).
12. Birrell P, Blake J, van Leeuwen E, Gent N, De Angelis D. Real-time nowcasting and forecasting of COVID-19 dynamics in England: the first wave. Philosop Trans R Soc B Biol Sci. (2021) 376:20200279. doi: 10.1098/rstb.2020.0279
13. Penny WD. Comparing dynamic causal models using AIC, BIC and free energy. Neuroimage. (2012) 59:319–30. doi: 10.1016/j.neuroimage.2011.07.039
14. Hoeting JA, Madigan D, Raftery AE, Volinsky CT. Bayesian model averaging: a tutorial. Statist Sci. (1999) 14:382–401. doi: 10.1214/ss/1009212519
15. Friston K, Parr T, Zeidman P. Bayesian model reduction. arXiv. New York, NY: Cornell University (2019) Preprint. doi: 10.48550/arXiv.1805.07092
16. Friston K, Penny W. Post hoc Bayesian model selection. Neuroimage. (2011) 56:2089–99. doi: 10.1016/j.neuroimage.2011.03.062
17. Friston K, Mattout J, Trujillo-Barreto N, Ashburner J, Penny W. Variational free energy and the Laplace approximation. Neuroimage. (2007) 34:220–34. doi: 10.1016/j.neuroimage.2006.08.035
18. Beal MJ,. Variational algorithms for approximate Bayesian inference. (Doctoral thesis). University College London (2003). Available online at: https://discovery.ucl.ac.uk/id/eprint/10101435/ (accessed October 31, 2022).
19. Winn J, Bishop CM. Variational message passing. J Mach Learn Res. (2005) 6:661–94. Available online at: http://jmlr.org/papers/v6/winn05a.html
20. England Summary | Coronavirus (COVID-19) in the UK. Available online at: https://coronavirus.data.gov.uk (accessed October 14, 2022).
21. ONS. Coronavirus (COVID-19) Latest Insights - Office for National Statistics. Available online at: https://www.ons.gov.uk/peoplepopulationandcommunity/healthandsocialcare/conditionsanddiseases/articles/coronaviruscovid19latestinsights/infections (accessed September 27, 2022).
22. IHME. COVID-19 Estimation Updates. Institute for Health Metrics and Evaluation (2020). Available online at: http://www.healthdata.org/covid/updates (accessed May 18, 2020).
23. Oxford, Tracker,. COVID-19 Government Response Tracker. Available online at: https://www.bsg.ox.ac.uk/research/research-projects/covid-19-government-response-tracker (accessed September 27, 2022).
24. Davies NG, Abbott S, Barnard RC, Jarvis CI, Kucharski AJ, Munday JD, et al. Estimated transmissibility and impact of SARS-CoV-2 lineage B.1.1.7 in England. Science. (2021) 372:abg3055. doi: 10.1126/science.abg3055
25. Campbell F, Archer B, Laurenson-Schafer H, Jinnai Y, Konings F, Batra N, et al. Increased transmissibility and global spread of SARS-CoV-2 variants of concern as at June 2021. Eurosurveillance. (2021) 26:2100509. doi: 10.2807/1560-7917.ES.2021.26.24.2100509
26. Dagpunar J. Interim Estimates of Increased Transmissibility, Growth Rate, and Reproduction Number of the Covid-19 B.1.617.2 Variant of Concern in the United Kingdom. New York, NY: Cold Spring Harbor Laboratory Press (2021).
27. Graham MS, Sudre CH, May A, Antonelli M, Murray B, Varsavsky T, et al. Changes in symptomatology, re-infection and transmissibility associated with SARS-CoV-2 variant B.1.1.7: an ecological study. medRxiv. (2021). doi: 10.1101/2021.01.28.21250680
28. MHRA. Coronavirus Vaccine - Weekly Summary of Yellow Card Reporting. GOV.UK (2021). Available online at: https://www.gov.uk/government/publications/coronavirus-covid-19-vaccine-adverse-reactions/coronavirus-vaccine-summary-of-yellow-card-reporting (accessed September 27, 2021).
29. Public Health England. COVID-19 Vaccine Surveillance Report - Week 38. London: Public Health England (2021). p. 33.
30. Prevalence of Ongoing Symptoms Following Coronavirus (COVID-19) Infection in the UK - Office for National Statistics. Available online at: https://www.ons.gov.uk/peoplepopulationandcommunity/healthandsocialcare/conditionsanddiseases/bulletins/prevalenceofongoingsymptomsfollowingcoronaviruscovid19infectionintheuk/latest (accessed October 14, 2022).
31. Pouwels KB, Pritchard E, Matthews PC, Stoesser N, Eyre DW, Vihta K-D, et al. Effect of Delta variant on viral burden and vaccine effectiveness against new SARS-CoV-2 infections in the UK. Nat Med. (2021) 27:2127–35. doi: 10.1038/s41591-021-01548-7
32. Public Health England. COVID-19 Vaccine Surveillance Report - Week 33. London: Public Health England (2021). p. 24.
33. ONS. Coronavirus (COVID-19) Latest Insights - Office for National Statistics. Available online at: https://www.ons.gov.uk/peoplepopulationandcommunity/healthandsocialcare/conditionsanddiseases/articles/coronaviruscovid19latestinsights/infections#long-covid (accessed October 4, 2022).
34. Visual FT, Team DJ. Free to Read: Lockdowns Compared: Tracking Governments' Coronavirus Responses. Available online at: https://ig.ft.com/coronavirus-lockdowns (accessed September 27, 2022).
35. UKHSA. Investigation of SARS-CoV-2 Variants: Technical Briefings. GOV.UK. Available online at: https://www.gov.uk/government/publications/investigation-of-sars-cov-2-variants-technical-briefings (accessed September 27, 2022).
36. National Audit Office. Test and Trace in England – Progress Update. National Audit Office. p. 85.
Keywords: Coronavirus, post-acute COVID-19 syndrome, incidence, vaccine effectiveness, compartmental models, public health methodology, epidemiology—descriptive
Citation: Bowie C and Friston K (2022) A 12-month projection to September 2022 of the COVID-19 epidemic in the UK using a dynamic causal model. Front. Public Health 10:999210. doi: 10.3389/fpubh.2022.999210
Received: 20 July 2022; Accepted: 24 October 2022;
Published: 15 November 2022.
Edited by:
Stanca M. Ciupe, Virginia Tech, United StatesReviewed by:
Farid Rahimi, Australian National University, AustraliaCopyright © 2022 Bowie and Friston. This is an open-access article distributed under the terms of the Creative Commons Attribution License (CC BY). The use, distribution or reproduction in other forums is permitted, provided the original author(s) and the copyright owner(s) are credited and that the original publication in this journal is cited, in accordance with accepted academic practice. No use, distribution or reproduction is permitted which does not comply with these terms.
*Correspondence: Cam Bowie, Y2FtLmJvd2llMUBnbWFpbC5jb20=
Disclaimer: All claims expressed in this article are solely those of the authors and do not necessarily represent those of their affiliated organizations, or those of the publisher, the editors and the reviewers. Any product that may be evaluated in this article or claim that may be made by its manufacturer is not guaranteed or endorsed by the publisher.
Research integrity at Frontiers
Learn more about the work of our research integrity team to safeguard the quality of each article we publish.