
94% of researchers rate our articles as excellent or good
Learn more about the work of our research integrity team to safeguard the quality of each article we publish.
Find out more
ORIGINAL RESEARCH article
Front. Public Health , 18 October 2022
Sec. Occupational Health and Safety
Volume 10 - 2022 | https://doi.org/10.3389/fpubh.2022.996664
This article is part of the Research Topic Biomonitoring as an exposure assessment tool in occupational health - challenges and ways forward View all 5 articles
 SUN Junya*
 SUN Ruishan*
To predict the risk of fatigue for flight crews on international flights under the new operating model policy of the civil aviation exemption approach policy during the COVID-19 outbreak, and to provide scientific validation methods and ideas for the exemption approach policy. This paper uses the change in flight crew alertness as a validation indicator, and then constructs an alertness assessment model to predict flight crew fatigue risk based on the SAFTE model theory. Then, the corresponding in-flight rotation plans for the flight is designed according to the exemption approach policy issued by the CAAC, the CCAR-121 part policy and the real operational requirements of the airline, respectively, and finally the simulation results is compared by comparing the pilot alertness and cockpit crew alertness under the exemption approach policy and the CCAR-121 part policy with the flight duration. The results show that the flight crew alertness level for the flight in-flight rotation plan simulation designed under the exemption approach policy is higher or closer to the pilot alertness level for operational flights under the CCAR-121 Part policy. This validates the reasonableness and safety of the exemption approach policy issued by the CAAC to meet the requirements of epidemic prevention and control, and provides scientific support and solutions for fatigue monitoring and management.
Since the COVID-19 outbreak, the Civil Aviation Administration of China (CAAC) has introduced a number of measures to prevent and control the outbreak. In particular, in order to meet the requirements of passenger and cargo transportation in emergency situations and to effectively protect the health of crew members, as well as to cope with the regular management of the COVID-19 epidemic and to regulate the management of extended crew duty periods and flight time for multiple sets of crews operating on intercontinental routes, Document 2020 No. 53 “Implementation Measures for Exemption of Crew Duty Periods and Flight Time Restrictions during the Epidemic” (hereinafter referred to as the “exemption approach policy”) is formulated and issued (1). The exemption approach policy proposed the operation mode of continuous round-trip flight with multiple crews, which makes the flight crew duty period and flight time exceed the limits of the former “Rules for the Operational Qualification of Carriers of Public Air Transport for Large Aircraft” (China Civil Aviation Regulations-121, CCAR-121 part policy) (2). Table 1 compares the restrictions on flight time for flight crews between the exemption approach policy and the CCAR-121 Part policy (1, 2), and finds that the maximum flight time in the exemption approach policy is 8–13 h more than that of CCAR-121 part policy, and the number of crew members equipped is twice as much as that of CCAR-121 part policy, i.e., the exemption approach policy intends to mitigate crew fatigue measures by increasing the number of flight crews and optimizing rest facilities on board aircraft, which in turn extends it is expected that the exemption approach policy will effectively reduce the risk of crew members contracting epidemics, reduce the workload of the crew and alleviate the risk of crew fatigue, thus ensuring the safe and reliable operation of flights. However, there is a lack of theoretical analysis and scientific validation of the safety and risk of pilot fatigue associated with this mode of operation, which exceeds the limits of the previous regulations and attempts to increase flight time by increasing the number of people.
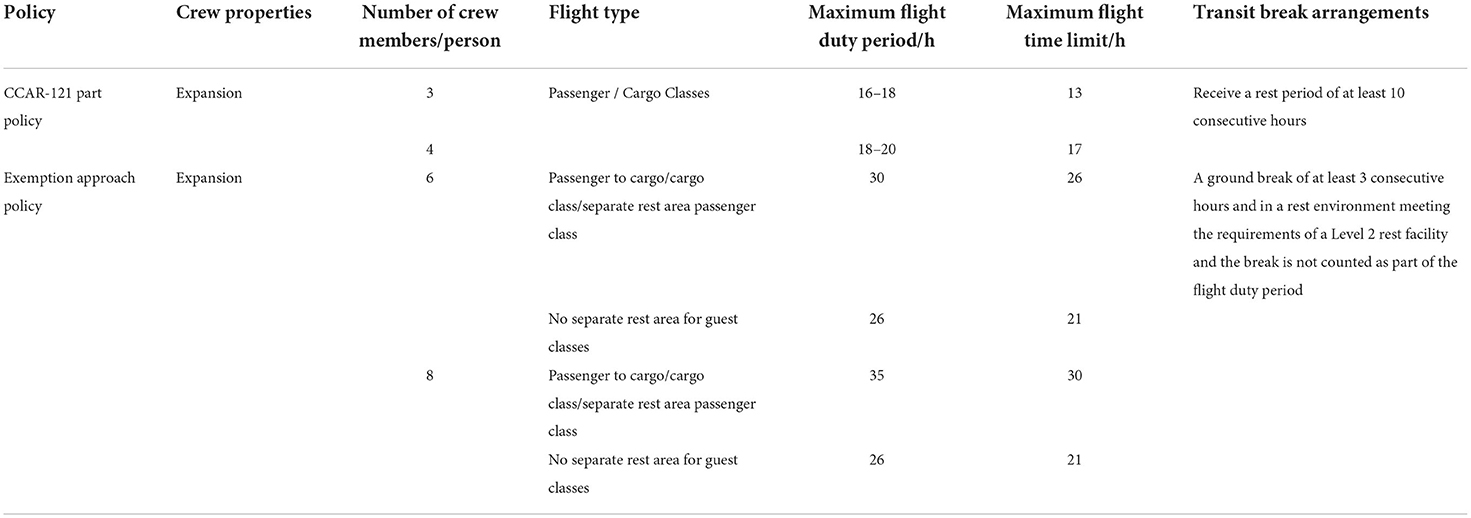
Table 1. Restrictions on the flight time of the crew in the immunization exemption approach policy and CCAR-121 part policy.
There are more methods to predict and monitor changes in pilot alertness and fatigue risk, of which biomathematical modeling is a better optional tool among the prediction methods, and it is also a scientific analysis method that is now internationally accepted (3). For example, in 2012, the Fatigue Risk Management System document published by ICAO positioned biomathematical modeling as a viable method for predicting flight crew fatigue risk identification (4). A biomathematical model is a series of mathematical models in the form of a system of equations using physiological parameters related to the organism as input data. It integrates scientific research and flight production planning/scheduling related to fatigue risk, such as human circadian rhythms, sleep, workload and alertness, to better visualize the trend of fatigue during the planned duty period and to predict potential fatigue risk (3, 4). Biomathematical models can therefore assist in the development of optimal scheduling schedules, as well as risk assessment of scheduling schedules and can optimize crew pairings and scheduling costs, in addition to providing assistance in the investigation of safety incidents. Most of the biomathematical models currently used for predictive assessment of fatigue risk have been constructed and developed on the basis of two processes of sleep regulation (5), such as the three-process model of alertness (TPMA) (6), the circadian alertness simulator (CAS) (7), the system for aircrew fatigue evaluation (SAFE) (8), and the sleep/wake predictor (SAFE) (9), fatigue dynamic fatigue audit interDyne (FAID) (10), and Interactive Neurobehavioral Model (INM) (11). In addition, in 2003, Hursh (12) developed a model of sleep, activity, fatigue and task efficiency (SAFTE) based on sleep-activity patterns, circadian rhythms and sleep inertia processes. The model can predict the alertness of the human body at each moment of the day and gives the alertness value for each moment of attention. Therefore, it can be widely used to predict and monitor the fatigue risk of human body in the process of work.
The model inputs are “previous or predicted sleep and activity patterns of the person”; the model outputs are “Modeling circadian oscillators for humans, Calculating the amount of effective sleep in a sleep reservoir based on a person's sleep and activity patterns, and calculate the efficiency of performing tasks based on the above oscillations and sleep reservoirs based on the sleep/wake data, etc.” Note in particular that the predicted outcome of alertness (effectiveness) is usually expressed as a change in cognitive validity based on a comparison of baseline levels in percentage terms (12). Therefore, the alertness (effectiveness) measures calculated by SAFTE are expressed as percentage. Based on the characteristics of the biomathematical model that “comparing scores is better than complying with thresholds” (13, 14), The SAFTE model therefore also does not provide an acceptable level of alertness. That is, the predictions are derived by comparing the percentage values of alertness at two points in time (12). However, the SAFTE model also reports that studies of total sleep deprivation show that cognitive capacity is depleted at a rate of approximately 25% per day, such an extreme level of alertness (12).
The circadian process influences both performance modulation and sleep regulation. The performance modulation, including factors are sleep inertia, circadian rhythm, performance and effectiveness, the performance modulation depends on the circadian process, sleep inertia, and the current balance of the sleep reservoir. The sleep regulation, including factors are sleep quality, sleep intensity, sleep accumulation, sleep debt and fragmentation (namely awakenings during periods of sleep), the sleep regulation depends on the hour of asleep and awake, the circadian process and sleep debt. Mathematical modeling can be used to simulate the physiological processes mentioned above, this can be implemented on software such as matlab for general purpose digital computers (12, 15, 16).
This paper presents numerical simulation predictions of flight crew and crew alertness in the cockpit under both exemption approach policy and CCAR-121 part policy restrictions. By comparing the exemption approach policy with the flight fatigue risk prediction results of CCAR-121 part policy, the problem of assessing and monitoring the fatigue risk of crew members at various moments during duty and flight is solved, and the problem of measuring the fatigue risk of pilots is also solved, which is of great significance to the pre-intervention of flight fatigue of crew members before duty, the monitoring of changes in the cognitive ability of crew members in the cockpit and the safeguarding of flight safety on routes.
One potential application of the SAFTE model is that the effectiveness of a crew's work during the day can be assessed based on past or future sleep patterns (12). We therefore construct an alertness assessment model for the predictive assessment of alertness during a single flight for exempt flight crews.
The circadian oscillators (12, 15, 16) are represented by the following equation:
Where, T is the time of day, p is the cosine phase with a period of 24 h, p'is the cosine phase with a period of 12 h, β is the cosine amplitude with a period of 12 h.
The performance rhythm (12, 17) is represented by the following equation:
Where, c is the circadian oscillators; ap is the amplitude of the alertness rhythm (12), is represented by the following equation:
Where, a1 is a constant alertness rhythm amplitude factor, a2 is a variable alertness rhythm amplitude factor, Rc is the total capacity of the sleep reservoir, Rt is the capacity of the sleep reservoir at time t.
Described in terms of a sleep “reservoir” (12), the sleep-wake homeostatic process can be described as an equilibrium Rt process in the current sleep reservoir, regulated by sleep accumulation and wakefulness consumption, with the following expressions:
Where, Rt is the capacity of the sleep reservoir at time t, Rt − 1 is the capacity of the sleep reservoir at moment t-1, S is sleep accumulation, P is alertness consuming.
Equation (4) relates to the sleep accumulation S in the sleep stage, consisting of sleep intensity and sleep debt, which is expressed as follows (12):
Where, SI is the sleep intensity, t″ is the sleep time, SPis the sleep tendency, SD is the sleep Debt, m is the sleep propensity value, as is the sleep tendency amplitude, c is the function of circadian rhythm, f is the feedback amplitude, Rc is the total capacity of the sleep reservoir, Rt is the capacity of the sleep reservoir at time t.
Equation (4) relates to the alertness consumption P during the awakening phase and consists of the product of the alertness consumption rate and the working time, which is expressed as follows (12):
Where, K is the rate of alertness consumption, t′ is the working hours.
The third factor, sleep inertia I, is influenced by the moment of awakening and the intensity of sleep and is expressed as follows (6, 12):
Where, Imaxis the maximum sleep inertia value, ta is the moment of awakening, SIis the leep intensity, i is the time constant of inertia 2 h after awakening.
From the above equation, the model outputs the human alertness E at moment t of the day, which is expressed as follows (12):
Where, Rc is the total capacity of the sleep reservoir, Rt is the capacity of the sleep reservoir at time t; C is alert rhythms; I is the sleep inertia.
In addition, Table 2 gives the default values for the parametric variables used in the model.
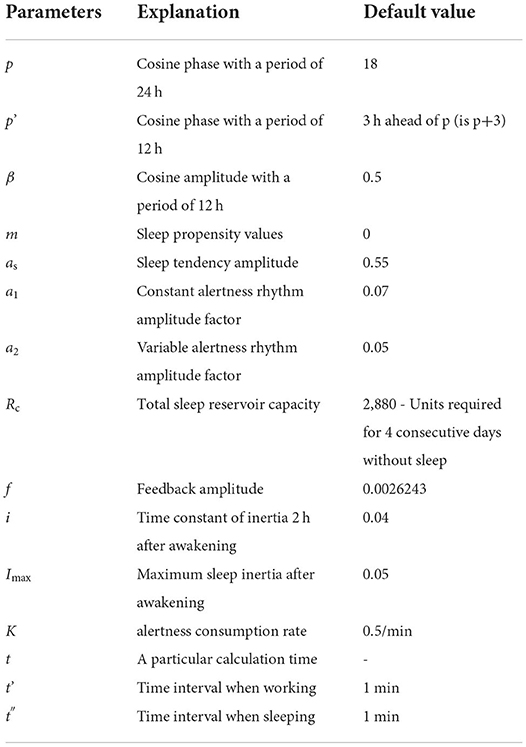
Table 2. Default values of relevant parameter variables in the cognitive effective competence assessment model.
The above constructed flight crew alertness assessment model based on SAFTE was developed in code on Matlab R2020b software. In addition, the time involved in the model and the code is determined by the plans of the rotation during the in-flight, the following will design the flight crew work rotation plans during the in-flight in accordance with the exemption policy and the CCAR-121 policy.
The in-flight rotation plan for flights under both the exemption approach and CCAR-121 part policies are designed according to the policy restrictions of the Bureau and the operational requirements of an airline mentioned above. All times in the flight are in Beijing time and the flight crew consists of 2 pilots each. The specific in-flight rotation schedule is shown in Tables 3–6.
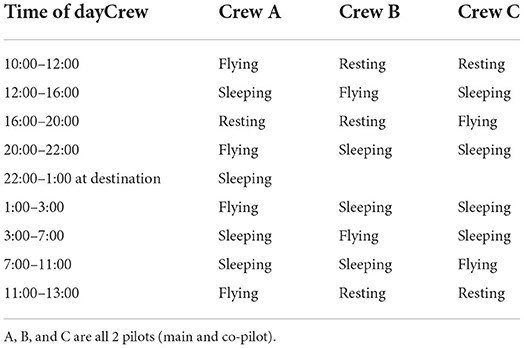
Table 3. Flight work plan for a particular flight under exempted approach operation (3 sets of expansion crews).
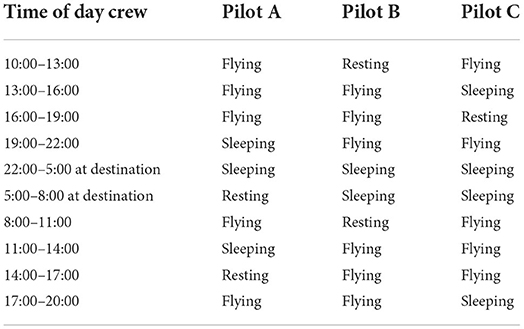
Table 4. Flight work plan for a particular flight under CCAR-121 part policy department operations (3 expansion crews).
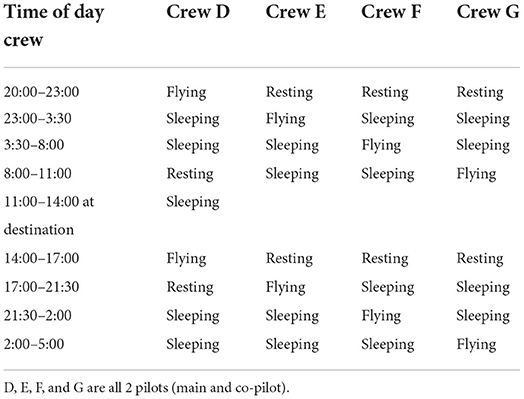
Table 5. Flight work plan for a particular flight under exempted approach operations (4 sets of expansion crews).
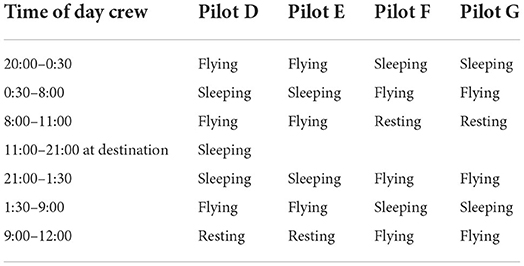
Table 6. Flight work plan for a particular flight under CCAR-121 part policy section operations (4 pilots expansion crews).
Combining the constructed flight crew alertness assessment model and the designed in-flight rotation plan, Matlab R2020b software is applied to carry out model simulation calculations, and the results are as follows.
Figure 1A shows the model simulation results of flight crew A's alertness with flight time, it is found that flight crew A's alertness remained above 82.11% during the flight, and the maximum change in alertness before and after shift work is 5.25%; Figure 1B shows the model simulation results of flight crew B's alertness with flight time, it is found that flight crew B's alertness is at its lowest point at the end of the return flight shift, at 67.55%, and the maximum change in alertness before and after shift work is 12.41%. The lowest point of alertness is 67.55%, and the maximum change in alertness before and after the shift is 12.41%. Figure 1C shows the results of the model simulation of the change in alertness of flight crew C with flight duration, and it is found that the lowest point of alertness of flight crew C is 74.41% during the return flight shift, but the lowest point occurred during the flight shift, and the maximum change in alertness before and after the flight shift is 10.59%. The lowest point of alertness is 67.55% at the end of Flight Crew B's return shift, and the lowest point of alertness is found during the cruise phase of the return flight.
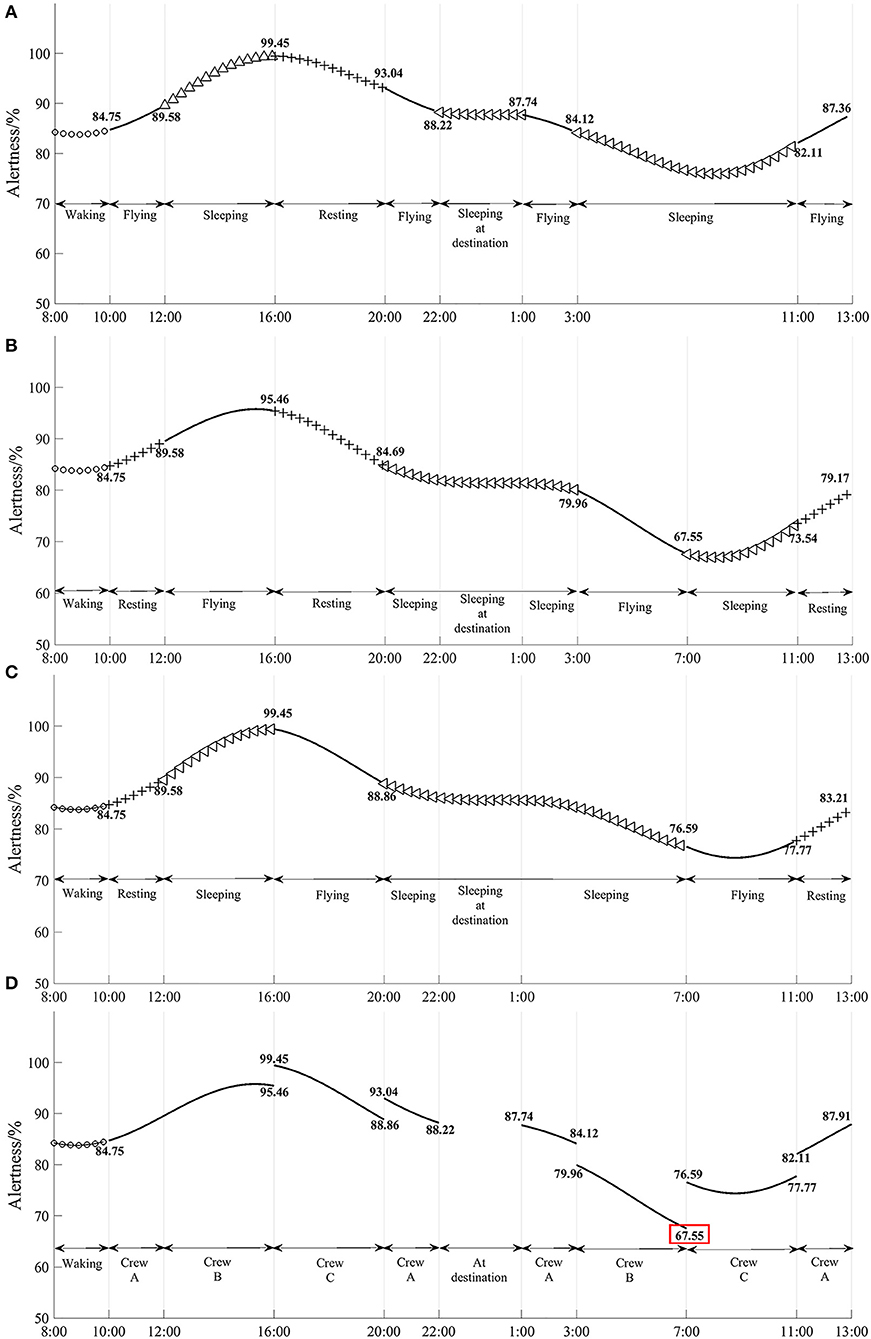
Figure 1. (A–D) Variation in the alertness of each flight crew and its cockpit crew with flight hour for flights subject to the exemption approach policy (3 sets of crews).
Figure 2A shows the model simulation results of Pilot A's alertness with flight duration, and it is found that Pilot A's alertness remained above 73.49% during the flight, with a maximum change of 9.43% before and after shift work. The lowest point of alertness is 68.02%, and the maximum change in alertness before and after the flight shift is 14.2%. Figure 2C shows the model simulation results of Pilot C's alertness as a function of flight time. It is found that Pilot C's alertness remained above 72.31% throughout the flight, with a maximum change of 9.62% before and after the shift work. The lowest point of alertness is 68.02% when Pilot B landed on the return leg.
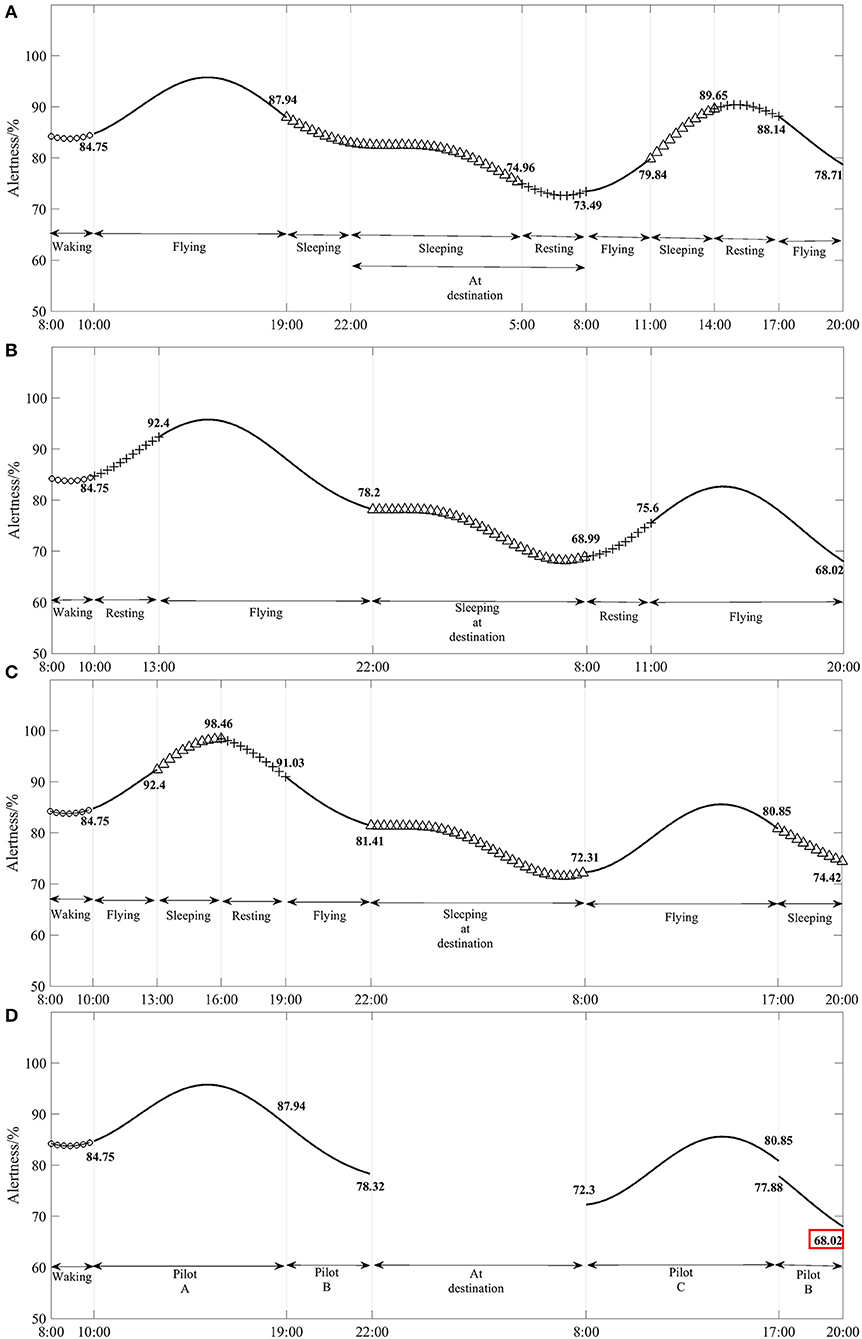
Figure 2. (A–D) Variation in flight crew and their cockpit crew alertness with flight hour for flights under CCAR-121 part policy restrictions (3 pilots).
Figure 3A shows the model simulation results of the change in alertness of Flight Crew D with flight duration. Figure 3B shows the model simulation results of Flight Crew E's alertness as a function of flight time, and it is found that Flight Crew E's alertness remained at 79.51% throughout the flight and shift work phases, and the maximum change in alertness before and after shift work is 13.21%. Figure 3C shows the model simulation results of the change in alertness of Flight Crew F with flight time, and it is found that the lowest point of alertness of Flight Crew F is 76.05% at the end of the departure shift, and the maximum change in alertness before and after the shift is 12.37%. The lowest point of alertness is 76.29% during landing, and the maximum change in alertness before and after shift work is 8.26%. Figure 3E shows the results of the model simulation of the change in crew alertness in the cockpit with flight duration. The lowest point of alertness throughout the flight occurred at 76.05% at the end of the flight crew G departure shift.
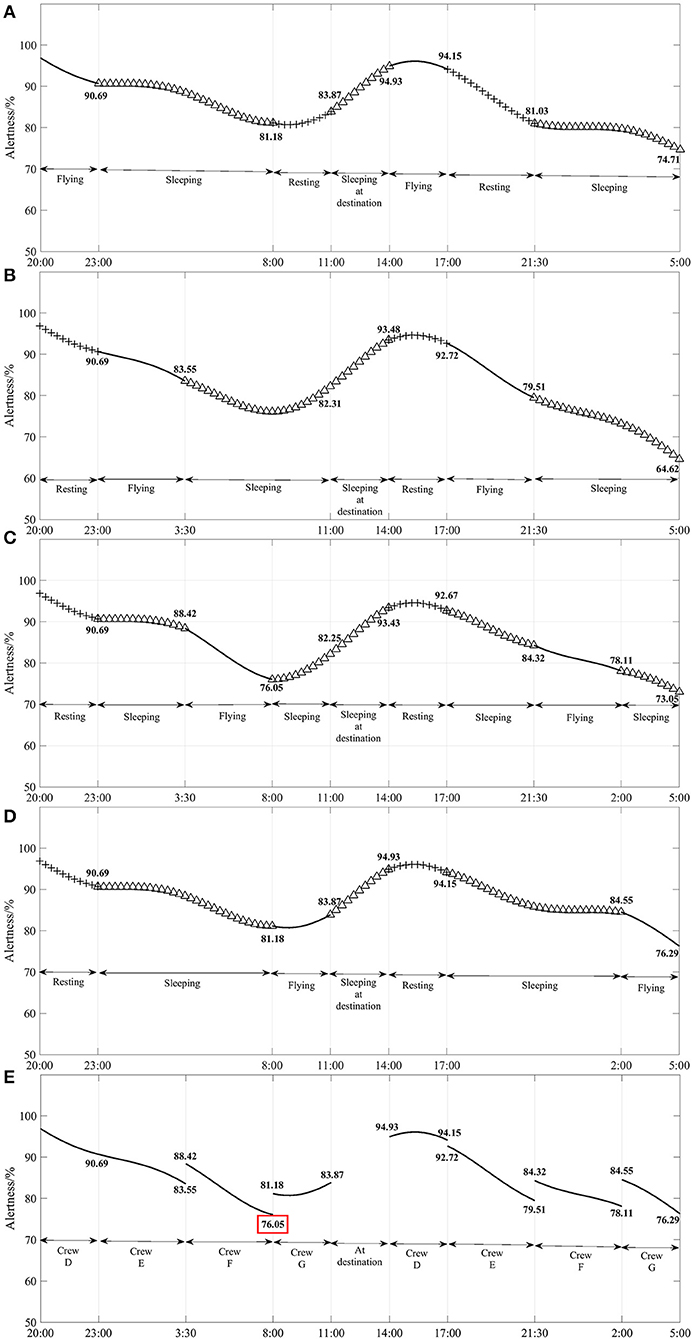
Figure 3. (A–E) Variation in flight crew alertness by flight crew and their cockpit crew with flight hour for flights subject to the exemption approach policy (4 sets of crews).
Figure 4A shows the results of the model simulation of the change in alertness of pilots D and E (pilots D and E are in the same flight crew and have cockpit flying duties together). (Pilots F and G are in the same flight crew) and found that Pilots F and G had the lowest point of alertness at the beginning of their return landing flight duty, 69.36%, and the maximum change in alertness before and after their shift work is 17.81%. Figure 4C shows the results of the model simulation of the change in cockpit crew alertness with flight time. The lowest point of alertness throughout the flight occurred during the return pilot shift handover, with a minimum of 69.16%. The change in alertness shows that there is a relatively large change in alertness for all pilots.
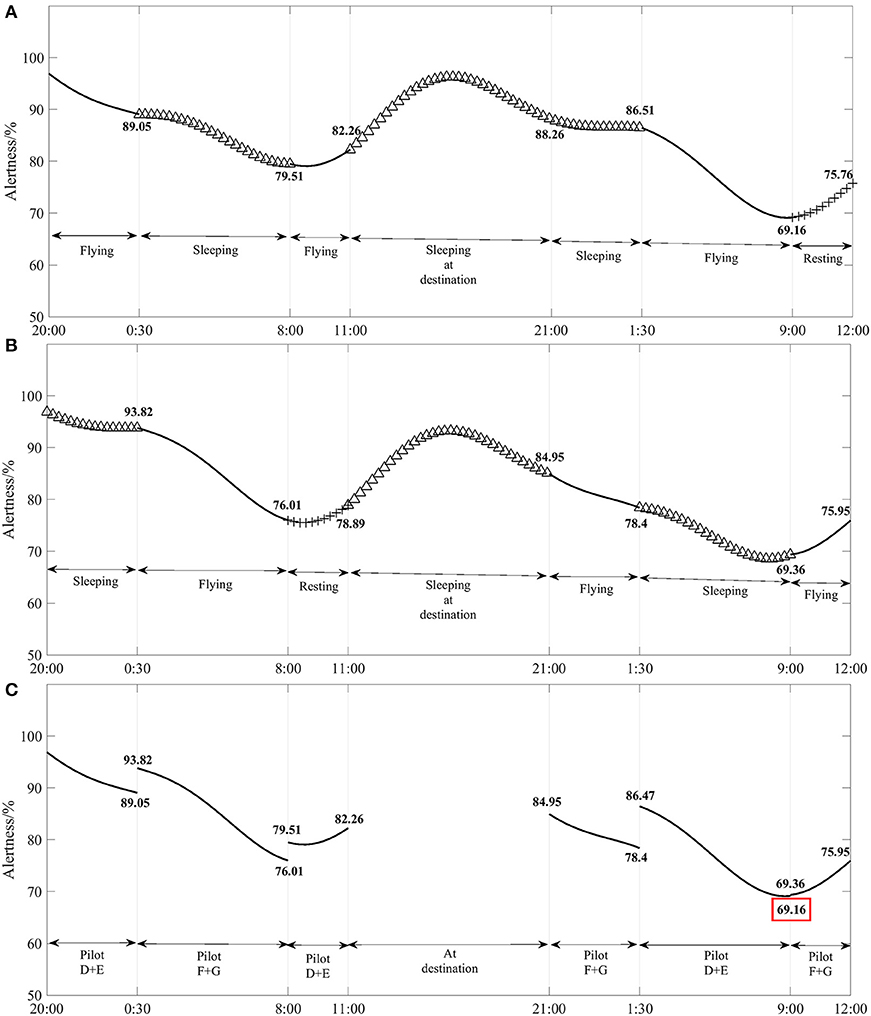
Figure 4. (A–C) Variation in the alertness of each flight crew and their cockpit crew with flight duration for flights under CCAR-121 part policy restrictions (4 pilots).
As can be seen from Table 1, the maximum duty period hours and flight time hours in the exemption approach policy is close to twice that of CCAR-121 part policy, so the exemption approach policy faces a number of personnel fatigue issues for extra long hours of duty and flight, such as long working hours which obviously lead to sleep deprivation and circadian rhythm factors which complicate all-weather work (18). Goode (19) found that the probability of commercial aviation accidents increased significantly with increasing duty time, with 20% of US commercial aviation accidents appearing to occur at 10 h or more. Thus, in addition to circadian rhythm disturbances and acute or cumulative sleep deprivation, prolonged periods of continuous wakefulness can also significantly increase pilot fatigue.
In addition, the exemption approach policy is faced with an extraordinarily long low workload cruise phase of flight, and Cabon et al. (20) have shown that long-haul pilots are particularly vulnerable to alertness failures during low workload periods. Furthermore, it has been established that these lapses can occur with two crew members at the same time (an obvious safety issue). Wright N and McGown A (21) similarly found that pilot microsleeps occurred most frequently during the cruise portion of long-haul flights (mid to late in the flight), were more than nine times more likely to occur compared to night flights, and found that this spontaneous microsleep increased with flight duration. Therefore, attention should be paid to alertness lapses during cruising.
At the same time, the number of matches in the exemption approach policy is twice as large as in CCAR-121 part policy, so there is also the issue of “rest and rotation of personnel on board” in the exemption approach policy. For long-haul flights, especially when flying with extended crews, rest and rotation is inevitable to avoid flight time constraints and to relieve fatigue. Most commercial aircraft designed for long-haul flights, such as the Boeing 747-400 and Airbus A340, are equipped with rest facilities that can be used by extended crews (22). Although sleep in rest facilities is reportedly less rejuvenating than sleeping in a hotel or at home (23), these opportunities to sleep using in-flight rest facilities are more beneficial than trying to sleep in a chair, while any opportunity to sleep is better than being constantly awake (24). So, as per the 3 types of in-flight rest facilities specified in CCAR-121 part policy, the exemption approach policy specify that in-flight rest facilities should be no less than Class 2 standard.
The exemption approach policy is a temporary policy developed in response to the COVID-19 epidemic and therefore the safety of this method of management, which is based on an increase in numbers and therefore in flight time, is not yet scientifically proven. In fact, many industry organizations and regulatory bodies have attempted to manage fatigue by setting working hours, i.e., these rules usually specify maximum working hours and minimum rest periods, but they take little or no account of the physiological determinants of fatigue (e.g., the impact of circadian rhythms). However, to some extent, the lack of simple, reliable and effective fatigue management tools has forced the use of time-based rule-based approaches (10, 25, 26). In June 2002, a workshop on fatigue and performance modeling is held in Seattle, Washington, to which seven research groups from Australia, Europe and the USA were invited to participate, each developing a model for estimating fatigue associated with shift work (27). During the workshop, different models were used to predict fatigue in different scenarios and a comparison of the results showed that the models each had strengths and weaknesses (27–29). One of the main applications of the SAFTE model, developed by Hursh et al. (12), which aims to model the underlying physiological systems that contribute to personnel cognitive decline and to estimate the decline in alertness due to human fatigue, is to help managers develop work plans by using work plan information to estimate cognitive performance such as personnel fatigue and alertness. In addition, the SAFTE model can distinguish between “in-flight” and “non-in-flight” events and can estimate alertness and sleep reservoir separately for each event (12, 17). Therefore, the SAFTE model is used to develop the flight crew alertness assessment model.
Based on the characteristics of the biomathematical model that “comparing scores is better than complying with thresholds” (13, 14), and the fact that the exemption approach policy is a temporary deviation from the duty period and flight time limits for crew members based on CCAR-121 part policy, it is necessary to use the existing flight time limits in CCAR-121 part policy as a benchmark for comparison, and to analyse the feasibility and scientific validity of the extended flight time provisions in the exemption approach policy.
Based on the model simulation results in Figures 1, 2, it is found that the minimum alertness throughout the flight under the exemption approach policy is only 0.47% less than that under CCAR-121 part policy, and that the alertness of pilots on shift duty under both policies is above 67.55%. Therefore, the three sets of flight crew alertness for the exemption approach policy remained at a similar level to CCAR-121 part policy.
Based on the results of the model simulation calculations in Figures 3, 4, it is found that the minimum alertness throughout the flight under the exemption approach policy is 6.89% higher than that under CCAR-121 part policy, and that the alertness of pilots flying on shift duty under both policies is above 69.16%. Therefore, the four sets of flight crew alertness levels for the exemption approach policy is higher than those of CCAR-121 part policy.
In summary, the results of the flight crew alertness assessment model based on the SAFTE model and the above-mentioned flight rotation plan designed in accordance with the CAAC regulations and airline requirements have verified that the overall flight crew alertness of the “3/4 set” flights operating under the exemption approach policy is higher or closer to that of the “3/4” flights under the CCAR-121 part policy. The overall level of pilot fatigue risk under the exemption approach policy is lower or similar to the level of fatigue risk under CCAR-121 part policy, thus validating the feasibility of the exemption approach policy and providing a solution for airlines to predict crew fatigue risk under the exemption approach policy.
In this paper, a pilot alertness assessment model is constructed to simulate flight schedules under the exemption approach policy and the CCAR-121 Part policy, and the following conclusions are obtained: the above simulation results and analysis, as well as the comparison of flight crew alertness between the two policies, verified that the fatigue and mental state of crew members in the cockpit under the exemption approach policy is similar to and better than that under CCAR-121 part policy overall. In addition, using the parameters assigned in this paper, the study verifies the feasibility and scientific validity of the exemption approach policy and the model provides theoretical support and solutions for airlines' flight planning and crew shift.
The original contributions presented in the study are included in the article/supplementary material, further inquiries can be directed to the corresponding author.
SJ conceived and designed the manuscript and wrote the article. SR edited and revised the article. Both authors contributed to the article and approved the submitted version.
This research project was supported by the National Natural Science Foundation of China (52272356) and the Scientific Research Program of Tianjin Education Commission (2020KJ029).
The authors declare that the research was conducted in the absence of any commercial or financial relationships that could be construed as a potential conflict of interest.
All claims expressed in this article are solely those of the authors and do not necessarily represent those of their affiliated organizations, or those of the publisher, the editors and the reviewers. Any product that may be evaluated in this article, or claim that may be made by its manufacturer, is not guaranteed or endorsed by the publisher.
1. Civil Aviation Administration of China. Implementation of Exemption From Duty Period and Flight Time Restrictions for Crew Members During an Outbreak [EB/OL] (2020). Available online at: http://www.caac.gov.cn/XXGK/XXGK/ZCFBJD/202012/t20201223_205708.html (accessed May 20, 2022).
2. Civil Aviation Administration of China. Rules for the Operational Qualification of Carriers of Large Aircraft in Public Air Transport [EB/OL]. Available online at: http://www.caac.gov.cn/XXGK/XXGK/MHGZ/201511/t20151102_8492.html (accessed May 20, 2022).
3. Dawson D, Noy YI, Harma M, Akerstedt T, Belenky G. Modelling fatigue and the use of fatigue models in work settings. Accid Anal Prev. (2011) 43:549–64. doi: 10.1016/j.aap.2009.12.030
4. International Civil Aviation Organization. Fatigue Risk Management Systems: Implementation Guide for Regulators. (2012). Available online at: https://www.icao.int/safety/fatiguemanagement/FRMSTools/Doc9966.FRMS.2011Edition.en.pdf (accessed May 25, 2022).
5. Achermann P. The two-process model of sleep regulation revisited. Aviat Space And Environ Med. (2004) 75:37–43.
6. Akerstedt T, Folkard S, Portin C. Predictions from the three-process model of alertnes. Aviat Space And Environ Med. (2004) 75:75–83. Available online at: https://www.researchgate.net/publication/5337594
7. Circadian. CAS-5 Fatigue Risk Model for Crew Planners[EB/OL] (2011). Available online at: http://www.circadian.com/247-industries/aviation/cas-5-fatigue-risk-model.html (accessed January 20, 2022).
8. Gander P, Hartley L, Powell D, Cabon P, Hitchcock E, Mills A, et al. Fatigue risk management: organizational factors at the regulatory and industry/company level. Accid Anal Prev. (2011) 43:573–90. doi: 10.1016/j.aap.2009.11.007
9. Akerstedt T, Connor J, Gray A, Kecklund G. Predicting road crashes from a mathematical model of alertness regulation-the sleep/wake predictor. Accid Anal Prev. (2008) 40:1480–5. doi: 10.1016/J.AAP.2008.03.016
10. Roach GD, Fletcher A, Dawson D. A model to predict work-related fatigue based on hours of work. Aviat Space Environ Med. (2004) 75:A61–9. Available online at: https://citeseerx.ist.psu.edu/viewdoc/download?doi=10.1.1.622.5045&rep=rep1&type=pdf
11. Dean DA, Fletcher A, Hursh SR, Klerman EB. Developing mathematical models of neurobehavioral performance for the “real world”. J Biol Rhythms. (2007) 22:246–58. doi: 10.1177/0748730407301376
12. Hursh SR. System and Method for Evaluation Task Efectiveness Based on Sleep Pattern. U.S. Patent No US6579233B2[P]. Washington, DC: U.S. Patent and Trademark Office. Available online at: https://www.freepatentsonline.com/EP1404210.pdf
13. ICAO/IATA/IFALPA. Fatigue Risk Management System - Implementation Guide for Operators (2011). Available online at: https://www.icao.int/safety/fatiguemanagement/FRMS%20Tools/FRMS%20Implementation%20Guide%20for%20Operators%20July%202011.pdf (accessed May 22, 2022).
14. Dawson D, Darwent D, Roach GD. How should a bio-mathematical model be used within a fatigue risk management system to determine whether or not a working time arrangement is safe? Accid Anal Prev. (2017) 99:469–73. doi: 10.1016/j.aap.2015.11.032
15. Borbély AA, Achermann P. Concepts and models of sleep regulation: an overview. J Sleep Res. (1992) 1:63–79. doi: 10.1111/j.1365-2869.1992.tb00013.x
16. Åkerstedt T, Simon F. Validation of the S and C components of the three-process model of alertness regulation. Sleep. (1995) 18:1–6. doi: 10.1093/sleep/18.1.1
17. Hursh SR, Balkin TJ, Miller JC, Eddy D. The fatigue avoidance scheduling tool: modeling to minimize the effects of fatigue on cognitive performance. Sae Tech Papers. (2004) 113:111–9. doi: 10.4271/2004-01-2151
18. Arnedt JT, Wilde GJS, Munt PW, MacLean AW. How do prolonged wakefulness and alcohol compare in the decrements they produce on a simulated driving task? Accid Anal Prev. (2001) 33:337–44. doi: 10.1016/S0001-4575(00)00047-6
19. Goode JH. Are pilots at risk of accidents due to fatigue? J Safety Res. (2003) 34:309–13. doi: 10.1016/S0022-4375(03)00033-1
20. Cabon P, Coblentz A, Mollard R, Fouillot JP. Human vigilance in railway and long-haul flight operation. Ergonomics. (1993) 36:1019–33. doi: 10.1080/00140139308967974
21. Wright N, McGown A. Vigilance on the civil flflight deck: incidence of sleepiness and sleep during long-haul flflights and associated changes in physiological parameters. Ergonomics. (2001) 44:82–106. doi: 10.1080/00140130150203893
22. McKenney D, Prusak K, Robichaux L, Tweeden W. Crew Augmentation Study (2000). Available online at: https://www.eurocockpit.be/sites/default/files/Crew-Augmentation-Study-2000.pdf (accessed January 25, 2022).
23. Roach GD, Darwent D, Dawson D. How well do pilots sleep during long-haul flights? Ergonomics. (2010) 53:1072–5. doi: 10.1080/00140139.2010.506246
24. Eriksen CA, Åkerstedt T, Nilsson JP. Fatigue in trans-Atlantic airline operations: diaries and actigraphy for two-vs. three-pilot crews. Aviat Space Environ Med. (2006) 77:605–12.
25. Cabon P, Lancelle V, Mollard R, Grau J. Sleep, fatigue and hours of work of French train drivers. Rail Human Factors World. (2012) 10:783–91. doi: 10.1201/b12742-88
26. Suwazono Y, Dochi M, Kobayashi E, Oishi M, Okubo Y, Tanaka K, et al. Benchmark duration of work hours for development of fatigue symptoms in Japanese workers with adjustment for job-related stress. Risk Anal. (2010) 28:1689–98. doi: 10.1111/j.1539-6924.2008.01107.x
27. Mallis MM, Mejdal S, Nguyen TT, Dinges DF. Summary of the key features of seven biomathematical models of human fatigue and performance. Aviat Space Environ Med. (2004) 75:A4–14. Available online at: https://www.med.upenn.edu/uep/assets/user-content/documents/Mallis_etal_ASEM_75_3_2004.pdf
28. Hursh SR, Dongen H. Fatigue and performance modeling. Principles Pract Sleep Med. (2011) 66:745–52. doi: 10.1016/B978-1-4160-6645-3.00066-9
Keywords: policy evaluation, COVID-19, alertness, flight crew, fatigue, risk prediction
Citation: Junya S and Ruishan S (2022) Forecasting crew fatigue risk on international flights under different policies in China during the COVID-19 outbreak. Front. Public Health 10:996664. doi: 10.3389/fpubh.2022.996664
Received: 18 July 2022; Accepted: 30 September 2022;
Published: 18 October 2022.
Edited by:
Sophie Ndaw, Institut National de Recherche et de Sécurité pour la prévention des maladies professionnelles et des accidents du travail (INRS), FranceReviewed by:
Jaime Devine, Institutes for Behavior Resources, United StatesCopyright © 2022 Junya and Ruishan. This is an open-access article distributed under the terms of the Creative Commons Attribution License (CC BY). The use, distribution or reproduction in other forums is permitted, provided the original author(s) and the copyright owner(s) are credited and that the original publication in this journal is cited, in accordance with accepted academic practice. No use, distribution or reproduction is permitted which does not comply with these terms.
*Correspondence: SUN Junya, c3VuanVueWE2OEAxNjMuY29t; SUN Ruishan, c3VucnNoQGhvdG1haWwuY29t
Disclaimer: All claims expressed in this article are solely those of the authors and do not necessarily represent those of their affiliated organizations, or those of the publisher, the editors and the reviewers. Any product that may be evaluated in this article or claim that may be made by its manufacturer is not guaranteed or endorsed by the publisher.
Research integrity at Frontiers
Learn more about the work of our research integrity team to safeguard the quality of each article we publish.