 Wenhui Li
 Xin Li
 Ting Huang2
 Hongliang Dai
 Youfeng Wen
- 1Experimental Teaching Center of Basic Medicine, Jinzhou Medical University, Jinzhou, China
- 2Institute of Biological Anthropology, Jinzhou Medical University, Jinzhou, China
- 3School of Public Health, Jinzhou Medical University, Jinzhou, China
- 4School of Nursing, Jinzhou Medical University, Jinzhou, China
Body composition represents an important aspect of physical fitness and has received increasing attention in recent years. The present study was designed and conducted to provide reference values for age-, sex-, and altitude-specific body composition for healthy indigenous Tibetan adults living on the Qinghai-Tibet Plateau, which has not yet been studied. A cross-sectional survey was conducted among 2,356 healthy Tibetan adults (1,433 females and 923 males) living on the Qinghai-Tibet Plateau for generations. The body composition of the participants was measured by bioelectrical impedance analysis (BIA). The measurements included weight, basal metabolic rate (BMR), fat-free mass (FFM), skeletal muscle mass (SMM), protein mass (PM), bone mass (BM), fat mass (FM), percentage of body fat (PBF), subcutaneous fat mass (SFM), visceral fat mass (VFM), total body water (TBW), intracellular water (ICW), and extracellular water (ECW). Overall, males had greater FFM, SMM, PM, BM, and water mass, whereas females were high in fat mass. Participants from plains generally had higher body composition values, and PM, BM, FM and body water values decreased with increasing altitude, with the lowest values found in >4,000 m Shigatse. FFM, SMM, PM, and BM tended to decrease with increasing age, whereas fat mass and ECW tended to increase with increasing age. This study provides the first normative reference data of body composition for healthy indigenous individuals on the Qinghai-Tibet Plateau. These datasets are important for future research related to body composition. A considerable decrease in body composition values in > 4,000 m-altitude areas suggested that body composition cutoff values should be established by altitude. Age-, sex-, and altitude-specific alterations in body composition values also inform the prevention and amendment of abnormal body composition changes and resultant health complications.
Introduction
As one of the important branches of human biology, body composition research focuses on the level, organizational rules, measurement techniques, and associated factors of body composition, including fat, protein, water, carbohydrates, and inorganic salts at the molecular level (1–3), and body size and configuration, which are generally referred to as anthropometric measures, such as body weight, skinfold thickness, and body mass index (BMI) at the whole-body level (3, 4). Body composition measurement is helpful for learning about overall health and nutrition status and provides meaningful information for disease diagnosis and treatment (5, 6). A large number of studies have found that changes in body composition are associated with a plethora of diseases, such as diabetes (7), hypertension (8), obesity (9), and cancer (10). Approximately 10–20% of cancer deaths are thought to be caused by malnutrition. Sarcopenia, a condition with loss of muscle mass and function, predicts a greater incidence of postsurgical complications (11). In addition, excessive visceral fat was associated with an increased incidence of chronic health complications, such as hypertension and diabetes (12, 13). Given the practical importance of body composition data, increasing research has focused on this subject in the past few years (14, 15).
Body composition is affected by many factors, including environment, genetics, sex, age, ethnicity, and altitude (16–20). Studies have shown that visceral fat increases with aging, particularly beyond 40 years of age (21). Additionally, intra-abdominal fat was documented to be increased in weight-stable elderly individuals in Hong Kong, China (22). Extracellular water (ECW)/total body water (TBW), an important index for the determination of malnutrition and dehydration, has been shown to be upregulated with aging in both sexes, with a greater amplitude of increase seen in males than in females (16, 23). The between-ethnicity difference in body composition has also been frequently reported. For instance, evidence showed that non-Hispanic blacks had lower cutoffs for the percentage of body fat than non-Hispanic whites and Mexican Americans (24). According to a recent systematic review, mountaineering stays of 14 days or more at altitudes >4,000 m produce decreases in total mass, fat mass, and lean mass (25). Consistent with this, our recent study found that among those aged 51–60 years, the incidence of sarcopenia in 4,200 m-altitude Shigatse was strikingly higher than that in 3,600 m-altitude Lhasa (32.9 vs. 3.5%) (26). However, the contribution of altitude alone to body composition change remains inconclusive due to the methodological limitations of the heterogeneity of the included studies (25). Based on these arguments, determination of normative reference values of body composition within a specific subpopulation is the premise for practical and clinical application of this biological index. To the authors' knowledge, body composition research in general healthy indigenous populations living in high-altitude regions, such as the Qinghai-Tibet Plateau, is scarce, although many extant body composition studies have focused attention on specific populations, such as elderly individuals, children, athletes, and obese individuals (3, 27–30). Moreover, although a recent study analyzed age- and sex-related differences among healthy subjects, the sample population used was Han adults (aged 18–82 years) living in the low-altitude Shannxi Province (16).
This study aims to investigate the range of body composition of indigenous Tibetan people living on the Qinghai-Tibet Plateau stratified by sex, age, and altitude to establish a reference database of body composition standards of indigenous plateau populations. This work will help provide relevant baseline data for anthropology, medicine and other disciplines. These data also provide a basis for evaluating the physical fitness of aboriginal people in high plateau regions.
Materials and methods
Participants
The survey was carried out through a health examination on the high-altitude area of Qinghai-Tibet Plateau and the low-altitude area of Jinzhou in China. A total of 2,356 healthy Tibetan adults (1,433 females and 923 males) aged 20–84 years old (43.29 ± 13.95 years on average) from Lhasa (altitude of 3,600 m) and Shigatse (altitude of 4,200 m) participated in this study. A total of 1,376 of the respondents were from Lhasa (812 females and 564 males), and 980 were from Shigatse (621 females and 359 males). All Tibetan participants had lived for generations in Tibet, China. To determine the influence of altitude on body composition variations, 748 healthy participants (493 females and 255 males) aged 20–87 years were enrolled from Jinzhou (altitude of 25 m) and served as a control population. Individuals with acute diseases, severe heart, lung, liver, kidney or brain dysfunctions, inflammatory reaction diseases, malignant tumors, endocrine diseases and pregnant women were excluded from this survey.
Assessment of body composition
An MC-180 body composition analyzer (Tanita, Japan) was used to measure human body composition. During the measurement, subjects stood barefoot on the platform of the device, with their feet on the electrodes on both sides. They then grasped the handle of the device with their hands maintaining direct contact with the electrodes and their arms hanging naturally at their sides. The participants remained stationary for ~1 min during the measurement process. Metal articles such as ornaments, wrist watches, and cell phones were removed from the subjects. Specific recorded measurements included weight, basal metabolic rate (BMR), fat-free mass (FFM), skeletal muscle mass (SMM), protein mass (PM), bone mass (BM), fat mass (FM), percentage of body fat (PBF), subcutaneous fat mass (SFM), visceral fat mass (VFM), total body water (TBW), intracellular water (ICW), and extracellular water (ECW).
A portable stadiometer (HM200P, American Charder Company, USA) was used to measure height, which was recorded to the nearest 0.01 cm. Body mass index (BMI) was calculated from height (m) and weight (kg): BMI = weight (kg)/height (m2).
Statistical analysis
The data are presented as the means ± standard deviations (SDs). Sex differences within the same age group were compared using an independent samples t-test. Analysis of variance (ANOVA) was used to test for differences between age groups and region groups. All analyses were performed using SPSS (ver. 21.0, IBM Company), and P < 0.05 was considered statistically significant.
Results
Whole-body composition measurements stratified by sex, altitude, and age
Whole-body composition variables measured by height, weight, BMI, and BMR are shown in Table 1 and stratified by sex, altitude, and age. According to the data, compared with females, males had significantly higher height, weight, and BMR (P < 0.05), regardless of stratification by altitude or age. Compared with those from Shigatse, participants from Lhasa and Jinzhou had significantly higher height, weight, BMI, and BMR (P < 0.05). This phenomenon was consistently seen in both sexes and all age groups. A downward trend of height and BMR was found with increased age (P < 0.05), whereas an upward trend was found in BMI with increasing age (P < 0.05).
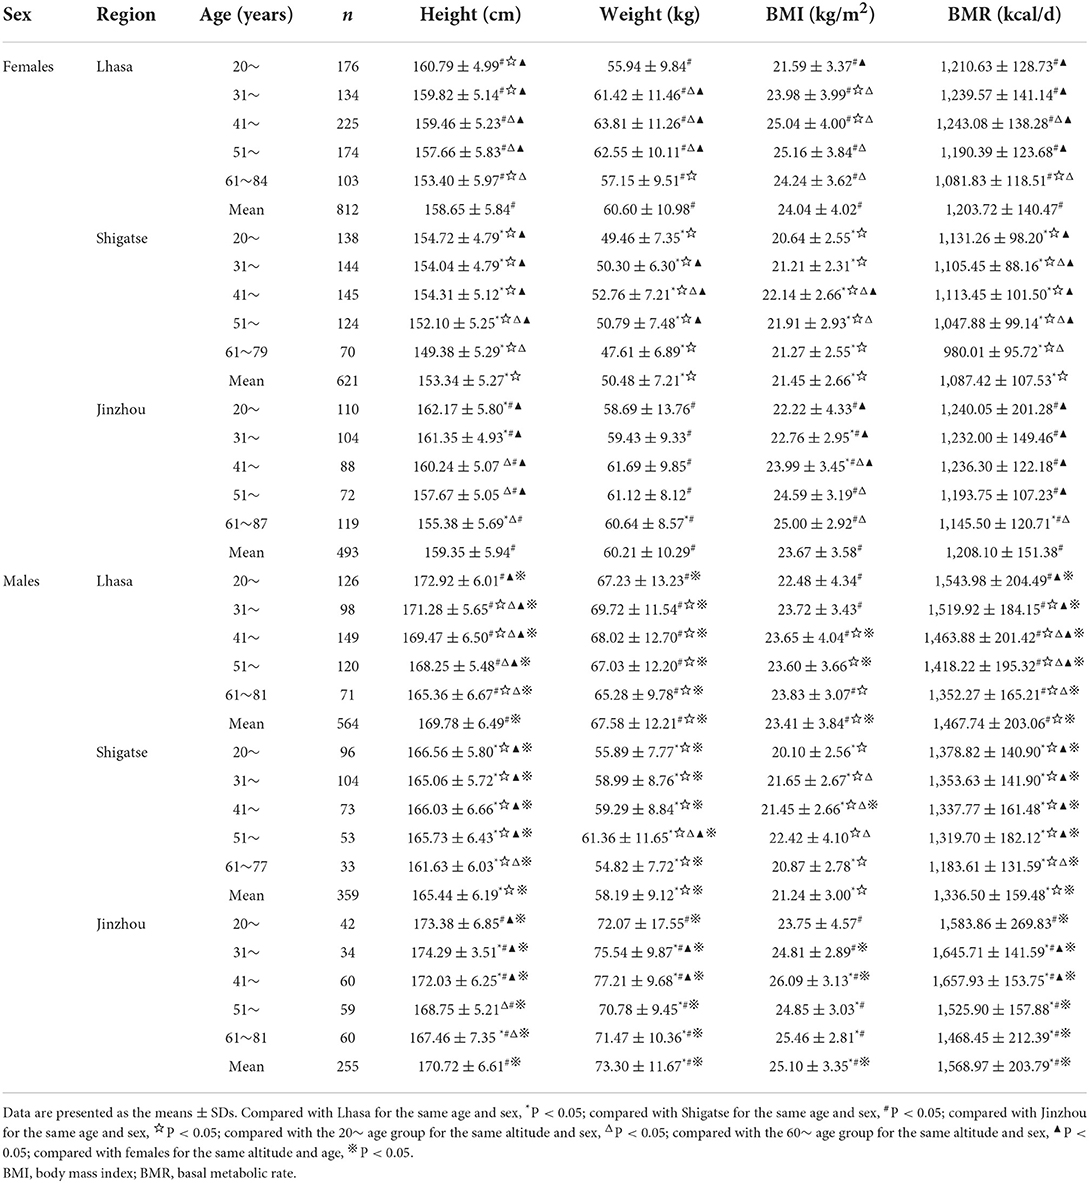
Table 1. Sex-specific whole-body composition measurements stratified by age and altitude.
Body composition of protein content stratified by sex, altitude, and age
Protein mass represented by FFM, SMM, PM, and PP stratified by sex, altitude, and age are shown in Table 2. From these data, in all three investigation regions, males had significantly higher FFM, SMM, PM, and PP values than females across all age groups (P < 0.05). Respondents from Jinzhou had the highest FFM, SMM, and PM values, followed by those from Lhasa, and the lowest values were found among those in high-altitude Shigatse, after controlling for sex and age (P < 0.05). However, participants from Shigatse had the largest PP value among participants from these three altitudes. The maximum FFM and SMM values occurred in the 41~ age group in these three regions for females and for males in Shigatse. The PM values of women decreased with age. For men from Lhasa and Jinzhou, the maximum FFM, SMM, and PM values mostly occurred in the 31~ age group. The 61~ age group had the lowest FFM, SMM, and PM values after controlling for altitude and sex, which were significantly lower than those among young and middle-aged people (P < 0.05).
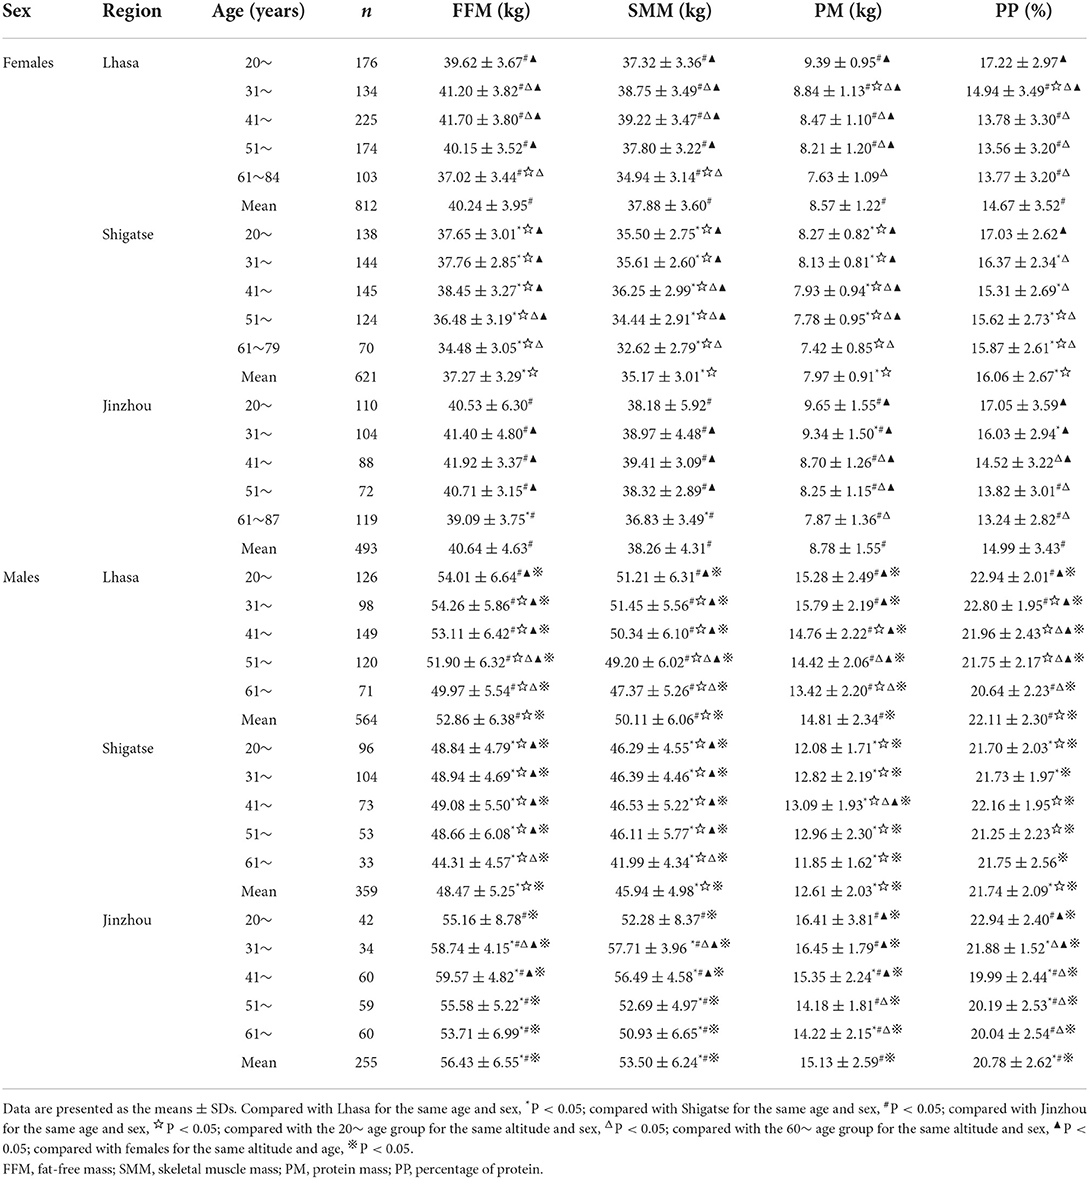
Table 2. Sex-specific body composition of protein mass as stratified by age and altitude.
Body composition of fat content stratified by sex, altitude, and age
Fat mass represented by FM, VFM, SFM, and PBF stratified by sex, altitude, and age are shown in Table 3. From these data, in the three investigation regions, females had significantly higher FM, SFM, and PBF values than males across all age groups (P < 0.05). For females, respondents from Jinzhou and Lhasa had significantly higher FM, VFM, SFM, and PBF values than those from high-altitude Shigatse after controlling for sex and age (P < 0.05). Among male respondents, the FM, VFM, SFM, and PBF values in Jinzhou were higher than those in Lhasa (P < 0.05), and these values in Lhasa were also higher than those in Shigatse (P < 0.05). The mean values of fat-related indexes tended to increase with age. Compared with the older age groups, the 20~ age group had significantly lower values after controlling for altitude and sex (P < 0.05).
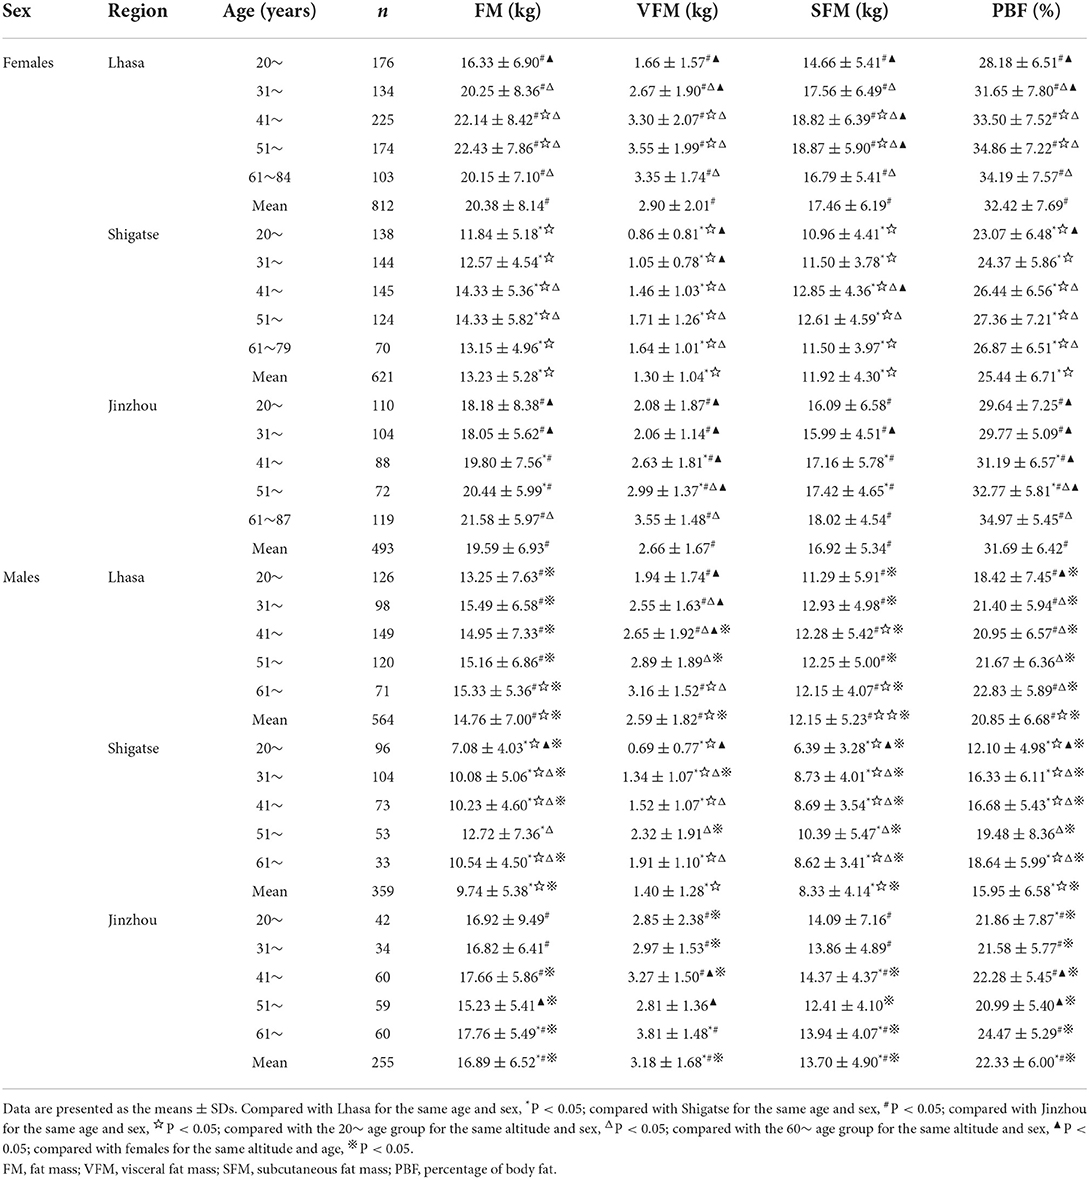
Table 3. Sex-specific body composition of fat mass as stratified by age and altitude.
Body composition of bone mass stratified by sex, altitude, and age
The bone mass and percentage of bone minerals stratified by sex, altitude, and age are shown in Table 4. From these data, in the three regions, males had significantly higher bone mass than females across all age groups (P < 0.05). Meanwhile, respondents from Jinzhou had the highest bone mass values, followed by those from Lhasa, and the lowest values were found in highest-altitude Shigatse after controlling for sex and age (P < 0.05). Peak bone mass occurred in the 41~ age group, with the exception of that in Lhasa men who had a peak bone mass in their thirties. Compared with the younger age groups, the 61~ age group had the lowest bone mass after controlling for altitude and sex (P < 0.05). The percentage of bone minerals showed a general downward trend with increasing age, and the Shigatse population had the highest percentage of bone minerals (P < 0.05).
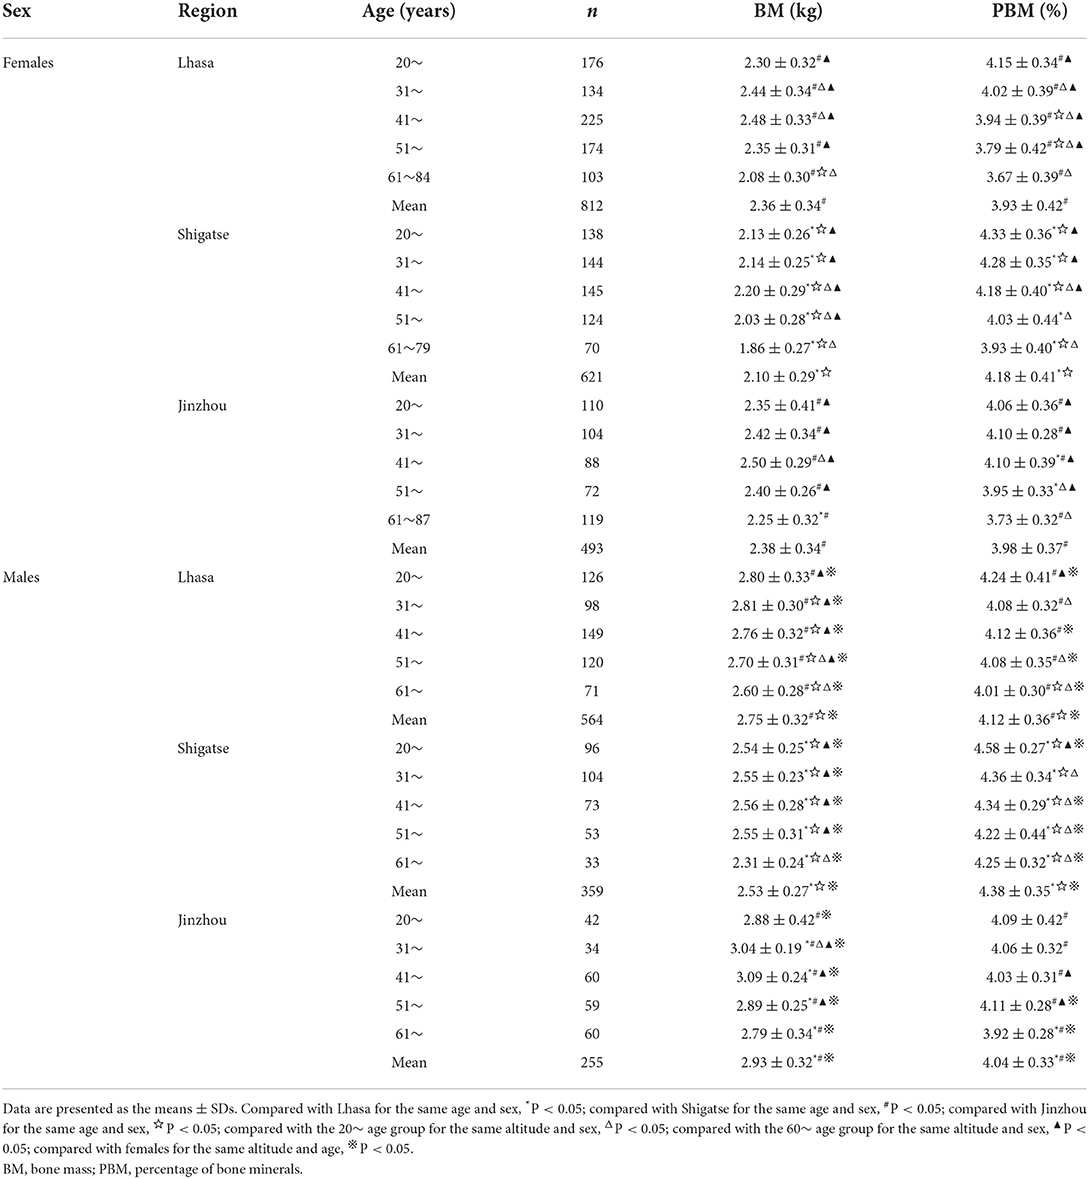
Table 4. Sex-specific body composition of bone mass as stratified by age and altitude.
Body composition of water mass stratified by sex, altitude, and age
Water mass represented by TBW, ICW, ECW, and PBW stratified by sex, altitude, and age are shown in Table 5. From these data, in the three regions, males had significantly higher TBW, ICW, ECW, and PBW values than females across all age groups (P < 0.05). In addition, respondents from Jinzhou had the highest TBW, ICW, and ECW values, followed by those from Lhasa, and the lowest values were found among those living in Shigatse after controlling for sex and age (P < 0.05). However, the PBW value was the largest in the Shigatse population (P < 0.05). TBW, ICW, and ECW values among females first increased and then decreased with age, with peak values appearing in the 41~ age group. In contrast, among males, TBW and ICW exhibited a downward trend with increasing age. In addition, the ECW values among women from the plains and men from the plateau increased with age. The 20~ age group had the lowest ECW values after controlling for altitude and sex, which were significantly lower than those in the middle-aged and elderly groups (P < 0.05).
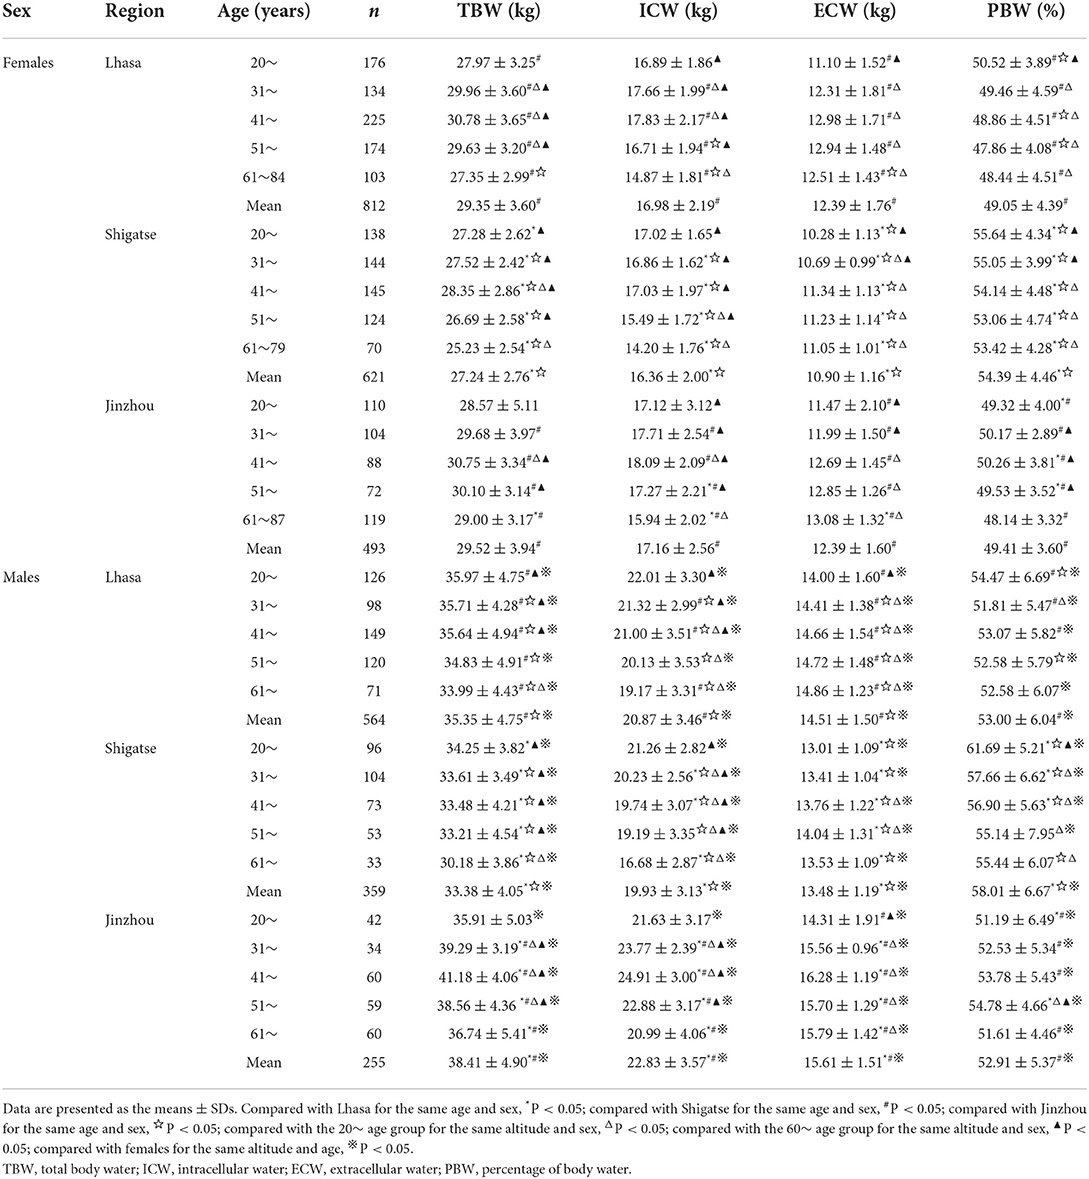
Table 5. Sex-specific body composition of water mass as stratified by age and altitude.
Discussion
As one of the three major plateaus in the world, the Qinghai-Tibet Plateau is a natural laboratory for studying the plateau environment. Tibetans have lived on the Qinghai-Tibet Plateau for generations. Their genes, metabolic level and intestinal flora have changed adaptively. These changes, together with their unique dietary habits and lifestyle, render them fully adapted to the living environment of the plateau. Lhasa (3,600 m above sea level) and Shigatse (4,200 m above sea level) are the permanent settlements of Tibetans. Through the comparative analysis of the body composition of Tibetans in the two regions, it was found that the reference value of each body composition index of Tibetans in Shigatse was lower than that of Tibetans in Lhasa, which was in line with previous reports showing that increased altitude reduced the body composition of the human body (25, 31). This influence of altitude on body composition changes was also corroborated by the highest level of reference values among participants from Jinzhou, the lowest-altitude (25 m above sea level) area in the current study. This difference may be related to the different living environments and economic levels of these regions. With the increase in altitude, the level of circulatory leptin increases, which promotes physical consumption, reduces food intake and affects the acquisition of FM (32). A high-altitude environment also undermines fat deposition by reducing abdominal fat and intramuscular lipids (33). Meanwhile, chronic hypoxia caused by high altitude accelerates the decomposition of skeletal muscle and inhibits protein synthesis, leading to the decline in SMM and TBW (34). In addition, long-term living in a hypoxic environment results in a decrease in bone turnover and BM (35). Regarding socioeconomic status, Tibetans in Lhasa are less engaged in traditional animal husbandry; in other words, they are less involved in physical labor than those from Shigatse, whereas a comparatively better socioeconomic status leads to more intake of a high-calorie diet in Lhasa. These differences would inevitably lead to an increase in body composition indexes, especially those related to fat mass.
Biological differences lead to differences in body composition between sexes. This difference begins at the beginning of life, becomes more obvious in adolescence, and remains throughout adulthood. The present study showed that sex differences existed in the vast majority of body composition indicators among Tibetan adults. According to the age- and sex-specific presentation and comparison of body composition indicators, several lines of interesting findings were revealed and subsequently discussed.
Height and weight are important indicators for evaluating human development and nutritional balance. BMI comprehensively considers human body weight and height and is frequently adopted in large-scale epidemiological studies due to its availability and relevance. It was reported that a high BMI is a major risk factor for chronic conditions such as cardiovascular disease, diabetes, musculoskeletal disorders, and some cancers (36). In this study, the average BMI value of all women in Lhasa ranged from 24.04 ± 4.02 (kg/m2). In the 41~ age group, it began to increase, indicating an increased risk of overweight, obesity, and related health complications. Thus, females aged 40 and above in Lhasa should be regarded as a key population for the prevention and intervention of overweight, obesity and related chronic diseases.
Obesity and other conditions related to excessive energy intake have exhibited an obvious upward trend in recent years. To formulate a reasonable reference value of energy intake, it is necessary to obtain the BMRs of different populations. The results of this study show that BMR decreases non-linearly with age, and the rate of decline accelerates with age, which is consistent with previous research (37). In the adult population in southern China, the increase in BMR was independently and negatively correlated with all-cause mortality among elderly male subjects (38); in particular, this is the first study to show that reduced BMR is an important risk factor for death among elderly individuals. In contrast, long-lived people can maintain low-energy metabolism (39–41). As such, the biological significance of BMR remains controversial and inconclusive. Regardless, our sex-, age-, and altitude-specific BMR data of Tibetan adults are of great importance for BMR-related research among the native plateau populations in the future.
FFM refers to body weight after fat removal, which is mainly related to muscle and bone. Both cross-sectional survey and follow-up research results show that the FFM of men and women remains relatively stable throughout adulthood, and the FFM of men is always higher than that of women (16, 42). This between-sex difference in FFM was further observed in our study. Janssen et al. analyzed the changes in SMM with age by magnetic resonance imaging (MRI) and found that SMM was relatively stable before 45 years of age and then began to decrease substantially with the aging process in both men and women (43). The changes in the FFM and SMM of the native plateau population with age measured by bioelectrical impedance analysis (BIA) in this study were generally in accordance with the abovementioned results. At the end of the twentieth century, the accelerated loss of skeletal muscle mass in elderly people attracted increasing attention, and Rosenberg (44) first quoted the Greek word “sarcopenia” to express this phenomenon. Our previous studies showed that the diagnostic reference value of sarcopenia in the plateau population is significantly lower than that in the plain population and that the sarcopenia incidence in the Qinghai-Tibet Plateau population was significantly higher than that in the plain population (26). On the basis of studies by others and ourselves, it is suggested that the cutoff value for sarcopenia in plateau populations should be further established based on altitude, sex, and age. In addition, more attention should be given to those vulnerable to loss of skeletal muscle mass in high-altitude areas to take timely measures to effectively prevent the occurrence of sarcopenia.
The human skeleton is involved in the dynamic process of continuous bone formation and bone absorption. In childhood and adolescence, bone mass increases with increasing age. Although the length of bone stops growing around the age of 20, there is still a stage of bone mass growth. Generally, between the ages of 20–30, the bone mineral content and bone mineral density reach the highest value, which is termed peak bone mass (PBM) (45). Studies have shown that a 10% increase in PBM at the population level would decrease the risk of developing fracture by 50% later in life (46). In our sample, it was found that the PBM of Tibetan adults generally appears after the age of 40, which may result from retarded skeletal development in a plateau environment and warrants further investigation. In addition, our data showed that the decrease in bone mass in women after 50 years of age was significantly greater than that in men, which may be related to the loss of bone minerals caused by the decrease in estrogen levels in menopausal women (47). Therefore, proper primary health care strategies and policies, such as strengthening health care awareness, developing healthy lifestyles, and appropriate hormone replacement therapy, should be established to increase the bone mass of vulnerable individuals, especially postmenopausal women, to improve their quality of life.
Body fat content is the most variable in human body composition. FM and PBF increased with age throughout adulthood, and FM and PBF were always higher in females than in males. Although FM, PBF, VFM, and SFM in the 61~ age group of Tibetan women decreased slightly, the average value was still significantly higher than those in the 20~ age group. This may be related to the fact that women enter menopause, and the change in estrogen affects fat synthesis (48). A large number of studies have confirmed that FM is closely related to the occurrence of chronic diseases. High PBF, especially high visceral fat mass, increases the risk of type II diabetes and metabolic syndrome (49). SFM and VFM are related to increases in fasting blood glucose, blood lipids, blood pressure and cardiovascular diseases (50). Sarcopenic obesity (SO) is a new type of obesity and a high-risk geriatric syndrome in elderly individuals. SO is characterized by the conjunction of insufficient muscle mass and function and excessive fat mass and is associated with many adverse health consequences, such as frailty, falls, disability, increased incidence rate and mortality, and the development of post-operative Clavien-Dindo grade ≥ II complications in women undergoing DIEP-flap breast reconstruction (51, 52). Thus, the diagnostic criteria of SO in the indigenous plateau population are worthy of further research. The results of this study suggest that menopausal women and middle-aged and elderly men are the key population for the prevention and treatment of fat-related chronic diseases. A low-calorie diet and appropriate exercise training should be encouraged to increase muscle, reduce fat, and improve physical fitness and function.
Changes in ICW and ECW embody the state of nutrient metabolism in the human body to a certain degree. Understanding the optimal fluid volume balance will facilitate the clinical application of body fluid assessment methods. A recent study revealed an association between the reduction in ECW and systolic blood pressure (SBP) with dialysis, and researchers advocated monitoring changes in ECW during dialysis to reduce the risk of intradialytic hypotension (53). This study showed that the TBW, ICW, and ECW values in females increased first and then decreased thereafter during the lifetime, with peak values appearing in the 41~ group. In contrast, among males, TBW and ICW exhibited a downward trend, and ECW exhibited an upward trend with increasing age. These results suggested that the ECW values of Tibetan adults relatively increased with age (compared with ICW and TBW), which would potentially increase the risk of hypertension, especially in males. However, due to the lack of relevant data for other populations, this phenomenon needs further exploration. Studies have shown that the decrease in cell volume due to aging, muscle attenuation and volume overload can cause fluid imbalance between the ICW and ECW, which is more obvious after the age of 70 (54, 55). In fact, the ratio of ECW to ICW is similar to that of ECW to TBW, which is related to nutritional status (55) or disease outcome (56, 57).
This study has two major limitations. First, the precision of BIA is not as high as that of dual-energy X-ray absorptiometry (DXA), which is a well-recognized approach for body composition measurement. However, BIA, which is inexpensive, easy to use, rapid and safe, seems more practical in the plateau region than the expensive and difficult to carry out DXA. Most Tibetans live in a decentralized manner, and their medical and economic conditions are poor. Second, the sample size was not large enough, especially that in the 61~ group in Shigatse. Insufficiency of sample size may lead to a certain deviation in the reference values of body composition of the plateau population.
Conclusion
This study provides the first normative reference data of body composition for healthy indigenous individuals on the Qinghai-Tibet Plateau. These datasets are important for future research related to body composition. A considerable decrease in body composition values in >4,000 m-altitude areas suggests that body composition cutoff values should be established by altitude. Age-, sex-, and altitude-specific alterations in body composition values also inform the prevention and amendment of abnormal body composition changes and resultant health complications.
Data availability statement
The raw data supporting the conclusions of this article will be made available by the authors, without undue reservation.
Ethics statement
This cross-sectional study was approved by the Ethics Committee of Jinzhou Medical University (LLSC2015001) and was conducted in accordance with the Declaration of Helsinki. Written informed consent was obtained from all participants.
Author contributions
Conceptualization and writing—review and editing: WL, HD, and YW. Data curation and investigation: WL, XL, TH, YC, and HZ. Formal analysis, methodology, and writing—original draft preparation: WL and HD. Funding acquisition and resources: YW. Project administration: HD. Software and validation: HZ. Supervision: YW and HD. Visualization: TH. All authors have read and agreed to the published version of the manuscript.
Funding
This work was supported by the National Natural Science Foundation of China (Grant No. 31571233).
Conflict of interest
The authors declare that the research was conducted in the absence of any commercial or financial relationships that could be construed as a potential conflict of interest.
Publisher's note
All claims expressed in this article are solely those of the authors and do not necessarily represent those of their affiliated organizations, or those of the publisher, the editors and the reviewers. Any product that may be evaluated in this article, or claim that may be made by its manufacturer, is not guaranteed or endorsed by the publisher.
References
1. Wang ZM, Pierson RN Jr., Heymsfield SB. The five-level model: a new approach to organizing body-composition research. Am J Clin Nutr. (1992) 56:19–28. doi: 10.1093/ajcn/56.1.19
2. Liang X, Chen X, Li J, Yan M, Yang Y. Study on body composition and its correlation with obesity: a Cohort Study in 5121 Chinese Han participants. Medicine. (2018) 97:e10722. doi: 10.1097/MD.0000000000010722
3. Santos DA, Dawson JA, Matias CN, Rocha PM, Minderico CS, Allison DB, et al. Reference values for body composition and anthropometric measurements in athletes. PLoS ONE. (2014) 9:e97846. doi: 10.1371/journal.pone.0097846
4. Shen W, St-Onge M, Wang Z, Heymsfield SB. Study of body composition: an overview. In:Heymsfield SB, Lohman TG, Wang Z, Going SB, , editors. Human Body Composition. Champaign, IL: Human Kinetics (2005). p. 3–14.
5. Chomtho S, Fewtrell MS, Jaffe A, Williams JE, Wells JC. Evaluation of arm anthropometry for assessing pediatric body composition: evidence from healthy and sick children. Pediatr Res. (2006) 59:860–5. doi: 10.1203/01.pdr.0000219395.83159.91
6. Caverni CN, da Costa AT, Simioni CG, Fukue RR, Tengan CH, Villa TR, et al. Evaluation of body composition in patients with migraine on prophylactic treatment with topiramate. Heliyon. (2021) 7:e06865. doi: 10.1016/j.heliyon.2021.e06865
7. Wells JCK. Body composition and susceptibility to type 2 diabetes: an evolutionary perspective. Eur J Clin Nutr. (2017) 71:881–9. doi: 10.1038/ejcn.2017.31
8. Ye S, Zhu C, Wei C, Yang M, Zheng W, Gan D, et al. Associations of body composition with blood pressure and hypertension. Obesity. (2018) 26:1644–50. doi: 10.1002/oby.22291
9. Bosy-Westphal A, Muller MJ. Diagnosis of obesity based on body composition-associated health risks-Time for a change in paradigm. Obes Rev. (2021) 22(Suppl. 2):e13190. doi: 10.1111/obr.13190
10. Kong HH, Kim KW, Ko YS, Kim SC, Lee JH, Song KB, et al. Longitudinal changes in body composition of long-term survivors of pancreatic head cancer and factors affecting the changes. J Clin Med. (2021) 10:436. doi: 10.3390/jcm10153436
11. Simonsen C, de Heer P, Bjerre ED, Suetta C, Hojman P, Pedersen BK, et al. Sarcopenia and postoperative complication risk in gastrointestinal surgical oncology: a meta-analysis. Ann Surg. (2018) 268:58–69. doi: 10.1097/SLA.0000000000002679
12. Lukich A, Gavish D, Shargorodsky M. Normal weight diabetic patients versus obese diabetics: relation of overall and abdominal adiposity to vascular health. Cardiovasc Diabetol. (2014) 13:141. doi: 10.1186/s12933-014-0141-8
13. Meisinger C, Döring A, Thorand B, Heier M, Löwel H. Body fat distribution and risk of type 2 diabetes in the general population: are there differences between men and women? The MONICA/KORA Augsburg cohort study. Am J Clin Nutr. (2006) 84:483–9. doi: 10.1093/ajcn/84.3.483
14. Müller MJ, Bosy-Westphal A, Later W, Haas V, Heller M. Functional body composition: insights into the regulation of energy metabolism and some clinical applications. Eur J Clin Nutr. (2009) 63:1045–56. doi: 10.1038/ejcn.2009.55
15. Cherif M, Said MA, Bannour K, Alhumaid MM, Chaifa MB, Khammassi M, et al. Anthropometry, body composition, and athletic performance in specific field tests in Paralympic athletes with different disabilities. Heliyon. (2022) 8:e09023. doi: 10.1016/j.heliyon.2022.e09023
16. He X, Li Z, Tang X, Zhang L, Wang L, He Y, et al. Age- and sex-related differences in body composition in healthy subjects aged 18 to 82 years. Medicine. (2018) 97:e11152. doi: 10.1097/MD.0000000000011152
17. Thibault R, Genton L, Pichard C. Body composition: why, when and for who? Clin Nutr. (2012) 31:435–47. doi: 10.1016/j.clnu.2011.12.011
18. Boyer SJ, Blume FD. Weight loss and changes in body composition at high altitude. J Appl Physiol Respir Environ Exerc Physiol. (1984) 57:1580–5. doi: 10.1152/jappl.1984.57.5.1580
19. Zaccagni L, Barbieri D, Cogo A, Gualdi-Russo E. Anthropometric and body composition changes during expeditions at high altitude. High Alt Med Biol. (2014) 15:176–82. doi: 10.1089/ham.2013.1133
20. Tschöp M, Morrison KM. Weight loss at high altitude. Adv Exp Med Biol. (2001) 502:237–47. doi: 10.1007/978-1-4757-3401-0_16
21. Fantin F, Rossi AP, Cazzadori M, Comellato G, Mazzali G, Gozzoli MP, et al. Central and peripheral fat and subclinical vascular damage in older women. Age Ageing. (2013) 42:359–65. doi: 10.1093/ageing/aft005
22. Thomas GN, Ho SY, Lam KS, Janus ED, Hedley AJ, Lam TH, et al. Impact of obesity and body fat distribution on cardiovascular risk factors in Hong Kong Chinese. Obes Res. (2004) 12:1805–13. doi: 10.1038/oby.2004.224
23. Malczyk E, Dziegielewska-Gesiak S, Fatyga E, Ziółko E, Kokot T, Muc-Wierzgon M, et al. Body composition in healthy older persons: role of the ratio of extracellular/total body water. J Biol Regul Homeost Agents. (2016) 30:767–72.
24. Heo M, Faith MS, Pietrobelli A, Heymsfield SB. Percentage of body fat cutoffs by sex, age, and race-ethnicity in the US adult population from NHANES 1999-2004. Am J Clin Nutr. (2012) 95:594–602. doi: 10.3945/ajcn.111.025171
25. Sitko S, Cirer-Sastre R, López Laval I. Effects of high altitude mountaineering on body composition: a systematic review. Nutr Hosp. (2019) 36:1189–95. doi: 10.20960/nh.02582
26. Ye L, Wen Y, Chen Y, Yao J, Li X, Liu Y, et al. Diagnostic reference values for sarcopenia in Tibetans in China. Sci Rep. (2020) 10:3067. doi: 10.1038/s41598-020-60027-0
27. Makizako H, Shimada H, Doi T, Tsutsumimoto K, Lee S, Lee SC, et al. Age-dependent changes in physical performance and body composition in community-dwelling Japanese older adults. J Cachexia Sarcopenia Muscle. (2017) 8:607–14. doi: 10.1002/jcsm.12197
28. Nikolaidis PT, Buśko K, Clemente FM, Tasiopoulos I, Knechtle B. Age- and sex-related differences in the anthropometry and neuromuscular fitness of competitive taekwondo athletes. Open Access J Sports Med. (2016) 7:177–86. doi: 10.2147/OAJSM.S120344
29. Staiano AE, Broyles ST, Gupta AK, Katzmarzyk PT. Ethnic and sex differences in visceral, subcutaneous, and total body fat in children and adolescents. Obesity. (2013) 21:1251–5. doi: 10.1002/oby.20210
30. Poggiogalle E, Migliaccio S, Lenzi A, Donini LM. Treatment of body composition changes in obese and overweight older adults: insight into the phenotype of sarcopenic obesity. Endocrine. (2014) 47:699–716. doi: 10.1007/s12020-014-0315-x
31. Dünnwald T, Gatterer H, Faulhaber M, Arvandi M, Schobersberger W. Body composition and body weight changes at different altitude levels: a systematic review and meta-analysis. Front Physiol. (2019) 10:430. doi: 10.3389/fphys.2019.00430
32. Shukla V, Singh SN, Vats P, Singh VK, Singh SB, Banerjee PK, et al. Ghrelin and leptin levels of sojourners and acclimatized lowlanders at high altitude. Nutr Neurosci. (2005) 8:161–5. doi: 10.1080/10284150500132823
33. Liu X, Wang L, Gao M, Wang G, Tang K, Yang J, et al. Comparison of muscle density in middle-aged and older chinese adults between a high-altitude area (Kunming) and a low-altitude area (Beijing). Front Endocrinol. (2021) 12:811770. doi: 10.3389/fendo.2021.811770
34. Liu S, Fu P, Ning K, Wang R, Yang B, Chen J, et al. HIF-1α Negatively regulates irisin expression which involves in muscle atrophy induced by hypoxia. Int J Mol Sci. (2022) 23:887. doi: 10.3390/ijms23020887
35. Basu M, Malhotra AS, Pal K, Kumar R, Bajaj R, Verma SK, et al. Alterations in different indices of skeletal health after prolonged residency at high altitude. High Alt Med Biol. (2014) 15:170–5. doi: 10.1089/ham.2013.1098
36. Lebiedowska A, Hartman-Petrycka M, Błońska-Fajfrowska B. How reliable is BMI? Bioimpedance analysis of body composition in underweight, rmal weight, overweight, obese women. Ir J Med Sci. (2021) 190:993–8. doi: 10.1007/s11845-020-02403-3
37. Rizzo MR, Mari D, Barbieri M, Ragno E, Grella R, Provenzano R, et al. Resting metabolic rate and respiratory quotient in human longevity. J Clin Endocrinol Metab. (2005) 90:409–13. doi: 10.1210/jc.2004-0390
38. Han F, Hu F, Wang T, Zhou W, Zhu L, Huang X, et al. Association between basal metabolic rate and all-cause mortality in a prospective cohort of southern Chinese adults. Front Physiol. (2021) 12:790347. doi: 10.3389/fphys.2021.790347
39. Ruggiero C, Metter EJ, Melenovsky V, Cherubini A, Najjar SS, Ble A, et al. High basal metabolic rate is a risk factor for mortality: the Baltimore Longitudinal Study of Aging. J Gerontol A Biol Sci Med Sci. (2008) 63:698–706. doi: 10.1093/gerona/63.7.698
40. Jumpertz R, Hanson RL, Sievers ML, Bennett PH, Nelson RG, Krakoff J, et al. Higher energy expenditure in humans predicts natural mortality. J Clin Endocrinol Metab. (2011) 96:E972–6. doi: 10.1210/jc.2010-2944
41. Schrack JA, Knuth ND, Simonsick EM, Ferrucci L. IDEAL aging is associated with lower resting metabolic rate: the Baltimore Longitudinal Study of Aging. J Am Geriatr Soc. (2014) 62:667–72. doi: 10.1111/jgs.12740
42. Guo SS, Zeller C, Chumlea WC, Siervogel RM. Aging, body composition, and lifestyle: the Fels Longitudinal Study. Am J Clin Nutr. (1999) 70:405–11. doi: 10.1093/ajcn/70.3.405
43. Janssen I, Heymsfield SB, Wang ZM, Ross R. Skeletal muscle mass and distribution in 468 men and women aged 18-88 yr. J Appl Physiol 1985. (2000) 89:81–8. doi: 10.1152/jappl.2000.89.1.81
44. Rosenberg IH. Sarcopenia: origins and clinical relevance. J Nutr. (1997) 127:990s−1s. doi: 10.1093/jn/127.5.990S
45. Mora S, Gilsanz V. Establishment of peak bone mass. Endocrinol Metab Clin North Am. (2003) 32:39–63. doi: 10.1016/S0889-8529(02)00058-0
46. Gordon CM, Zemel BS, Wren TA, Leonard MB, Bachrach LK, Rauch F, et al. The determinants of peak bone mass. J Pediatr. (2017) 180:261–9. doi: 10.1016/j.jpeds.2016.09.056
47. Blunt BA, Klauber MR, Barrett-Connor EL, Edelstein SL. Sex differences in bone mineral density in 1653 men and women in the sixth through tenth decades of life: the Rancho Bernardo Study. J Bone Miner Res. (1994) 9:1333–8. doi: 10.1002/jbmr.5650090903
48. Van Pelt RE, Gavin KM, Kohrt WM. Regulation of body composition and bioenergetics by estrogens. Endocrinol Metab Clin North Am. (2015) 44:663–76. doi: 10.1016/j.ecl.2015.05.011
49. Al-Sofiani ME, Ganji SS, Kalyani RR. Body composition changes in diabetes and aging. J Diabetes Complications. (2019) 33:451–9. doi: 10.1016/j.jdiacomp.2019.03.007
50. Fox CS, Massaro JM, Hoffmann U, Pou KM, Maurovich-Horvat P, Liu CY, et al. Abdominal visceral and subcutaneous adipose tissue compartments: association with metabolic risk factors in the Framingham Heart Study. Circulation. (2007) 116:39–48. doi: 10.1161/CIRCULATIONAHA.106.675355
51. Ji T, Li Y, Ma L. Sarcopenic obesity: an emerging public health problem. Aging Dis. (2022) 13:379–88. doi: 10.14336/AD.2021.1120-1
52. Sadok N, Hartmans ME, de Bock GH, Klaase JM, Werker PMN, Viddeleer AR, et al. The effect of sarcopenic obesity and muscle quality on complications after DIEP-flap breast reconstruction. Heliyon. (2022) 8:e09381. doi: 10.1016/j.heliyon.2022.e09381
53. Tangvoraphonkchai K, Davenport A. Changes in extracellular water with hemodialysis and fall in systolic blood pressure. Int J Artif Organs. (2022) 45:140–5. doi: 10.1177/0391398821995503
54. Ohashi Y, Joki N, Yamazaki K, Kawamura T, Tai R, Oguchi H, et al. Changes in the fluid volume balance between intra- and extracellular water in a sample of Japanese adults aged 15-88 yr old: a cross-sectional study. Am J Physiol Renal Physiol. (2018) 314:F614–f622. doi: 10.1152/ajprenal.00477.2017
55. Taniguchi M, Yamada Y, Fukumoto Y, Sawano S, Minami S, Ikezoe T, et al. Increase in echo intensity and extracellular-to-intracellular water ratio is independently associated with muscle weakness in elderly women. Eur J Appl Physiol. (2017) 117:2001–7. doi: 10.1007/s00421-017-3686-x
56. Ohashi Y, Tai R, Aoki T, Mizuiri S, Ogura T, Tanaka Y, et al. The associations of malnutrition and aging with fluid volume imbalance between intra- and extracellular water in patients with chronic kidney disease. J Nutr Health Aging. (2015) 19:986–93. doi: 10.1007/s12603-015-0658-x
Keywords: body composition, indigenous population, Qinghai-Tibet Plateau, Tibetan, healthy adults
Citation: Li W, Li X, Huang T, Chen Y, Zhang H, Dai H and Wen Y (2022) Normative reference data for body composition in healthy indigenous populations on the Qinghai-Tibet Plateau. Front. Public Health 10:986720. doi: 10.3389/fpubh.2022.986720
Received: 21 July 2022; Accepted: 14 September 2022;
Published: 06 October 2022.
Edited by:
Abdul Rasheed Baloch, University of Karachi, PakistanReviewed by:
Kun Li, Nanjing Agricultural University, ChinaQiongying Deng, Guangxi Medical University, China
Copyright © 2022 Li, Li, Huang, Chen, Zhang, Dai and Wen. This is an open-access article distributed under the terms of the Creative Commons Attribution License (CC BY). The use, distribution or reproduction in other forums is permitted, provided the original author(s) and the copyright owner(s) are credited and that the original publication in this journal is cited, in accordance with accepted academic practice. No use, distribution or reproduction is permitted which does not comply with these terms.
*Correspondence: Hongliang Dai, ZGFpaG9uZ2xpYW5nQGp6bXUuZWR1LmNu; Youfeng Wen, d2VueWZAanptdS5lZHUuY24=