 Melike Yavuz
 Nilay Etiler
- 1Public Health Department, Bahcesehir University Medical School, Istanbul, Turkey
- 2Public Health Department, Okan University Medical School, Istanbul, Turkey
This study aims to analyze the inter-provincial variation in the increase of attack rates in the third wave of the COVID-19 outbreak in Turkey and to determine their relationship with potential urban health indicators. In this ecological study, dependent variables were selected as the COVID-19 attack rates of provinces before the third wave and during the third peak and the attack rate increase ratio. Urban health indicators that can function as determinants of health were calculated for each province under five headings: demographic, health capacity, economic, environmental, and socio-cultural. The epidemiologic maps were produced to show the spatial distribution of COVID-19 attack rates pre- and during the third wave. The associations with urban indicators were conducted using bivariate analysis, including Pearson or Spearman correlation analysis. A multiple linear regression model was run with variables significantly associated with increased attack rates. The results of our study show significant regional variations in COVID-19 attack rates both at the beginning and during the third wave of the COVID-19 pandemic in Turkey. Among the provinces, the attack rate increase ratio has only shown significant correlations to education level and some economic indicators, such as income, employment, industrial activity measured by electric consumption, and economic activity in the manufacturing industry. The multivariate analysis determined that the indicator of economic activity in the manufacturing industry is related to the increase of the attack rate in the third wave. Our results show that the COVID-19 cases are higher in more developed cities with more manufacturing sector activity. It makes us think that it is mainly related to inequalities arising from access to health institutions and testing. It can be determined that the partly lockdown strategy, which excluded the industrial activity in the country, concluded the higher increase in the attack rates in highly industrialized provinces.
Introduction
The COVID-19 pandemic, starting in December 2019, went down in history as one of the most devastating diseases since the influenza pandemic in 1918. After the COVID-19 epidemic reached the pandemic level, different outbreak control policies were implemented across every country, causing different outcomes in population health (1, 2). The policies of governments to cope with the pandemic emerge from their administrative, economic, and political structures. On the other hand, public adoption of control measures is affected by their demographic, economic, sociological, and cultural characteristics.
Turkey is an extensive and populous country with an area of about 800 km2 and a population of more than 85 million. It is subdivided into 81 provinces for administrative purposes. Its economy is classified among the emerging and growth-leading economies, with $815 billion in GDP (3). The COVID-19 outbreak in Turkey started with the first confirmed case on March 11, 2020. Turkey experienced two major epidemic waves in 2020, one peaking in April and the other in December. The third wave, much larger than the previous waves, started in February 2021 and peaked in mid-April (4). Thus, Turkey ranked first in Europe and fourth in the world in the number of cases (Figure 1).
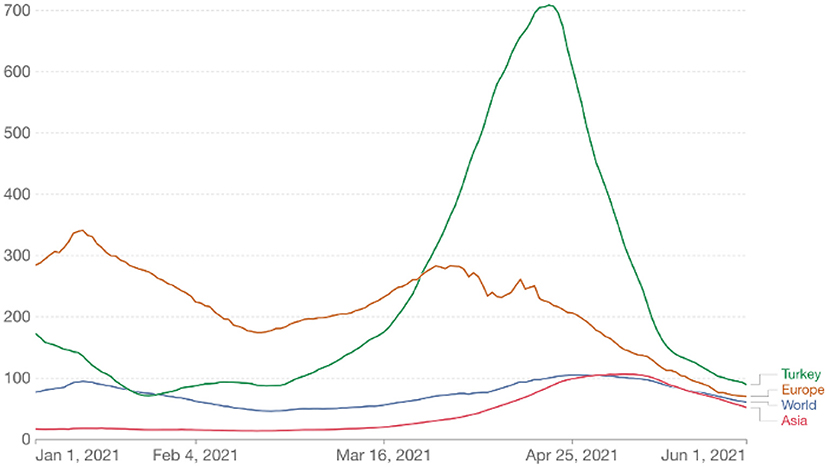
Figure 1. Daily new confirmed COVID-19 cases per million people (7-day rolling average).
Figure 2 shows the epidemic curve of COVID-19 in Turkey with the main lockdown and opening times. As understood from the figure, the third wave started just after the second wave's lockdowns reopened. In addition, in this period, only healthcare workers were vaccinated, and widespread vaccination of risk groups had begun but had not yet been completed. Turkey's first and largest lockdown was implemented in the descending phase of the third wave. As shown in Figure 2, although COVID-19 vaccinations began on January 13th, 2021, the vaccination rate was only 26.9% when the third wave ended.
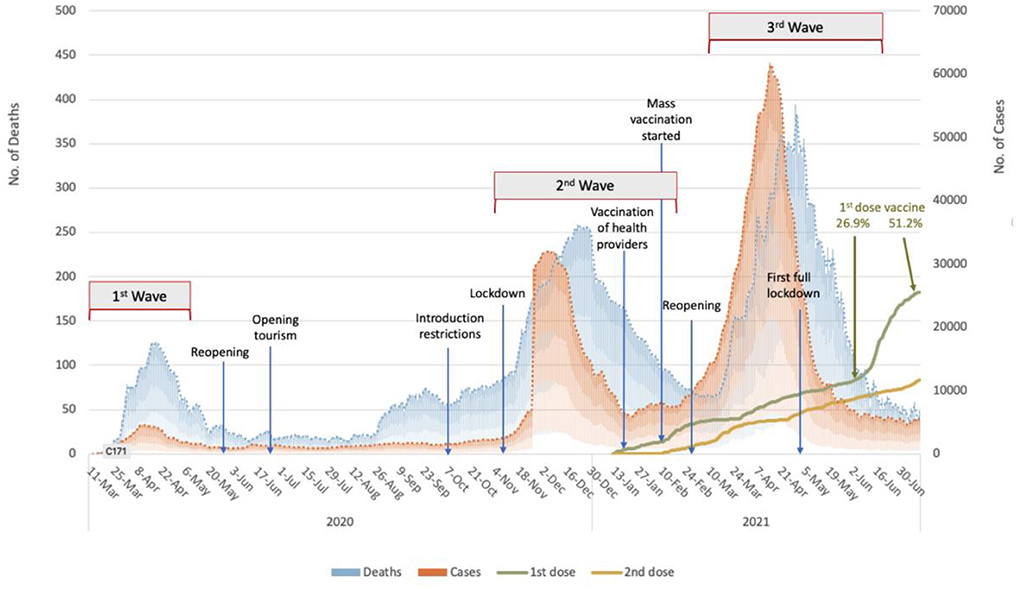
Figure 2. The epidemic curve of the COVID-19 pandemic in Turkey with the lockdowns/openings and vaccination rates between March 2020 to June 2021 (The authors produced the curve to explain the temporal flow).
The third wave affected all provinces in Turkey much more than the first two waves. Although the measures taken to prevent the spread of COVID-19 within the country were generally at the central governmental level, each province was charged with implementation. Thus, there were slight variations in response. During the third wave, incidence and the rate of increase in COVID-19 cases differed remarkably between provinces (Figure 3). The primary motivation of the present study's authors was to investigate why these differences occur. Our study is based on the fact that urban health indicators are crucial in the spread of COVID-19.
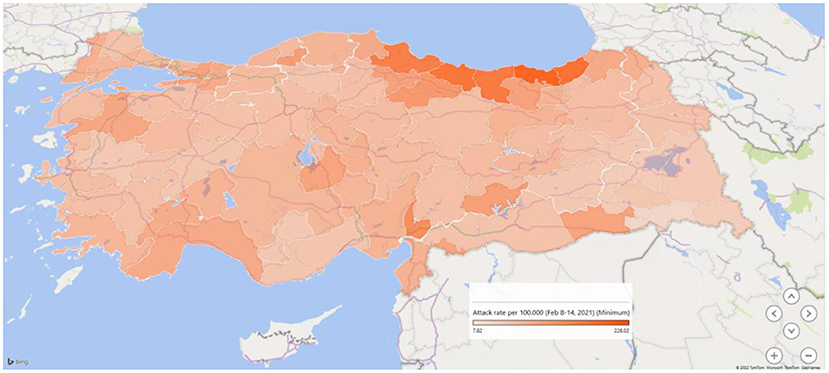
Figure 3. The attack rate of COVID-19 (per 1,00,000 population) on February 8–14, 2021, in the provinces of Turkey.
The spread of COVID-19 infection shows a spatial distribution that includes the living quarters, micro and macro environment, and social fabric. In the background of this spatial distribution, class characteristics shape the living spaces, environment, and social fabric and even determine the public health problems. It is well known that some people are more at risk of mortality or morbidity from COVID-19 due to where they live and work or their inability to access health services (5). For example, workers in settings such as healthcare facilities, farms, factories, markets, and public transport are naturally at higher risk of exposure to the virus that causes COVID-19 due to the nature of their work. Factors such as discrimination, healthcare access, and use, general health status, education, income, and wealth gaps are associated with more COVID-19 cases, hospitalizations, and deaths (6).
The impact of the pandemic on the populations is also related to the demographic structure, environmental health conditions, capacity of health care, and preventive health services before the COVID-19 pandemic. Population density is considered an essential factor in the spread of COVID-19, as the rate of contact between people is higher in cities with a higher population-weighted density. Several studies have found moderate to strong associations between population density and COVID-19 case and death rates (7–10). It has been suggested that low environmental quality is negatively associated with the human immune system and, as a result, contributes to the COVID-19 pandemic in countries with low environmental quality (11). Previous studies showed a significant negative association between air quality and COVID-19 cases and deaths (12–14). Among air pollutants, PM2.5, NO2, and O3 are reported as the main determinants of COVID-19 (15).
Some researchers have also worked on the socio-economic analysis of the COVID-19 pandemic (16–18). A study conducted in China during the early phase of the pandemic found that cities with more medical resources, as measured by the number of doctors, had lower contagion rates (16). The same study reports that cities with higher GDP per capita have higher transmission rates, which can be attributed to increased social interactions as economic activity increases. Kong et al. (17), in their study examining the relationship between the R0 and socioeconomic parameters, identified that the population between 20 and 34 years old (youth), the people residing in urban agglomerates over 1 million (city), and GINI income inequality have a strong correlation with R0, across countries. An intermediate level of youth, GINI inequality, and a high city population were associated with high R0. A systematic study of the correlations between socioeconomic variables like the GINI index and epidemiological variables like R0 showed a disparity between developed and developing countries and epidemic waves (18).
While some studies regarding the dynamics of COVID-19 in spatial scales, the geographic variation in COVID-19 rates remains to be understood in Turkey, the study by Aral and Bakir (19) on the clustering of outbreak cases on the provincial level in Turkey indicates some environmental, socioeconomic, and healthcare factors. Another ecological study, an analysis of the effects of air pollution on COVID-19 mortality in Istanbul, found that the impact of air quality on COVID-19 emergence interacted with socioeconomic status resulting in a new syndemic (20).
The spatial dynamics of communicable disease outbreaks have been observed to varying degrees, primarily determined by location and influenced by local characteristics. However, this study aims to analyze the inter-provincial variation of the increase of attack rates during the third wave of the COVID-19 outbreak in Turkey and to determine their relationship with potential urban health indicators.
Materials and methods
This ecologic study analyzes the correlation between the increase in attack rates and some urban characteristics of provinces in Turkey (N: 81). Each province is administered by a governor appointed by the central government and majors whom the residents elect for both metropolitan cities and districts. In each district, there are directories of all ministries of the central government which mirror the national policies on a local scale. However, there are some flexibilities considering the regional dynamic in some cases. The provinces, a fundamental unit of analysis in this study, have their characteristics shaped by their history, economy, demographic, cultural, and social characteristics.
COVID-19 data
Following the emergence of the first COVID-19 case in Turkey on March 11, 2020, the Ministry of Health officially started to share the data on daily total COVID-19 cases as confirmed by laboratories; thus, the data included only seropositive cases while neither suspicious nor possible cases were reported.
In the current study, the weekly data reported by the Ministry between February 8 and April 30, 2021, were used to calculate the COVID-19 indicators. As shown in Figure 2, the COVID-19 cases began to rise slightly at the end of February 2021, with the number of cases reaching its peak on April 16th at 63,082 new cases. However, the daily case numbers dropped to around 7,000 by May. In the so-called third peak, 2.5 million cases were reported in 3 months, from March 1 to May 31, 2021. However, from the beginning of the outbreak on March 11, 2020, to February 28, nearly 1 year, only 2.7 million cases were reported.
In this study, the COVID-19 data by the province was retrieved from Turcovid19 for analysis (21). The dependent variables of the analysis are:
1. Attack Rate Before the Third Wave (Var1): The number of new cases per 1,00,000 population in the week of February 8th to 14th was accepted as the pre-peak attack rate for each province.
2. Attack Rate During the Third Peak (Var2): Each province's highest attack rate (weekly new cases per 1,00,000 population) was accepted at the peak rate during the third Wave.
3. Attack Rate Increase Ratio (Var 3 = Var2/Var1): It is calculated as a coefficient to estimate the attack rate and how many times increased in the third wave.
Urban indicators
The indicators which may function as either proximal or distal determinants of health were taken as independent variables in the analysis. These indicators are gathered under five groups: demographic, health care capacity, economic, environmental, and socio-cultural. Table 1 shows the indicators' calculations, data years, and sources.
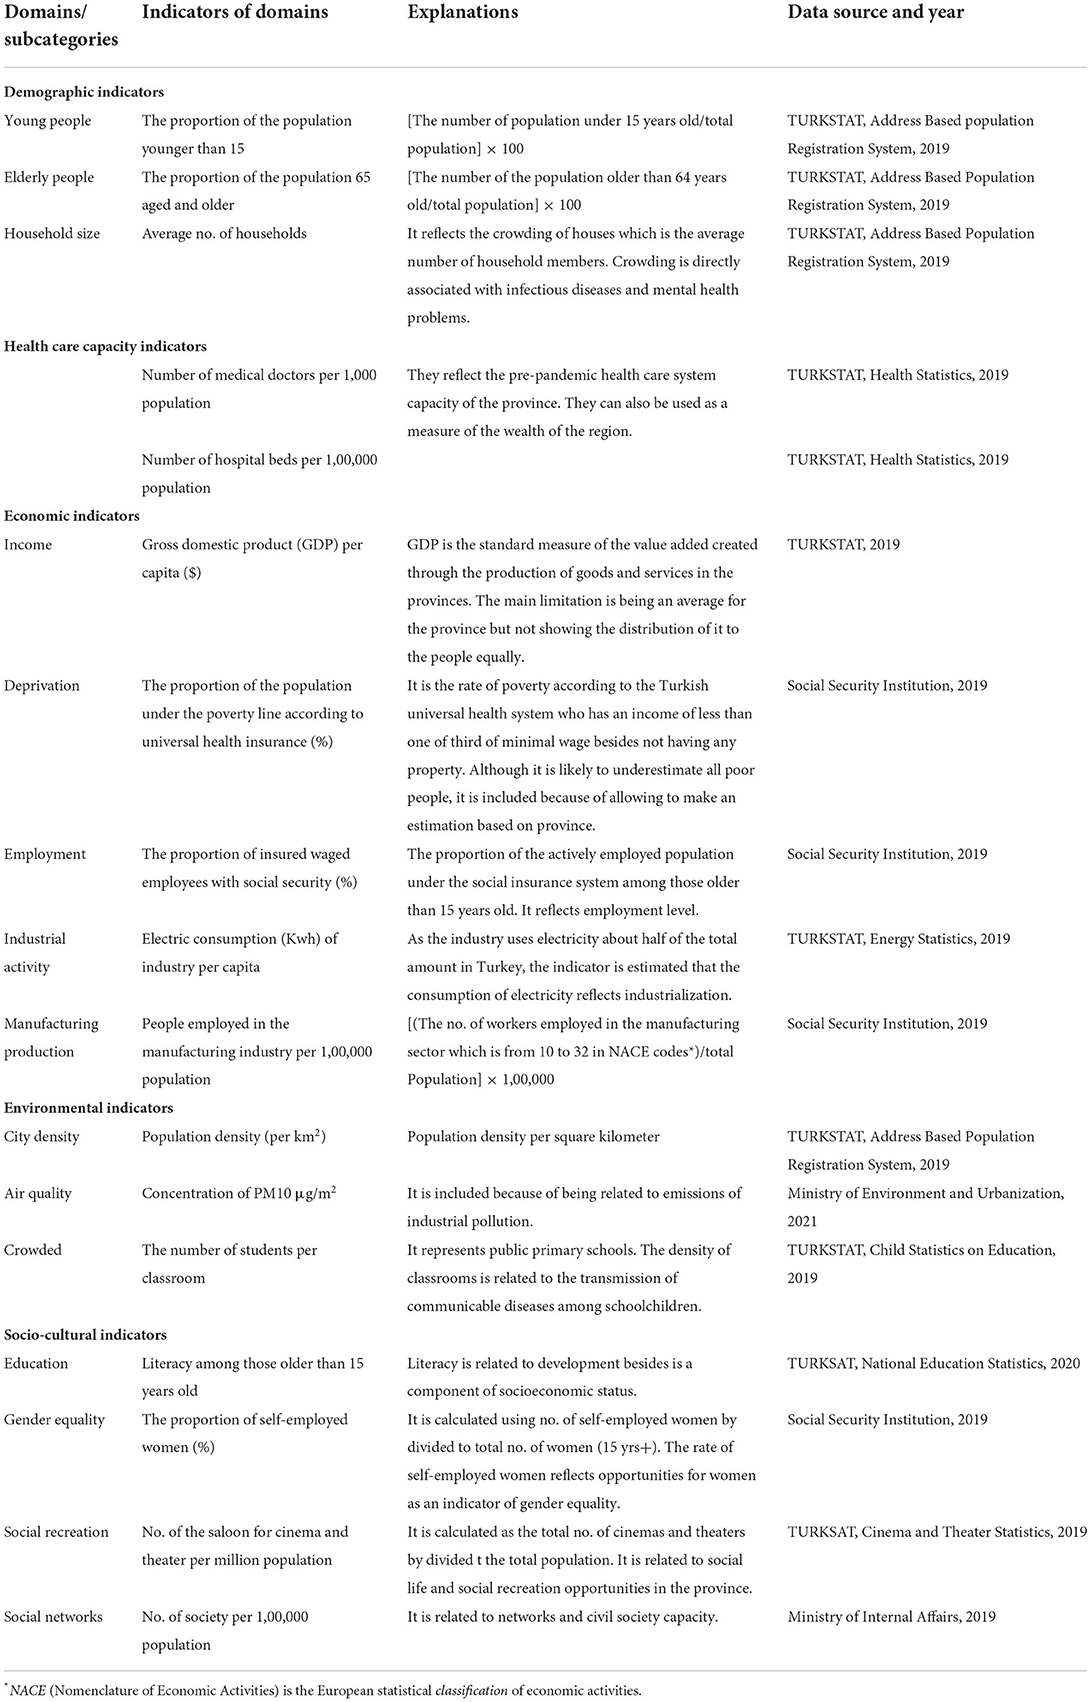
Table 1. The list of urban health indicators.
The urban health indicators were used after standardization based on ranking the values (22). This method is widely used in urban health studies, especially in building urban health index (23). In the present study, we used each indicator rather than combining them with an index because the direction of some associations with COVID-19 is uncertain. Standardization of each urban indicators (I) was carried out using the formula shown below: Istandardized = [Ii – min*(I)]/[max(I) – min*(I)]. In the formula, Ii is the mean value of an indicator in the provinces, max(I) is the maximum value and min*(I) is the minimum value of that indicator in the same province (23).
Statistical analysis
Descriptive statistics of the weekly attack rates were calculated as median, mean, standard deviation, minimum, and maximum values for 81 provinces. Kolmogorov-Smirnov test was applied to all variables to test the normality. The attack rate before the third wave was not normally distributed (p < 0.05), while the distribution of both peak attack rate and increase ratio were normal (p > 0.05). The association of increase ratio with urban indicators was conducted using a bivariate analysis such as Pearson and Spearman correlation. A multiple linear regression model was executed with the significant variables (p < 0.10). The analyses were conducted in IBM SPSS 22.0 Program. The epidemiologic maps were produced using Microsoft Excel 2D and 3D maps to show the spatial distribution of both pre-and during the third wave.
Results
Figure 3 shows a map of the provinces' COVID-19 attack rate (per 1,00,000 population) just before the third wave started in Turkey in February 2021. While the rates were in a wide range between 4.7 and 241.5 per 1,00,000 population, the six provinces in the Region Black Sea had the highest rates ranging between 166.5 to 301.7 per 1,00,000 population.
Table 2 shows the descriptive statistics of the attack rates of COVID-19 (per 1,00,000 population) in the provinces from February to April 2021 in Turkey. While the attack rates of COVID-19 were statistically similar in the first two weeks (p > 0.05), a significant increase started by the third week (February 20–26) (Figure 4, p = 0.005). Of the provinces, four (4.9%) reached their peak in the 9th week, 25 (30.9%) in the 10th week, and 52 (64.2%) in the 11th week, April 17-23. Using February as the baseline level, the attack rate increase ratio was between 1.05 and 29.5 times among the provinces.
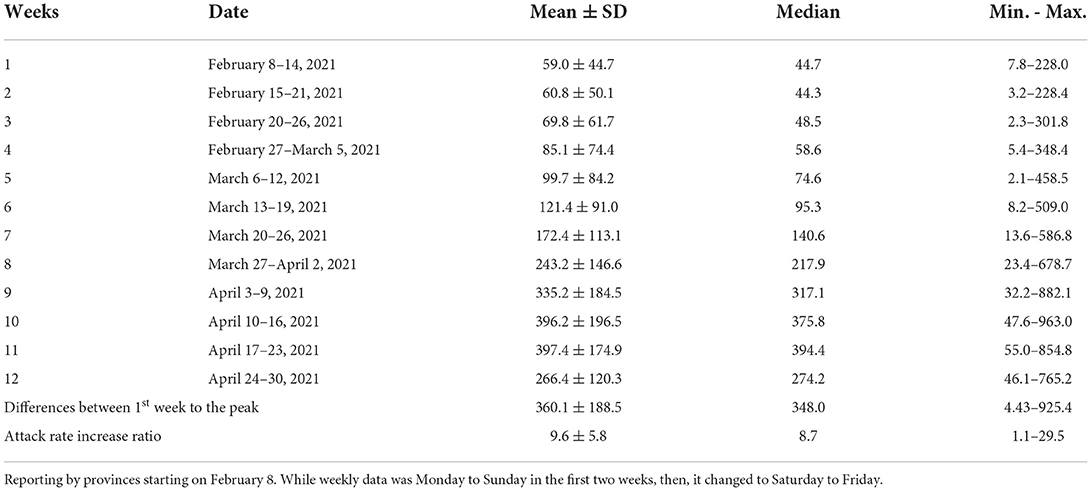
Table 2. Descriptive statistics of the attack rates of the COVID-19 (per 100.000 population) by the provinces from February to April 2021 in Turkey.
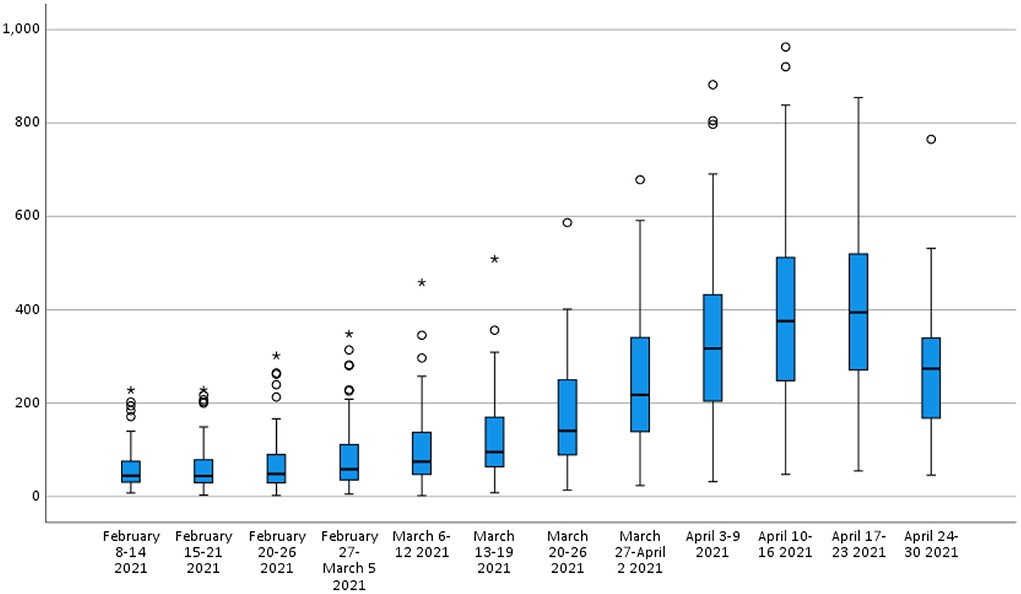
Figure 4. The attack rates of COVID-19 (per 1,00,000 population) by the provinces in Turkey.
Table 3 presents the Pearson/ Spearman's correlation analysis between the attack rates and urban indicators in Turkey's third wave of COVID-19 outbreak. The table shows that the attack rate before the wave, during the peak, and increase ratio were analyzed separately as a dependent variable. Although the attack rates before and during the wave are associated with some urban indicators, the attack rate increase ratio is not correlated with most of the indicators. Among the provinces, the increase ratio in the third wave has only shown significant correlations to education level and economic indicators such as income, employment, industrial activity measured by electric consumption, and economic activity of the manufacturing industry.
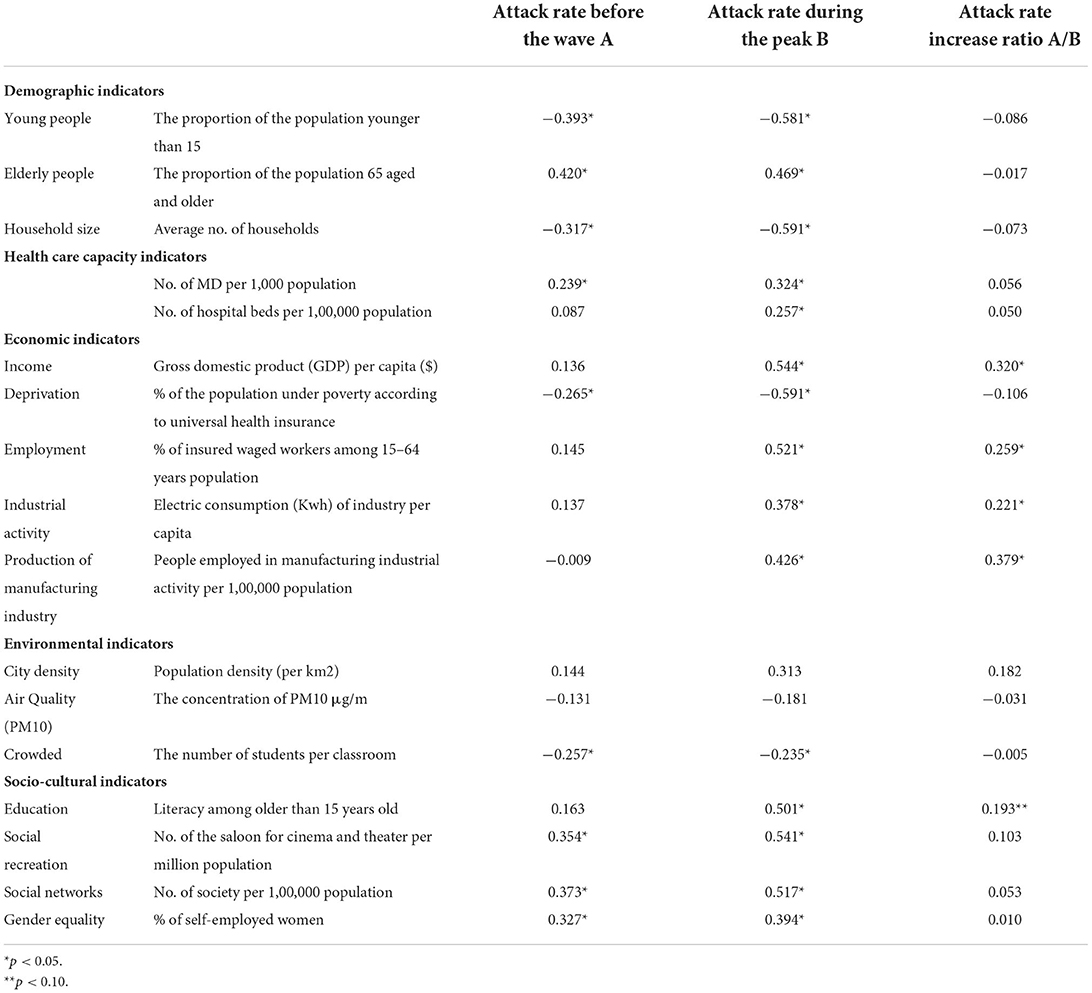
Table 3. The bivariate correlations between the attack rates and urban indicators in the third wave of the COVID-19 outbreak in Turkey.
We used multiple linear regression analysis to assess the strength of the relationship between the increase ratio of attack rates and several urban indicators, as well as the importance of each of the indicators to the relationship. Since the increase ratio of attack rates from the beginning to the peak of the third wave was normally distributed, we chose the increase ratio as a dependent variable for multiple analyses. In the multiple linear analysis shown in Table 4, the indicator of economic activity in the manufacturing industry showed a correlation to the increase ratio while other variables did not. This association is also presented on the map in Figure 5.
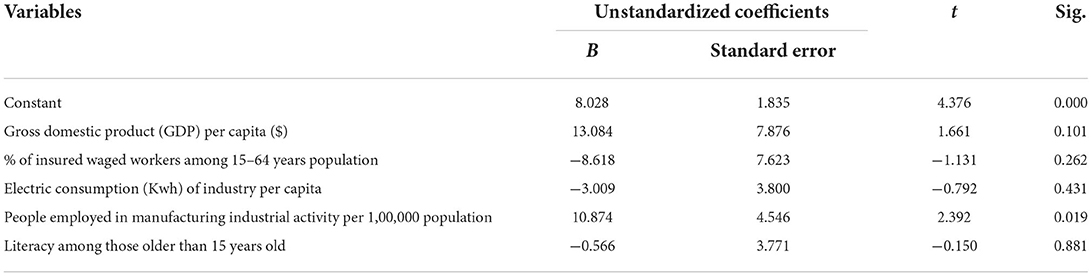
Table 4. Multiple linear analysis for the correlates of the attack rate increase ratio in the third wave of the COVID-19 outbreak in Turkey.
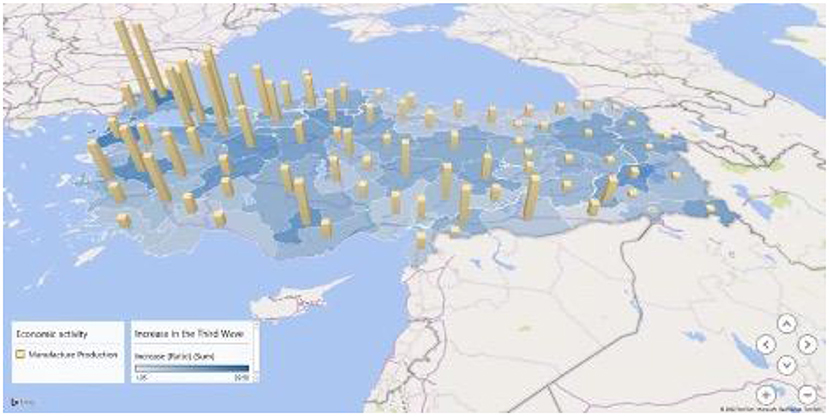
Figure 5. Attack rate increase ratio and manufacturing industrial activity in the third wave of COVID-19 outbreak in Turkey.
Discussion
Our research contributes to the literature in two ways. First, we tested a wide range of urban health indicators at the provincial level during high COVID-19 cases to understand the increases in attack rates in terms of geographic differences. Using urban health indicators enables cross-province comparisons and helps identify associations between health determinants and health impacts. As COVID-19 vaccination started later in Turkey compared to other countries, the third wave in Turkey occurred at a time when vaccination was less common. Thus, the effect of environmental and social factors can be observed as more apparent.
The current study adopts a different approach from existing literature by using provinces as a key unit of analysis. Cities are complex communities of heterogeneous individuals, and multiple factors may be important determinants of health in cities. As Galea and Vlahov (24) indicated, the studies used the city as a critical unit of analysis to reach conclusions about urban characteristics associated with health. This approach also allows us to consider the determinants of health that may be unmeasured since geographical units, such as provinces, have an accumulation of many features in the context of their local dynamics.
Although our study has exciting findings, several limitations exist within our work. First, our study is limited to Turkey. Second, our results are limited to the use of geographically clustered data. Correlations found in ecological studies may not reflect what is observed at the individual level. Furthermore, the shortcomings in data accessibility for more comprehensive analysis should be recognized. Finally, since cases were only laboratory-confirmed, COVID-19 patients that were PCR negative or undiagnosed due to mild illness were not included in the analysis. Caution should be applied when interpreting the results of spatial analytical studies using secondary data sources.
As well-known, individuals older than 65 years are more at risk for both mortality and morbidity of COVID-19 due to higher rates of comorbidity (25). In our analysis, the provinces with a higher proportion of older people were positively correlated with the attack rates. The provinces with a younger population and larger household sizes showed fewer COVID-19 infections. These results were consistent with a recent ecological study examining intraurban variations of COVID-19 incidence in Barcelona. It reported that a high number of neighborhoods with higher numbers of older adults and long-term care facilities were statistically more likely to have a higher number of cases of COVID-19 during the first outbreak of the pandemic (26). An estimated 1% increase in older people or mobility during quarantine would lead to almost 30 extra cases.
The present study found an association between the health care capacity and COVID-19 attack rates. As the number of doctors and hospital beds in the province increased, the attack rates also increased. Expanding access to healthcare facilities can increase the number of cases diagnosed and reduce underreporting, which may contribute to increased coefficients incidence and mortality. A previous study examining the spatial dynamics of the COVID-19 pandemic in Brazil revealed that primary health care coverage is directly related to the incidence of COVID-19 (27). Confirming these findings, a study examining the spatial distribution across African countries found more cases in countries with higher healthcare capacity, as measured by the number of hospital beds and doctors (28). The authors explained this paradox because health care capacity can be used as a measure of a country's wealth. Unlike these results, a recent Malaysian study found no significant relationship between COVID-19 incidence and coverage of primary healthcare services (29). However, the same research explained the low number of cases in regions with low per capita income and a significant GINI coefficient, with insufficient access to health services.
It is noteworthy that all economic indicators under analysis except one showed a correlation with the attack rates in the peak and increase ratios during the third wave. The attack rates during the peak have risen remarkably in provinces with a higher gross domestic product per capita, a higher percentage of insured wage-earners aged 15–64, higher electricity consumption of the industry per capita, a higher number of people per 1,00,000 population in the manufacturing industry and lower population under poverty according to universal health insurance. Our results suggest that the incidence of COVID-19 is higher in more industrialized and economically and financially developed provinces. On the other hand, only manufacturing industrial activity was correlated after applying the multiple regression. A study developed on the estimation and prediction of COVID-19 cases in Brazil confirms the results of our research. It pointed out that the highest number of cases are found in the cities of São Paulo, the country's largest financial and commercial center, and Rio de Janeiro, the most prominent tourist destination (27). Another study from Malaysia observed that the incidence of COVID-19 cases was high in the country's highly industrialized, economic, and financial epicenter (29). These results were consistent with other studies from China (30), India (31), and England (32).
Regarding outbreak control measures in Turkey, industrial activities were excluded from lockdowns, while all other sector activities were highly restricted. The continuation of manufacturing production from the onset of the third wave to the peak may have hindered employees' ability to maintain social distancing as they had to leave home for work, take public transport, and were often exposed to overcrowded conditions. Second, implementing a policy of mass testing by the government in industry and factories, and even in large non-industrial workplaces, may have resulted in significantly higher cases reported. In addition, the low number of cases in provinces with higher poverty populations can be explained by the lack of access to testing opportunities, as argued in previous studies by (28, 29).
Previous epidemiological and spatial analysis studies have revealed that cities with the highest population density also have the highest incidence of COVID-19 (26–29). Contrary, we found no significant correlation between the attack rate of COVID-19 and population density, neither at the beginning of the wave nor at the peak. At first glance, our results seem surprising, given that the virus is spread through human contact and areas with high population density can provide more opportunities for human interactions. It can be explained by several factors that can be confounding. For example, most of the population density may be young people who are less likely to develop symptoms. In addition, both behavioral and policy-induced behavior changes may differ in dense provinces. Studies on the 1918 influenza pandemic have shown that population density may not be correlated with the spread and severity of infectious diseases (33, 34).
Several studies have found an association between air quality and the incidence and severity of COVID-19 (12, 13, 20, 35–37). Atmospheric particulate matter can act as a virus carrier, creating a suitable environment for carrying the virus over longer distances (38). The present study observed no significant relationship between particulate matter pollution and COVID-19 attack rates. With the data obtained from online stations of the Ministry of Environment, Urbanization and Climate Change of Turkey, the annual average PM level of the province was calculated by taking the yearly average of the annual data of all stations in that province. Therefore, the stations may not reflect the air pollution situation of the province throughout the year. Further research needs to be done to establish this relationship by using models that calculate the air pollution of provinces by considering different factors such as prevailing wind, temperature, and humidity.
Conclusion
The spatial distribution of COVID-19 rates across provinces showed that they did not spread uniformly. The most striking result to emerge from the data is the strong positive correlation between the economic activity of the manufacturing industry and the increase ratio of COVID-19 attack rate in the third wave of Turkey. All our findings support each other, showing that the cases are higher in more developed cities with more manufacturing sector activity. Although greater social mobility can explain this development in cities, it makes us think that it is mainly related to inequalities arising from access to health institutions and testing. According to the results, it can be determined that the partly lockdown strategy, which excluded the industrial activity in the country, concluded the higher increase in the attack rates in highly industrialized provinces.
Data availability statement
The datasets presented in this study can be found in online repositories. The names of the repository/repositories and accession number(s) can be found in the article/supplementary material.
Author contributions
All authors listed have made a substantial, direct, and intellectual contribution to the work and approved it for publication.
Acknowledgments
The authors thank Veronika Scavacini for her editing and constructive recommendations.
Conflict of interest
The authors declare that the research was conducted in the absence of any commercial or financial relationships that could be construed as a potential conflict of interest.
Publisher's note
All claims expressed in this article are solely those of the authors and do not necessarily represent those of their affiliated organizations, or those of the publisher, the editors and the reviewers. Any product that may be evaluated in this article, or claim that may be made by its manufacturer, is not guaranteed or endorsed by the publisher.
References
1. Raoofi A, Takian A, Haghighi H, Rajizadeh A, Rezaei Z, Radmerikhi S, et al. COVID-19 and Comparative health policy learning; the experience of 10 countries. Arch Iran Med. (2021) 24:260–72. doi: 10.34172/aim.2021.37
2. Wang D, Mao Z. A comparative study of public health and social measures of COVID-19 advocated in different countries. Health Policy. (2021) 125:957–71. doi: 10.1016/j.healthpol.2021.05.016
3. Bank W,. Databank Country Profile: Turkey. (2022) 10'th September. Available online at: https://data.worldbank.org/country/turkiye?view=chart (accessed September 10, 2022).
4. Mo H,. General Table of Coronavirus Ministry of Health, Turkey. (2022). Available online at: https://covid19.saglik.gov.tr/TR-66935/genel-koronavirus-tablosu.html (accessed April 1, 2022).
5. CDC. Demographic Trends of COVID-19 cases and deaths in the US reported to CDC. Centers for Disease Control and Prevention. (2022). Available online at: https://covid.cdc.gov/covid-data-tracker/#demographics (accessed April 2, 2022).
6. CDC. Health Equity Considerations and Racial and Ethnic Minority Groups. (2022). Available online at: https://www.cdc.gov/coronavirus/2019-ncov/community/health-equity/race-ethnicity.html (accessed April 2, 2022).
7. Ganasegeran K, Jamil MFA, Ch'ng ASH, Looi I, Peariasamy KM. Influence of Population density for COVID-19 spread in Malaysia: an ecological study. Int J Environ Res Public Health. (2021) 18:8. doi: 10.3390/ijerph18189866
8. Coşkun H, Yildirim N, Gündüz S. The spread of COVID-19 virus through population density and wind in Turkey cities. Sci Total Environ. (2021) 751:141663. doi: 10.1016/j.scitotenv.2020.141663
9. Bhadra A, Mukherjee A, Sarkar K. Impact of population density on COVID-19 infected and mortality rate in India. Model Earth Syst Environ. (2021)7:623–29. doi: 10.1007/s40808-020-00984-7
10. Baser O. Population density index and its use for distribution of Covid-19: a case study using Turkish data. Health Policy. (2021) 125:148–54. doi: 10.1016/j.healthpol.2020.10.003
11. Han Y, Lam JCK, Li VOK, Crowcroft J, Fu J, Downey J, Gozes I, Zhang Q, Wang S, Gilani Z. Outdoor PM2.5 concentration and rate of change in COVID-19 infection in provincial capital cities in China. Sci Rep. (2021) 11:23206. doi: 10.1038/s41598-021-02523-5
12. Piazzalunga-Expert A. Evaluation of the potential relationship between Particulate Matter (PM) pollution and COVID-19 infection spread in Italy. Societa Italiana Di Medicina Ambientale. (2020) 2:1–6.
13. Zhang X, Tang M, Guo F, Wei F, Yu Z, Gao K, et al. Associations between air pollution and COVID-19 epidemic during quarantine period in China. Environ Pollut. (2021) 268:115897. doi: 10.1016/j.envpol.2020.115897
14. Fareed Z, Bashir MF, Salem S. Investigating the Co-movement nexus between air quality, temperature, and COVID-19 in California: Implications for public health. Front Public Health. (2021) 9:815248. doi: 10.3389/fpubh.2021.815248
15. Bashir MF, Benghoul M, Numan U, Shakoor A, Komal B, Bashir MA, et al. Environmental pollution and COVID-19 outbreak: insights from Germany. Air Qual Atmos Health. (2020) 13:1385–94. doi: 10.1007/s11869-020-00893-9
16. Qiu Y, Chen X, Shi W. Impacts of social and economic factors on the transmission of coronavirus disease 2019 (COVID-19) in China. J Popul Econ. (2020) 33:1127–72. doi: 10.1007/s00148-020-00778-2
17. Kong JD, Tekwa EW, Gignoux-Wolfsohn SA. Social, economic, and environmental factors influencing the basic reproduction number of COVID-19 across countries. PloS ONE. (2021) 16:e0252373. doi: 10.1371/journal.pone.0252373
18. Oshinubi K, Rachdi M, Demongeot J. Modeling of COVID-19 pandemic vis-à-vis Some socio-economic factors. Front Appl Mathem Stat. (2022) 7:786983. doi: 10.3389/fams.2021.786983
19. Aral N, Bakir H. Spatiotemporal analysis of Covid-19 in Turkey. Sustain Cities Soc. (2022) 76:103421. doi: 10.1016/j.scs.2021.103421
20. Aykaç N, Etiler N. COVID-19 mortality in Istanbul in association with air pollution and socioeconomic status: an ecological study. Environ Sci Pollut Res. (2022) 29:13700–08. doi: 10.1007/s11356-021-16624-1
21. TURKOVID19. Open Data. (2021). Available online at: https://turcovid19.com/acikveri/ (accessed September 19, 2021).
22. Rothenberg R, Weaver SR, Dai D, Stauber C, Prasad A, Kano M. A flexible urban health index for small area disparities. J Urban Health. (2014) 91:823–35. doi: 10.1007/s11524-014-9867-6
23. WHO. The Urban Health Index: A handbook for its calculation and use. Kobe, Japan: Organisation WH (2014).
24. Galea S, Vlahov D. Urban health: evidence, challenges, and directions. Ann Rev Public Health. (2005) 26:341–65. doi: 10.1146/annurev.publhealth.26.021304.144708
26. Lopez-Gay A, Spijker J, Cole HVS, Marques AG, Triguero-Mas M, Anguelovski I, et al. Sociodemographic determinants of intraurban variations in COVID-19 incidence: the case of Barcelona. J Epidemiol Commun Health. (2022) 76:1–7. doi: 10.1136/jech-2020-216325
27. Castro RR, Santos RSC, Sousa GJB, Pinheiro YT, Martins R, Pereira MLD, et al. Spatial dynamics of the COVID-19 pandemic in Brazil. Epidemiol Infect. (2021) 149:e60. doi: 10.1017/S0950268821000479
28. Gayawan E, Awe OO, Oseni BM, Uzochukwu IC, Adekunle A, Samuel G, et al. The spatio-temporal epidemic dynamics of COVID-19 outbreak in Africa. Epidemiol Infect. (2020) 2;148:e212. doi: 10.1017/S0950268820001983
29. Ganasegeran K, Jamil MFA, Appannan MR, Ch'ng ASH, Looi I, Peariasamy KM. Spatial dynamics and multiscale regression modelling of population level indicators for COVID-19 spread in Malaysia. Int J Environ Res Public Health. (2022)19:4. doi: 10.3390/ijerph19042082
30. Qi H, Xiao S, Shi R, Ward MP, Chen Y, Tu W, et al. COVID-19 transmission in Mainland China is associated with temperature and humidity: a time-series analysis. Sci Total Environ. (2020) 728:138778. doi: 10.1016/j.scitotenv.2020.138778
31. Bhunia GS, Roy S, Shit PK. Spatio-temporal analysis of COVID-19 in India—a geostatistical approach. Spatial Inform Res. (2021) 29:661–72. doi: 10.1007/s41324-020-00376-0
32. Elson R, Davies TM, Lake IR, Vivancos R, Blomquist PB, Charlett A, et al. The spatio-temporal distribution of COVID-19 infection in England between January and June 2020. Epidemiol Infect. (2021) 149:e73. doi: 10.1017/S0950268821000534
33. Mills CE, Robins JM, Lipsitch M. Transmissibility of 1918 pandemic influenza. Nature. (2004) 432:904–6. doi: 10.1038/nature03063
34. Pearl R, United States. Public health service. Influenza studies. Washington, DC: Govt. print. off. (1921). 28 p.
35. Chen Z, Huang BZ, Sidell MA, Chow T, Eckel SP, Pavlovic N, et al. Near-roadway air pollution associated with COVID-19 severity and mortality—multiethnic cohort study in Southern California. Environ Int. (2021) 157:106862. doi: 10.1016/j.envint.2021.106862
36. Ghanim AAJ. Analyzing the severity of coronavirus infections in relation to air pollution: evidence-based study from Saudi Arabia. Environ Sci Pollut Res Int. (2021) 29:6267–77. doi: 10.1007/s11356-021-15507-9
37. Isphording IE, Pestel N. Pandemic meets pollution: poor air quality increases deaths by COVID-19. J Environ Econ Manag. (2021) 108:102448. doi: 10.1016/j.jeem.2021.102448
Keywords: COVID-19, pandemic, attack rates, urban health indicators, spatial analysis, ecologic study
Citation: Yavuz M and Etiler N (2022) The correlation between attack rates and urban health indicators during the third wave of the COVID-19 outbreak in Turkey. Front. Public Health 10:986273. doi: 10.3389/fpubh.2022.986273
Received: 19 July 2022; Accepted: 31 October 2022;
Published: 16 November 2022.
Edited by:
Kin On Kwok, The Chinese University of Hong Kong, ChinaReviewed by:
Kayode Oshinubi, Université Grenoble Alpes, FranceMuhammad Farhan Bashir, Shenzhen University, China
Copyright © 2022 Yavuz and Etiler. This is an open-access article distributed under the terms of the Creative Commons Attribution License (CC BY). The use, distribution or reproduction in other forums is permitted, provided the original author(s) and the copyright owner(s) are credited and that the original publication in this journal is cited, in accordance with accepted academic practice. No use, distribution or reproduction is permitted which does not comply with these terms.
*Correspondence: Nilay Etiler, bmlsYXkuZXRpbGVyQG9rYW4uZWR1LnRy
†These authors have contributed equally to this work