 Wenlong Ding1
 Yunyun Wang
 Feng Chen
 Dong Lin
- 1The Key Laboratory of Road and Traffic Engineering, Ministry of Education, Tongji University, Shanghai, China
- 2Faculty of Civil Engineering and Geosciences, Delft University of Technology, Delft, Netherlands
- 3School of Traffic and Transportation, Chongqing Jiaotong University, Chongqing, China
- 4Civil and Environmental Engineering, University of California, Los Angeles, Los Angeles, CA, United States
- 5School of Engineering, University of Aberdeen, Aberdeen, United Kingdom
The rapid development of the economy has promoted the growth of freight transportation. The truck service areas on expressways, as the main places for truck drivers to rest, play an important role in ensuring the driving safety of trucks. If these service areas are constructed densely or provide a plentiful supply of parking areas, they are costly to construct. However, if the distance between two adjacent truck service areas is very large or the number of truck parking spaces in service areas is small, the supply will fail to meet the parking needs of truck drivers. In this situation, the continuous working time of truck drivers will be longer, and this is likely to cause driver fatigue and even traffic accidents. To address these issues, this paper established a non-linear optimization model for truck service area planning of expressways to optimize truck driving safety. An improved genetic algorithm is proposed to solve the model. A case study of a 215.5-kilometers-length section of the Guang-Kun expressway in China was used to demonstrate the effectiveness of the model and algorithm. As validated by this specific case, the proposed model and solution algorithm can provide an optimal plan for the layout of truck service areas that meet the parking needs of truck drivers while minimizing the service loss rate. The research results of this paper can contribute to the construction of truck service areas and the parking management of trucks on expressways.
Introduction
Expressways are characterized by simple road geometries where drivers usually travel for long distances at high speeds (1). With the rapid development of expressway construction, expressway freight transportation plays an important role in the whole freight transportation system. Expressway freight transportation can promote rapid development of the economy (2–4). Expressway traffic accidents are usually very serious due to the high speed of vehicles (5), and the heavy weight and large size of trucks (6–9). Therefore, greater attention should be paid to ensuring truck driving safety on expressways.
A lot of research has been done to identify the factors that contribute to truck accidents (10, 11). Among the factors involved in accidents, human factors are among the most important (12). Of the factors affecting driving performance, driver fatigue is vital, and a subject on which many studies have been conducted (13–15). Philip et al. (16) found that driver fatigue adversely and significantly impacts driver performance on driving tests. Driver fatigue is a major concern in road safety (17–19). Continuous driving without rest is a common situation for truck drivers (12), and may be aggravated by overloaded and irregular work schedules (20). Especially when driving on expressways, if the distance between service areas is too large, or there are too few truck parking spaces in the service areas, this will cause truck drivers to drive continuously for a long time. Some research has indicated that driving performance measures begin to deteriorate after 2 h of driving (21). Drivers who have driven for a long period of time without a break are more likely to experience drowsiness, which can lead to a decline in attention (22). Some research has studied the relationship between rest time and driver fatigue (14, 16, 17, 23). Accordingly, much research has been done to identify useful methods to relieve driver fatigue. Merat and Jamson (13) describe road-based measures for alleviating the symptoms of fatigue, and these include variable message signs, chevrons, and rumble strips. A rumble strip is a narrow band of built-in unevenness in the road surface that is normally placed close to the edge line or at the centerline, producing a short alerting effect if the truck diverts from the driving lane (24).
Because of the terrible potential effect of drowsy driving, many countries have put in place a lot of countermeasures, such as increasing public awareness and education, developing traffic safety policies, and using advanced vehicle technologies. In addition, installation of rest areas alongside freeways or expressways provides drivers with opportunities to eat, rest and refuel their vehicles and this enhances the comfort and convenience of drivers (especially considering the limited number of access points in an expressway system), and reduces fatigue-related crashes (1, 25, 26). The installation of proper heavy-vehicle rest area facilities is essential for safe and efficient interstate freight transport (26). In South Korea, supplemental rest areas have been installed on expressway systems to allow road users to rest; these are small-sized resting facilities located between the larger regular rest areas and have proven to be cost-effective (1). Rahman and Kang (15) found that the drowsy driving advisory, which is an engineering countermeasure designed to reduce the likelihood of drowsy-driving crashes, could significantly reduce driving crashes when cooperated with rest area facilities.
The service area is an important part of the expressway and plays an important role in traffic safety. In addition to the physiological characteristics of truck drivers, trucks traveling on expressways also have needs such as refueling and maintenance. Service areas can meet the demands of both drivers and trucks, such as having a rest, catering, refueling, and making repairs. Increasing the total rest-break duration and taking more rest breaks can reduce fatigue-related crash risk (20). Therefore, resting in the service area can help reduce driver fatigue, thus benefiting expressway safety.
Many scholars have studied the issues related to the expressway service area setting, management, etc., Jian-Wei and Yi (27) proposed a transportation potential calculation model for the service area of the expressway using transportation potential theory. Jiang and Hou (28) studied the characteristics of expressways to make the spatial planning scale of the service area reasonable and appropriate, which can not only meet the needs of customers, but also can save investment, reduce land use, and protect the environment. Koo et al. (29) developed a decision support system to determine the optimal size of the service areas of the expressways. Wu et al. (30) proposed a decision-making framework for ensuring the validity of the site selection of the expressway service area photovoltaic. By analyzing the operating data of the expressway service area, Wang et al. (31) predicted the transient population in the service area of the expressway using the Long Short-Term Memory method. Shen et al. (32) provided a theoretical basis for layout optimization and evaluation for the expressway service areas based on the economic and social adaptability. Zhao et al. (33) developed a traffic flow prediction model to improve the expressway service area management ability. Zhi et al. (34) conducted research on the expressway intelligent service area to summarize the characteristics, analyze the existing problems and elaborate the key technologies of the expressway intelligent service area.
Parking spaces are an important part of the service areas on expressways. There is a strong relationship between the number of parking spaces in the service areas and the driving safety of truck drivers. Based on the traffic volume, the distance between service areas and the parking rate, the appropriate number of parking spaces can be determined (35). The parking rate can be forecast through methods such as field surveys, BP neural networks (36), and genetic algorithms (32).
Nowadays, problems still exist in the planning of truck service areas in many countries worldwide, resulting in problems such as unbalanced service area spacing and insufficient numbers of parking spaces. At present, many countries in the world still lack a standardized method for calculating the spacing of service areas and the number of parking spaces for trucks in service areas. This study focuses on the distance between truck service areas and the number of parking spaces truck drivers need to ensure driving safety.
The remainder of this paper is organized as follows: Section Problem statement and notation presents the problem statement and variable definitions. Section Mathematical model provides the mathematical model for truck service area planning. Section Solution algorithms presents an improved genetic algorithm to solve the model. The model and algorithm are numerically validated in Section Numerical example, based on an expressway route in Yunnan province, China. Section Conclusion provides research conclusions and recommendations for further research.
Problem statement and notation
Problem statement
In the context of expressways with mixed passenger and freight traffic in China, Sha (37) analyzed the existing problems and their causes from the perspectives of expressway traffic safety, operation efficiency, and travel quality. In addition, Sha (37) also believes that the construction of the expressway passenger and freight systems is very necessary to improve the operational efficiency and traffic safety levels of expressways.
This study provides a mathematical method to determine the appropriate distance between service areas and the number of truck parking spaces in service areas, based on the division of construction of the expressway passenger and freight systems. The assumptions in this paper are as follows:
(1) Truck drivers will choose to rest in the service area after driving continuously on the expressway for a long period of time;
(2) The vehicles are traveling at the same constant speed;
(3) After the trucks arrive at the expressway service area, they form a single line;
(4) When trucks arrive at an expressway service area, they will leave directly if there are no available parking spaces.
Notations
The notations used in this paper are summarized in Table 1.
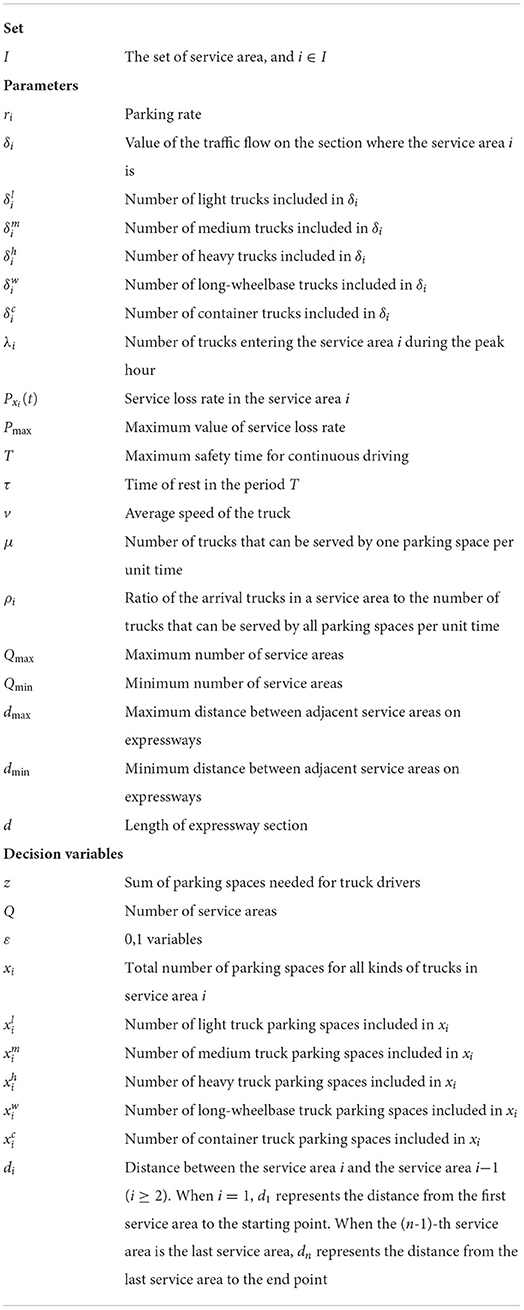
Table 1. Notation.
Mathematical model
Model of service loss rate
As shown in Figure 1, after the trucks arrive at the expressway service area, they form a single line. Therefore, it is clear that the process of parking for trucks is based on the M/M/c/∞/∞ queuing model.
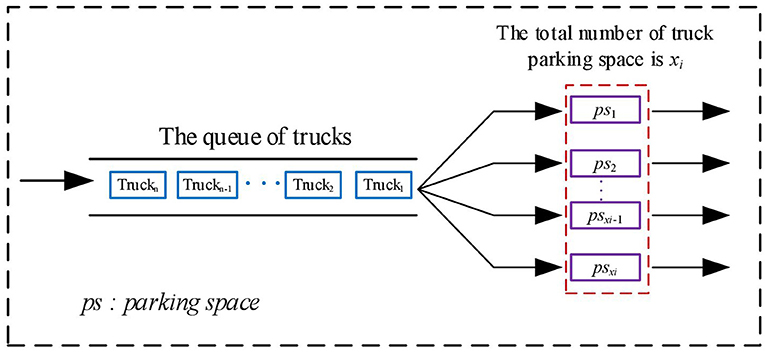
Figure 1. Illustration of truck parking spaces in service areas.
The number of trucks entering the service area i can be obtained as:
where
Trucks parking in the expressway service areas obey the M/M/c/∞/∞ model.
The first M indicates that the trucks' arrival follows Poisson distribution. The second M indicates that the parking time of trucks follows exponential distribution. The symbol c represents the number of truck parking spaces in the service area. The first ∞ means that there is no limit to the system capacity and the second ∞ means that there is no limit to the number of trucks. Therefore, the ratio of the arriving trucks in a service area to the number of trucks that can be served by all parking spaces per unit time can be calculated as:
When trucks arrive at an expressway service area, drivers will leave immediately if there are no available parking spaces. This means that the parking spaces provided in the service areas cannot meet the parking needs of the truck drivers. In this case, the service loss rate can be generated. The service loss rate is an indicator used to measure the relationship between the supply of expressway service areas and the demand of truck drivers. The greater the service loss rate, the less the parking supply meets the parking demand. The smaller the value of the service loss rate, the more the truck drivers' parking needs are met. In practice, the service loss rate should be set at different values according to different situations in order to meet the parking needs of truck drivers. This will ensure driver safety and achieve the goal of saving on the construction cost of expressway service areas. The service loss rate Pxi(t) can be calculated as follows (38) (see Appendix A):
In this case, we determine the maximum service loss rate is Pmax. Therefore, the following constraint needs to be met:
Model of the number of expressway service areas
The number of expressway service areas should be between the maximum number and the minimum number of expressway service areas. Therefore, we can deduce:
and
where represents the largest positive integer not exceeding and represents the largest positive integer not exceeding .
The value of ε can be calculated as follows:
The value of is the set of. When and are integers, the minimum number of truck service areas is . When and are not integers, the minimum number of truck service areas is . By (8) and (9), we can also deduce that the maximum number of truck service areas is when and are integers. The maximum number of truck service areas is under the condition where and are not integers.
Model of truck parking rate based on driving safety
The distance between expressway service areas should reasonably consider factors such as vehicle speed, and traffic volume. If the distance between service areas is too small, the number of service areas will increase, leading to an increase in construction costs. If the distance between service areas is too large to meet the requirements of safe driving, this can cause traffic accidents. We assume that the maximum distance allowed in the service area is dmax and the minimum distance is dmin. In practice, the distance between service areas should be between the maximum and the minimum, that is
Driving continuously for a long time can cause driver fatigue and traffic accidents. Many countries have enacted laws limiting a driver's maximum continuous driving time. For example, China has stipulated that drivers should not drive continuously for more than 4 h. When the truck driver has been driving continuously on an expressway for a long time, he or she should drive the truck into a service area for a proper rest. In this paper, we assume that T is the maximum value of the driver's continuous driving time. The parking probability of trucks based on driving safety can be calculated as follows (38) (see Appendix B):
Optimization model for truck service area planning
In this section, the optimization model for truck service area planning is established. The optimization model is as follows:
The objective function of (12) is to minimize the total number of truck parking spaces in all service areas that meet the parking needs of truck drivers. Constraint (14) indicates that the distance from the first truck service area to the starting point of the research section, together with the distances between all adjacent truck service areas, and the distance from the last truck service area to the end of the research section, equals the total length of the road section. Constraint (15) ensures that the distance from the last truck service area to the end of the road section is not greater than the maximum specified distance between adjacent truck service areas. Constraint (16) specifies the domain of decision variables.
The total number of truck parking spaces in each service area can be calculated by solving the optimization model composed of Equations (12–16). In practice, due to the different types of trucks, the types of truck parking spaces required are also different. The number of parking spaces for different trucks can be further evaluated according to the following calculation method:
where Equations (17–21) represent the number of light truck parking spaces, medium truck parking spaces, heavy truck parking spaces, long-wheelbase truck parking spaces, and container carrier parking spaces, respectively, in the i-th truck service area.
It is worth noting that the number of truck parking spaces for different trucks calculated by Equations (17)–(21) may be a decimal. However, the actual number of truck parking spaces can only be an integer. In order to meet the parking needs of truck drivers, this paper rounds up the calculation results of different parking spaces. For example, θ represents the smallest integer greater than θ.
Solution algorithms
Genetic Algorithm (GA) optimizes the feasible solution based on the idea of evolution. Traditional genetic algorithms only use three genetic operators: crossover, mutation, and selection, and this makes it difficult to converge to the global optimal solution and may even destroy the optimal individual. The optimal retention strategy is to copy one or more optimal individuals (elites) in the evolution process directly to the next generation for retention. This strategy can make the genetic algorithm converge globally. Figure 2 is a working flow chart of the genetic algorithm with an elite retention strategy. The specific steps are as follows:
Step 0: A population that fits the set coding range and population number is randomly chosen as the initial population, and the fitness of each individual in the initial population is calculated. This is the first step.
Step 1: Select elite individuals based on fitness value, and use the roulette wheel method to select people from the current population. Perform crossover operations on the selected individuals to generate new individuals. Then, on the new individuals, perform mutation operations, and finally, generate offspring populations.
Step 2: Determine the offspring population's individual fitness.
Step 3: Sort the population of offspring based on their individual fitness. Then delete bad individuals and select elite individuals. As a result, a new population is created to meet the population size.
Step 4: Determine whether the constraint condition for the algorithm's end state is satisfied. If not, go to step 2.
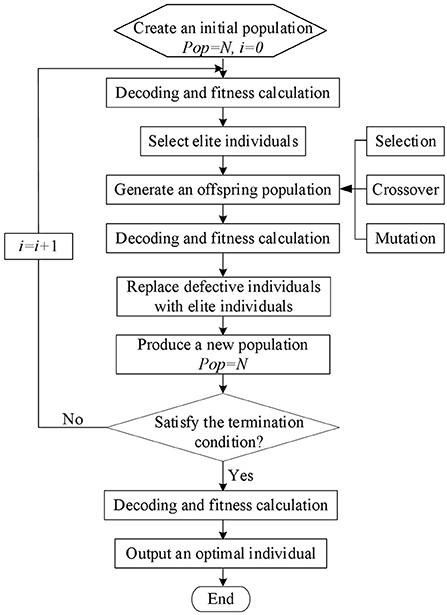
Figure 2. Workflow chart of genetic algorithm with the elite retention strategy.
In the process of solving the model by using the genetic algorithm, each individual corresponds to a solution. The chromosome code in this paper includes two parts. The first part is the code for the distance between service areas, and the second part is the code for the number of parking spaces in each service area. The length of the code equals the number of decision variables.
In addition, this paper uses the roulette wheel method to select individuals, and uses a random crossover method to randomly exchange the same position codes of two individuals. The position and number of crossover and mutation operations are set to random selection. This method is better than the single-point crossover or mutation method because it helps to make new people and improve the algorithm.
Numerical example
Data settings
In this section, we use truck traffic flow data for a section of the Guang-Kun expressway in China to verify the effectiveness of the model and algorithm.
As shown in Figure 3, the study section of the Guang-Kun expressway is from A to B, and the distance between A and B is about 215.5 kilometers. We collected the truck traffic flow data from April to November 2018. Analysis of the data indicates that the greatest traffic flow of trucks occurs in May. Therefore, we use the data for May to verify the effectiveness of the model and algorithm. The traffic flow data for trucks in May are shown in Table 2.
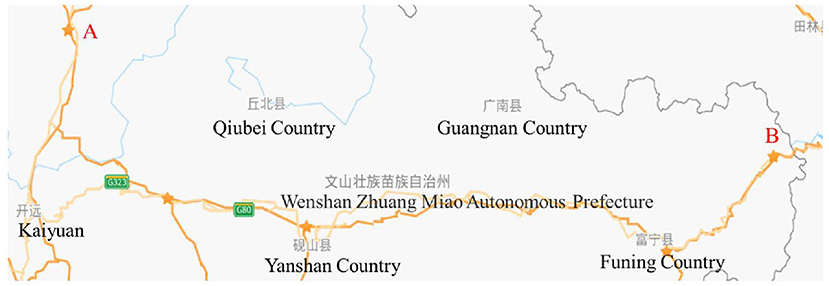
Figure 3. Study section of the Guang-Kun expressway in China.
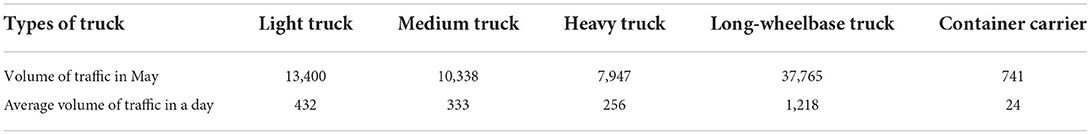
Table 2. Traffic flow data for trucks in May.
The peak hour volume of traffic can be calculated by multiplying the daily average volume of traffic by the peak hour coefficient. Peak hour coefficients vary by area in China, but are generally between 0.11 and 0.15. According to certain authors, the peak hour coefficient should be 0.12 (38). Therefore, we use the peak hour coefficient of 0.12 in this paper. Calculations can be used to determine the volume of truck traffic during peak hours, as shown in Table 3.

Table 3. Volume of truck traffic at peak hour on an average day in May.
Article 62 of the “Regulation on the Implementation of the People's Republic of China's Road Traffic Safety Law” asserts that drivers of motor vehicles shall refrain from the following behaviors: driving a motor vehicle continuously for more than 4 h without stopping or stopping for <20 min (38).
Therefore, the value of T in this study is 4, and the value of μ is 3. We assume that the value of the average truck speed is v = 75km/h. Relevant research indicates that the distance between service areas should be between 40 and 50 kilometers (39). Therefore, the values of dmin and dmax in this paper are set to be 40 and 50, respectively. In addition, we also fix the service loss rate at 0.1.
Calculating results for the distance between adjacent service areas problem
A genetic algorithm with an elite retention strategy is adopted to solve the problem. The crossover rate and mutation rate are set at 0.8 and 0.2, respectively. The population and generation sizes of the genetic algorithm are 1,000 and 200, respectively. The algorithm is coded in MATLAB, and the change in fitness value is shown in Figure 4.
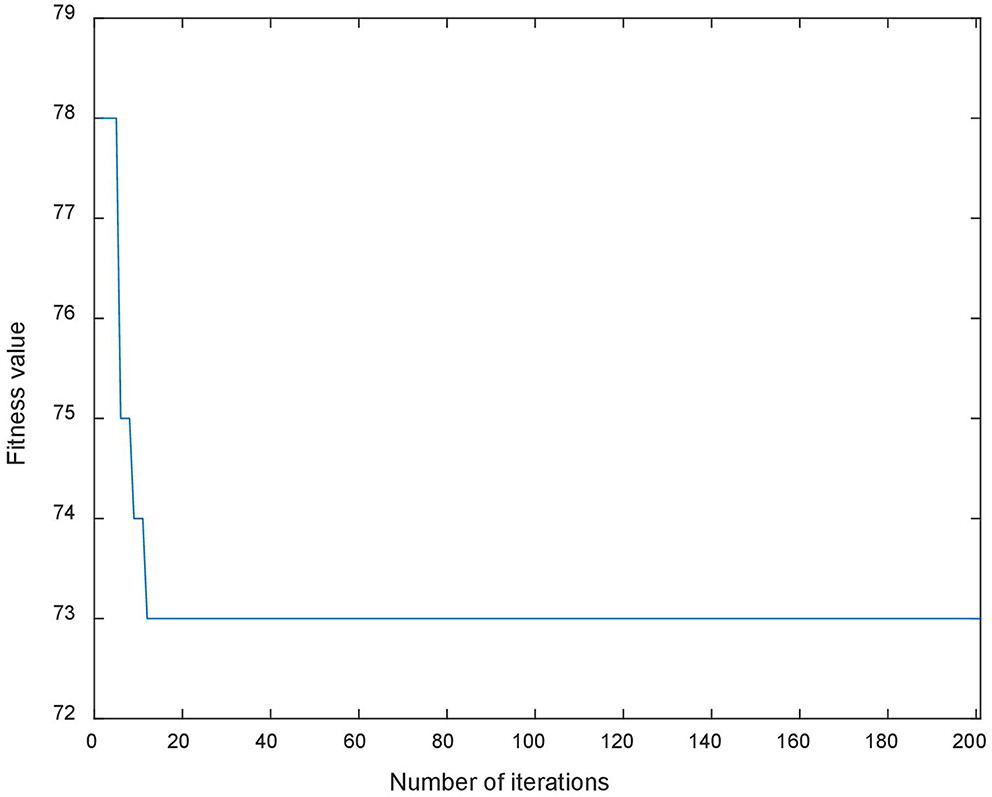
Figure 4. Iterative curve of fitness value.
Table 4 provides the optimal results for the distance between adjacent service areas, the distance from the first service area to the start point, and the distance from the last service area to the endpoint.
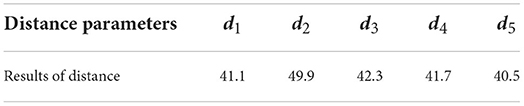
Table 4. Calculating results of the distances.
From the calculation results in Table 4, we find that the distance from the starting point to the first service area is 48.7 km, the distance from the first service area to the second service area is 41.2 km, the distance from the second service area to the third service area is 45.9 km, the distance from the third service area to the fourth service area is 41.4 km, and the distance from the fourth service area to the end of the road section is 38.3 km.
Calculating results for the number of parking spaces in service areas
Table 5 shows the calculation results for the number of parking spaces in each service area.
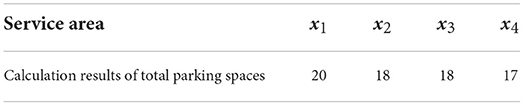
Table 5. Numbers of parking spaces in different service areas.
The calculation results in Table 5 show that the total numbers of optimal truck parking spaces in the first, second, third, and fourth service areas are 18, 19, 18, and 16, respectively.
From the calculation result shown in Table 5, according to Equations (17)–(21), the numbers of parking spaces for light trucks, medium trucks, heavy trucks, long-wheelbase trucks, and container carriers in each service area can be calculated. The calculation results are shown in Table 6.
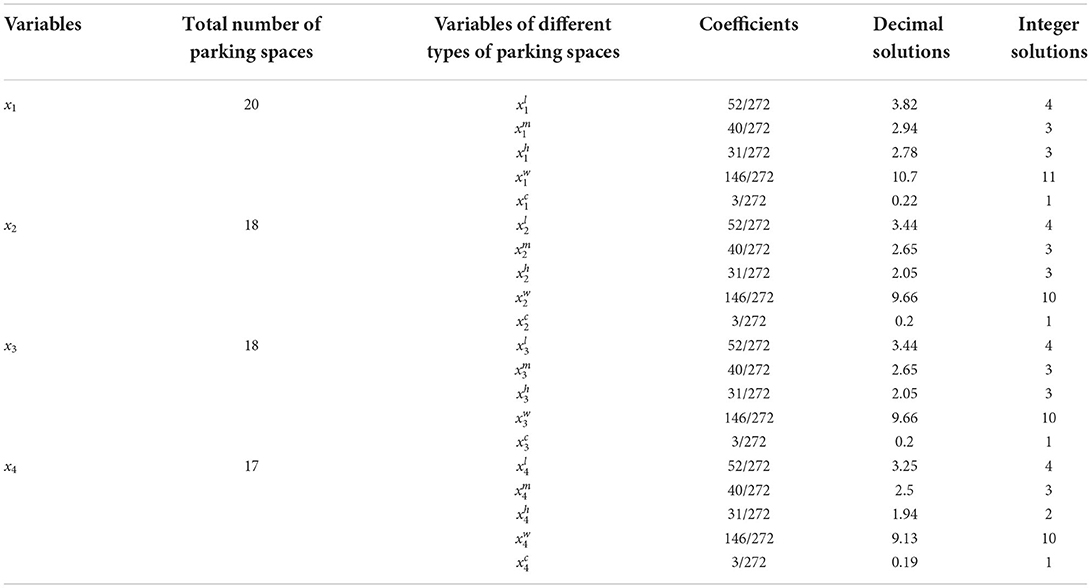
Table 6. Numbers of different parking spaces in the different service areas.
We take the first service area as an example to discuss the results in Table 6. In Table 6 the total number of all parking spaces in the first service area is 20. In addition, the total number of all trucks is 272, including 52 light trucks, 40 medium trucks, 31 heavy trucks, 146 long-wheelbase trucks, and 3 container carriers. Therefore, the coefficient of can be obtained as . Similarly, the values of the coefficients of , , , and can be obtained as , , , and , respectively. The number of parking spaces for light trucks is . According to Equation (17), the integer solution of the number of parking spaces for light trucks in the first service area is ⌈3.82⌉ = 4. Similarly, the numbers of parking spaces for medium trucks, heavy trucks, long-wheelbase trucks, and container carriers are 3, 3, 11, and 1, respectively.
Conclusion
This study established a non-linear optimization model for expressway truck service area planning to meet driver demand for the purpose of increasing driving safety. A genetic algorithm with an elite retention strategy was proposed to solve the model. The major contributions of this study are as follows:
(1) The provided model and the algorithm can provide approximate optimal strategy planning for expressway truck service areas required for driving safety. The model can estimate not only the optimal values of the distances between service areas, but also the optimal numbers of different truck parking spaces in the service areas.
(2) The modeling method proposed in this study is not limited to the studied case. It can be used for planning many expressway service areas by adjusting model parameters.
(3) The study results can assist in the planning of expressway truck service areas, to ensure the driving safety of truck drivers and save on the construction cost of service areas.
Based on the study results of this paper, future research is recommended as follows:
(1) This paper does not consider mixed-traffic flow conditions for expressway service area planning to increase driving safety. Note that the speed differences for different vehicles should be considered when studying expressway service area planning under mixed-traffic flow conditions.
(2) The setting of the number of truck parking spaces in the service area of the expressway is also affected by the truck volume. Further revision of the models proposed in this paper according to the truck volume changes is one of the key contents of future research.
(3) This paper studied the planning of service areas with particular regard to driving safety. However, the factors that affect the planning of expressway service areas are complex, and these include factors such as driving behaviors, and the services provided in expressway service area. Future models involving more factors that affect the planning of expressway service areas can be developed based on the generalized model proposed in this study.
Data availability statement
The original contributions presented in the study are included in the article/Supplementary material, further inquiries can be directed to the corresponding author/s.
Author contributions
WD: conceptualization, methodology, and writing—original draft. YW: writing—original draft. PC: software. FC: conceptualization, formal analysis, funding acquisition, and review. YS: data curation. NZ: writing—review and editing. DL: conceptualization and writing—review and editing. All authors contributed to the article and approved the submitted version.
Funding
This study was supported by the National Natural Science Foundation of China (51978522).
Conflict of interest
The authors declare that the research was conducted in the absence of any commercial or financial relationships that could be construed as a potential conflict of interest.
Publisher's note
All claims expressed in this article are solely those of the authors and do not necessarily represent those of their affiliated organizations, or those of the publisher, the editors and the reviewers. Any product that may be evaluated in this article, or claim that may be made by its manufacturer, is not guaranteed or endorsed by the publisher.
Supplementary material
The Supplementary Material for this article can be found online at: https://www.frontiersin.org/articles/10.3389/fpubh.2022.976495/full#supplementary-material
References
1. Jung S, Joo S, Oh C. Evaluating the effects of supplemental rest areas on freeway crashes caused by drowsy driving. Accid Anal Prev. (2017) 99:356–63. doi: 10.1016/j.aap.2016.12.021
2. Rezapour M, Wulff SS, Ksaibati K. Truck crashes and potential countermeasures on Wyoming highways and interstates: recommendations for all responsible agencies. J Transport Safety Security. (2019) 13:436–59. doi: 10.1080/19439962.2019.1638477
3. Cai M, Yazdi MAA, Mehdizadeh A, Hu Q, Vinel A, Davis K, et al. The association between crashes and safety-critical events: Synthesized evidence from crash reports and naturalistic driving data among commercial truck drivers. Transp Res C Emerg Technol. (2021) 126:103016. doi: 10.1016/j.trc.2021.103016
4. Dong C, Nambisan SS, Richards SH, Ma Z. Assessment of the effects of highway geometric design features on the frequency of truck involved crashes using bivariate regression. Transp Res A Pol Pract. (2015) 75:30–41. doi: 10.1016/j.tra.2015.03.007
5. Chen L, Huang S, Yang C, Chen Q. Analyzing factors that influence expressway traffic crashes based on association rules: using the Shaoyang–Xinhuang section of the Shanghai–Kunming expressway as an example. J Transp Eng A Syst. (2020) 146:05020007. doi: 10.1061/JTEPBS.0000425
6. Hosseinzadeh A, Moeinaddini A, Ghasemzadeh A. Investigating factors affecting severity of large truck-involved crashes: comparison of the SVM and random parameter logit model. J Safety Res. (2021) 77:151–60. doi: 10.1016/j.jsr.2021.02.012
7. Yu M, Ma C, Zheng C, Chen Z, Yang T. Injury severity of truck-involved crashes in work zones on rural and urban highways: Accounting for unobserved heterogeneity. J Transp Safety Security. (2022) 14:83–110. doi: 10.1080/19439962.2020.1726544
8. Roh C-G, Park B-J, Kim J. Impact of heavy vehicles on highway traffic flows: case study in the Seoul metropolitan area. J Transp Eng A Syst. (2017) 143:05017008. doi: 10.1061/JTEPBS.0000077
9. Delhomme P, Gheorghiu A. Perceived stress, mental health, organizational factors, and self-reported risky driving behaviors among truck drivers circulating in France. J Safety Res. (2021) 79:341–51. doi: 10.1016/j.jsr.2021.10.001
10. Pahukula J, Hernandez S, Unnikrishnan A. A time of day analysis of crashes involving large trucks in urban areas. Accid Anal Prev. (2015) 75:155–63. doi: 10.1016/j.aap.2014.11.021
11. Petkevičius K, Petkevičiene B. Principles of ensuring appropriate driving conditions on motor roads. The 9th International Conference Environmental Engineering 2014. Vilnius (2014).
12. Tàpia-Caballero P, Serrano-Fern Ndez M-J, Boada-Cuerva M, Sora B, Boada-Grau J. Influence that job characteristics, personality and burnout have on fatigue in professional drivers. Int J Occup Saf Ergon. (2021). doi: 10.1080/10803548.2021.1991672. [Epub ahead of print].
13. Merat N, Jamson AH. The effect of three low-cost engineering treatments on driver fatigue: a driving simulator study. Accid Anal Prev. (2013) 50:8–15. doi: 10.1016/j.aap.2012.09.017
14. Phillips RO, Sagberg F. Road accidents caused by sleepy drivers: update of a Norwegian survey. Accid Anal Prev. (2013) 50:138–46. doi: 10.1016/j.aap.2012.04.003
15. Rahman M, Kang MW. Safety evaluation of drowsy driving advisory system: Alabama case study. J Safety Res. (2020) 74:45–53. doi: 10.1016/j.jsr.2020.04.005
16. Philip P, Taillard J, Klein E, Sagaspe P, Charles A, Davies WL, et al. Effect of fatigue on performance measured by a driving simulator in automobile drivers. J Psychosom Res. (2003) 55:197–200. doi: 10.1016/S0022-3999(02)00496-8
17. Morrow PC, Crum MR. Antecedents of fatigue, close calls, and crashes among commercial motor-vehicle drivers. J Safety Res. (2004) 35:59–69. doi: 10.1016/j.jsr.2003.07.004
18. Fu R, Wang H, Zhao W. Dynamic driver fatigue detection using hidden Markov model in real driving condition. Expert Syst Appl. (2016) 63:397–411. doi: 10.1016/j.eswa.2016.06.042
19. Chen J, Wang S, He E, Wang H, Wang L. Two-dimensional phase lag index image representation of electroencephalography for automated recognition of driver fatigue using convolutional neural network. Expert Syst Appl. (2022) 191:116339. doi: 10.1016/j.eswa.2021.116339
20. Chen C, Xie Y. The impacts of multiple rest-break periods on commercial truck driver's crash risk. J Safety Res. (2014) 48:87–93. doi: 10.1016/j.jsr.2013.12.003
21. Wang L, Pei Y. The impact of continuous driving time and rest time on commercial drivers' driving performance and recovery. J Safety Res. (2014) 50:11–5. doi: 10.1016/j.jsr.2014.01.003
22. Rog JP, Bayle T, Hannachi SE, Muzet A. Effect of sleep deprivation and driving duration on the useful visual field in younger and older subjects during simulator driving. Vision Res. (2003) 43:1465–72. doi: 10.1016/S0042-6989(03)00143-3
23. Gander PH, Marshall NS, James I, Quesne LL. Investigating driver fatigue in truck crashes: Trial of a systematic methodology. Transp Res F Traffic Psychol Behav. (2006) 9:65–76. doi: 10.1016/j.trf.2005.09.001
24. Anund A, Kecklund G, Vadeby A, Hjalmdahl M, Akerstedt T. The alerting effect of hitting a rumble strip–a simulator study with sleepy drivers. Accid Anal Prev. (2008) 40:1970–6. doi: 10.1016/j.aap.2008.08.017
25. Mcarthur A, Kay J, Savolainen PT, Gates TJ. Effects of public rest areas on fatigue-related crashes. Transp Res Rec. (2013) 2386:16–25. doi: 10.3141/2386-03
26. Campbell S. The economic evaluation of heavy vehicle rest areas-a new technique? Road Transp Res. (2014) 23:69–77.
27. Jian-Wei W, Yi T. Transportation potential calculation model of pause rate in expressway service area. Chin J Highway Transp. (2008) 21:109. doi: 10.19721/j.cnki.1001-7372.2008.05.020
28. Jiang Y, Hou W. Research on expressway service area planning. The 2nd Conference on Environmental Science and Information Application Technology 2010. Wuhan: IEEE (2010). p. 1–3.
29. Koo C, Hong T, Kim J. A decision support system for determining the optimal size of a new expressway service area: Focused on the profitability. Decis Support Syst. (2014) 67:9–20. doi: 10.1016/j.dss.2014.07.005
30. Wu Y, Wu C, Zhou J, Zhang B, Xu C, Yan Y, et al. A DEMATEL-TODIM based decision framework for PV power generation project in expressway service area under an intuitionistic fuzzy environment. J Clean Prod. (2020) 247:119099. doi: 10.1016/j.jclepro.2019.119099
31. Wang JQ, Zhang K, Zhi P, Xi G, Tang X, Zhou Q. Analysis and prediction transient population in expressway service area based long short-term memory 2021. In: IEEE 23rd Int Conf on High Performance Computing and Communications; 7th Int Conf on Data Science and Systems; 19th Int Conf on Smart City; 7th Int Conf on Dependability in Sensor, Cloud and Big Data Systems and Application (HPCC/DSS/SmartCity/DependSys) 2021. IEEE (2021). p. 1828–1832.
32. Shen X, Zhang F, Lv H, Liu J, Liu H. Prediction of entering percentage into expressway service areas based on wavelet neural networks and genetic algorithms. IEEE Access. (2019) 7:54562–74. doi: 10.1109/ACCESS.2019.2913177
33. Zhao J, Yu Z, Yang X, Gao Z, Liu W. Short term traffic flow prediction of expressway service area based on STL-OMS. Physica A Stat. Mech. Appl. (2022) 595:126937. doi: 10.1016/j.physa.2022.126937
34. Zhi P, Meng W, Wang J-Q, Wu X, Zhou R, Zhou Q. Key technology and analysis of expressway intelligent service area. In: IEEE 25th International Conference on Computer Supported Cooperative Work in Design (CSCWD) 2022. IEEE. (2022). p. 400–5.
35. Yu C, Wang JA. Study on forecast method of pause rate in expressway service area. In: Twelfth Cota International Conference of Transportation Professionals. Beijing (2012).
36. Shen X, Wang L, Liu H, Yang J. Estimation of the Percentage of Mainline Traffic Entering Rest Area Based on Bp Neural Network. J Appl Sci. (2013) 13:2632–8. doi: 10.3923/jas.2013.2632.2638
37. Sha A. Discussion on countermeasures and intelligent operation mode of divisionconstruction for the expressway passenger and freight transport system. China J Highw Transp. (2020) 33:1–7. doi: 10.19721/j.cnki.1001-7372.2020.05.001
Keywords: expressway driving safety, truck service areas, non-linear optimization model, improved genetic algorithm, service loss rate
Citation: Ding W, Wang Y, Chu P, Chen F, Song Y, Zhang N and Lin D (2022) Safety-oriented planning of expressway truck service areas based on driver demand. Front. Public Health 10:976495. doi: 10.3389/fpubh.2022.976495
Received: 23 June 2022; Accepted: 14 July 2022;
Published: 02 August 2022.
Edited by:
Linchuan Yang, Southwest Jiaotong University, ChinaReviewed by:
Xiaofei Wang, South China University of Technology, ChinaLai Zheng, Harbin Institute of Technology, China
Copyright © 2022 Ding, Wang, Chu, Chen, Song, Zhang and Lin. This is an open-access article distributed under the terms of the Creative Commons Attribution License (CC BY). The use, distribution or reproduction in other forums is permitted, provided the original author(s) and the copyright owner(s) are credited and that the original publication in this journal is cited, in accordance with accepted academic practice. No use, distribution or reproduction is permitted which does not comply with these terms.
*Correspondence: Feng Chen, ZmVuZ2NoZW5AdG9uZ2ppLmVkdS5jbg==; Dong Lin, ZG9uZy5saW5AYWJkbi5hYy51aw==