 Te Ou Young
 Li-Wei Wu
 Hsin Hsiu
 Tao-Chun Peng
 Wei-Liang Chen
94% of researchers rate our articles as excellent or good
Learn more about the work of our research integrity team to safeguard the quality of each article we publish.
Find out more
ORIGINAL RESEARCH article
Front. Public Health , 06 September 2022
Sec. Aging and Public Health
Volume 10 - 2022 | https://doi.org/10.3389/fpubh.2022.969424
Aims: Sarcopenia is significantly associated with the number of cardiovascular and metabolic diseases, however, the underlying pathophysiological processes are largely unknown. This study performed harmonic index of finger photoplethysmography (PPG) waveforms with the aims of distinguishing different arterial pulse waveform signals between sarcopenia, presarcopenia, dynapenia, and healthy subjects.
Methods: Sixty-eight subjects were enrolled and obtained 1-min PPG signals, then were assigned to four age-matched groups: control, dynapenia, presarcopenia, and sarcopenia which definition according to Asian Working Group for Sarcopenia (AWGS): 2019 Consensus Update on Sarcopenia Diagnosis and Treatment. Harmonics 1–10 of the PPG waveform were obtained and calculated each of the amplitude proportions (Cn), standard deviations (SDn), coefficients of variations (CVn), and vascular elasticity index (VEI) for to evaluating the blood-pressure harmonic variability.
Results: The prevalence of sarcopenia in women gender (8 out of 9, 88.9%, p = 0.046) and osteoporosis in dynapenia (7 out of 16, 43.8%, p = 0.005) were significant higher. Among the four groups, compared with control, dynapenia, and presarcopenia, sarcopenia had largest SDn-values for harmonics 1, 2, 3, and 5 (ratio 1, 2, 3, 5 = 0.354, 0.209, 0.137, 0.074); whereas sarcopenia had largest coefficients of variations (CVn) values for harmonics 1, 2, 3 and 10 (ratio 1, 2, 3, 10 = 0.263, 0.310, 0.402, 0.791). Besides, the Δ odds ratio of ratio 3, 4,and 6 tertile values were significantly increased in sarcopenia and possible sarcopenia group compared with control group. Subjects with sarcopenia had significantly higher VEI in mean, SD, and CV of the PPG waveform (mean = 2.332, SD = 1.479, CV = 0.634, p = 0.007) among the groups and the results of binary logistic regression analysis in the tertiles met statistical significance between the sarcopenia and non-sarcopenia groups whether adjusted or unadjusted (adjusted odds ratio 6.956, p = 0.030, unadjusted odds ratio 3.937, p = 0.039).
Conclusions: The elasticity of vessels among sarcopenia groups in lower-frequency components of harmonic ratio in which we defined as VEI showed a significantly highest VEI mean, SD, and CV in sarcopenia indicates the poorer elasticity of the arteries. The present findings showed finger PPG waveform measurements may be useful for early detection of vascular diseases with patients with sarcopenia in a non-invasive and easy-to-perform technique which may expand the clinical applicability in the future.
In the era of population aging, the number of elderly people is increasing rapidly, which brings a heavy burden to medical care systems and the social economy (1). The aging process leads to the loss of skeletal muscle mass, strength, and physical performance (2, 3). Patients screened for sarcopenia can be classified as healthy or having presarcopenia, dynapenia, or sarcopenia, based on muscle mass, grip strength, and walking speed (4). Sarcopenia is usually accompanied by an increased risk of falls, fractures, hospitalization, weakness, decreased quality of life, and even death (5, 6). It has been suggested that one of the major risk factors for cardiovascular disease is aging (7, 8). Many studies have also shown that lower body muscle mass increases the risk of cardiovascular disease mortality (9–11).
Photoplethysmography (PPG) is an optical technique for detecting microvascular blood volume changes in peripheral tissues, arterial pressure, and compliance. The changes in blood vessel volume caused by blood pressure and pulse changes can be translated to PPG signals. Therefore, the PPG signal has been considered to produce many indicators that can be used for clinical non-invasive detection of the cardiovascular condition. Awad et al. found that the pulse width change of the PPG waveform is related to the change of the peripheral vascular resistance (12), and the dual PPG signal calculating the pulse transit time could be used to detect blood pressure or the pulse wave velocity (13, 14). Frequency-domain analysis in lower-frequency bands of the PPG signal was found to be an effective application for studying autonomic nervous control of the peripheral circulation (15) and characteristics of the hypovolemic response (16).
Due to the quasiperiodicity of the heartbeat, harmonic analysis has become an ideal method for cardiovascular signal analysis, including blood pressure and PPG waveforms, in many frequency domain analysis methods (17, 18). In previous studies, the use of PPG measurements and harmonic component analysis showed that adequate contact pressure can be used to reconstruct and improve the BP waveform signal with the PPG waveform (19), and changing the wave transmission and arterial stiffness by mild cold stimulation on the skin surface could significantly change several harmonic component indices of PPG waveforms (20).
This study performed harmonic index analysis of finger PPG waveforms with the aim of distinguishing different arterial pulse waveform signals between healthy subjects and individuals with sarcopenia, presarcopenia, and dynapenia. Measurements and analysis of the dynapenia and presarcopenia groups were also evaluated for potential vascular hydrodynamic differences that could be detected by PPG in early stage of cardiovascular disease. The information obtained from finger PPG waveform measurements might be useful for the early detection of vascular diseases in patients with sarcopenia, and PPG is a non-invasive and easy-to-perform technique which may expand its clinical applicability in the future.
The study was approved by the institutional review board of Tri-Service General Hospital (TSGHIRB 2-108-05-161), which enrolled 68 volunteers; details of the subjects are listed in Table 2. Between August 2020 and November 2020, adults aged at least 60 years (71.47 ± 5.222) who came to the Health Management Center of Tri-Service General Hospital for a geriatric health check-up were eligible. The exclusion criteria were as follows: (1) severe illnesses such as heart failure, liver cirrhosis, end-stage renal disease, cerebral vascular diseases, or cancer, (2) severe mental illnesses, such as severe dementia or psychiatric disease, (3) severe endocrine diseases, such as hyper or hypothyroidism, (4) skin lesions that interfere with PPG signal recording, and (5) medications that may interfere with endothelial functioning. All the participants were enrolled voluntarily and were informed and signed the consent form. According to the criteria listed in Table 1, the subjects were assigned to four age-matched groups: control, dynapenia, presarcopenia, and sarcopenia; the labels were defined according to the Asian Working Group for Sarcopenia (AWGS): 2019 Consensus Update on Sarcopenia Diagnosis and Treatment.
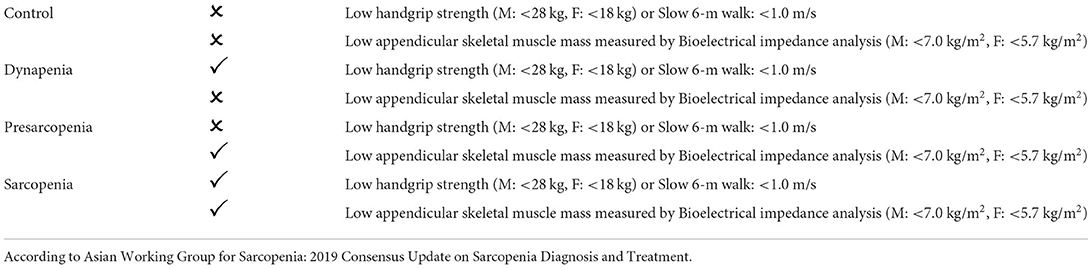
Table 1. Criteria of control, dynapenia, presarcopenia, and sarcopenia.
The participants were all native Taiwanese citizens, wore light clothing, were in the supine position and were allowed to stabilize for at least 10 min before starting the recording. Informed consent was obtained from each participant after receiving an explanation of the study. The subjects' psychological states and moods were assessed in stable condition to prevent interference. The room temperature was between 24 and 26°C during the measurement period. All subjects were required to stop medication (except essential medication such as antihypertensive agents, etc.) for 3 days before the experiment and fasted for at least 1 h before each experiment. All subjects did not drink coffee or alcoholic beverages for at least 1 day before the experiment (19, 20).
The details of the measurements were described in our previous study (19, 20). The ECG signals were measured non-invasively through surface electrodes with a preamplifier (Lead II, RA-LL; 6600 series, Gould, USA). The 940 nm wavelength infrared LED (QED233, Fairchild Optoelectronic) emitted from the PPG device penetrated the middle finger tissue and was collected by a photodiode (L-SB1R9PD1D1, Para, Japan). The applied contact pressure was precalibrated to approximately 60 mmHg to eliminate wearing discomfort and stabilize the PPG measurement. Signals were collected via a current-to-voltage converter circuit and then converted from analog to digital signals at a sampling frequency of 1,024 Hz by a converter card (PCI-9111DG, Adlink Technology, Taiwan). For each measurement, 1-min data series were recorded after measuring the subjects' basic physiological parameters, including systolic blood pressure (SBP), diastolic blood pressure (DBP), and HR, using a sphygmomanometer (MediGuard 150i, Rossmax).
The skin surface temperature was monitored by a thermistor attached around the wrist. By turning the resistance of the thermistor into voltages, signals were sent to an analog-to-digital converter card. The temperature was monitored properly during the measurement, and the variations in temperature were within 1.0°C. The average monitored environmental temperatures were 28.7 ± 1.8°C, 29.1 ± 1.9°C, 29.0 ± 1.9°C, and 28.7 ± 1.9°C for the control, dynapenia, presarcopenia, and sarcopenia groups, respectively.
The baseline drift was eliminated by passing PPG signals through a digital 11th-order high-pass Chebyshev filter with a lower cutoff frequency of 0.01 Hz. To distinguish their beat-to-beat waveforms, two adjacent minimums of the signal were identified as the cut-off point for each pulse.
Each pulse (between two adjacent minimums) was represented by the following finite series (21, 22). The pulse was excluded if the value between the two adjacent minimums exceeded 20% of the average pulse amplitude.
The Fourier coefficients (An and Bn) of the pulse can be calculated as
where ω is the angular frequency and ts is the sampling time interval.
The amplitude (Ampn) of each harmonic can then be calculated as . Ampn is the amplitude of the nth harmonic of the PPG pulse harmonic spectrum.
Since the first 10 harmonics distributed most of the spectral energy of the pulse signal (23), the average value of PPG pulses was measured by pulse harmonic spectrum as the amplitude proportion (Cn) of the nth harmonic component according to Ampn/Amp0 ×100% for n = 1–10. The standard deviation (SDn) and the coefficient of variation (CVn) of the nth harmonic component of amplitude proportion were also collected to evaluate the variability in the PPG beat-to-beat waveform.
In the pulse PPG waveform, lower-frequency components occupied larger proportions in the spectral power; therefore, the lower-frequency component can be more affected by and can hence help to reflect the changes in the transmission condition for the arterial pulse. In our previous unpublished study, we also found that lower-frequency components of the harmonic ratio can be more likely to be associated with the stiffness and elasticity of the vascular wall. Thus, we defined the vascular elasticity index (VEI) for each pulse as the ratio of patients to healthy individuals with harmonic ratio1 * harmonic ratio 2 of the PPG pulses during each 1-min measurement period.
This study used MATLAB (MathWorks, Natick, MA, USA) for all signal processing and SPSS version 13.0 (SPSS Inc., Chicago, Illinois, USA) for all statistical analyses. The differences between basic physiological parameters and PPG parameters were calculated by one-way analysis of variance and Tukey's HSD method for post-hoc analysis. The independent influence of basic physiological parameters on PPG indicators was calculated by logistic regression analysis. The significance level was defined as p < 0.05.
A total of 170 elderly subjects (67 males and 103 females, age ≥60 years) met the inclusion criteria. A total of 102 of these individuals did not undergo PPG and were thus excluded. Sixty-eight of these individuals (29 males and 39 females, age 62–92 years) were enrolled in our study and finished the program. Nine of these individuals were diagnosed with sarcopenia according to the criteria of AWGS. The general characteristics and the other clinical or biochemical indicators of the participants are listed in Table 2. Subjects with sarcopenia had a lower BMI, lower abdominal circumference, and lower systolic pressure than those without sarcopenia, but the difference was not statistically significant. The prevalence of sarcopenia in women gender (8 out of 9, 88.9%, p = 0.046) and osteoporosis in dynapenia (7 out of 16, 43.8%, p = 0.005) were significant higher. Amplitude proportions and the variability indices of certain harmonic components within the PPG waveform are listed in Table 3, and they differed significantly or prominently between the sarcopenia and control groups. Among the four groups, the amplitude proportions were the largest in the sarcopenia group for harmonics 1, 2, 5, and 8. The differences between sarcopenia and non-sarcopenia groups were significant for harmonics 2, 5, 8, and 9. However, among the four groups, most of the SDn-values were larger in the sarcopenia group than in the other three groups. For instance, compared with control, dynapenia, and presarcopenia, sarcopenia had largest SDn-values for harmonics 1, 2, 3, and 5 (ratio 1, 2, 3, 5 = 0.354, 0.209, 0.137, 0.074); whereas sarcopenia had largest CVn-values for harmonics 1, 2, 3, and 10 (ratio 1, 2, 3, 10 = 0.263, 0.310, 0.402, 0.791).
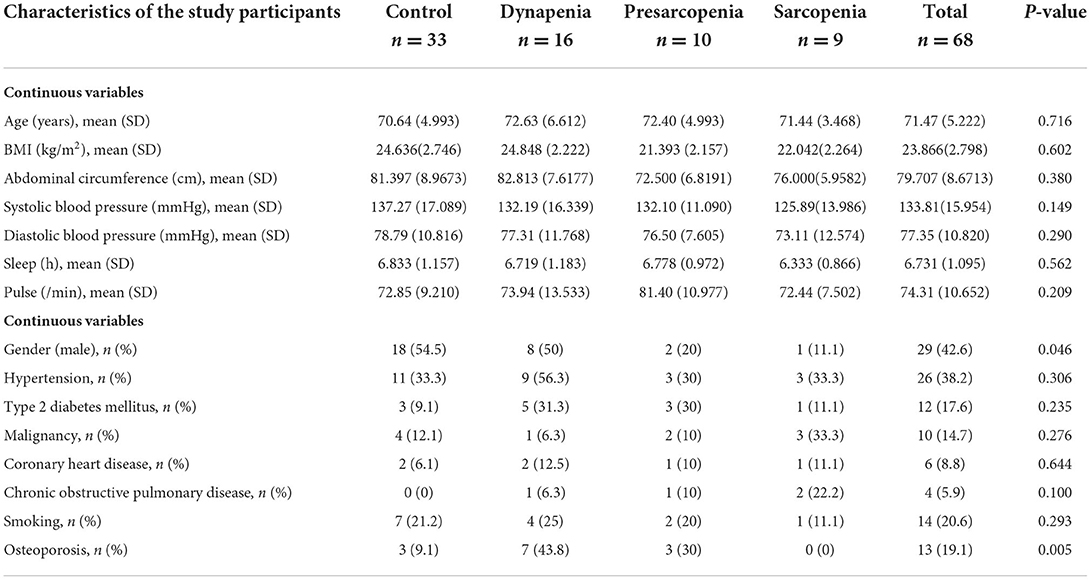
Table 2. Characteristics of the study participants by control, dynapenia, presarcopenia, and sarcopenia.
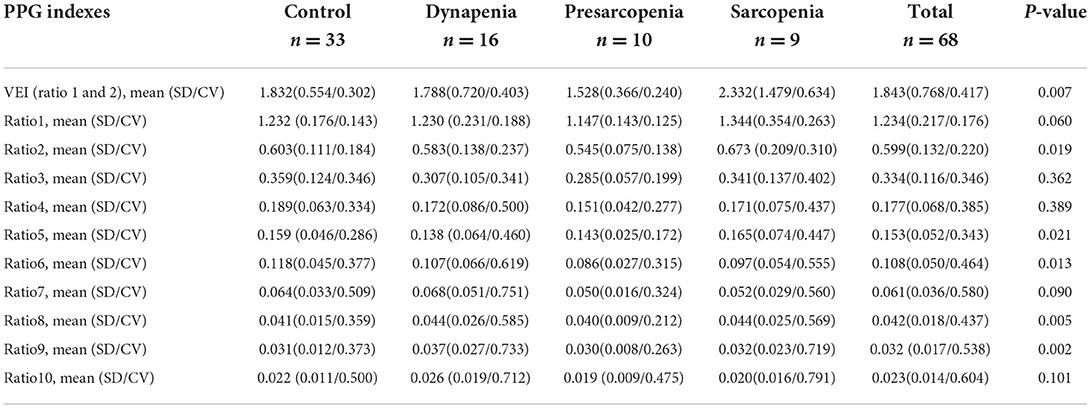
Table 3. Characteristics of the study participants by control, dynapenia, presarcopenia, and sarcopenia.
The results of the binary logistic regression analysis between groups by PPG indices are listed in Tables 4, 5. Following adjustment for potential confounders (age, sex, BMI), the Δ odds ratios of the ratio3, ratio4, and ratio6 tertile values were significantly increased in the sarcopenia and possible sarcopenia groups compared with the control group (P < 0.05) [ratio3 tertile: Δ odds = 0.499/0.469, P = 0.028/0.030; ratio4 tertile: Δ odds = 0.499/0.509, p = 0.028/0.049; ratio6 tertile: Δ odds = 0.499/0.514, P = 0.028/0.050; (unadjusted/adjusted)].
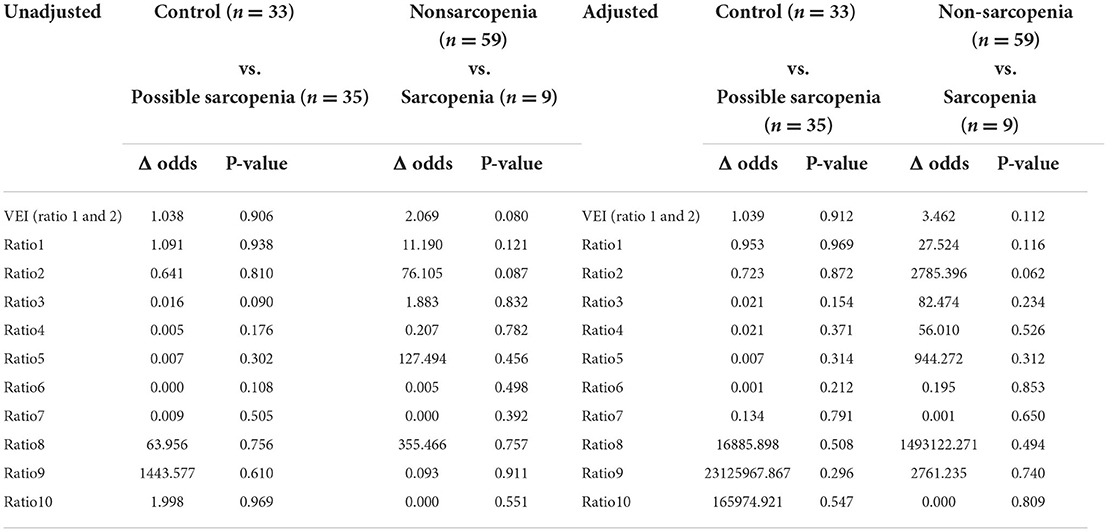
Table 4. Association between sarcopenia group by PPG indexes from logistic regression models.
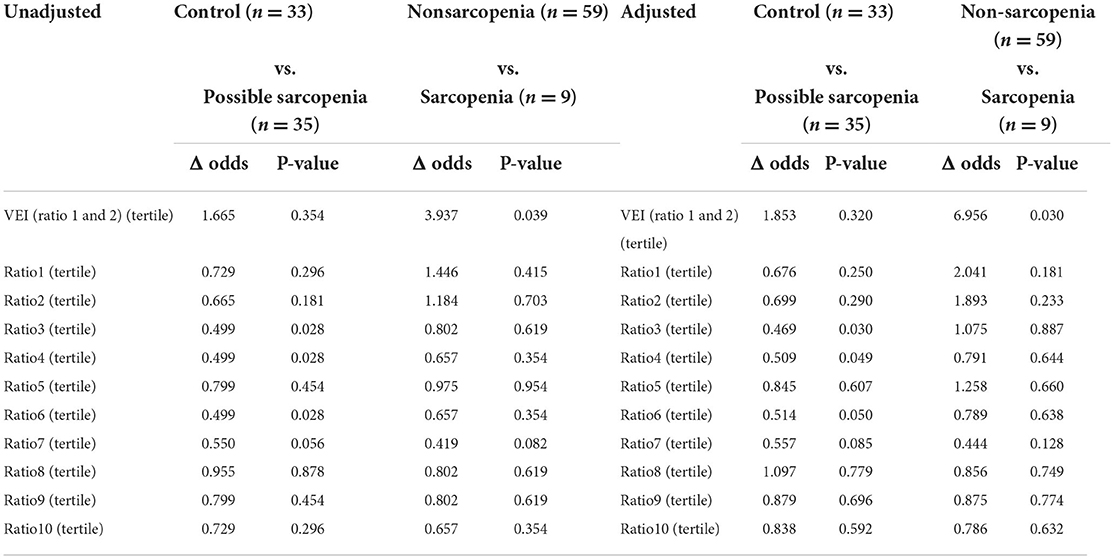
Table 5. Association between sarcopenia group by PPG indexes from logistic regression models in tertile.
The VEI of the PPG waveform in Table 3 shows that subjects with sarcopenia had significant higher VEI of the PPG waveform (mean = 2.332, SD = 1.479, CV = 0.634, p = 0.007) than the other three groups, and the results of the binary logistic regression analysis in Table 4 showed that VEI in the sarcopenia group appeared to be higher than in the non-sarcopenia groups (adjusted odds ratio, 2.069; p = 0.080, at the statistical borderline), whereas the results of the binary logistic regression analysis in tertile in Table 5 met statistical significance between the sarcopenia and non-sarcopenia groups whether adjusted or unadjusted (adjusted odds ratio 6.956, p = 0.030; unadjusted odds ratio 3.937, p = 0.039).
Sarcopenia, which is defined as the loss of skeletal muscle mass, strength and a decline of physical performance, is associated with an increased risk of cardiovascular disease (9–11). Because of the many identical risk factors between sarcopenia and cardiovascular disease, it could be deduced that there is an association between vascular dysfunction and muscle health. Current research only regards arterial stiffness as a manifestation of vascular dysfunction and its correlation with muscle tissue health (24).
In this study, it was found that certain harmonic components in amplitude proportions, harmonic variability, and VEI in the PPG waveform were significantly different between individuals with sarcopenia and healthy control subjects. The analysis of the four groups showed that there were no significant differences in the current PPG index between age groups. It could be assumed that the changes in these indices were partly attributed to hemodynamic changes caused by sarcopenia.
Vascular elasticity index was defined according to the ratio of patients and healthy individuals based on harmonic ratio1 * harmonic ratio2 of the PPG pulses during each 1-min measurement period. In the pulse PPG waveform, lower-frequency components occupied larger proportions in the spectral power; therefore, the lower-frequency components can be more affected by and can hence help to reflect the changes in the transmission condition for the arterial pulse. Table 3 shows that subjects with sarcopenia had significantly higher VEI of the PPG waveform (mean = 2.332, SD = 1.479, CV = 0.634, p = 0.007) among the groups, and the results of the binary logistic regression analysis in Table 4 showed that VEI in the sarcopenia group was higher than those of the non-sarcopenia groups, but the difference did not meet statistical significance (adjusted odds ratio 2.069, p = 0.080). Meanwhile, the results of the binary logistic regression analysis in the tertiles in Table 5 met statistical significance between the sarcopenia and non-sarcopenia groups whether adjusted or unadjusted (adjusted odds ratio 6.956, p = 0.030; unadjusted odds ratio 3.937, p = 0.039). Sarcopenia is associated with alterations in the arterial system, such as changes in the vascular stiffness and resistance. It is possible that when faced with changes in vascular properties induced by sarcopenia, the cardiovascular system may need to perform more strongly in order to maintain the homeostasis of blood supply, and the sarcopenia subjects may thus have larger values of the harmonic variations. Therefore, VEI showed a significantly higher mean, SD and CV in the sarcopenia group, indicating poorer elasticity of the arteries, which could be partly inferred to be a sarcopenia-induced increase in arterial stiffness.
Table 3 shows that there were some significantly different amplitude proportions in certain harmonic components between the sarcopenia group and other groups. Among the four groups, the largest harmonic components in sarcopenia group were harmonics 1, 2, 5, and 8 and the differences between sarcopenia and non-sarcopenia groups were significant in harmonics 2, 5, 8, and 9.
The arterial blood pressure pulse is produced by the driving force of the heartbeat and is transmitted to the peripheral vascular bed through the arteries. The texture along the blood vessel wall may affect pulse formation during transmission, thereby affecting the pulse shape (25–27). A recent study focused on developing indices via pulse analysis to distinguish subjects with different diseases which may induce changes along blood vessels. For example, diseases including hypertension, diabetes, stroke, and inflammatory rheumatic diseases have been studied to detect the effects of diseases on arterial elasticity or peripheral vascular resistance by BP pulse velocity and various waveform index analyses (28–30).
Due to the quasiperiodicity of the heartbeat, harmonic analysis has become an ideal method in the study of cardiovascular signals, including blood pressure and PPG waveforms, in many frequency domain analysis methods (17, 18). For instance, previous research has suggested that harmonic amplitude analysis has potential application value in detecting changes in blood vessel elasticity (20, 31). Studies have shown that each vascular bed corresponds to an independent, specific frequency, and linear cumulative effect of the peripheral pressure wave. The harmonic components of arterial BPW are associated with changes in the elasticity of the local vascular bed (31). Since different diseases could cause damage to different local vascular beds (such as changes in diameter or elasticity) that reflect changes in the hydrodynamics of vascular flow detected by harmonic components of arterial BPW, the amplitude distribution of harmonic components may vary from disease to disease. Our previous study reported that changes in the harmonic distribution could be applied to detect arterial elasticity in stroke patients (21).
The variability of some harmonic components in the PPG waveform was significantly different between the sarcopenia group and the control groups, as shown in Table 3. Among the four groups, most of the SDn-values were larger in the sarcopenia group than in the other three groups. For example, compared with control, dynapenia, and presarcopenia, sarcopenia had significantly larger SDn-values for harmonics 1, 2, 3, and 5 and relatively larger SDn-values for harmonics 4, 6, 8, 9, and 10, whereas sarcopenia had significantly larger CVn-values for harmonics 1, 2, 3, and 10 and relatively larger CVn-values for harmonics 4, 5, 6, 7, 8, and 9.
Several underlying mechanisms of BP variability with aging have been proposed, such as hemodynamic instability, advanced artery remodeling and atherosclerosis, arterial stiffness, baroreflex impairment, endothelial dysfunction, and subclinical inflammation (32). A general loss of cardiovascular compliance contributes to reduced homeostatic adaptation to stress, as evidenced by altered physiologic dynamics of multiple physiological processes, notably the stability of the cardiovascular and nervous systems or the pulsatile release of hormones (33). Blood pressure variability might help predicting the onset of several age-related conditions and diseases, independently of chronological age. A recent study by Uçar et al. investigated a low-cost and trustworthy Body Muscle Percentage calculation model based on artificial intelligence algorithms and biomedical signals demonstrating that PPG-based models can be used to predict body muscle percentage and consequently sarcopenia (34). Furthermore, studies of the variability of harmonics in the BPW spectrum (BPHV) have analyzed the effects of diseases (such as stroke, polycystic ovary syndrome, and metabolic syndrome) on the cardiovascular system in patients compared with healthy subjects (21, 35, 36).
Table 3 reveals that several harmonic components varied significantly between the sarcopenia group and other groups. As we assumed in the previous study, lower-frequency components of the harmonic ratio can be more likely to be associated with stiffness and elasticity of the vascular wall, and VEI was significantly larger in the sarcopenia group compared with the other groups. A recent study by Hashimoto et al., investigated 146 patients aged ≥65 years with diabetes from the KAMOGAWA-DM cohort study, without physical inactivity demonstrating that CV of systolic BP, rather than average systolic BP, is associated with sarcopenia in older patients with diabetes, which indicated that sarcopenia may induce arterial stiffness and thus increased arterial resistance (37). Due to the changes in blood vessels caused by sarcopenia, compensation of cardiovascular system may be activated to maintain proper blood supply, and thus reflecting larger values in lower-frequency components of harmonic ratio. Therefore, the current research results support the suggestion that the harmonic component index variability of the PPG waveform could be a useful tool to detect systematic changes in vascular characteristics caused by sarcopenia.
The results of the current study revealed significant differences between the groups, and in these PPG indices, there was little increase or decrease between the control group and the sarcopenia group. Compared with the sarcopenia stage, the arterial pulse transmission conditions changed less in the presarcopenia stage (this may be related to the less noticeable change in Cn). In presarcopenia, due to the relatively healthy condition, the cardiovascular system may have more space for compensatory regulation, reducing the changes in vascular properties. The cardiovascular system adapts more easily, so in presarcopenia, the CVn of many harmonic components is smaller than that in sarcopenia.
There are some limitations in this study. (1) The number of included subjects was relatively small. (2) There was some selection bias, as we included individuals who had voluntary geriatric health exams, not individuals from the general population. (3) There were different distributions of other confounding factors in each group that may have influenced our results, such as differences in sex, age, BMI, and the use of chronic disease medications. (4) A retrospective, cross-sectional study design limits the strength of evidence.
Tables 4, 5 show that most of the correlations between PPG indicators and basic physiological parameters were not significant, indicating that various basic physiological parameters (except sex and osteoporosis status) had little interference with PPG indicators. Further investigations are needed to verify how PPG harmonic parameters are affected by sarcopenia to understand the underlying mechanisms.
The lower-frequency components of the harmonic ratio in which we defined VEI showed the significantly highest mean, SD, and CV in patients with sarcopenia, indicating poorer elasticity of the arteries that could be partly inferred to be a sarcopenia-induced increase in arterial stiffness. The present findings showed that finger PPG waveform measurements may be useful for the early detection of vascular diseases in patients with sarcopenia, and this non-invasive and easy-to-perform technique may expand in clinical applicability in the future.
The original contributions presented in the study are included in the article/supplementary material, further inquiries can be directed to the corresponding author/s.
The studies involving human participants were reviewed and approved by TSGHIRB 2-108-05-161. The patients/participants provided their written informed consent to participate in this study.
TOY performed the analysis and wrote the paper. L-WW and HH conceived and designed the analysis. T-CP and W-LC contributed data or analysis tools. All authors contributed to the article and approved the submitted version.
This work was supported by a grant to L-WW (TSGH-A-111013, TSGH-A-110005, and MND-MAB-110-129).
The authors declare that the research was conducted in the absence of any commercial or financial relationships that could be construed as a potential conflict of interest.
All claims expressed in this article are solely those of the authors and do not necessarily represent those of their affiliated organizations, or those of the publisher, the editors and the reviewers. Any product that may be evaluated in this article, or claim that may be made by its manufacturer, is not guaranteed or endorsed by the publisher.
1. Kabayama M, Mikami H, Kamide K. Factors associated with risk for assisted living among community-dwelling older Japanese. Arch Gerontol Geriatr. (2016) 65:63–9. doi: 10.1016/j.archger.2016.03.005
2. Cruz-Jentoft AJ, Bahat G, Bauer J, Boirie Y, Bruyère O, Cederholm T, et al. Sarcopenia: revised European consensus on definition and diagnosis. Age Ageing. (2019) 48:16–31. doi: 10.1093/ageing/afy169
3. Deschenes MR. Effects of aging on muscle fibre type and size. Sports Med. (2004) 34:809–24. doi: 10.2165/00007256-200434120-00002
4. Chen LK, Woo J, Assantachai P, Auyeung TW, Chou MY, Iijima K, et al. Asian Working Group for Sarcopenia: 2019 consensus update on sarcopenia diagnosis and treatment. J Am Med Dir Assoc. (2020) 21:300.e2–7.e2. doi: 10.1016/j.jamda.2019.12.012
5. Beaudart C, Rizzoli R, Bruyère O, Reginster JY, Biver E. Sarcopenia: burden and challenges for public health. Arch Public Health. (2014) 72:45. doi: 10.1186/2049-3258-72-45
6. Scott D, Daly RM, Sanders KM, Ebeling PR. Fall and fracture risk in sarcopenia and dynapenia with and without obesity: the role of lifestyle interventions. Curr Osteoporos Rep. (2015) 13:235–44. doi: 10.1007/s11914-015-0274-z
7. Laslett LJ, Alagona P Jr, Clark BA III, Drozda JP Jr, Saldivar F, Wilson SR, et al. The worldwide environment of cardiovascular disease: prevalence, diagnosis, therapy, and policy issues: a report from the American College of Cardiology. J Am Coll Cardiol. (2012) 60(25 Suppl):S1–49. doi: 10.1016/j.jacc.2012.11.002
8. Smith SC Jr, Collins A, Ferrari R, Holmes DR Jr, Logstrup S, McGhie DV, et al. Our time: a call to save preventable death from cardiovascular disease (heart disease and stroke). Circulation. (2012) 126:2769–75. doi: 10.1161/CIR.0b013e318267e99f
9. Atkins JL, Whincup PH, Morris RW, Lennon LT, Papacosta O, Wannamethee SG. Sarcopenic obesity and risk of cardiovascular disease and mortality: a population-based cohort study of older men. J Am Geriatr Soc. (2014) 62:253–60. doi: 10.1111/jgs.12652
10. Chuang SY, Chang HY, Lee MS, Chia-Yu Chen R, Pan WH. Skeletal muscle mass and risk of death in an elderly population. Nutr Metab Cardiovasc Dis. (2014) 24:784–91. doi: 10.1016/j.numecd.2013.11.010
11. Spahillari A, Mukamal KJ, DeFilippi C, Kizer JR, Gottdiener JS, Djoussé L, et al. The association of lean and fat mass with all-cause mortality in older adults: the Cardiovascular Health Study. Nutr Metab Cardiovasc Dis. (2016) 26:1039–47. doi: 10.1016/j.numecd.2016.06.011
12. Awad AA, Haddadin AS, Tantawy H, Badr TM, Stout RG, Silverman DG, et al. The relationship between the photoplethysmographic waveform and systemic vascular resistance. J Clin Monit Comput. (2007) 21:365–72. doi: 10.1007/s10877-007-9097-5
13. Awad AA, Ghobashy MA, Stout RG, Silverman DG, Shelley KH. How does the plethysmogram derived from the pulse oximeter relate to arterial blood pressure in coronary artery bypass graft patients? Anesth Analg. (2001) 93:1466–71, table of contents. doi: 10.1097/00000539-200112000-00022
14. Tsai WC, Chen JY, Wang MC, Wu HT, Chi CK, Chen YK, et al. Association of risk factors with increased pulse wave velocity detected by a novel method using dual-channel photoplethysmography. Am J Hypertens. (2005) 18:1118–22. doi: 10.1016/j.amjhyper.2005.03.739
15. Nitzan M, Babchenko A, Khanokh B. Very low frequency variability in arterial blood pressure and blood volume pulse. Med Biol Eng Comput. (1999) 37:54–8. doi: 10.1007/BF02513266
16. Middleton PM, Chan GS, O'Lone E, Steel E, Carroll R, Celler BG, et al. Spectral analysis of finger photoplethysmographic waveform variability in a model of mild to moderate haemorrhage. J Clin Monit Comput. (2008) 22:343–53. doi: 10.1007/s10877-008-9140-1
17. Sherebrin MH, Sherebrin RZ. Frequency analysis of the peripheral pulse wave detected in the finger with a photoplethysmograph. IEEE Trans Biomed Eng. (1990) 37:313–7. doi: 10.1109/10.52332
18. Wei LY, Chow P. Frequency distribution of human pulse spectra. IEEE Trans Biomed Eng. (1985) 32:245–6. doi: 10.1109/TBME.1985.325537
19. Hsiu H, Hsu CL, Wu TL. Effects of different contacting pressure on the transfer function between finger photoplethysmographic and radial blood pressure waveforms. Proc Inst Mech Eng H. (2011) 225:575–83. doi: 10.1177/0954411910396288
20. Hsiu H, Huang SM, Hsu CL, Hu SF, Lin HW. Effects of cold stimulation on the harmonic structure of the blood pressure and photoplethysmography waveforms. Photomed Laser Surg. (2012) 30:77–84. doi: 10.1089/pho.2011.3124
21. Chen CT, Huang SM, Hsiu H, Hsu WC, Lin FC, Lin HW. Using a blood pressure harmonic variability index to monitor the cerebral blood flow condition in stroke patients. Biorheology. (2011) 48:219–28. doi: 10.3233/BIR-2011-0593
22. Nichols WW. McDonald's Blood Flow in Arteries: Theoretical. Experimental and Clinical Principles. London: CRC Press (1998).
24. Rodríguez AJ, Karim MN, Srikanth V, Ebeling PR, Scott D. Lower muscle tissue is associated with higher pulse wave velocity: a systematic review and meta-analysis of observational study data. Clin Exp Pharmacol Physiol. (2017) 44:980–92. doi: 10.1111/1440-1681.12805
25. Avolio AP, Butlin M, Walsh A. Arterial blood pressure measurement and pulse wave analysis–their role in enhancing cardiovascular assessment. Physiol Meas. (2010) 31:R1–47. doi: 10.1088/0967-3334/31/1/R01
26. Luchsinger PC, Snell RE, Patel DJ, Fry DL. Instanteous pressure distribution along the human aorta. Circ Res. (1964) 15:503–10. doi: 10.1161/01.RES.15.6.503
27. O'Rourke MF, Blazek JV, Morreels CL Jr, Krovetz LJ. Pressure wave transmission along the human aorta. Changes with age and in arterial degenerative disease. Circ Res. (1968) 23:567–79. doi: 10.1161/01.RES.23.4.567
28. Safar ME, Levy BI, Struijker-Boudier H. Current perspectives on arterial stiffness and pulse pressure in hypertension and cardiovascular diseases. Circulation. (2003) 107:2864–9. doi: 10.1161/01.CIR.0000069826.36125.B4
29. Tuttolomondo A, Di Sciacca R, Di Raimondo D, Serio A, D'Aguanno G, Pinto A, et al. Arterial stiffness indexes in acute ischemic stroke: relationship with stroke subtype. Atherosclerosis. (2010) 211:187–94. doi: 10.1016/j.atherosclerosis.2010.02.010
30. Lo Gullo A, Giuffrida C, Morace C, Squadrito G, Magnano San Lio P, Ricciardi L, et al. Arterial stiffness and adult onset vasculitis: a systematic review. Front Med. (2022) 9:824630. doi: 10.3389/fmed.2022.824630
31. Wang Y-YL, Hsu T-L, Jan M-Y, Wang W-K. Theory and applications of the harmonic analysis of arterial pressure pulse waves. J Med Biol Eng. (2010) 30:125–31.
32. Donato AJ, Machin DR, Lesniewski LA. Mechanisms of dysfunction in the aging vasculature and role in age-related disease. Circ Res. (2018) 123:825–48. doi: 10.1161/CIRCRESAHA.118.312563
33. Lipsitz LA, Goldberger AL. Loss of ‘complexity' and aging. Potential applications of fractals and chaos theory to senescence. JAMA. (1992) 267:1806–9. doi: 10.1001/jama.267.13.1806
34. Uçar MK, Uçar K, Uçar Z, Bozkurt MR. Determination gender-based hybrid artificial intelligence of body muscle percentage by photoplethysmography signal. Comput Methods Progr Biomed. (2022) 224:107010. doi: 10.1016/j.cmpb.2022.107010
35. Hsu CL, Hsiu H, Hsu WC, Chen CY. Characteristics of harmonic indexes of the arterial blood pressure waveform in polycystic ovary syndrome. Blood Press Monit. (2014) 19:226–32. doi: 10.1097/MBP.0000000000000044
36. Chang YW, Hsiu H, Yang SH, Fang WH, Tsai HC. Characteristics of beat-to-beat photoplethysmography waveform indexes in subjects with metabolic syndrome. Microvasc Res. (2016) 106:80–7. doi: 10.1016/j.mvr.2016.04.001
Keywords: sarcopenia, photoplethysmography (PPG), harmonic index, vascular elasticity index (VEI), geriatrics
Citation: Ou Young T, Wu L-W, Hsiu H, Peng T-C and Chen W-L (2022) Characteristics of sarcopenia subjects in arterial pulse spectrum analysis. Front. Public Health 10:969424. doi: 10.3389/fpubh.2022.969424
Received: 15 June 2022; Accepted: 15 August 2022;
Published: 06 September 2022.
Edited by:
Alberto Sardella, University of Messina, ItalyReviewed by:
Federica Bellone, University of Messina, ItalyCopyright © 2022 Ou Young, Wu, Hsiu, Peng and Chen. This is an open-access article distributed under the terms of the Creative Commons Attribution License (CC BY). The use, distribution or reproduction in other forums is permitted, provided the original author(s) and the copyright owner(s) are credited and that the original publication in this journal is cited, in accordance with accepted academic practice. No use, distribution or reproduction is permitted which does not comply with these terms.
*Correspondence: Li-Wei Wu, YmlnbW91dGgwODI1QGhvdG1haWwuY29t; Hsin Hsiu, aGhzaXVAbWFpbC5udHVzdC5lZHUudHc=
Disclaimer: All claims expressed in this article are solely those of the authors and do not necessarily represent those of their affiliated organizations, or those of the publisher, the editors and the reviewers. Any product that may be evaluated in this article or claim that may be made by its manufacturer is not guaranteed or endorsed by the publisher.
Research integrity at Frontiers
Learn more about the work of our research integrity team to safeguard the quality of each article we publish.