 Yuanxin Hou
 Wenjuan Tao1
 Weimin Li
- 1Institute of Hospital Management, West China Hospital, Sichuan University, Chengdu, China
- 2Department of Critical Care Medicine, Chongqing University Three Gorges Hospital, Chongqing, China
- 3President's Office, West China Hospital, Sichuan University, Chengdu, China
Background: The hierarchical medical system (HMS) refers to the classification of treatment according to disease priorities based on severity and difficulty to promote the fairness of medical services for residents, which is regarded as the key to the success of medical reform in China.
Methods: In the past decade of “New Medical Reform,” the efficiency of HMS, including secondary and tertiary hospitals and primary healthcare centers (PHCs), was measured horizontally and vertically by employing the combination of an output-oriented superefficiency slack-based model-data envelopment analysis (SE-SBM-DEA) model with the Malmquist total factor productivity index (MTFP). In the second stage, the overall technical efficiency (OTE) scores were regressed against a set of environmental characteristics and several managerial factors through bootstrapping truncated regression.
Results: On average, the OTE score in tertiary hospitals was 0.93, which was higher than that in secondary hospitals and PHCs (0.9 and 0.92, respectively). In terms of trend, the OTE of tertiary hospitals declined at first and then increased. The opposite was true of secondary hospitals, in which the APC of the OTE was 10.82 and −3.11% in early and late 2012, respectively. The PHCs generally showed a fluctuating downward trend. In the aspects of productivity, all institutions showed a downturn by an annual average rate of 2.73, 0.51, and 2.70%, respectively. There was a significant negative relationship between the ratio of outpatients to inpatients and tertiary hospitals. Additionally, the medical technical personnel per 1,000 population negatively affected PHCs. In contrast, the GDP per capita had a significantly positive effect on tertiary hospitals, and the number of beds per 1,000 population positively influenced PHCs.
Conclusion: The efficiency of medical institutions at various levels in HMS was unbalanced and took the form of an “inverted pyramid.” Multilateral factors influence the efficiency of HMS, and to address it, multi-intervention packages focusing on sinking high-quality medical resources and improving healthcare capacity, and guiding hierarchical medical practice should be adopted.
Introduction
China has been dedicated to promoting a hierarchical medical system (HMS) to rationally modify the current healthcare structure with the goal to realize equal access to basic medical services for all, ultimately, achieving maximized use of medical resources. In the 1980s, the establishment of a three-level medical system composed of city, district, and street clinics was the prototype of HMS in China. In March 2009, the Chinese government formally launched a new round of healthcare reform, of which HMS was considered the “core” content (1, 2). In 2015, the State Council proposed a tiered healthcare delivery system toward an official implementation of HMS in China. By 2020, the HMS conforming to national conditions will be established (3). To achieve such a goal, a series of promotion strategies contributed to the implementation of HMS in hospitals nationwide, including training medical staff, doctors practicing in multiple locations, medical alliances (4), partner assistance, telemedicine (5), professional coalitions, family doctor contract services (6), and medical insurance (7).
Although the HMS in China has made some progress, there are still challenges, and more effective strategies are expected to be implemented in the future (8). For example, the structural questionnaire in Shandong found that self-initiated downward referral was less than one-third, and upward referral was easy but hard than downward referral (9). The nationally representative longitudinal data from 2012 to 2018 indicated that the residents' likelihood of choosing PHC services represented a decreasing trend (10). A practical survey in Jilin indicated that care users' first contact with PHCs flowed in an inverse U shape (11). In contrast, a study among patients showed that 2/5 patients bypassed PHCs to access care from higher-tier facilities (12). In fact, superior hospitals often form a certain degree of siphonic effect on subordinate hospitals due to the loose two-way referral and their technical advantages (13). An analysis of the hospital market in China after the 2009 healthcare reform showed that tertiary hospitals were still hard to access because of excessive patients and overlap in services with junior hospitals (14, 15), which usually indicated higher healthcare expenditures (16). The work-related accumulated fatigue among doctors in six provinces of China showed that high-level states were prevalent in tertiary hospitals (17), as well as idled medical resources in secondary hospitals and PHCs. To optimize the redistribution of medical resources and improve the efficiency of HMS, more needs to be done by the government (18).
Given the critical role that efficiency plays in improving the use of medical resources, understanding the level of efficiency and associated factors in HMS is an important research and policy question. Wang analyzed the efficiency of China's medical service resources under the background of HMS and found a large gap between provinces (19). At the provincial level, Wu examined the unbalanced implementation efficiency of PHCs in Fujian (20). According to the practical survey of Chongqing, Yang found that there were still significant spatial disparities in spatial accessibility to medical services by adopting HMS (21). Wang built a discrete choice model, which indicates that HMS led to an increase in patient satisfaction (22). Niu (23) and Li (24) systematically found that the HMS could gradually increase the total medical profit. However, there is no research evidence available to compare the efficiency of the three-level medical system in China. In this article, we focused on the comparison of effectiveness between secondary and tertiary hospitals and PHCs in HMS. Superefficiency slack-based model-data envelopment analysis (SE-SBM-DEA) and the DEA-based Malmquist total factor productivity index (MTFP, TFP) were combined to evaluate the static and dynamic efficiency of resource allocation in medical institutions at various levels from 2010 to 2019. A bootstrapping truncated regression model was used to perform a regression analysis on the influencing factors on technical effectiveness. In addition, the analytical framework has several technical advantages: first, the input and output of healthcare include multiple aspects, which is exactly the advantage of DEA for calculating the efficiency of HMS; second, DEA can effectively avoid the problem of model setting error because of non-parametric estimation; finally, the combination of DEA and bootstrapping truncated regression can overcome the interception problem of efficiency distribution and determine the interactions to improve HMS efficiency (25). Integrating the above analysis, we aimed to put forward scientific suggestions for promoting the high-quality development of HMS in China.
Materials and methods
Superefficiency slack-based model-data envelopment analysis
Data envelopment analysis (DEA) is a powerful non-parametric comprehensive evaluation method created by Charnes in 1978 (26). DEA accommodates multiple inputs and outputs in a single measure of efficiency and has become the dominant approach to measuring efficiency in healthcare (27). Additionally, researchers have improved the model in various fields. However, these models have a commonly fatal weakness in that measures are still radial and angular. To solve the effect of slackness caused by input and output, Tone proposed a non-radial slack-based measure of efficiency in data envelopment analysis (SBM-DEA) (28), which was more suitable for evaluating samples with fuzzy interconnect inputs, and further provided target improvement values for the input and output of each inefficient decision-making unit (DMU) (29). Moreover, the traditional DEA model fails to distinguish the DMUs with an efficiency value equal to the highest value “1” (30). As a solution, Xue proposed the superefficiency DEA (SE-DEA) mode in 2002 (31), in which the basic idea was to remove the effective evaluation unit from the set and reevaluate for further evaluation and ranking of multiple DMUs more accurately (32). SE-SBM-DEA is a combination of superefficiency DEA and the SBM model, which addresses excessive input as well as a shortage in output and uses additive models to provide a scalar measure of all inefficiencies (33). Therefore, it has superiority over the traditional DEA model. We used the following description.
In formula (1), ρ * is the super efficiency value of DMU, represents the input–output value of the production unit during the period, and represents the relaxation vector of the input–output. This shows that the input is excessive, and the expected output is insufficient when 0.
DEA-based malmquist total factor productivity index
In terms of efficiency evaluation, SE-SBM-DEA is mainly used to evaluate the relative performance of medical institutions at all levels in a certain period of time, which cannot continuously compare different periods (34, 35). It is also important to investigate the dynamic development of efficiency for medical institutions at all levels over a while. MTFP can be used in DEA theory to observe the TFP between two periods, objectively reflecting the changes in productivity (36). Caves DW first introduced the MTFP based on Malmquist (37), which has been frequently applied to measure the dynamic efficiency change of DMUs in different periods (38). Färe further decomposed the MTFP into efficiency change (EFFCH), pure efficiency improvement (PECH), technological progress change (TECHCH), and scale efficiency improvement (SECH) as follows, which developed it into a production technology index using a distance function to describe multiple input and output variables (39, 40). The expression of the Malmquist index is expressed using the following formula:
In formula (2), MTFPi (TFP) measures the productivity change of the ith DMU between the two periods t and t+1, and D represents the Shephard distance functions. xt and xt+1 denote the input vector in period t, and t+1, yt, and yt+1 denote the output vector.
Bootstrapping truncated regression
The DEA model measured relative efficiency by comparing and evaluating multi-input and multioutput DMUs, but it did not capture the key factors affecting efficiency. Thus, having calculated the efficiency score, we regressed environmental and managerial factors as the explanatory variables on the OTE to investigate the reasons for inefficiencies in medical institutions at various levels (41). In our study, we took into account the independence, availability, and comprehensiveness of data with the research focus. Therefore, the environmental factors that we considered were based on the literature and included the urbanization rate (UR) and GDP per capita (GDB). Medical technical personnel and beds per 1,000 population (MTPP and BP), the ratio of outpatients to inpatients (OI), the average length of stay (ALoS), and the ratio of doctors to nurses (DN) were determined to be the major managerial factors affecting service efficiency (42). Based on the imbalance in the allocation of healthcare resources existed between urban and rural areas in China (43), the population urbanization reflecting the transition of rural population to urban population might influence residents' decision to seek medical treatment. Like the UR, the GDB could well reflect the local economic development and residents' living standards, which could encourage the choice of high-quality healthcare. The ALoS was a comprehensive index for estimating hospital efficiency, medical quality, and technical level (44). Reducing it can not only minimize the cost of medical resources but also save the cost of medical treatment for patients and increase health production efficiency. The MTPP and BP showed the annual allocation of medical resources in China. At the same time, the DN was an important indicator of the quality of medical institutions, which related to health-related sustainable development. The number of outpatients to the inpatients in the same period represented the functional orientation of disease diagnosis and treatment in medical institutions at various levels and also a strategy to promote public hospitals' participation in HMS.
As the dependent variable, the OTE obtained from SE-SBM-DEA was non-negative; if traditional regression methods such as the ordinary least squares or typical Tobit regression were used directly (45), it would bring serious bias and inconsistency to the parameter estimation due to the existence of a correlation between the measures of efficiency and the error terms (46, 47). To avoid the dependency problem, following Simar and Wilson (48), we adopted bootstrapping truncated regression to explore the factors affecting the OTE of HMS (49) as follows:
Among them, yit stands for the comprehensive technical efficiency of ith DMU in period t (OTEit), Zj is the set of explanatory variables for j = 1, …, 5, and εj is the error term.
Variables and data
From 2010 to 2019, we used panel data from secondary and tertiary hospitals and PHCs, including community healthcare centers/stations, township hospitals, and village clinics. Affected by the epidemic situation of COVID-19 in 2020, the efficiency of medical institutions at various levels decreased so significantly that the data were not included in the study. The variables selected for this study, summarized in Table 1, were informed by evidence from similar studies and the availability of data. The correlation for input–output variables was tested by IBM SPSS Statistics 20 and is shown in Table 2. The efficiency results were obtained on a Maxdea ultra 8. Annual percent change (APC) and average annual percent change (AAPC) were used to represent the trend change of the rate. APC = (eρ−1) × 100%, ρ was the regression coefficient obtained using the Joinpoint Version 4.9.0.1. STATA 16 was used to perform the bootstrapping truncated regression analysis.

Table 1. Study variables and data.
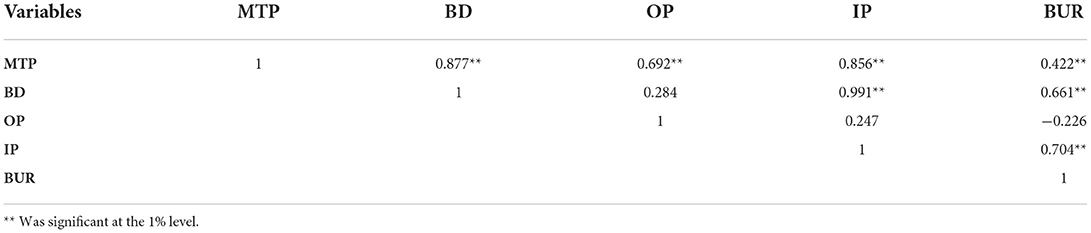
Table 2. Correlation coefficient analysis of variables.
Results
Static technical efficiency
From the descriptive statistics trend from 2010 to 2019 (Table 3), we revealed that both input and output in HMS were enhanced annually. Additionally, superior hospitals were more obvious. On average, the results in Table 4, Figure 1 show that the overall technical efficiency (OTE) of tertiary hospitals was 0.93, and it first decreased (APC = −4.46%, P < 0.05, in 2010–2015) and then increased acceleratingly (APC = 4.13%, P < 0.05, in 2015–2019). The secondary hospitals' OTE was 0.90; however, it first increased (APC = 10.82%, P < 0.05, in 2010–2012) and then decreased (APC = −3.11%, P < 0.05, in 2012–2019), which was in line with Jiang's results that there was a relatively low OTE of the postreform significantly less than that of the prereform for public county hospitals mainly belonging to secondary hospitals (88). The PHCs generally showed a fluctuating downward trend (APC = −3.73%, P < 0.05, in 2013–2019; AAPC = −2.50%, P < 0.05, mean equals 0.92 in 2010–2019), a conclusion consistent with previous findings in PHCs (89, 90). Although the “New Medical Reform” began in 2009, the secondary hospitals and PHCs were technically inefficient after the official implementation of the HMS.
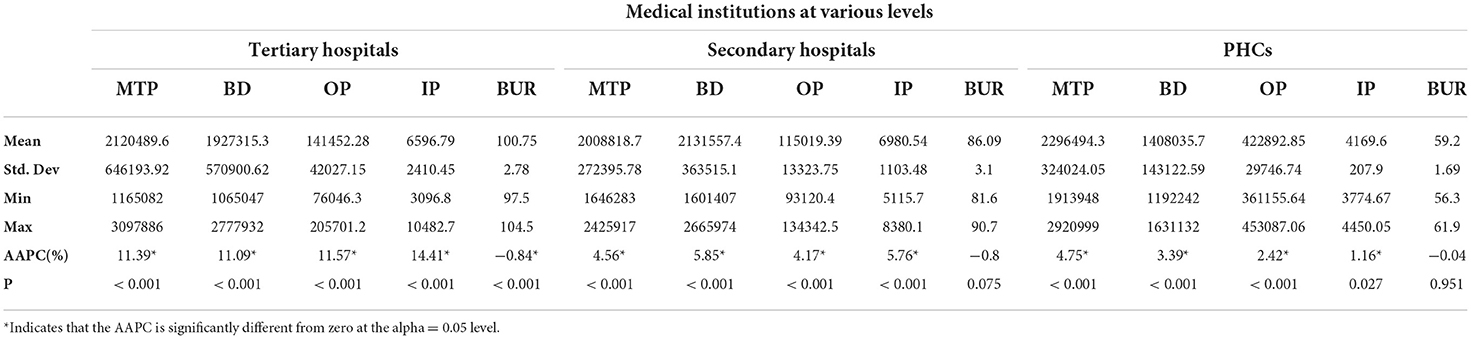
Table 3. Descriptive statistics of inputs, outputs, and quality attributes, 2010–2019.
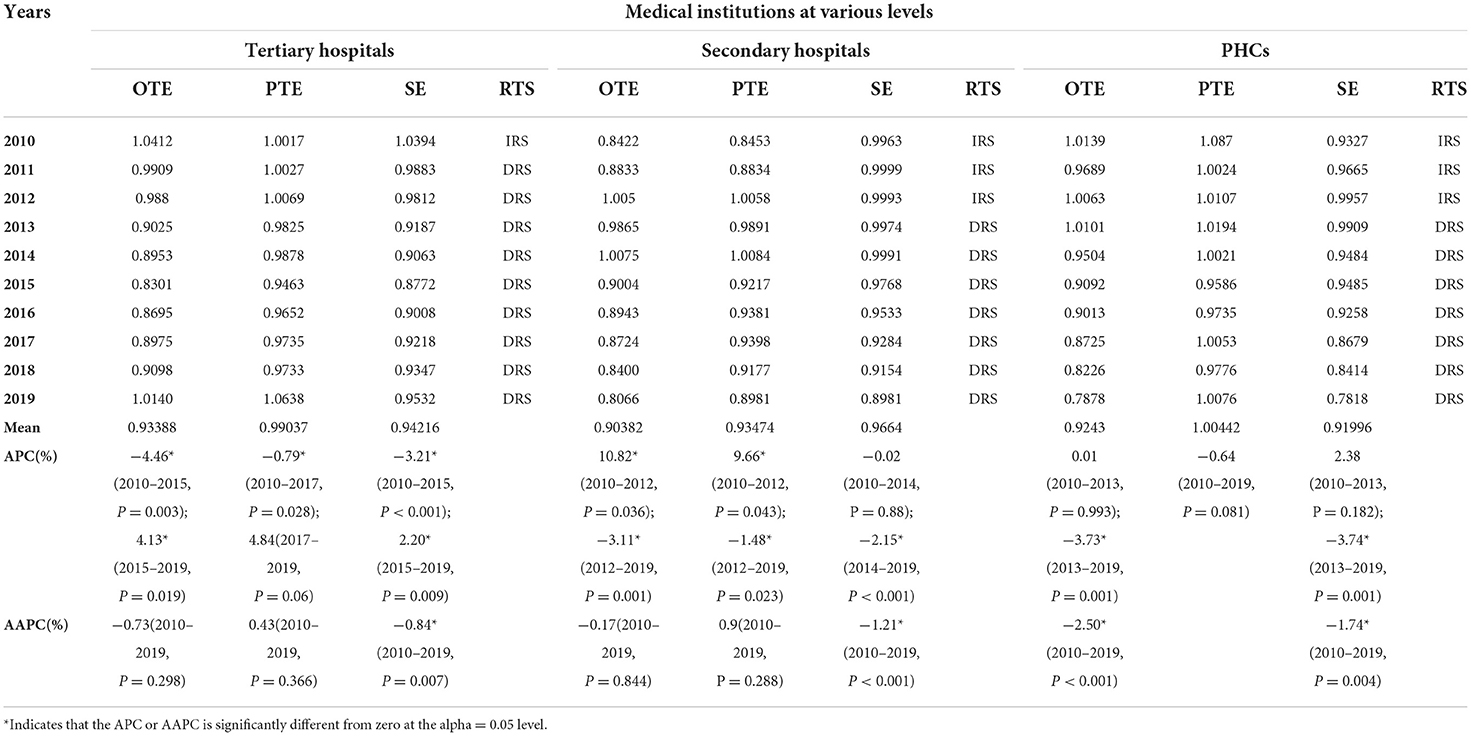
Table 4. The overall efficiency scores of medical institutions at various levels.
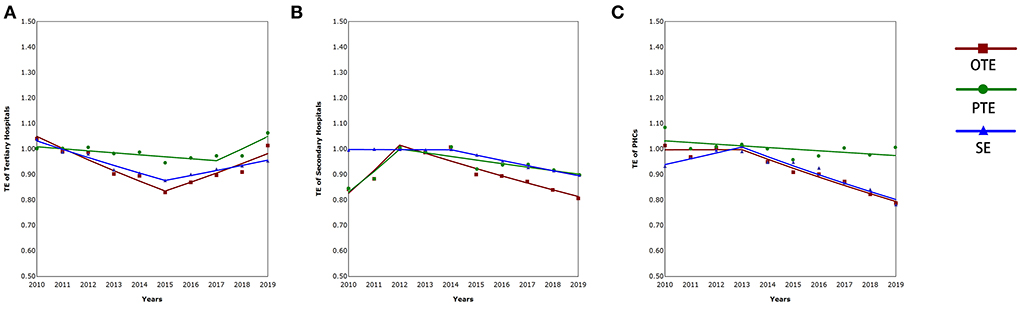
Figure 1. The technical efficiency of tertiary hospitals (A), secondary hospitals (B), and PHCs (C).
For any DMU, the technical efficiency was effective if pure technical efficiency (PTE) was more than 1. The results showed that secondary hospitals increased at first (APC = 9.66%, P < 0.05, in 2010–2012) and then decreased (APC = −1.48%, P < 0.05 in 2012–2019) annually. Additionally, 80% of it was always < 1. The opposite was true of tertiary hospitals, and PHCs fluctuated. Scale efficiency (SE) reflects the increase or decrease in returns to scale, which is affected by input (91). The tertiary hospitals decreased first (APC = −3.21%, P < 0.05, in 2010–2015), then increased (APC = 2.20%, P < 0.05, in 2015–2019), and showed overall downward trends (AAPC = −0.84%, P < 0.05, in 2010–2019). Comparatively speaking, the secondary hospitals (APC = −2.15%, P < 0.05, in 2014–2019; AAPC = −1.21%, P < 0.05, in 2010–2019) and PHCs (APC = −3.74%, P < 0.05, in 2013–2019; AAPC = −1.74, P < 0.05, in 2010–2019) exhibited a more pronounced downward trend. Generally speaking, 77% of years of all institutions decreased returns to scale.
Dynamic efficiency evaluation
TFP>1 indicated that the total factor productivity of DMUs showed an increasing trend from t to t-1. In contrast, TFP < 1 indicated downward and TFP = 1 did not change (92). Between 2010 and 2019, the results revealed a negative trend in productivity, with yearly average Rates of 2.73% (tertiary hospitals), 0.51% (secondary hospitals), and 2.70% (PHCs) (Table 5).
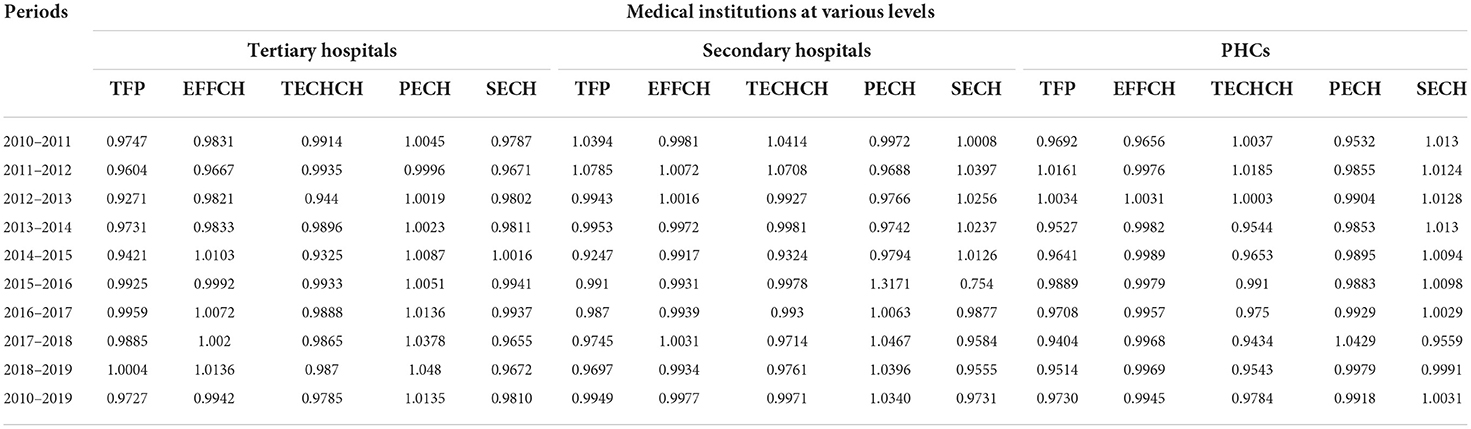
Table 5. The overall MTFP of health institutions at various levels.
During this time period, the EFFCH indicated a reduced trend at an annual rate of 0.58% (tertiary hospitals) and 0.23% (secondary hospitals), with those in 2009 and 2019 being mainly due to the increasing PECH while pronounced decreasing SECH. Furthermore, PHCs showed an upturn by an annual average rate of 0.31% in SECH, but their PECH declined; finally, the EFFCH experienced an average decrease of 0.82%. The results also revealed technology declines, with 81.48% of the TECHCH < 1, and less than one-fifth of the TFP > 1. Therefore, technological progress and innovation were the main contributing factors for improving productivity.
Consistent with the negative changes in SECH for tertiary and secondary hospitals, a gain in OTE could be achieved through downsizing the scale of operation, including equipment, beds, and medical personnel, especially after 2013. Meanwhile, the findings further confirmed that scale inefficiency was the primary cause of inefficiency in Chinese hospitals (93). Moreover, PTE was the key factor that promoted or restricted the improvement of the OTE of medical institutions at various levels. Thus, similar to tertiary hospitals, continuous technology, and quality improvement were foundational approaches to improving the OTE for PHCs and secondary hospitals.
The relationship between OTE and external and internal factors
The bootstrapping truncated regression of efficiency on medical institutions at various levels was carried out. The results in Tables 6–13 show that the environmental and managerial factors had different significant effects on the OTE of various institutions. As a robustness check of our results, we estimated the verification model, where the OTE remained as the dependent variable, and the explanatory variables were the residuals obtained from OLS regressions of significant affecting factors on each of the indexes, respectively. In tertiary hospitals, the GDB (β = 1.61E-5; P < 0.05) was positively correlated. However, OI had a negative association (β = −0.155; P < 0.01). In line with previous studies, the economic level affected patients' medical choice preferences (94, 95). However, the most significant negative impact of OI implied that they should provide high-level specialized inpatient services and treat serious or difficult diseases (96). Similarly, OI had a significant negative effect on secondary hospitals (β = −0.127; P < 0.05) but failed to pass the robustness test significantly. On the contrary, MTPP negatively affected PHCs (β = −0.238; P < 0.01), while BP had a positive influence (β = 0.53; P < 0.01). This analysis might suggest that PHCs failed to attract more patients or give full play to the role of “healthy gatekeepers,” and widespread gaps in the quality of PHCs still exist (97), which were limited by the lack of qualified health service providers (98).
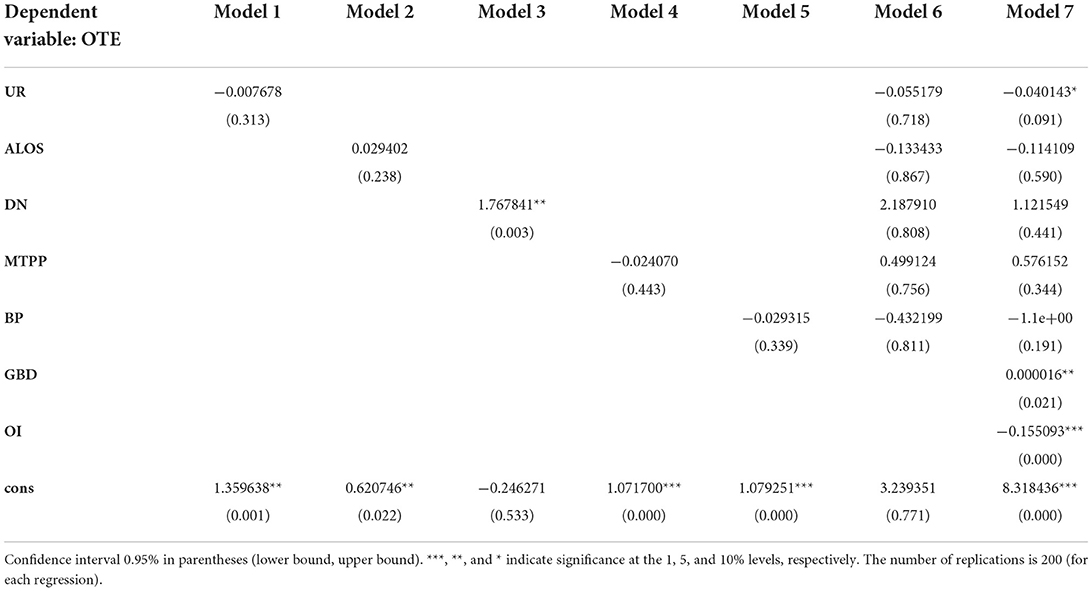
Table 6. Results of bootstrapping truncated regression for tertiary hospitals.
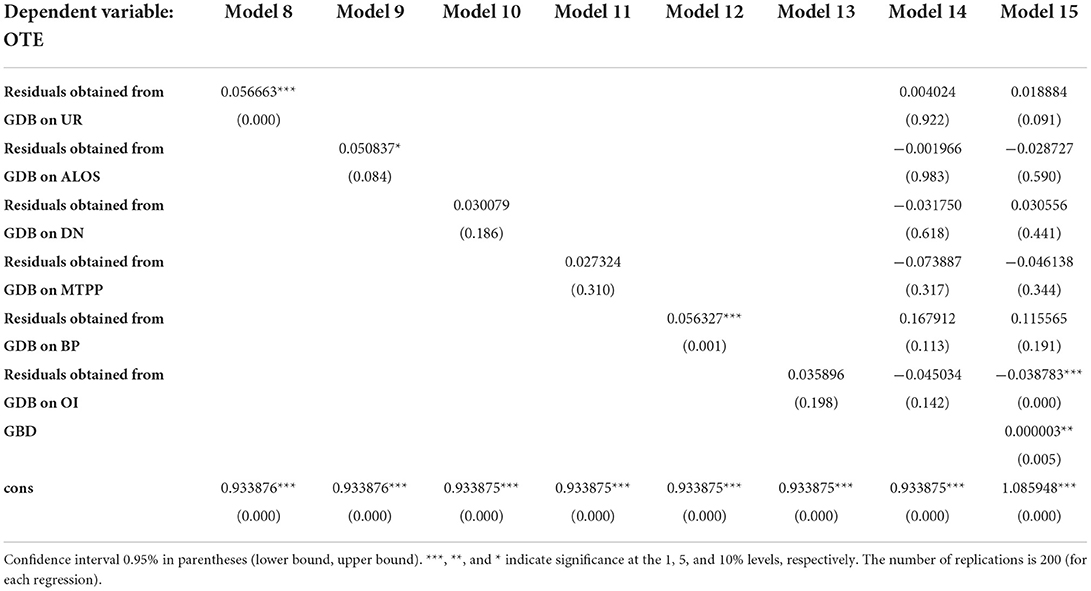
Table 7. Results of bootstrapping truncated regression for tertiary hospitals: estimations of the residuals from GBD.
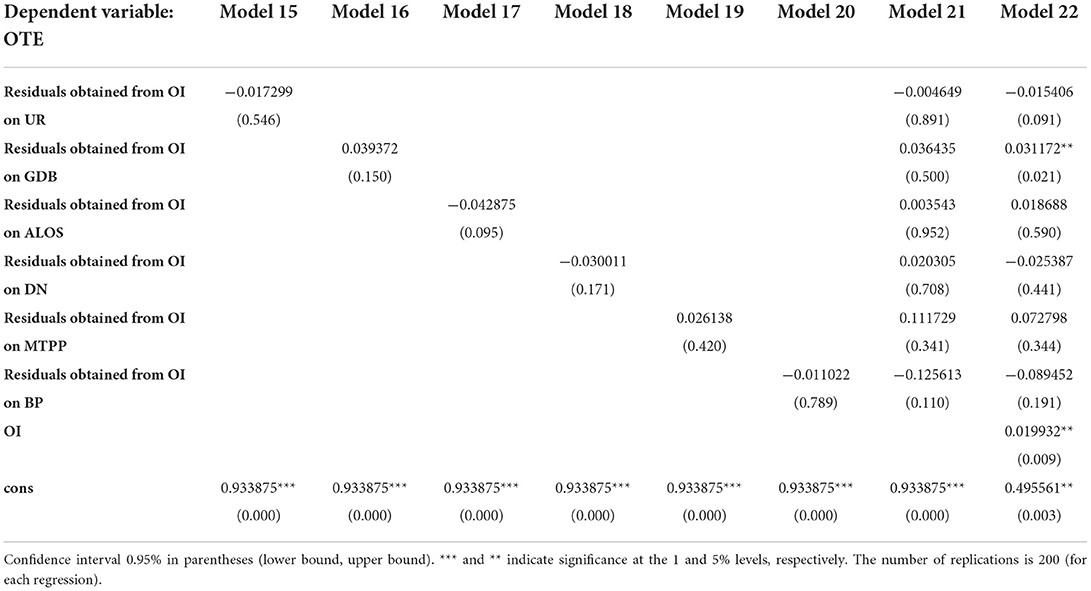
Table 8. Results of bootstrapping truncated regression for tertiary hospitals: estimations of the residuals from OI.

Table 9. Results of bootstrapping truncated regression for secondary hospitals.
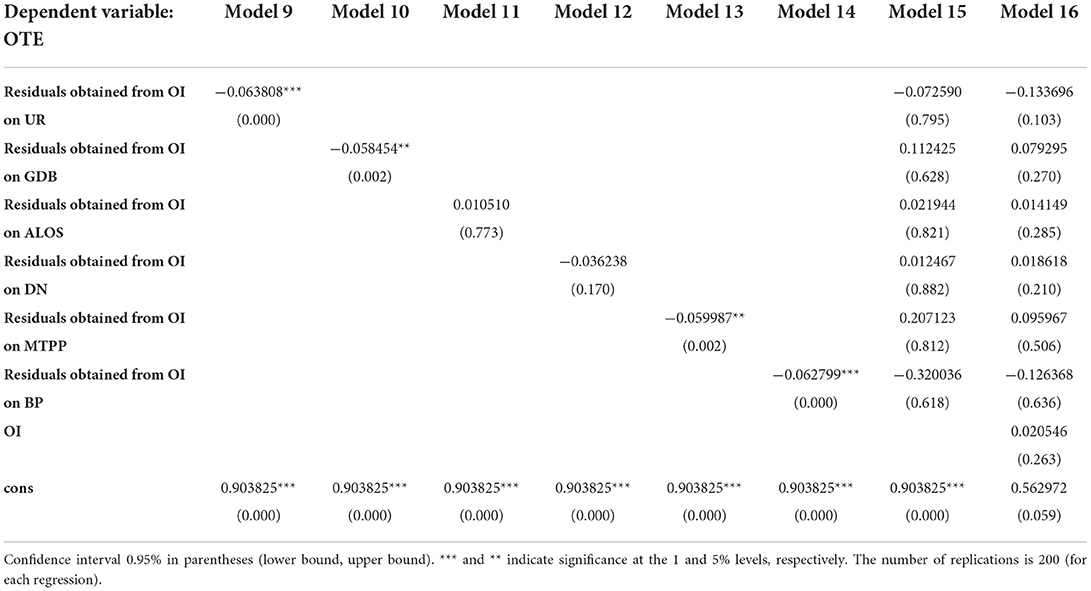
Table 10. Results of bootstrapping truncated regression for secondary hospitals: estimations of the residuals from OI.
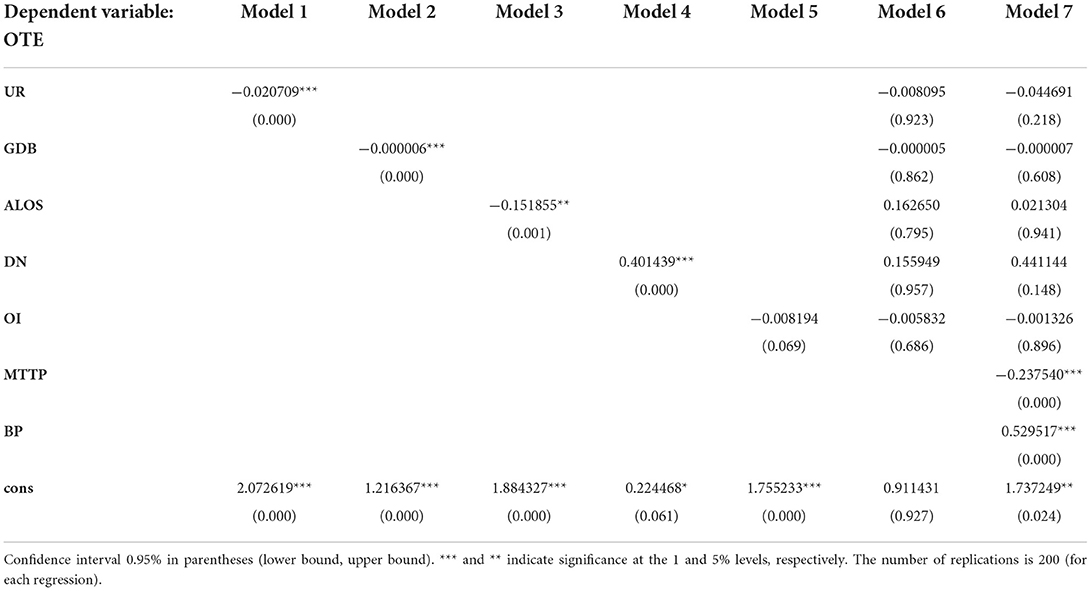
Table 11. Results of bootstrapping truncated regression for PHCs.
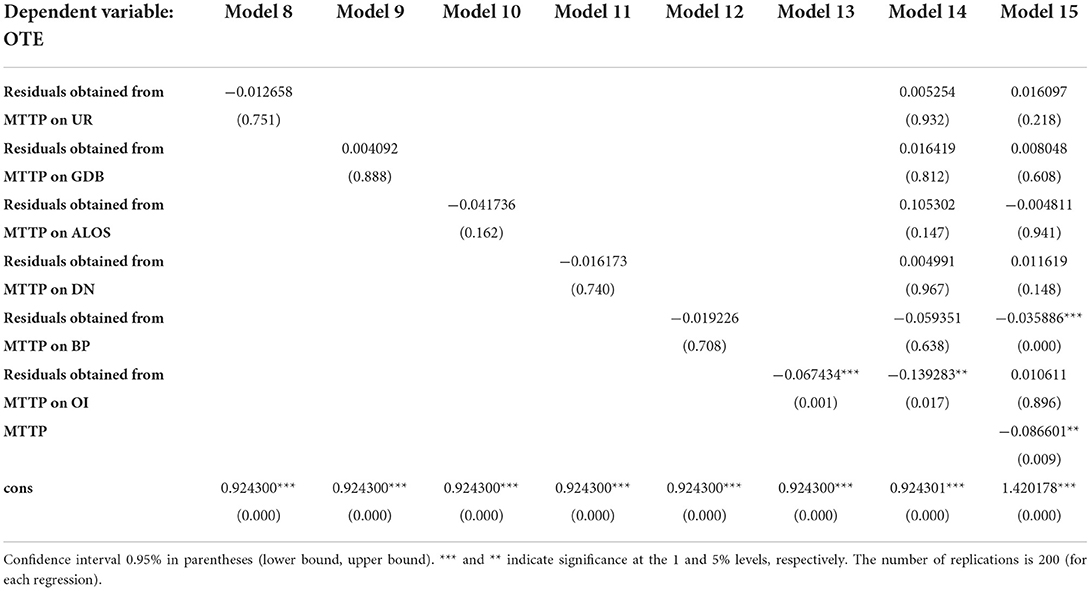
Table 12. Results of bootstrapping truncated regression for PHCs: estimations of the residuals from MTTP.
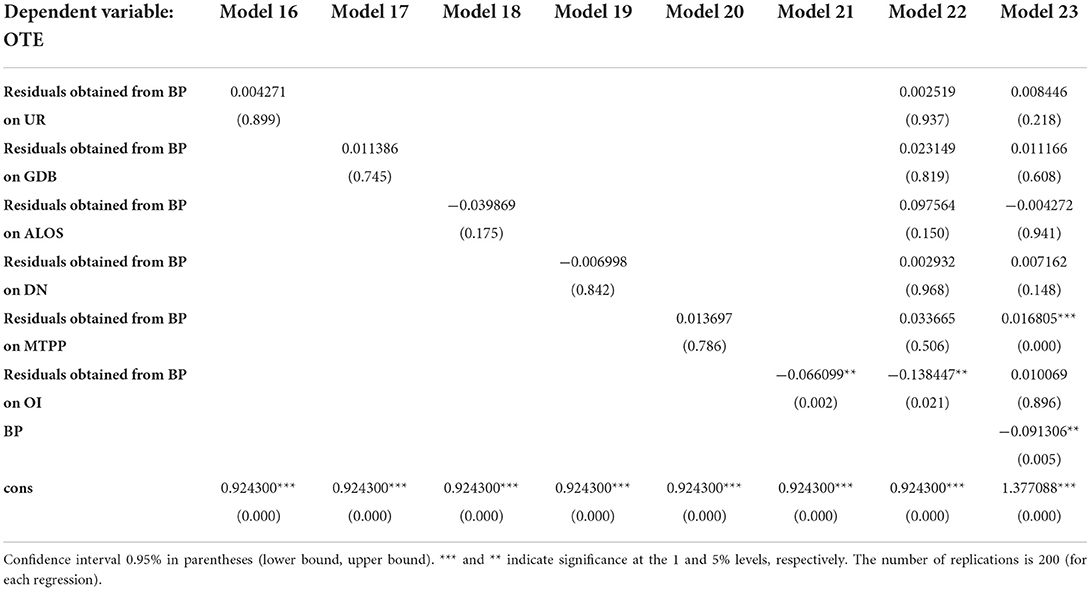
Table 13. Results of bootstrapping truncated regression for PHCs: estimations of the residuals from BP.
Discussion
The “inverted triangle” of health resource allocation in China has been the usual course of medical care-seeking behavior (99–101). By comparing medical institutions at various levels in HMS, we further found that the levels of efficiency presented the same form of an “inverted pyramid.” The regional differences in the allocation efficiency of public health resources (102), coupled with hierarchical heterogeneity in HMS, are of particular concern in China.
To obtain the expected medical model, improving the efficiency of subordinate medical institutions is an issue of paramount importance for health policy to ensure the ability to attract and retain patients, especially for PHCs. Evidence indicates that service capability is the primary factor limiting patients' trust and choice of healthcare (103). To improve the effectiveness of HMS, a more practical health policy on improving the professional level of health technicians and the ability of medical service should be formulated.
Considering patients' freedom to choose any medical institution, the mismatching patient flow in the HMS is the main reason for the low efficiency of subordinate medical institutions, on the contrary, overcrowding in high-level general hospitals. Hence, the HMS would not be successful if the voices of the patients were ignored. To address this complicated problem, it is necessary to guide patients to seek medical treatment based on patient-perceived value for service quality and form a reasonable medical order adapting to HMS.
Implications for hospital managers and policymakers
In promoting the high-quality development of public hospitals in China, managers should take into account not only the balanced allocation of medical resources but also the efficiency. It is imperative to reasonably adjust the scale and service of tertiary hospitals, further motivating the flow of medical talent and service cooperation between tertiary hospitals and low-level hospitals. In addition, the reform of the profit-making mechanism of public hospitals would contribute to improving an active two-way referral in HMS.
Managers should continue to enhance the capacity of medical services through medical alliances, partner assistance, telemedicine, professional coalitions, and so on for secondary hospitals. Moreover, to improve the service capacity of PHCs, training, retaining, and evaluating capable people; improving mechanisms and working conditions; ensuring salary and benefits (104, 105); strengthening the ranks of general practitioners; establishing performance accountability; and optimizing continuing education and professional development are worth considering (106, 107). In addition, policies to strengthen all medicines supply and family doctor contract services would further ensure the primary diagnosis at PHCs (108).
Furthermore, public education and guidance for HMS should be strengthened to change patient care-seeking behavior to hierarchical medical practice. Where the conditions were available, as a pilot, the government should take a powerful way to promote the HMS that patients seek healthcare according to their disease rather than subjectively. On the contrary, it might help achieve HMS to set different reimbursement strategies for different diseases and medical institutions at various levels.
Conclusion
The inverted pyramid-like effectiveness of the three-level medical system may seriously aggravate the unbalanced development of HMS in China, which was mainly restricted by the medical service capacity and mismatching patient flow. To improve the imbalance, multi-intervention packages focusing on optimizing the allocation of high-quality medical resources, improving the healthcare quality of subordinate medical institutions, and guiding patients to hierarchical diagnosis and treatment should be developed.
Strength limitation and future research
This study might have several limitations. First, the indicators of efficiency in medical institutions at various levels were mainly considered a quantity metric rather than a quality indicator. Therefore, the research results cannot fully reflect the efficiency level of medical quality. Second, the PHCs include township health centers and village clinics in rural areas, and community health centers (stations) and subdistrict health centers in urban areas. Strictly speaking, the environmental effects on various institutions should be different. Nevertheless, to the best of our knowledge, this study is the first to present levels, trends, and determinants of the effectiveness of the HMS in the past 10 years of China's new medical reform, especially during the phase of the official implementation of HMS since 2015, and then, we put forward targeted countermeasures and suggestions on promoting the high-quality development of HMS.
Data availability statement
Publicly available datasets were analyzed in this study. This data can be found here: China Health Statistical Yearbooks published between 2010 and 2020.
Author contributions
YH provided the study idea and drafted the manuscript. WT provided comments and suggestions in revisions of the manuscript. SH gathered and analyzed the data. WL was the corresponding author and the lead writer. All the authors contributed to the revision process and approved the final manuscript.
Acknowledgments
The authors thank the editorial staff of the China Health Statistics Yearbook for providing data in a public way.
Conflict of interest
The authors declare that the research was conducted in the absence of any commercial or financial relationships that could be construed as a potential conflict of interest.
Publisher's note
All claims expressed in this article are solely those of the authors and do not necessarily represent those of their affiliated organizations, or those of the publisher, the editors and the reviewers. Any product that may be evaluated in this article, or claim that may be made by its manufacturer, is not guaranteed or endorsed by the publisher.
References
1. Lancet T. A tiered health-care delivery system for China. Lancet (British edition). (2019) 393:1178. doi: 10.1016/S0140-6736(19)30730-5
2. Huang J, Liu Y, Zhang T, Wang L, Liu S, Liang H, et al. Can family doctor contracted services facilitate orderly visits in the referral system? a frontier policy study from Shanghai, China. Int J Health Plann Manag. (2022) 37:403–16. doi: 10.1002/hpm.3346
3. General Office of the State Council of China. (2015). Guidanceon Promoting Multi-Level Diagnosis and Treatment System. Available online at: http://www.gov.cn/zhengce/content/ (accessed September11, 2015).
4. Cai Y, Wen C, Tang L, Liu P, Xu Y, Hu S, et al. Exploration and consideration of the medical alliance modes. Iran J Public Health. (2018) 47:1160–5.
5. Chiu Y, Wang J, Yu H, Hsu Y. Consultation pricing of the online health care service in China: hierarchical linear regression approach. J Med Internet Res. (2021) 23:e29170. doi: 10.2196/29170
6. Fu P, Wang Y, Liu S, Li J, Gao Q, Zhou C, et al. Analysing the preferences for family doctor contract services in rural China: a study using a discrete choice experiment. BMC Fam Pract. (2020) 21:148. doi: 10.1186/s12875-020-01223-9
7. Zhou Z, Zhao Y, Shen C, Lai S, Nawaz R, Gao J. Evaluating the effect of hierarchical medical system on health seeking behavior: a difference-in-differences analysis in China. Soc Sci Med. (2021) 268:113372. doi: 10.1016/j.socscimed.2020.113372
8. Xiao Y, Wu X, Chen J, Xie F. Challenges in establishing a graded diagnosis and treatment system in China. Fam Pract. (2022) 39:214–6. doi: 10.1093/fampra/cmab089
9. Jing X, Xu L, Qin W, Zhang J, Lu L, Wang Y, et al. The willingness for downward referral and its influencing factors: a cross-sectional study among older adults in Shandong, China. Int J Env Res Pub He. (2020) 17:369. doi: 10.3390/ijerph17010369
10. Wan G, Wei X, Yin H, Qian Z, Wang T, Wang L. The trend in primary health care preference in China: a cohort study of 12,508 residents from 2012 to 2018. BMC Health Serv Res. (2021) 21(1):6790. doi: 10.1186/s12913-021-06790-w
11. Liao R, Liu Y, Peng S, Feng XL. Factors affecting health care users' first contact with primary health care facilities in north eastern China, 2008–2018. BMJ Global Health. (2021) 6:e3907. doi: 10.1136/bmjgh-2020-003907
12. Li C, Chen Z, Khan MM. Bypassing primary care facilities: health-seeking behavior of middle age and older adults in China. BMC Health Serv Res. (2021) 21:690. doi: 10.1186/s12913-021-06908-0
13. Li N, Zhang R, Xing Y. A novel multi-attribute group decision-making method and its application in solving the downward referral problem in the hierarchical medical treatment system in China. IEEE Access. (2019) 7:185205–27. doi: 10.1109/ACCESS.2019.2959061
14. Gao Y, Liu C, Fan X, Wu M, Jiang Y. Issues related to the health status, work pressure and occupational environments of medical staff at level A tertiary public hospitals in Shanghai. Ann Palliat Med. (2021) 10:8203–14. doi: 10.21037/apm-21-1777
15. Dai J, Wang X, Ayala FJ. Medical Informatics and the “Three Long, One Short” problem of large urban hospitals in China. JAMA. (2016) 316:269–70. doi: 10.1001/jama.2016.5487
16. Jiang Q, Pan J. The evolving hospital market in China after the 2009 healthcare reform. Inquiry. (2020) 57:1143521615. doi: 10.1177/0046958020968783
17. Tang C, Liu C, Fang P, Xiang Y, Min R. Work-related accumulated fatigue among doctors in tertiary hospitals: a cross-sectional survey in six provinces of China. Int J Env Res Pub Health. (2019) 16:3049. doi: 10.3390/ijerph16173049
18. Xing Y, Wang L. Evaluation for hierarchical diagnosis and treatment policy proposals in China: a novel multi-attributegroup decision-making method with multi-parametricdistance measures. Int J Health Plann Manage. (2022) 37:1089–117. doi: 10.1002/hpm.3387
19. Wang S, Tao Q. Analysis of the efficiency of China's medical service resources under the background of hierarchical medical policy. Iran J Public Health. (2021) 50:1613–23. doi: 10.18502/ijph.v50i8.6807
20. Wu Q, Xie X, Liu W, Wu Y. Implementation efficiency of the hierarchical diagnosis and treatment system in China: a case study of primary medical and health institutions in Fujian province. Int J Health Plann Manage. (2022) 37:214–27. doi: 10.1002/hpm.3333
21. Yang N, Shen L, Shu T, Liao S, Peng Y, Wang J. An integrative method for analyzing spatial accessibility in the hierarchical diagnosis and treatment system in China. Soc Sci Med. (2021) 270:113656. doi: 10.1016/j.socscimed.2020.113656
22. Wang ZY, Song J, Feng XL. A prediction model of patient satisfaction: policy evaluation and sensitivity analysis. Flex Serv Manuf J. (2022). doi: 10.1007/s10696-022-09448-9
23. Niu W, Huang J, Xing Z, Chen J. Knowledge spillovers of medical big data under hierarchical medical system and patients' medical treatment decisions. IEEE Access. (2019) 7:55770–9. doi: 10.1109/ACCESS.2019.2908440
24. Li L, Kong R. Capacity allocation under hierarchical healthcare in China. In: Li L, Kong R, (editors). 2017 14th International Conference on Service Systems and Service Management (ICSSSM). Dalian: Dongbei University of Finance Economics.
25. Guo X, Zhang J, Xu Z, Cong X, Zhu Z. The efficiency of provincial government health care expenditure after China's new health care reform. PLoS ONE. (2021) 16:e258274. doi: 10.1371/journal.pone.0258274
26. Charnes A, Cooper WW, Rhodes E. Measuring the efficiency of decision making units. Eur J Oper Res. (1978) 2:429–44 doi: 10.1016/0377-2217(78)90138-8
27. Hollingsworth B, Wildman J. The efficiency of health production: re-estimating the WHO panel data using parametric and non-parametric approaches to provide additional information. Health Econ. (2003) 12:493–504. doi: 10.1002/hec.751
28. Tone K. A slacks-based measure of efficiency in data envelopment analysis. Eur J Oper Res. (2001) 130:498–509. doi: 10.1016/S0377-2217(99)00407-5
29. Tone K. A slacks-based measure of super-efficiency in data envelopment analysis. Eur J Oper Res. (2002) 143:32–41 doi: 10.1016/S0377-2217(01)00324-1
30. Kohl S, Schoenfelder J, Fügener A, Brunner JO. The use of Data Envelopment Analysis (DEA) in healthcare with a focus on hospitals. Health Care Manag Sc. (2019) 22:245–86. doi: 10.1007/s10729-018-9436-8
31. Xue M, Harker PT. Note: ranking DMUs with infeasible super-efficiency DEA models. Manage Sci. (2002) 48:705–10. doi: 10.1287/mnsc.48.5.705.7805
32. Shuai S, Fan Z. Modeling the role of environmental regulations in regional green economy efficiency of China: empirical evidence from super efficiency DEA-Tobit model. J Environ Manage. (2020) 261:110227. doi: 10.1016/j.jenvman.2020.110227
33. Chiu Y, Chen Y. The analysis of Taiwanese bank efficiency: Incorporating both external environment risk and internal risk. Econ Model. (2009) 26:456–63. doi: 10.1016/j.econmod.2008.09.003
34. Lin L, Wu F, Chen W, Zhu C, Huang T. Research on urban medical and health services efficiency and its spatial correlation in China: based on panel data of 13 cities in Jiangsu province. Healthcare. (2021) 9:1167. doi: 10.3390/healthcare9091167
35. Sun Y, Wang N. Eco-efficiency in China's loess plateau region and its influencing factors: a data envelopment analysis from both static and dynamic perspectives. Environ Sci Pollut R. (2022) 29:483–97. doi: 10.1007/s11356-021-15278-3
36. Zhu JH, Wang SS. Evaluation and influencing factor analysis of sustainable green transformation efficiency of resource-based cities in western China in the post-COVID-19 era. Front Public Health. (2022) 10:832904. doi: 10.3389/fpubh.2022.832904
37. Malmquist S. Index numbers and indifference surfaces. Trabajos de Estadistica. (1953) 4:209–42. doi: 10.1007/BF03006863
38. Caves DW, Christensen LR, Diewert W. The Economic Theory of Index Numbers and the Measurement of Input, Output, and Productivity. Econometrics. (1982) 50:1393.
39. Färe R, Grosskopf S, Lindgren B, Roos P. Productivity developments in Swedish hospitals: a malmquist output index approach. In: Charnes A, Cooper WW, Lewin AY, Seiford LM (editors). Springer: Netherlands. (1994). p. 253–72.
40. Masri MD, Asbu EZ. Productivity change of national health systems in the WHO Eastern Mediterranean region: application of DEA-based Malmquist productivity index. Global Health Res Policy. (2018) 3:22. doi: 10.1186/s41256-018-0077-8
41. Medarević A, Vuković D. Efficiency and productivity of public hospitals in Serbia using DEA-Malmquist Model and Tobit regression model, 2015-2019. Int J Env Res Pub He. (2021) 18:12475. doi: 10.3390/ijerph182312475
42. Zhang L, Zeng Y, Fang Y. Evaluating the technical efficiency of care among long-term care facilities in Xiamen, China: based on data envelopment analysis and Tobit model. BMC Public Health. (2019) 19:1230. doi: 10.1186/s12889-019-7571-x
43. Chen Y, Yin Z, Xie Q. Suggestions to ameliorate the inequity in urban/rural allocation of healthcare resources in China. Int J Equity Health. (2014) 13:34. doi: 10.1186/1475-9276-13-34
44. Wang J. A Novel q-rung dual hesitant fuzzy multi-attribute decision-making method based on entropy weights. Entropy-Switz. (2021) 23:1322. doi: 10.3390/e23101322
45. Tobin James. Estimation of relationships for limited dependent variables. Econometrica. (1958) 26:24–36. doi: 10.2307/1907382
46. Tang M, Wang X, Niu W, Fu J, Zhu M. How financial development scale and R&D influence regional innovation efficiency: empirical evidence from the financial industry. Environ Sci Pollut R. (2021) 1–4. doi: 10.1007/s11356-021-16862-3
47. Godoy-Durán Á. Galdeano- Gómez E, Pérez-Mesa JC, Piedra-Muñoz L. Assessing eco-efficiency and the determinants of horticultural family-farming in southeast Spain. J Environ Manage. (2017) 204:594–604. doi: 10.1016/j.jenvman.2017.09.037
48. Simar L, Wilson PW. Two-stage DEA: caveat emptor. J Prod Anal. (2011) 36:205–18. doi: 10.1007/s11123-011-0230-6
49. Simar L, Wilson PW. Estimation and inference in two-stage, semi-parametric models of production processes. J Econometrics. (2007) 136:31–64. doi: 10.1016/j.jeconom.2005.07.009
50. Badunenko O, Tauchmann H. Simar and Wilson two-stage efficiency analysis for Stata. Stata J. (2019) 19:950–88. doi: 10.1177/1536867X19893640
51. Thorsen M, McGarvey R, Thorsen A. Diabetes management at community health centers: examining associations with patient and regional characteristics, efficiency, and staffing patterns. Soc Sci Med. (2020) 255:113017. doi: 10.1016/j.socscimed.2020.113017
52. Valdmanis V, Bernet P, Moises J. Hospital capacity, capability, and emergency preparedness. Eur J Oper Res. (2010) 207:1628–34. doi: 10.1016/j.ejor.2010.06.018
53. Obure CD, Jacobs R, Guinness L, Mayhew S, Vassall A. Does integration of HIV and sexual and reproductive health services improve technical efficiency in Kenya and Swaziland? An application of a two-stage semi parametric approach incorporating quality measures. Soc Sci Med. (2016) 151:147–56. doi: 10.1016/j.socscimed.2016.01.013
54. Lin R, Sir MY, Pasupathy KS. Multi-objective simulation optimization using data envelopment analysis and genetic algorithm: specific application to determining optimal resource levels in surgical services. Omega. (2013) 41:881–92. doi: 10.1016/j.omega.2012.11.003
55. Piubello Orsini L, Leardini C, Vernizzi S, Campedelli B. Inefficiency of public hospitals: a multistage data envelopment analysis in an Italian region. BMC Health Serv Res. (2021) 21:1281. doi: 10.1186/s12913-021-07276-5
56. Darabi N, Ebrahimvandi A, Hosseinichimeh N, Triantis K. A DEA evaluation of U.S. States' healthcare systems in terms of their birth outcomes. Expert Syst Appl. (2021) 182:115278. doi: 10.1016/j.eswa.2021.115278
57. Leleu H, Moises J, Valdmanis VG. How do payer mix and technical inefficiency affect hospital profit? A weighted DEA approach. Operations Res Health Care. (2014) 3:231–7 doi: 10.1016/j.orhc.2014.06.002
58. Mohanta KK, Sharanappa DS, Aggarwal A. Efficiency analysis in the management of COVID-19 pandemic in India based on data envelopment analysis. Current Res Behav Sci. (2021) 2:100063. doi: 10.1016/j.crbeha.2021.100063
59. Yaya S, Xi C, Xiaoyang Z, Meixia Z. Evaluating the efficiency of China's healthcare service: A weighted DEA-game theory in a competitive environment. J Clean Prod. (2020) 270:122431 doi: 10.1016/j.jclepro.2020.122431
60. Kazley AS, Ozcan YA. Electronic medical record use and efficiency: a DEA and windows analysis of hospitals. Socio-Econ Plan Sci. (2009) 43:209–16 doi: 10.1016/j.seps.2008.10.001
61. Li SK, He X. The impacts of marketization and subsidies on the treatment quality performance of the Chinese hospitals sector. China Econ Rev. (2019) 54:41–50. doi: 10.1016/j.chieco.2018.10.007
62. Linna M, Häkkinen U, Magnussen J. Comparing hospital cost efficiency between Norway and Finland. Health Policy. (2006) 77:268–78. doi: 10.1016/j.healthpol.2005.07.019
63. Vanková I, Vrabková I. Productivity analysis of regional-level hospital care in the Czech republic and Slovak Republic. Bmc Health Serv Res. (2022) 22:180. doi: 10.1186/s12913-022-07471-y
64. Otay I, Oztaysi B, Cevik Onar S, Kahraman C. Multi-Expert performance evaluation of healthcare institutions using an integrated intuitionistic fuzzy AHP&DEA methodology. Knowl-Based Syst. (2017) 133:90–106 doi: 10.1016/j.knosys.2017.06.028
65. Mitropoulos P, Talias A, Mitropoulos I. Combining stochastic DEA with Bayesian analysis to obtain statistical properties of the efficiency scores: an application to Greek public hospitals. Eur J Oper Res. (2015) 243:302–11 doi: 10.1016/j.ejor.2014.11.012
66. Cinaroglu S. Changes in hospital efficiency and size: an integrated propensity score matching with data envelopment analysis. Socio-Econ Plan Sci. (2021) 76:100960. doi: 10.1016/j.seps.2020.100960
67. Stefko R, Gavurova B, Kocisova K. Healthcare efficiency assessment using DEA analysis in the Slovak Republic. Health Econ Rev. (2018) 8:6. doi: 10.1186/s13561-018-0191-9
68. Hu H, Qi Q, Yang C. Analysis of hospital technical efficiency in China: effect of health insurance reform. China Econ Rev. (2012) 23:865–77 doi: 10.1016/j.chieco.2012.04.008
69. Ilgün G, Konca M. Assessment of efficiency levels of training and research hospitals in Turkey and the factors affecting their efficiencies. Health Policy Techn. (2019) 8:343–8. doi: 10.1016/j.hlpt.2019.08.008
70. Gok MS, Sezen B. Analyzing the ambiguous relationship between efficiency, quality and patient satisfaction in healthcare services: the case of public hospitals in Turkey. Health Policy. (2013) 111:290–300 doi: 10.1016/j.healthpol.2013.05.010
71. Yan C, Liao H, Ma Y, Wang J. The impact of health care reform since 2009 on the efficiency of primary health services: a provincial panel data study in China. Front Public Health. (2021) 9:735654. doi: 10.3389/fpubh.2021.735654
72. van Noort O, Schotanus F, van de Klundert J, Telgen J. Explaining regional variation in home care use by demand and supply variables. Health Policy. (2018) 122:140–6 doi: 10.1016/j.healthpol.2017.05.003
73. Kreng VB, Yang C. The equality of resource allocation in health care under the National Health Insurance System in Taiwan. Health Policy. (2011) 100:203–10 doi: 10.1016/j.healthpol.2010.08.003
74. Thorsen ML, Thorsen A, McGarvey R. Operational efficiency, patient composition and regional context of U.S. health centers: associations with access to early prenatal care and low birth weight. Soc Sci Med. (2019) 226:143–52 doi: 10.1016/j.socscimed.2019.02.043
75. Wang X, Yang H, Duan Z, Pan J. Spatial accessibility of primary health care in China: a case study in Sichuan Province. Soc Sci Med. (2018) 209:14–24. doi: 10.1016/j.socscimed.2018.05.023
76. Halkoskos GE, Tzeremes NG. A conditional nonparametric analysis for measuring the efficiency of regional public healthcare delivery: an application to Greek prefectures. Health Policy. (2011) 103:73–82 doi: 10.1016/j.healthpol.2010.10.021
77. van Gool K, Mu C, Hall J. Does more investment in primary care improve health system performance? Health Policy. (2021) 125:717–24 doi: 10.1016/j.healthpol.2021.03.004
78. Audibert M, Mathonnat J, Pelissier A, Huang XX, Ma A. Health insurance reform and efficiency of township hospitals in rural China: An analysis from survey data. China Econ Rev. (2013) 27:326–38. doi: 10.1016/j.chieco.2013.01.004
79. Sarabi Asiabar A, Sharifi T, Rezapour A, Khatami Firouzabadi SMA, Haghighat-Fard P, Mohammad-Pour S. Technical efficiency and its affecting factors in Tehran's public hospitals: DEA approach and Tobit regression. Med J Islam Repub Iran. (2020) 34:176. doi: 10.47176/mjiri.34.176
80. Kirigia JM, Asbu EZ. Technical and scale efficiency of public community hospitals in Eritrea: an exploratory study. Health Econ Rev. (2013) 3:6. doi: 10.1186/2191-1991-3-6
81. Ayiko R, Mujasi PN, Abaliwano J, Turyareeba D, Enyaku R, Anguyo R, et al. Levels, trends and determinants of technical efficiency of general hospitals in Uganda: data envelopment analysis and Tobit regression analysis. BMC Health Serv Res. (2020) 20:916. doi: 10.1186/s12913-020-05746-w
82. Kakemam E, Dargahi H. The Health sector evolution plan and the technical efficiency of public hospitals in Iran. Iran J Public Health. (2019) 48:1681–9.
83. Jing R, Xu T, Lai X, Mahmoudi E, Fang H. Technical efficiency of public and private hospitals in Beijing, China: a comparative study. Int J Env Res Pub Health. (2019) 17:10082. doi: 10.3390/ijerph17010082
84. Ferreira DC, Marques RC. Do quality and access to hospital services impact on their technical efficiency? Omega. (2019) 86:218–36. doi: 10.1016/j.omega.2018.07.010
85. Chen A, Hwang Y, Shao B. Measurement and sources of overall and input inefficiencies: Evidences and implications in hospital services. Eur J Oper Res. (2005) 161:447–68 doi: 10.1016/j.ejor.2003.09.017
86. Top M, Konca M, Sapaz B. Technical efficiency of healthcare systems in African countries: An application based on data envelopment analysis. Health Policy Techn. (2020) 9:62–8 doi: 10.1016/j.hlpt.2019.11.010
87. Hsu Y. The efficiency of government spending on health: evidence from Europe and Central Asia. Soc Sci J. (2013) 50:665–73. doi: 10.1016/j.soscij.2013.09.005
88. Chowdhury H, Zelenyuk V. Performance of hospital services in Ontario: DEA with truncated regression approach. Omega. (2016) 63:111–22. doi: 10.1016/j.omega.2015.10.007
89. Jiang S, Min R, Fang P. The impact of healthcare reform on the efficiency of public county hospitals in China. BMC Health Serv Res. (2017) 17:2780. doi: 10.1186/s12913-017-2780-4
90. Gao J, Liu J, Tian M, Chen J, Zhang L. Evaluation on input-output efficiency of grassroots medical and health institutions in China Based on Bootstrap-Malmquist Index Model. Med Soc. (2021) 34:59–63. doi: 10.13723/j.yxysh.2021.11.012
91. Liu S, Lin J, He Y, Xu J. The service capability of primary health institutions under the hierarchical medical system. Healthcare. (2022) 10:335. doi: 10.3390/healthcare10020335
92. Ni Luasa S, Dineen D, Zieba M. Technical and scale efficiency in public and private Irish nursing homes - a bootstrap DEA approach. Health Care Manag Sc. (2018) 21:326–47. doi: 10.1007/s10729-016-9389-8
93. Ma X, Liu Y, Wei X, Li Y, Zheng M, Li Y, et al. Measurement and decomposition of energy efficiency of Northeast China—based on super efficiency DEA model and Malmquist index. Environ Sci Pollut R. (2017) 24:19859–73. doi: 10.1007/s11356-017-9441-3
94. Jya B, wz C. The trade-offs between efficiency and quality in the hospital production: Some evidence from Shenzhen, China. China Econ Rev. (2014) 31:166–84. doi: 10.1016/j.chieco.2014.09.005
95. Chai P, Zhang Y, Zhou M, Liu S, Kinfu Y. Health system productivity in China: a comparison of pre- and post-2009 healthcare reform. Health Policy Plan. (2020) 35:257–66. doi: 10.1093/heapol/czz157
96. Sun X, Luo S, Lou L, Cheng H, Ye Z, Jia J, et al. Health seeking behavior and associated factors among individuals with cough in Yiwu, China: a population-based study. BMC Public Health. (2021) 21:11250. doi: 10.1186/s12889-021-11250-5
97. Zhao N. The impact of China's new-type urbanization on individual sustainable development: a comparison between coastal and inland areas. Mar Policy. (2022) 136:104938. doi: 10.1016/j.marpol.2021.104938
98. Li X, Krumholz HM, Yip W, Cheng KK, De Maeseneer J, Meng Q, et al. Quality of primary health care in China: challenges and recommendations. Lancet. (2020) 395:1802–12. doi: 10.1016/S0140-6736(20)30122-7
99. Liu X, Hou Z, Towne SD, He M, Tan A, Jiang D, et al. Knowledge, attitudes, and practices related to the establishment of the National Hierarchical Medical System (NHMS) among outpatients in Chinese tertiary hospitals. Medicine. (2018) 97:e11836. doi: 10.1097/MD.0000000000011836
100. Deng Z, Jiang N, Song S, Pang R. Misallocation and price distortions: a revenue decomposition of medical service providers in China. China Econ Rev. (2021) 65:101574. doi: 10.1016/j.chieco.2020.101574
101. Li P, Luo Y, Yu X, Mason E, Zeng Z, Wen J, et al. Readiness of healthcare providers for e-hospitals: a cross-sectional analysis in China before the COVID-19 period. BMJ Open. (2022) 12:e54169. doi: 10.1136/bmjopen-2021-054169
102. Hsieh C, Tang C. The multi-tiered medical education system and its influence on the health care market—China's Flexner Report. Hum Resour Health. (2019) 17:382. doi: 10.1186/s12960-019-0382-4
103. Yi M, Peng J, Zhang L, Zhang Y. Is the allocation of medical and health resources effective? Characteristic facts from regional heterogeneity in China. Int J Equity Health. (2020) 19:1201. doi: 10.1186/s12939-020-01201-8
104. Sun SW. H Zhao, H Yu. Does descending resources reform improve patient satisfaction and reshape choice of care providers? a cross-sectional study in Zhejiang, China. Inquiry. (2020) 57:1402841161. doi: 10.1177/0046958020956899
105. Chen Z, Zhou L, Lv H, Sun K, Guo H, Hu J, et al. Effect of healthcare system reforms on job satisfaction among village clinic doctors in China. Hum Resour Health. (2021) 19:508. doi: 10.1186/s12960-021-00650-8
106. Song K, Scott A, Sivey P, Meng Q. Improving Chinese primary care providers' recruitment and retention: a discrete choice experiment. Health Policy Plann. (2015) 30:68–77. doi: 10.1093/heapol/czt098
107. Jia H, Cao P, Yu J, Zhang J, Jiang H, Zhao Q, et al. A new perspective for improving the human resource development of primary medical and health care institutions: a structural equation model study. Int J Env Res Pub Health. (2021) 18:52456. doi: 10.3390/ijerph18052560
Keywords: hierarchical medical system, efficiency, total factor productivity, influencing factors, China
Citation: Hou Y, Tao W, Hou S and Li W (2022) Levels, trends, and determinants of effectiveness on the hierarchical medical system in China: Data envelopment analysis and bootstrapping truncated regression analysis. Front. Public Health 10:921303. doi: 10.3389/fpubh.2022.921303
Received: 15 April 2022; Accepted: 19 August 2022;
Published: 20 September 2022.
Edited by:
Bai-Chen Xie, Tianjin University, ChinaReviewed by:
Qaiser Farooq Dar, Incheon National University, South KoreaPeter Wanke, Federal University of Rio de Janeiro, Brazil
Copyright © 2022 Hou, Tao, Hou and Li. This is an open-access article distributed under the terms of the Creative Commons Attribution License (CC BY). The use, distribution or reproduction in other forums is permitted, provided the original author(s) and the copyright owner(s) are credited and that the original publication in this journal is cited, in accordance with accepted academic practice. No use, distribution or reproduction is permitted which does not comply with these terms.
*Correspondence: Weimin Li, d2VpbWkwMDNAc2N1LmVkdS5jbg==