
94% of researchers rate our articles as excellent or good
Learn more about the work of our research integrity team to safeguard the quality of each article we publish.
Find out more
ORIGINAL RESEARCH article
Front. Public Health, 11 August 2022
Sec. Infectious Diseases – Surveillance, Prevention and Treatment
Volume 10 - 2022 | https://doi.org/10.3389/fpubh.2022.903025
This article is part of the Research TopicEpidemiological Trends of Emerging and Reemerging Infectious Diseases in Recent Times and Pathogens Genomic EvolutionView all 5 articles
 Yanxiang Cao1,2
 Meijia Li3Naem Haihambo3
 Yuyao Zhu4Yimeng Zeng5Jianhua Jin6
 Jinyi Qiu7Zhirui Li8Jiaxin Liu9Jiayi Teng10Sixiao Li11
 Yanan Zhao12
 Xixi Zhao1,2Xuemei Wang1,2Yaqiong Li1,2
 Xiaoyang Feng13
 Chuanliang Han14*
Background: Epidemics of infectious diseases have a great negative impact on people's daily life. How it changes over time and what kind of laws it obeys are important questions that researchers are always interested in. Among the characteristics of infectious diseases, the phenomenon of recrudescence is undoubtedly of great concern. Understanding the mechanisms of the outbreak cycle of infectious diseases could be conducive for public health policies to the government.
Method: In this study, we collected time-series data for nine class C notifiable infectious diseases from 2009 to 2021 using public datasets from the National Health Commission of China. Oscillatory power of each infectious disease was captured using the method of the power spectrum analysis.
Results: We found that all the nine class C diseases have strong oscillations, which could be divided into three categories according to their oscillatory frequencies each year. Then, we calculated the oscillation power and the average number of infected cases of all nine diseases in the first 6 years (2009–2015) and the next 6 years (2015–2021) since the update of the surveillance system. The change of oscillation power is positively correlated to the change in the number of infected cases. Moreover, the diseases that break out in summer are more selective than those in winter.
Conclusion: Our results enable us to better understand the oscillation characteristics of class C infectious diseases and provide guidance and suggestions for the government's prevention and control policies.
The epidemic of infectious diseases has a significant impact on all aspects of people's lives, such as people's daily activities (1, 2), education (3–6), diet (1, 7), mental health (8–13), and even countries' economies and development (14, 15). Three types of infectious diseases (class A, B, and C) were defined by the Chinese government using the country's infectious disease surveillance system after the epidemic of Severe Acute Respiratory Syndrome (SARS) in 2003 (16). The large-scale epidemic in China is mainly caused by class B and class C infectious diseases, since the rate of infection of class A notifiable diseases such as the plague and cholera has been controlled at a very low level in China. Besides, the mechanisms of the class B disease epidemic have been well systematically studied in both temporal and (17, 18) and spatial scales (19). However, although it is more likely for ordinary people to be infected with class C infectious diseases (such as influenza), very few studies tried to systematically understand the class C infectious diseases together in the mainland of China (20), especially from the oscillatory perspective.
Recrudescence of infectious disease causes the oscillatory phenomenon of epidemics (21). This periodic recurrence has been a common feature (22–24) of infectious diseases around the world (25–34). Currently, the oscillatory properties of infectious diseases are thought to be driven by two main factors: natural and human factors. The natural factors include the seasonal temperature (21, 35), rainfall (21, 36) and natural disasters (37), and the human factors include the school terms (38, 39), economic migration (40, 41), vaccination coverage (42), habitat disruption (43), or some other government epidemic prevention policies (21, 44). Understanding the oscillatory properties of the infectious disease could provide essential information for the forecast and avoid economic loss and harm to the people's health (8, 45–47).
Therefore, in the present study, we aimed to fill the gap of insufficient studies in the oscillatory property of class C diseases. To be more specific, we attempted to categorize the diseases based on their oscillatory frequencies; then, we investigated the relationship between the oscillation strength and the number of infected cases; based on this, we narrowed the time scale to 1 year and inspected the seasonal selectivity. We collected time-series data for the monthly reported confirmed cases of nine class C notifiable infectious diseases from 2009 to 2021 and calculated their power spectrums by multi-taper methods. We also calculated the oscillation power and the average number of infected cases of all nine diseases in the first 6 years (2009–2015) and the next 6 years (2015–2021) and their correlation. In addition, we conducted the correlation analysis between the preferred month and the selectivity of the infectious diseases.
Available time-series data for the monthly reported and confirmed cases of nine class C notifiable infectious diseases in China's mainland, from June 2009 to September 2021, was obtained from the National Health Commission of China (http://www.nhc.gov.cn/). The monthly dataset is open to the public, reported by the Chinese Center for Disease Control and Prevention (CDC) (See Supplementary materials). These diseases are Flu (Influenza), Mumps, Rubella (German measles), Acute hemorrhagic conjunctivitis (Apollo disease), Leprosy (Hansen's disease), Scrub Typhus (Bush typhus), Leishmaniasis (Black fever, or Kala-Azar), Echinococcosis (Hydatid disease), and Hand, foot, and mouth disease (Table 1). The data sampling rate is number of cases per month (12 time points per year) by the monthly report of the National Health Commission of China.

Table 1. Summary of the main finding in nine class C infectious diseases in mainland China.
The spectrum analysis was used to better quantify the oscillatory property of each infectious disease. Similar methods have been used in classic and modern studies in the field of infectious diseases (23, 25, 27, 48, 49). Spectrum analysis is a technique for decomposing complex signals into simpler signals based on the Fourier transform. Most biological signals could be expressed as the summation of the various simple signals of different frequencies and produce information of a signal at different frequencies (such as amplitude, power, intensity, or phase, etc.) (50–53).
The power spectral density (PSD) for each infectious disease during these 12 years was computed using the multi-taper method using the Chronux toolbox (54) [an open-source, data analysis toolbox (Chronux) available at http://chronux.org]. The multi-taper method attempts to reduce the variance of spectral estimates by pre-multiplying the data with several orthogonal tapers, yield a more reliable ensemble estimate of noisy data. Power spectra of the time-series data of infected cases of each disease was calculated from 2009 to 2021 (Figure 1 graphs on the bottom), which has been used in the earlier work of our lab (2, 17).
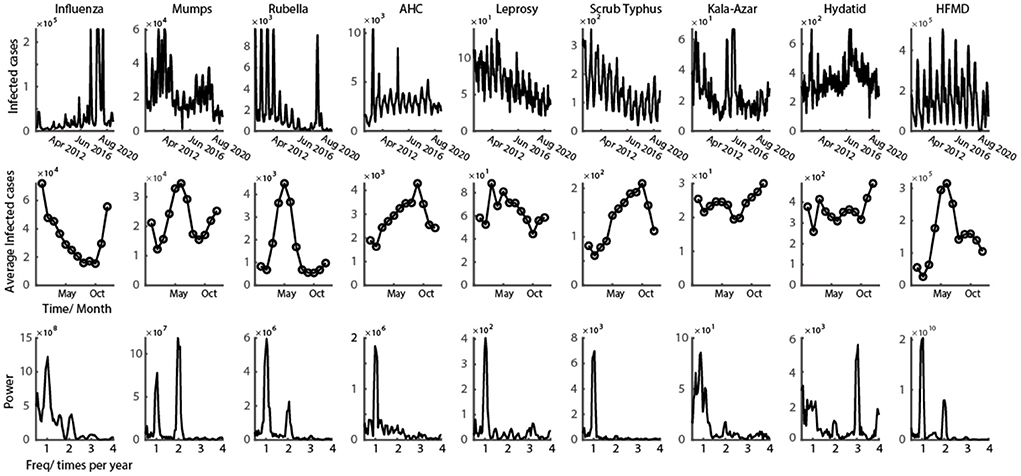
Figure 1. Representative class C infectious disease with clear oscillation pattern. First row shows the time series of monthly infected cases from 2009 to 2021 for nine class C infectious diseases. Second row shows the average number of infected cases every month in a year. Third row illustrates the power spectrum calculated from the data of first row (data in the figure could be found in Supplementary materials).
We used two oscillatory features to classify the different clusters of infectious diseases: the power ratio (Ratio 1) between once a year and twice a year, and the power ratio (Ratio 2) between once a year and three times a year. The definition of power ratio is the ratio between the powers corresponding to two different frequencies (times per year). We then set two linear thresholds (Ratio 1 = 1; Ratio 2 = 1) that precisely separated them into three clusters.
The tuning curve was computed by taking the monthly average number of infected cases- during all 12 years, which is under the assumption that all infectious diseases included in this study have a similar trend each year.
Two indices were defined to better capture the property of oscillations for infectious diseases in a year: preferred month and infection selectivity. The preferred month is defined as the month in a year that has the most cases of infections. The infection selectivity index is defined as 1 minus the ratio of the minimum and the maximum number of infected cases in a year. If the selectivity index is closer to 1, then the shape of the tuning curve is sharper, and vice versa.
We used the Pearson correlation to measure the relationship between the change in infected cases and the change in oscillation power of the infectious diseases on all nine infectious diseases. The Pearson correlation was also used in the correlation analysis between the selectivity index and the preferred month.
The oscillatory patterns in infectious diseases' time series in mainland China is clear over the past 12 years (Figure 1, graphs on the top). According to the 12-year historical data of class C infectious diseases, six out of nine diseases showed a diseasing trend of the infectious number of people, and three of them still increased (Table 1). From the view of the change of the infection oscillation, seven out of nine diseases showed a diseasing trend (Table 1). The sampling rate of the data for each disease is 12 data points per year, with one data point representing 1 month.
The time-series data of nine class C infectious diseases were shown in the first row of Figure 1. It is obvious that the epidemic of all nine diseases shows a strong oscillatory phenomenon. To better interpret the periodic properties throughout a year, the average of all 12 years' data was calculated (number of infected cases are represented in the second row of Figure 2). From the infection tuning curve of each disease, they have different preferred months to outbreak. Different infectious diseases also have different numbers of outbreak peaks during 1 year, which suggests the frequency of the outbreak of an epidemic disease in a year. We then calculated the power spectrum of the nine diseases using 12 years' time series data. Each infectious disease in this study has a tuning curve, and the oscillatory pattern within a year is clear. As predicted by the tuning curve (second row of Figure 1), multiple frequency peaks were shown in the spectrum.
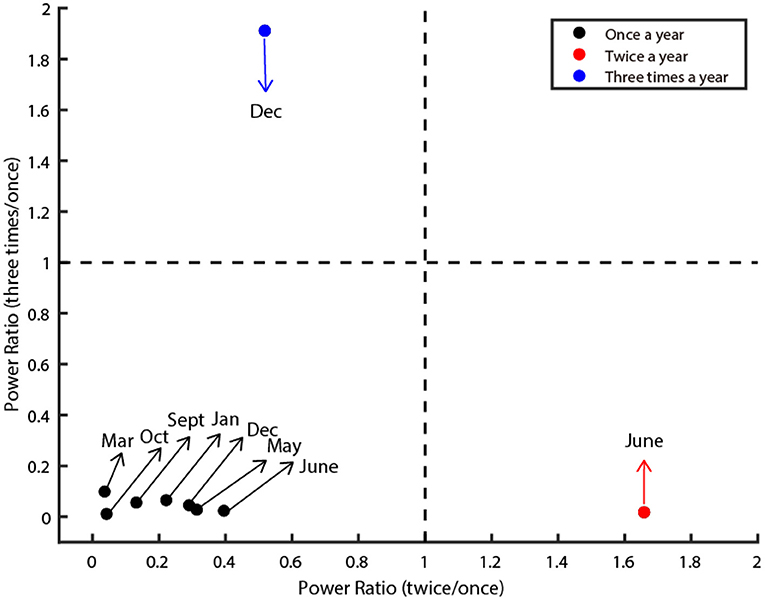
Figure 2. Three oscillatory types of class C infectious diseases. The figure illustrates three clusters (denoted by red, black, and blue dots). The X-axis denotes the power ratio of occurrence between twice a year and once a year. The Y-axis denotes the power ratio of occurrence between three times a year and once a year. The dashed line is the criteria that separates them. The dots in the lower left depict diseases classified as Type I. The dots in the lower right corner depict diseases classified as Type II. The dots in the upper left corner are classified as Type III. The preferred month of each disease was marked by the arrow.
Next, we quantified the oscillatory properties of different diseases, and found they could be classified as three distinct clusters, which are illustrated in Figure 2. The horizontal axis of this panel denotes the power ratio between twice a year and once a year, and the vertical axis denotes the power ratio between three times a year and once a year. The larger the value of the horizontal axis is, the more probable the oscillation is twice a year. The larger the value of the vertical axis is, the more probable the oscillation is three times a year. Then we set two thresholds that precisely separated them into three clusters (dashed line in Figure 2). In total, seven out of nine diseases belong to Type I (Influenza, Rubella, AHC, Leprosy, Scrub Typhus, Kala-Azar, and HFMD), one out of nine diseases belong to Type II (Mumps), the remaining one disease (Hydatid) belongs to Type III (Figure 2).
Next, we split the 12-year dataset into two parts: the first 6 years (2009–2015) and the last 6 years (2015–2021). In these 12 years, the number of infected cases of six (Mumps, Rubella, Leprosy, Scrub Typhus, Leishmaniasis, HFMD) out of nine infectious diseases decreased over time (Figure 3A for a typical example), and others (Flu, AHC, and Echinococcosis) remained unchanged or increased (Figure 3A for a typical example of the unchanged case). This information is summarized in the 5th column of Table 1.
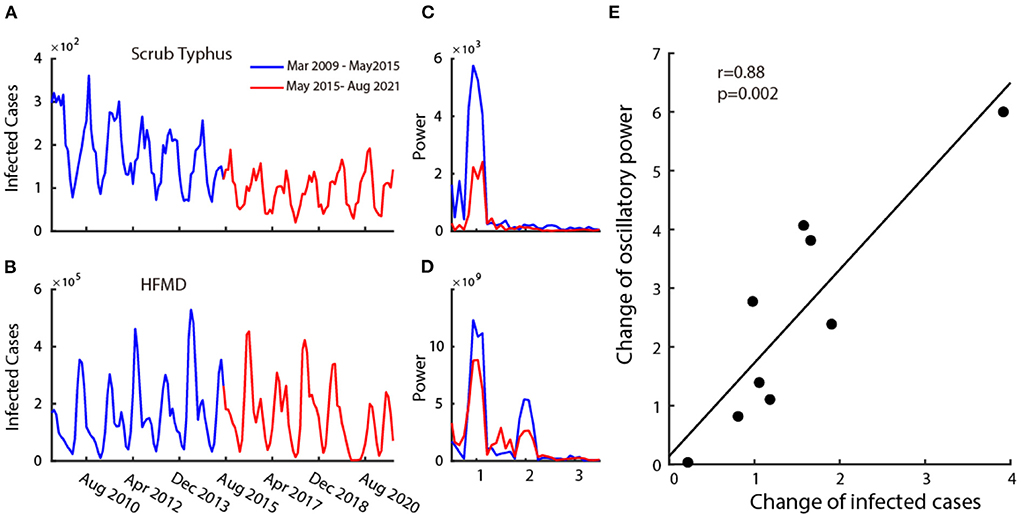
Figure 3. Relationship between the infection and its oscillatory strength. Plot (A,B) are two examples of disease's time series monthly infected cases from 2009 to 2021. The blue curve shows the time series of the first 6 years (2009–2015) and the red curve shows the time series of the last 6 years (2015–2021). Plot (C,D) show the power spectrum calculated in the first 6 years (blue curve) and the last 6 years (red curve) corresponding to the time-series data of (A,B). Plot (E) shows the scatter plot of change in mean infected cases and change in oscillatory power.
We then explored the relationship between the change in the number of infected cases and the corresponding strength of oscillatory power. To this end, we calculated the power spectrums in two time periods (2009–2015 and 2015–2021) for all nine infectious diseases. The change in the number of infected cases is defined as the ratio of the mean infected cases each month between 2009 and 2015 (Figures 3A,B, blue curve) and 2015–2021 (Figures 3A,B, red curve), and the change in the oscillatory power is defined as the ratio of the average power spectrum between 2009 and 2015 (Figures 3C,D blue curve) and 2015–2021 (Figures 3C,D red curve). We then performed a correlation analysis between the change in infected cases and the change in oscillation power of the infectious diseases on all nine class C infectious diseases. We found that there is a strong positive correlation (Figure 3E) (r = 0.88, p = 0.002, Pearson correlation). This illustrates that the increase in oscillation strength often accompanies the increase in the number of infected cases.
In this study, we systematically explored the oscillatory properties of the nine class C infectious disease in the mainland of China. All the nine class C diseases were found to have strong oscillations, which could be divided into three categories according to their oscillatory frequencies each year. We also found a strong positive correlation between the change of oscillation power and the change in the number of infected cases.
To our knowledge, this is the first work to directly investigate the oscillatory properties of the nine class C infectious diseases together in mainland China. Previous studies mostly targeted one specific disease [Influenza (55), Mumps (56–60), Rubella (61–63), AHC (64–68), Leprosy (69–72), Typhus (73–76), Leishmaniasis (77, 78), Hydatid disease (79–81), HFMD (82–86)], more in a statistical description sense on the numbers, ratios, or dissecting multiple components to fit the data. These studies seldom investigated these diseases directly from the oscillatory view, but we focused more on the ubiquitous oscillatory property of these class C diseases together to find some common laws as a whole. The prior work on the oscillatory property of the class B diseases (17) has shown that the oscillatory phenomenon is widely found. Similar to the results in this work, we also found that the oscillation is universal in class C infectious diseases.
Another issue is the classification of the class C infectious diseases. Generally, people distinguish them by the transmission mode (through respiratory tract, digestive tract, blood sucking insects, and contact transmission). It is noticeable that we proposed a new method to make the clusters through the oscillatory frequency of each infectious disease. Clearly, we found that three clusters were dependent on their outbreak frequencies in a year, which is also consistent with the results in the class B diseases (17). This new classification method could help us better understand the epidemical features on their periodic properties. We also found that most of the diseases (including both class B and C diseases) belong to the first type, which means it outbreak once a year, and the proportion of Type II and III diseases is relatively smaller. The specific mechanism to illustrate their significant difference should be a question that to be answered in the future work.
The tuning curves of the infectious diseases were always shown up in previous research (20, 28, 30), but the relationship between the infection selectivity and the preferred outbreak month of the infectious diseases were seldom analyzed. The higher selectivity of the disease means that it only outbreak in some specific month but rarely outbreak at other times.
Majority of the class C diseases showed a diseasing trend of the infectious number of people and change of the infection oscillation (Table 1). Combining the results of the change of infection and its oscillation, we could draw conclusions that the infection number is always accompanied by its oscillatory strength for the class C diseases (class B diseases also obeyed with this law), which is consistent with the hybrid model (17). Besides, the oscillatory properties (frequency, preferred month) of a disease remains similar, hence the cluster would be stable using the current method.
Our results precisely describe the oscillatory properties of class C infectious diseases in China, which might help us better understand their fluctuation characteristics, and provide guidance and suggestions for government prevention and control policies. From the oscillatory view to recheck the information related to the infectious diseases helps us better understand the time and extent of their outbreak. In the future, the number of people infected with all infectious diseases might not decrease to zero, but the ultimate goal of prevention is to minimize as much as possible the losses caused by the infectious diseases.
The original contributions presented in the study are included in the article/Supplementary materials, further inquiries can be directed to the corresponding author.
CH, YC, and ML conceived and designed the study. CH, ML, NH, YZe, JJ, and ZL contributed to the literature search. CH, JL, JT, SL, YZhu, YZha, XZ, XW, and YL contributed to data collection. CH, YC, XF, and JQ contributed to the data analysis and the interpretation of results. All authors contributed to writing the paper.
This work was funded by the Beijing Municipal Hospital Clinical Technology Innovation and Research Plan (XMLX201805), Beijing Municipal Hospital Research and Development Project (PX2021068), Advanced Innovation Center for Human Brain Protection Project (3500-12020137), and Beijing An Ding Hospital, Capital Medical University (YG2021-06).
We acknowledge National Health Commission of China for public dataset on cases of nine class C infectious diseases.
The authors declare that the research was conducted in the absence of any commercial or financial relationships that could be construed as a potential conflict of interest.
All claims expressed in this article are solely those of the authors and do not necessarily represent those of their affiliated organizations, or those of the publisher, the editors and the reviewers. Any product that may be evaluated in this article, or claim that may be made by its manufacturer, is not guaranteed or endorsed by the publisher.
The Supplementary Material for this article can be found online at: https://www.frontiersin.org/articles/10.3389/fpubh.2022.903025/full#supplementary-material
1. Di Renzo L, Gualtieri P, Pivari F, Soldati L, Attinà A, Cinelli G, et al. Eating habits and lifestyle changes during COVID-19 lockdown: an Italian survey. J Transl Med. (2020) 18:1–15. doi: 10.1186/s12967-020-02399-5
2. Zhao X, Li M, Haihambo N, Jin J, Zeng Y, Qiu J, et al. Changes in temporal properties for epidemics of notifiable infectious diseases in China during the COVID-19 epidemic: population-based surveillance study. JMIR Public Heal Surveill. (2022) 8:1–12. doi: 10.2196/35343
3. Daniel SJ. Education and the COVID-19 pandemic. Prospects. (2020) 49:91–6. doi: 10.1007/s11125-020-09464-3
4. Ahmed H, Allaf M, Elghazaly H. COVID-19 and medical education. Lancet Infect Dis. (2020) 20:e79. doi: 10.1016/S1473-3099(20)30226-7
5. Rose S. Medical student education in the time of COVID-19. JAMA. (2020) 323:2131–2. doi: 10.1001/jama.2020.5227
6. Wang M, Han X, Fang H, Xu C, Lin X, Xia S, et al. Impact of health education on knowledge and behaviors toward infectious diseases among students in Gansu province, China. Biomed Res Int. (2018) 2018:6397340. doi: 10.1155/2018/6397340
7. Butler MJ, Barrientos RM. The impact of nutrition on COVID-19 susceptibility and long-term consequences. Brain Behav Immun. (2020) 87:53–4. doi: 10.1016/j.bbi.2020.04.040
8. Torales J, O'Higgins M, Castaldelli-Maia JM, Ventriglio A. The outbreak of COVID-19 coronavirus and its impact on global mental health. Int J Soc Psychiatry. (2020) 66:317–20. doi: 10.1177/0020764020915212
9. Pfefferbaum B, North CS. Mental health and the COVID-19 pandemic. N Engl J Med. (2020) 383:510–2. doi: 10.1056/NEJMp2008017
10. World Health Organization. Mental Health and Psychosocial Considerations During COVID-19 Outbreak. World Health Organization (2020). Available online at: https://www.who.int/publications/i/item/WHO-2019-nCoV-MentalHealth-2020.1
11. Rajkumar RP. COVID-19 and mental health: a review of the existing literature. Asian J Psychiatr. (2020) 383:510–2. doi: 10.1016/j.ajp.2020.102066
12. Holmes EA, O'Connor RC, Perry VH, Tracey I, Wessely S, Arseneault L, et al. Multidisciplinary research priorities for the COVID-19 pandemic: a call for action for mental health science. Lancet Psychiatry. (2020) 7:547–60. doi: 10.1016/S2215-0366(20)30168-1
13. Müller N. Infectious diseases and mental health. Key Issues Ment Heal. (2015). doi: 10.1159/000365542
14. Fernandes N. Economic effects of Coronavirus outbreak (COVID-19) on the world economy. SSRN Electron J. (2020). doi: 10.2139/ssrn.3557504
15. Smith RD. Responding to global infectious disease outbreaks: lessons from SARS on the role of risk perception, communication and management. Soc Sci Med. (2006) 63:3113–23. doi: 10.1016/j.socscimed.2006.08.004
16. Wang L-D, Wang Y, Yang G-H, Ma J-Q, Wang L-P, Qi X-P. China information system for disease control and prevention (CISDCP). Natl Bur Asian Res Cent Heal Aging. (2008). Available online at: https://www.nbr.org/wp-content/uploads/pdfs/programs/CISDCP.pdf
17. Han C, Li M, Haihambo N, Cao Y, Zhao X. Enlightenment on oscillatory properties of 23 class B notifiable infectious diseases in the mainland of China from 2004 to 2020. PLoS ONE. (2021) 16:e0252803. doi: 10.1371/journal.pone.0252803
18. Zhang X, Hou F, Li X, Zhou L, Liu Y, Zhang T. Study of surveillance data for class B notifiable disease in China from 2005 to 2014. Int J Infect Dis. (2016) 48:7–13. doi: 10.1016/j.ijid.2016.04.010
19. Zhu B, Fu Y, Liu J, Mao Y. Spatial distribution of 12 class B notifiable infectious diseases in China: a retrospective study. PLoS ONE. (2018) 13:e0195568. doi: 10.1371/journal.pone.0195568
20. Zhang X, Hou F, Qiao Z, Li X, Zhou L, Liu Y, et al. Temporal and long-term trend analysis of class C notifiable diseases in China from 2009 to 2014. BMJ Open. (2016) 6:1–10. doi: 10.1136/bmjopen-2016-011038
21. Han C, Li M, Haihambo N, Babuna P. Mechanisms of recurrent outbreak of COVID-19 : a model- based study. Nonlinear Dyn. (2021) 106:1169–85. doi: 10.1007/s11071-021-06371-w
22. Gunning CE, Ferrari MJ, Erhardt EB, Wearing HJ. Evidence of cryptic incidence in childhood diseases. Proc R Soc B Biol Sci. (2017) 284:20171268. doi: 10.1098/rspb.2017.1268
23. Anderson RM, Grenfell BT, May RM. Oscillatory fluctuations in the incidence of infectious disease and the impact of vaccination: time series analysis. J Hyg. (1984) 93:587–608. doi: 10.1017/S0022172400065177
24. Bhattacharyya S, Ferrari MJ, Bjørnstad ON. Species interactions may help explain the erratic periodicity of whooping cough dynamics. Epidemics. (2018) 23:64–70. doi: 10.1016/j.epidem.2017.12.005
25. Sumi A, Kamo KI, Ohtomo N, Kobayashi N. Study of the effect of vaccination on periodic structures of measles epidemics in Japan. Microbiol Immunol. (2007) 51:805–14. doi: 10.1111/j.1348-0421.2007.tb03976.x
26. Fine PEM, Clarkson JA. Seasonal influences on pertussis. Int J Epidemiol. (1986) 15:237–47. doi: 10.1093/ije/15.2.237
27. Broutin H, Guégan JF, Elguero E, Simondon F, Cazelles B. Large-scale comparative analysis of pertussis population dynamics: periodicity, synchrony, and impact of vaccination. Am J Epidemiol. (2005) 161:1159–67. doi: 10.1093/aje/kwi141
28. De Greeff SC, Dekkers ALM, Teunis P, Rahamat-Langendoen JC, Mooi FR, De Melker HE. Seasonal patterns in time series of pertussis. Epidemiol Infect. (2009) 137:1388–95. doi: 10.1017/S0950268809002489
29. Wearing HJ, Rohani P. Estimating the duration of pertussis immunity using epidemiological signatures. PLoS Pathog. (2009) 5:e1000647. doi: 10.1371/journal.ppat.1000647
30. Hitz DA, Tewald F, Eggers M. Seasonal Bordetella pertussis pattern in the period from 2008 to 2018 in Germany. BMC Infect Dis. (2020) 20:1–6. doi: 10.1186/s12879-020-05199-w
31. Luo T, Sumi A, Zhou D, Kamo K, Yu B, Zhao D, et al. Study on the effect of measles control programmes on periodic structures of disease epidemics in a large Chinese city. Epidemiol Infect. (2011) 139:257–64. doi: 10.1017/S0950268810001056
32. Ma C, Hao X, Deng H, Wu R, Liu J, Yang Y, et al. Re-emerging of rabies in Shaanxi province, China, from 2009 to 2015. J Med Virol. (2017) 89:1511–9. doi: 10.1002/jmv.24769
33. Zhang Y, Vrancken B, Feng Y, Dellicour S, Yang Q, Yang W, et al. Cross-border spread, lineage displacement and evolutionary rate estimation of rabies virus in Yunnan province, China. Virol J. (2017) 14:1–8. doi: 10.1186/s12985-017-0769-6
34. Tian H, Feng Y, Vrancken B, Cazelles B, Tan H, Gill MS, et al. Transmission dynamics of re-emerging rabies in domestic dogs of rural China. PLoS Pathog. (2018) 14:e1007392. doi: 10.1371/journal.ppat.1007392
35. Babuna P, Han C, Li M, Gyilbag A, Dehui B, Awudi D, et al. The effect of Human Settlement temperature and humidity on the growth rules of infected and recovered cases of COVID-19. Environ Res. (2021) 197:111106. doi: 10.1016/j.envres.2021.111106
36. Tian H, Yu P, Cazelles B, Xu L, Tan H, Yang J, et al. Interannual cycles of Hantaan virus outbreaks at the human-animal interface in Central China are controlled by temperature and rainfall. Proc Natl Acad Sci USA. (2017) 114:8041–6. doi: 10.1073/pnas.1701777114
37. Suk JE, Vaughan EC, Cook RG, Semenza JC. Natural disasters and infectious disease in Europe: a literature review to identify cascading risk pathways. Eur J Public Health. (2020) 30:928–35. doi: 10.1093/eurpub/ckz111
38. London WP, Yorke JA. Recurrent outbreaks of measles, chickenpox and mumps: I. Seasonal variation in contact rates. Am J Epidemiol. (1973) 98:469–82. doi: 10.1093/oxfordjournals.aje.a121575
39. Fine PEM, Clarkson JA. Measles in England and Wales - I: an analysis of factors underlying seasonal patterns. Int J Epidemiol. (1982) 11:5–14. doi: 10.1093/ije/11.1.5
40. Ferrari MJ, Grais RF, Bharti N, Conlan AJK, Bjørnstad ON, Wolfson LJ, et al. The dynamics of measles in sub-Saharan Africa. Nature. (2008) 451:679–84. doi: 10.1038/nature06509
41. Bharti N, Tatem AJ, Ferrari MJ, Grais RF, Djibo A, Grenfell BT. Explaining seasonal fluctuations of measles in Niger using nighttime lights imagery. Science. (2011) 334:1424–7. doi: 10.1126/science.1210554
42. Buonomo B, Della Marca R. Oscillations and hysteresis in an epidemic model with information-dependent imperfect vaccination. Math Comput Simul. (2019) 162:97–114. doi: 10.1016/j.matcom.2019.01.005
43. Rulli MC, Santini M, Hayman DTS, D'Odorico P. The nexus between forest fragmentation in Africa and Ebola virus disease outbreaks. Sci Rep. (2017) 7:1–8. doi: 10.1038/srep41613
44. Han C, Liu Y, Tang J, Zhu Y, Jaeger C, Yang S. Lessons from the Mainland of China's epidemic experience in the first phase about the growth rules of infected and recovered cases of COVID-19 worldwide. Int J Disaster Risk Sci. (2020) 11:497–507. doi: 10.1007/s13753-020-00294-7
45. Donthu N, Gustafsson A. Effects of COVID-19 on business and research. J Bus Res. (2020) 117:284–9. doi: 10.1016/j.jbusres.2020.06.008
46. Yu X, Qi G, Hu J. Analysis of second outbreak of COVID-19 after relaxation of control measures in India. Nonlinear Dyn. (2020) 106:1149–67. doi: 10.1007/s11071-020-05989-6
47. Gössling S, Scott D, Hall CM. Pandemics, tourism and global change: a rapid assessment of COVID-19. J Sustain Tour. (2020) 29:1–20. doi: 10.1080/09669582.2020.1758708
48. Greer M, Saha R, Gogliettino A, Yu C, Zollo-Venecek K. Emergence of oscillations in a simple epidemic model with demographic data. R Soc Open Sci. (2020) 7:191187. doi: 10.1098/rsos.191187
49. Pons-Salort M, Grassly NC. Serotype-specific immunity explains the incidence of diseases caused by human enteroviruses. Science. (2018) 361:800–3. doi: 10.1126/science.aat6777
50. Han C, Wang T, Wu Y, Li Y, Yang Y, Li L, et al. The generation and modulation of distinct gamma oscillations with local, horizontal, and feedback connections in the primary visual cortex: a model study on large-scale networks. Neural Plast. (2021) 2021:8874516. doi: 10.1155/2021/8874516
51. Han C, Wang T, Yang Y, Wu Y, Li Y, Dai W, et al. Multiple gamma rhythms carry distinct spatial frequency information in primary visual cortex. PLoS Biol. (2021) 19:e3001466. doi: 10.1371/journal.pbio.3001466
52. Han C, Guo M, Ke X, Zeng L, Li M, Haihambo N, et al. Oscillatory biomarkers of autism : evidence from the innate visual fear evoking paradigm. Cogn Neurodyn. (2022) 6. doi: 10.1007/s11571-022-09839-6
53. Han C, Zhao X, Li M, Haihambo N, Teng J, Li S, et al. Enhancement of the neural response during 40 Hz auditory entrainment in closed-eye state in human prefrontal region. Cogn Neurodyn. (2022) 0123456789. doi: 10.1007/s11571-022-09834-x
54. Percival DB, Walden AT. Spectral Analysis for Physical Applications. London: Cambridge University Press (1993).
55. Shu YL, Fang LQ, de Vlas SJ, Gao Y, Richardus JH, Cao WC. Dual seasonal patterns for influenza, China. Emerg Infect Dis. (2010) 16:725–6. doi: 10.3201/eid1604.091578
56. Qu Q, Fang C, Zhang L, Jia W, Weng J, Li Y. A mumps model with seasonality in China. Infect Dis Model. (2017) 2:1–11. doi: 10.1016/j.idm.2016.10.001
57. Lu J, Yang Z, Ma X, Ma M, Zhang Z. The role of meteorological factors on mumps incidence among children in Guangzhou, Southern China. PLoS ONE. (2020) 15:e0232273. doi: 10.1371/journal.pone.0232273
58. Cui A, Zhu Z, Hu Y, Deng X, Sun Z, Zhang Y, et al. Mumps epidemiology and mumps virus genotypes circulating in mainland China during 2013-2015. PLoS ONE. (2017) 12:e0169561. doi: 10.1371/journal.pone.0169561
59. Liu Y, Hu Y, Deng X, Wang Z, Lu P, Ma F, et al. Seroepidemiology of mumps in the general population of Jiangsu province, China after introduction of a one-dose measles-mumps-rubella vaccine. Sci Rep. (2015) 5:1–8. doi: 10.1038/srep14660
60. Li R, Cheng S, Luo C, Rutherford S, Cao J, Xu Q, et al. Epidemiological characteristics and spatial-temporal clusters of mumps in Shandong province, China, 2005-2014. Sci Rep. (2017) 7:1–10. doi: 10.1038/srep46328
61. Su Q, Ma C, Wen N, Fan C, Yang H, Wang H, et al. Epidemiological profile and progress toward rubella elimination in China. 10 years after nationwide introduction of rubella vaccine. Vaccine. (2018) 36:2079–85. doi: 10.1016/j.vaccine.2018.03.013
62. Wang C, Zhu Z, Xu Q, Xu A, Fang X, Song L, et al. Rubella epidemics and genotypic distribution of the rubella virus in Shandong province, China, in 1999-2010. PLoS ONE. (2012) 7:e42013. doi: 10.1371/journal.pone.0042013
63. Zhu Z, Abernathy E, Cui A, Zhang Y, Zhou S, Zhang Z, et al. Rubella virus genotypes in the People's Republic of China between 1979 and 2007: a shift in endemic viruses during the 2001 rubella epidemic. J Clin Microbiol. (2010) 48:1775–81. doi: 10.1128/JCM.02055-09
64. Yan D, Zhu S, Zhang Y, Zhang J, Zhou Y, Xu W. Outbreak of acute hemorrhagic conjunctivitis in Yunnan, People's Republic of China, 2007. Virol J. (2010) 7:138. doi: 10.1186/1743-422X-7-138
65. Zhang S, Hu Q, Deng Z, Hu S, Liu F, Yu S, et al. Transmissibility of acute haemorrhagic conjunctivitis in small-scale outbreaks in Hunan province, China. Sci Rep. (2020) 10:1–9. doi: 10.1038/s41598-019-56850-9
66. Liu H, Li C, Shao Y, Zhang X, Zhai Z, Wang X, et al. Forecast of the trend in incidence of acute hemorrhagic conjunctivitis in China from 2011–2019 using the Seasonal Autoregressive Integrated Moving Average (SARIMA) and Exponential Smoothing (ETS) models. J Infect Public Health. (2020) 13:287–94. doi: 10.1016/j.jiph.2019.12.008
67. Liu X, Qiu S, Liu Z, Chen D, Liu H, Ding G. Effects of floods on the incidence of acute hemorrhagic conjunctivitis in Mengshan, China, from 2005 to 2012. Am J Trop Med Hyg. (2020) 102:1263–8. doi: 10.4269/ajtmh.19-0164
68. Jing D, Zhao H, Ou R, Zhu H, Hu L, Giri M, et al. Epidemiological characteristics and spatiotemporal analysis of acute hemorrhagic conjunctivitis from 2004 to 2018 in Chongqing, China. Sci Rep. (2020) 10:1–8. doi: 10.1038/s41598-020-66467-y
69. Le W, Haiqin J, Danfeng H, Ying S, Wenyue Z, Jun Y, et al. Monitoring and detection of leprosy patients in Southwest China: a retrospective study, 2010–2014. Sci Rep. (2018) 8:2010–4. doi: 10.1038/s41598-018-29753-4
70. Lun ZR, Zhu XQ, Yang TB. Leprosy in China. Lancet Infect Dis. (2012) 12:11. doi: 10.1016/S1473-3099(11)70336-X
71. Shui TJ, Long H, Xiong L, Zhang XH, He J, Chen X. Towards the elimination of leprosy in Yunnan, China: a time-series analysis of surveillance data. PLoS Negl Trop Dis. (2021) 15:e0009201. doi: 10.1371/journal.pntd.0009201
72. Liu YY, Yu MW, Ning Y, Wang H. A study on gender differences in newly detected leprosy cases in Sichuan, China, 2000–2015. Int J Dermatol. (2018) 57:1492–9. doi: 10.1111/ijd.14148
73. Yu H, Sun C, Liu W, Li Z, Tan Z, Wang X, et al. Scrub typhus in Jiangsu province, China: epidemiologic features and spatial risk analysis. BMC Infect Dis. (2018) 18:1–10. doi: 10.1186/s12879-018-3271-x
74. Xin HL, Yu JX, Hu MG, Jiang FC, Li XJ, Wang LP, et al. Evaluation of scrub typhus diagnosis in China: analysis of nationwide surveillance data from 2006 to 2016. Infect Dis Poverty. (2019) 8:1–12. doi: 10.1186/s40249-019-0566-0
75. Yao H, Wang Y, Mi X, Sun Y, Liu K, Li X, et al. The scrub typhus in mainland China: spatiotemporal expansion and risk prediction underpinned by complex factors. Emerg Microbes Infect. (2019) 8:909–19. doi: 10.1080/22221751.2019.1631719
76. Li Z, Xin H, Sun J, Lai S, Zeng L, Zheng C, et al. Epidemiologic changes of scrub typhus in China, 1952-2016. Emerg Infect Dis. (2020) 26:1091–101. doi: 10.3201/EID2606.191168
77. Zheng C, Wang L, Li Y, Zhou XN. Visceral leishmaniasis in northwest China from 2004 to 2018: a spatio-temporal analysis. Infect Dis Poverty. (2020) 9:1–13. doi: 10.1186/s40249-020-00782-4
78. Zhao S, Li Z, Zhou S, Zheng C, Ma H. Epidemiological feature of visceral leishmaniasis in China, 2004-2012. Iran J Public Health. (2015) 44:51–9. Available online at: https://pubmed.ncbi.nlm.nih.gov/26060776/
79. Tiaoying L, Jiamin Q, Wen Y, Craig PS, Xingwang C, Ning X, et al. Echinococcosis in Tibetan populations, western Sichuan province, China. Emerg Infect Dis. (2005) 11:1866–73. doi: 10.3201/eid1112.050079
80. Craig PS, Deshan L, Zhaoxun D. Hydatid disease in China. Parasitol Today. (1991) 7:46–50. doi: 10.1016/0169-4758(91)90188-T
81. Meng Q, Wang G, Qiao J, Zhu X, Liu T, Song X, et al. Prevalence of hydatid cysts in livestock animals in Xinjiang, China. Korean J Parasitol. (2014) 52:331–4. doi: 10.3347/kjp.2014.52.3.331
82. Zhuang ZC, Kou ZQ, Bai YJ, Cong X, Wang LH, Li C, et al. Epidemiological research on hand, foot, and mouth disease in Mainland China. Viruses. (2015) 7:6400–11. doi: 10.3390/v7122947
83. Gui J, Liu Z, Zhang T, Hua Q, Jiang Z, Chen B, et al. Epidemiological characteristics and spatial-temporal clusters of hand, foot, and mouth disease in Zhejiang province, China, 2008-2012. PLoS ONE. (2015) 10:e0139109. doi: 10.1371/journal.pone.0139109
84. Jiang L, Jiang H, Tian X, Xia X, Huang T. Epidemiological characteristics of hand, foot, and mouth disease in Yunnan province, China, 2008–2019. BMC Infect Dis. (2021) 21:1–8. doi: 10.1186/s12879-021-06462-4
85. Xu Y, Zheng Y, Shi W, Guan L, Yu P, Xu J, et al. Pathogenic characteristics of hand, foot and mouth disease in Shaanxi province, China, 2010–2016. Sci Rep. (2020) 10:2010–6. doi: 10.1038/s41598-020-57807-z
Keywords: infectious disease, class C, selectivity, recrudescence, China
Citation: Cao Y, Li M, Haihambo N, Zhu Y, Zeng Y, Jin J, Qiu J, Li Z, Liu J, Teng J, Li S, Zhao Y, Zhao X, Wang X, Li Y, Feng X and Han C (2022) Oscillatory properties of class C notifiable infectious diseases in China from 2009 to 2021. Front. Public Health 10:903025. doi: 10.3389/fpubh.2022.903025
Received: 23 March 2022; Accepted: 19 July 2022;
Published: 11 August 2022.
Edited by:
Shuvra Dey, Jahangirnagar University, BangladeshReviewed by:
Muhammad Imran Khan, The University of Haripur, PakistanCopyright © 2022 Cao, Li, Haihambo, Zhu, Zeng, Jin, Qiu, Li, Liu, Teng, Li, Zhao, Zhao, Wang, Li, Feng and Han. This is an open-access article distributed under the terms of the Creative Commons Attribution License (CC BY). The use, distribution or reproduction in other forums is permitted, provided the original author(s) and the copyright owner(s) are credited and that the original publication in this journal is cited, in accordance with accepted academic practice. No use, distribution or reproduction is permitted which does not comply with these terms.
*Correspondence: Chuanliang Han, aGFuY2h1YW5saWFuZzIwMTRAMTYzLmNvbQ==
Disclaimer: All claims expressed in this article are solely those of the authors and do not necessarily represent those of their affiliated organizations, or those of the publisher, the editors and the reviewers. Any product that may be evaluated in this article or claim that may be made by its manufacturer is not guaranteed or endorsed by the publisher.
Research integrity at Frontiers
Learn more about the work of our research integrity team to safeguard the quality of each article we publish.