 Surbhi Bhatia
 Dhruvisha Bansal
 Seema Patil
 Sharnil Pandya
 Qazi Mudassar Ilyas1
 Sajida Imran
- 1Department of Information Systems, College of Computer Sciences and Information Technology, King Faisal University, Al-Ahsa, Saudi Arabia
- 2Symbiosis Institute of Technology, Symbiosis International (Deemed) University, Pune, India
- 3Department of Computer Engineering, College of Computer Sciences and Information Technology, King Faisal University, Al-Ahsa, Saudi Arabia
Climate change is unexpected weather patterns that can create an alarming situation. Due to climate change, various sectors are affected, and one of the sectors is healthcare. As a result of climate change, the geographic range of several vector-borne human infectious diseases will expand. Currently, dengue is taking its toll, and climate change is one of the key reasons contributing to the intensification of dengue disease transmission. The most important climatic factors linked to dengue transmission are temperature, rainfall, and relative humidity. The present study carries out a systematic literature review on the surveillance system to predict dengue outbreaks based on Machine Learning modeling techniques. The systematic literature review discusses the methodology and objectives, the number of studies carried out in different regions and periods, the association between climatic factors and the increase in positive dengue cases. This study also includes a detailed investigation of meteorological data, the dengue positive patient data, and the pre-processing techniques used for data cleaning. Furthermore, correlation techniques in several studies to determine the relationship between dengue incidence and meteorological parameters and machine learning models for predictive analysis are discussed. In the future direction for creating a dengue surveillance system, several research challenges and limitations of current work are discussed.
1. Introduction
Artificial Intelligence is a field in which a machine exhibits intelligence by learning about itself. Artificial Intelligence may employ various approaches and algorithms to comprehend human intellect, but it is not limited. Machine Learning is a branch of AI that deals with techniques that can learn from experience on their own (1). In automated decision-making and predictive analytics, AI plays a crucial role (2). Methods based on various kinds of AI are already being used in a variety of climate change and environmental monitoring research sectors (3). Machine Learning and Deep Learning are used in education, finance, healthcare, agriculture, and many more. The application of Machine Learning in healthcare demonstrated encouraging results, instilling trust in the sector (4). There are varied reasons for using artificial intelligence in healthcare. Primarily, it helps to manage the clinical records of patients and aids in providing personalized treatment and medicines, early identification of disease, providing predictive analytics, which could help health officials take preventive measures in advance before the outbreak of any disease (5). Artificial Intelligence goes back to the too early 1990s and today has evolved into a burgeoning field with a significant contribution in healthcare (6) through various modes like drug and discovery, personalized treatment and medicine, preventive measures, a health assistant chatbot, clinical trial and researches, diagnosing and pathology, analytics, image processing and prediction of an outbreak. Artificial Intelligence is a boon, and Figure 1 demonstrates the evolution of AI in healthcare throughout 1950–2020. Climate change is long-term changes in temperature and weather patterns.These variations might be attributed to natural causes such as solar cycle oscillations. Due to the use of fossil fuels such as coal, oil, and gas, human activities have been the leading cause of climate change since the 1800s (7). Greenhouse gas emissions from fossil fuel combustion act as a blanket, trapping the sun's heat and boosting global temperatures. The amount of greenhouse gases in the atmosphere is at its highest level in 2 million years. Artificial Intelligence is a field in which a machine exhibits intelligence by learning about itself. Artificial Intelligence may employ various approaches and algorithms to comprehend human intellect, but it is not limited. Machine Learning is a branch of AI that deals with techniques that can learn from experience on their own. In automated decision-making and predictive analytics, AI plays a crucial role. Methods based on various kinds of AI are already being used in a variety of climate change and environmental monitoring research sectors. Machine Learning and Deep Learning are used in education, finance, healthcare, agriculture, and many more. The application of Machine Learning in healthcare demonstrated encouraging results, instilling trust in the sector (8). There are varied reasons for using artificial intelligence in healthcare. Primarily, it helps to manage the clinical records of patients and aids in providing personalized treatment and medicines, early identification of disease, providing predictive analytics, which could help health officials take preventive measures in advance before the outbreak of any disease. Artificial Intelligence goes back to the too early 1990s and today has evolved into a burgeoning field with a significant contribution in healthcare through various modes like drug and discovery, personalized treatment and medicine, preventive measures, a health assistant chatbot, clinical trial and researches, diagnosing and pathology, analytics, image processing and prediction of an outbreak. Artificial Intelligence is a boon, and Figure 1 demonstrates the evolution of AI in healthcare throughout 1950–2020. Climate change is long-term changes in temperature and weather patterns.These variations might be attributed to natural causes such as solar cycle oscillations. Due to the use of fossil fuels such as coal, oil, and gas, human activities have been the leading cause of climate change since the 1800s. Greenhouse gas emissions from fossil fuel combustion act as a blanket, trapping the sun's heat and boosting global temperatures. The amount of greenhouse gases in the atmosphere is at its highest level in 2 million years. Emissions are steadily increasing. Since the late 1800s, the Earth has warmed by around 1.1°C. The previous 10 years (2011–2020) have been the hottest on record. Figure 2 explains the causes of climate change and the effects due to those variations. Vector-borne illness is a severe public health threat in underdeveloped nations that is only becoming worse. Temperatures in the air and water, precipitation patterns, severe rainfall events, and seasonal changes are all known to impact disease transmission (9). At the moment, dengue (10) is spreading widely after COVID-19; dengue is a vector-borne disease that spreads through an infected female mosquito of species Aedes aegypti (11) and is one of the most common diseases in more than 100 countries (12). Aedes aegypti can be found in urban and suburban settings with high human population density and housing density. This species is endophilic, which means it seeks shelter inside structures. As a result, the intradomicile is more typically seen than the peridomicile. Tires, cans, bottles, pots, vats, brass, swimming pools, and abandoned aquariums are frequent breeding habitats filled with rainwater or household water.
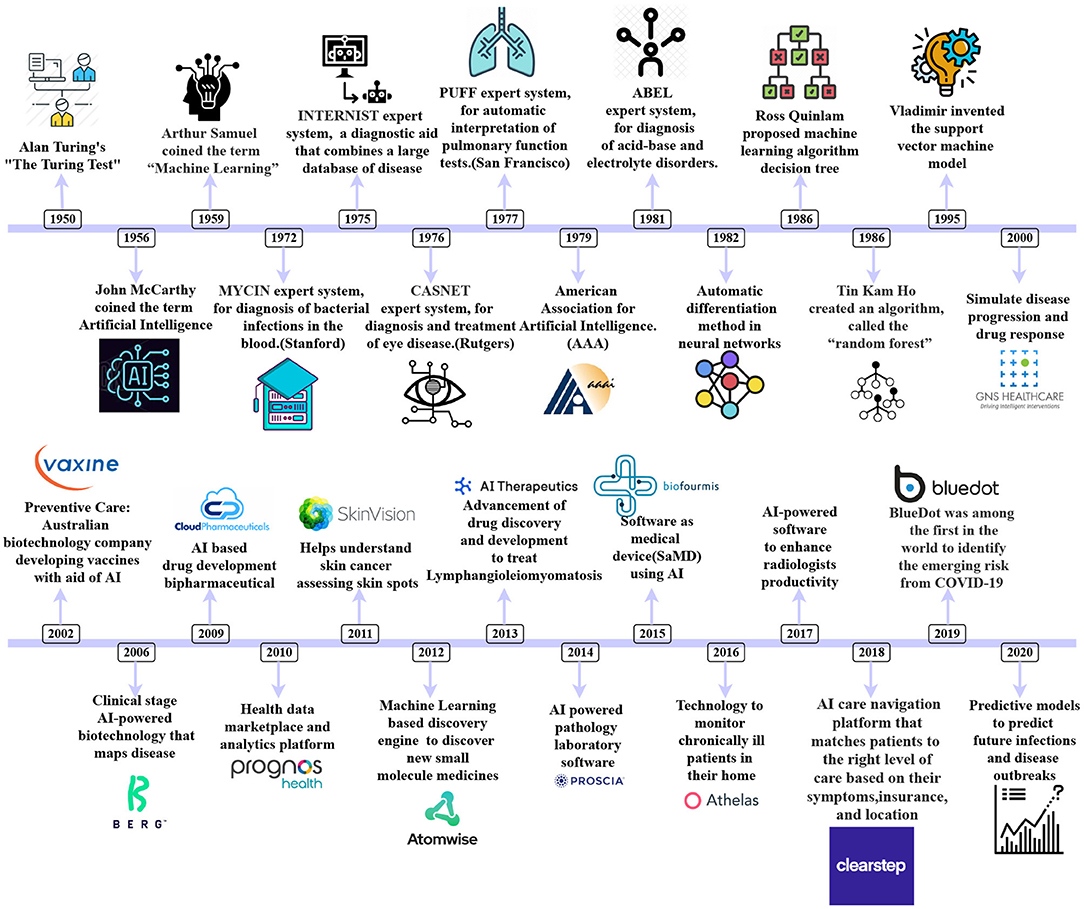
Figure 1. A chronological representation of Artificial Intelligence in Healthcare from 1952 to 2020.
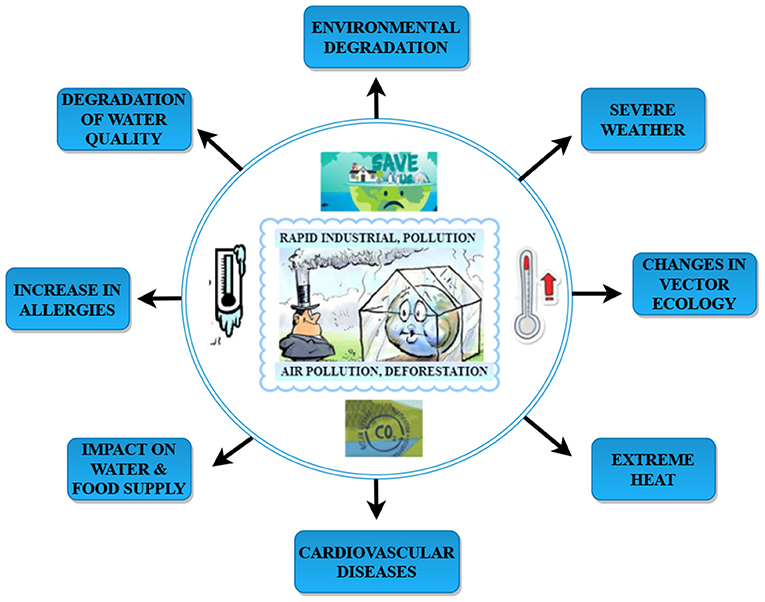
Figure 2. Causes and consequences of climate change.
These mosquitos carry the Chikungunya, yellow fever, and Zika viruses. Dengue fever is widespread in the tropics, with different risk levels based on rainfall, temperature, relative humidity, and unplanned fast urbanization. Dengue fever may be fatal if it is not treated appropriately. It was first discovered during dengue epidemics in the Philippines and Thailand in the 1950s. Most Asian and Latin American nations now have severe dengue fever, a leading cause of hospitalization and mortality among children and adults. A Flaviviridae virus causes dengue with four unique but closely related serotypes (DENV-1, DENV-2, DENV-3, DENV-4), and the fifth serotype of dengue has been detected in the Malaysian state of Sarawak (13). Dengue fever is caused by DENV infection in our bodies. Figure 3 depicts the common symptoms of dengue. Dengue fever causes severe joint and muscle pain, enlarged lymph nodes, headaches, fever, exhaustion, and a rash. Dengue fever is characterized by non-specific flu-like symptoms such as chills, appetite loss, lethargy, and low backache. According to a recent WHO research, dengue fever grew in several countries in 2020, including Bangladesh, Brazil, the Cook Islands, Ecuador, India, Indonesia, the Maldives, Mauritania, Mayotte, Nepal, Singapore, Sri Lanka, Sudan, Thailand, Timor-Leste, and Yemen. In 2019, dengue fever cases reached an all-time high in the world. Dengue fever is slowly gaining ground in 2021, with instances documented in several nations. Around 40 per cent of the world's population lives in areas with a high risk of dengue fever, such as tropical and subtropical climates. Dengue fever has become much more common in recent decades worldwide. According to one estimate, 390 million dengue virus infections occur each year (12). Emissions are steadily increasing. Since the late 1800s, the Earth has warmed by around 1.1°C. The previous 10 years (2011–2020) have been the hottest on record (9). Figure 2 explains the causes of climate change and the effects due to those variations. Vector-borne illness is a severe public health threat in underdeveloped nations that is only becoming worse. Temperatures in the air and water, precipitation patterns, severe rainfall events, and seasonal changes are all known to impact disease transmission (10). At the moment, dengue (11) is spreading widely after COVID-19; dengue is a vector-borne disease that spreads through an infected female mosquito of species Aedes aegypti (12) and is one of the most common diseases in more than 100 countries (14). Aedes aegypti can be found in urban and suburban settings with high human population density and housing density. This species is endophilic, which means it seeks shelter inside structures. As a result, the intradomicile is more typically seen than the peridomicile. Tires, cans, bottles, pots, vats, brass, swimming pools, and abandoned aquariums are frequent breeding habitats filled with rainwater or household water (13). These mosquitos carry the Chikungunya, yellow fever, and Zika viruses. Dengue fever is widespread in the tropics, with different risk levels based on rainfall, temperature, relative humidity, and unplanned fast urbanization. Dengue fever may be fatal if it is not treated appropriately. It was first discovered during dengue epidemics in the Philippines and Thailand in the 1950s. Most Asian and Latin American nations now have severe dengue fever, a leading cause of hospitalization and mortality among children and adults. A Flaviviridae virus causes dengue with four unique but closely related serotypes (DENV-1, DENV-2, DENV-3, DENV-4), and the fifth serotype of dengue has been detected in the Malaysian state of Sarawak (15). Dengue fever is caused by DENV infection in our bodies. Dengue fever causes severe joint and muscle pain, enlarged lymph nodes, headaches, fever, exhaustion, and a rash. Dengue fever is characterized by non-specific flu-like symptoms such as chills, appetite loss, lethargy, and low backache. According to a recent WHO research, dengue fever grew in several countries in 2020, including Bangladesh, Brazil (16), the Cook Islands, Ecuador, India (17), Indonesia (18), the Maldives, Mauritania, Mayotte, Nepal, Singapore (19), Sri Lanka, Sudan, Thailand (20), Timor-Leste, and Yemen. In 2019, dengue fever cases reached an all-time high in the world. Dengue fever is slowly gaining ground in 2021, with instances documented in several nations (14). Around 40 per cent of the world's population lives in areas with a high risk of dengue fever, such as tropical and sub-tropical climates. Dengue fever has become much more common in recent decades worldwide. According to one estimate, 390 million dengue virus infections occur each year (14). Dengue fever will affect 60 per cent of the world's population by 2080, according to researchers who blame climate change for the disease's spread. Climate change is widely cited as a contributing factor in the rapid spread of pandemic disease (21). Climate change is frequently identified by WHO, national, and international health authorities as one of the primary causes of the global spread of dengue fever and other Aedes-transmitted viral infections. According to the World Health Organization, dengue fever has become increasingly widespread internationally in recent decades (WHO). According to the World Health Organization, dengue fever affects 50–100 million people globally each year. As a result, it is vital to anticipate dengue epidemics. The accuracy of dengue epidemic prediction is currently a problem that must be addressed. The role of climate variables in predicting dengue outbreaks has been studied in a small number of studies. Tropical countries are the hardest hit because of their environmental, climatic, and socioeconomic characteristics (22). The weather has an impact on the vector-borne illness dengue's temporal and geographical spread. As a result, rainfall and ambient temperature are referred to as macro factors that influence dengue since they directly impact Aedes aegypti population density, which varies seasonally based on these important variables. Its population density tends to decline drastically during less precipitation and lower average temperatures in regions with a tropical or subtropical climate. Still, it grows consistently in locations with a tropical or subtropical environment (23). As the vector-weather association is as significant as the vector-human interaction, studies of climatic variables can have a better understanding of epidemic seasonality and the ability to anticipate it (24). In recent years, epidemiological research has focused on developing mathematical and statistical models based on weather parameters to explain the dynamics of dengue fever incidence. Its main goal was to find models with promising future predicting the potential of dengue incidence to help public health officials. Several researchers investigate the link between climate variables and dengue fever, frequently employing time-series analyses to characterize temporal trends, uncover patterns, and even make forecasts. Bhatt et al. (21) Many parameters, such as entomological, epidemiological, and geographic characteristics, can help predict the dengue outbreak effectively. Artificial intelligence has been employed in healthcare for a long time. This review study discusses the studies undertaken until now. Figure 4 represents road-map of the present study. It investigates several other vulnerable groups that will be useful in predicting positive dengue cases and eventually help prevent the outbreak and take preventive measures at an early stage. The present study is structured as follows: Section 2 describes the methodology and objectives of the survey carried out; Section 3 provides a detailed analytical review of the papers; Section 4 discusses the challenges and future work, and Section 5 concludes the present study.
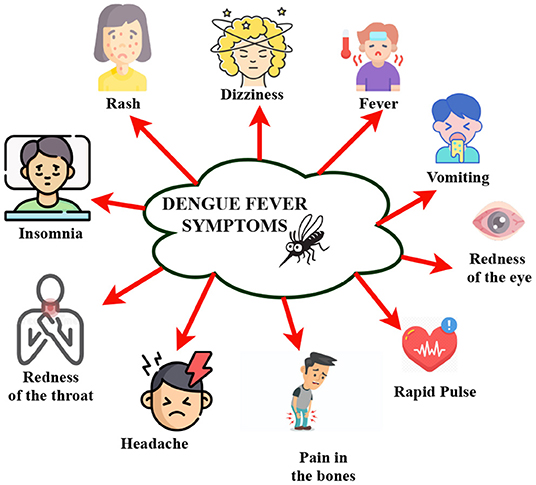
Figure 3. Symptoms of dengue.
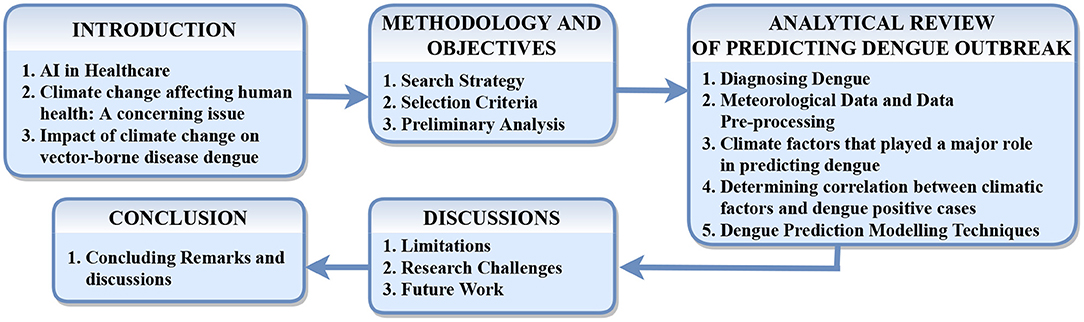
Figure 4. Roadmap of the conducted review.
2. Methodology and Objectives
To carry out the systematic literature review of dengue prediction models, process was followed which included i) establishing research questions, ii) developing a search strategy to narrow down the results, iii) selecting papers using eligibility criteria and iv) analyzing to extract strengths, weaknesses, and difficulties to overcome from articles. The main objectives of this systematic literature review are i) To gather and describe dengue machine learning models for dengue surveillance systems and ii) To illustrate the obstacles that future dengue modeling studies will face.
2.1. Search Strategy
Various digital libraries like Taylor and Francis, Google Scholar, MDPI, IEEE Xplorer, ScienceDirect, Pubmed, BMC and PLOS were used. The inclusion criteria were articles from January 2017 to August 2021 related to various dengue prediction models based on explanatory variables. The requirements for discarding the publications were personal opinions, unpublished works, posters, short articles and conference papers. The selection procedure included choosing themes by scrutinizing their title, keywords and abstract to eliminate the results that were not related. Further, to investigate more relevant papers, we examined summaries to determine if we could select the article or not.
2.2. Preliminary Analysis
To analyze the amount of research carried out, we analyzed Scopus data using keywords dengue, predicting, climatic factors, age and gender. Figure 5A were graphically represented using the query “[(predicting dengue) and (climatic factors and dengue)]” which fetched 1,315 documents, and Figure 5B were graphically represented using the query [(predicting dengue) AND (climatic factors and dengue) and (age group and gender)] which fetched only 38 documents. Therefore, we can deduce that studies on dengue prediction based on climatic factors, age group and gender has not been done by many researchers, and we can explore this field. As it is not carried out in many regions, there is a scope to examine countries/territories where this study has not been carried out. The analytic review that we carried out had the highest number of studies were from India, Brazil and Malaysia. Figure 6 displays the number of studies done in different countries and republics. As stated by the WHO report, these countries belong to tropical and sub-tropical regions that are more prone to dengue. Various explanatory variables are presently used for dengue modeling, categorized according to their characteristics and method of collection. The variables used were clinical, economic, laboratory and climatic factors. In general, climatic factors mainly were used. According to this review, vulnerable groups like age group and gender were least for dengue outbreak prediction as data about patients is not that easily available.

Figure 5. No. of studies in different regions and time-period of scopus database: (A) No. of studies carried out on predicting dengue based on climatic factors for the time period 1997–2022 and (B) No. of studies carried out on predicting dengue based on climatic factors, age group and gender for the time-period 2000–2021.
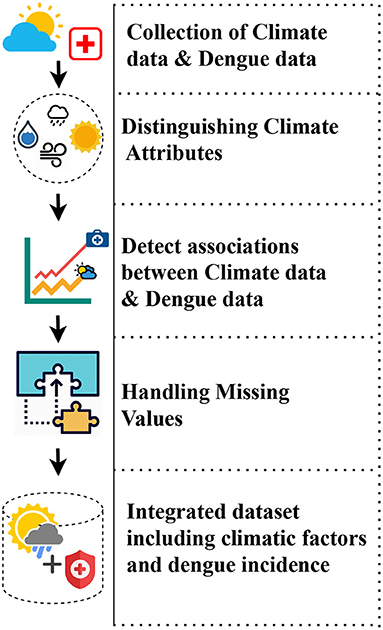
Figure 6. Data pre-processing stages.
3. Analytical Review of Predicting Dengue Outbreak
Forty articles of period 2019–2021 were reviewed and analyzed to understand the dengue prediction models and how different factors like meteorological conditions, laboratory tests, symptoms, demographic features were dependent variables for the rise of dengue cases.
3.1. Diagnosing Dengue
Identifying the dengue infection, viral antigens, viral RNA, and antibodies against the virus in the patient's blood or tissues are among the laboratory procedures used to diagnose dengue. Only 4–5 days after symptoms can the virus be discovered in the blood (25). Dengue can be diagnosed by isolating the virus, viral RNA, and viral protein during the early stages of the disease. Identifying antibodies IgM and IgG in an infected person's blood is an indirect approach to diagnosing dengue fever. This approach is widely used to identify dengue fever in its latter stages after virus levels have dropped. Doctors can discover antibodies to dengue 5 days after the onset of symptoms in most individuals, and IgG can be detected for months or even years after infection. IgM levels are very high after a primary (initial) dengue infection, but they are decreased with subsequent infection. During a subsequent infection, IgG levels increase. As a result, doctors can use IgM and IgG concentrations to determine whether a patient has a primary or secondary dengue infection (26). Therefore, in most of the data, IgG and IgM and levels are specified for easy detection and also it can aid in creating the laboratory dengue surveillance system (27).
3.2. Meteorological Data and Data Pre-processing
Meteorological data represents the weather conditions like relative humidity, precipitation, minimum temperature, maximum temperature, air pressure, wind speed and many other parameters for location and time. These are massive data collected and later utilized to record the highest and lowest climatic events for various reasons like weather forecasting to identify seasonal change and public health. There are various sources through which we can obtain data. A brief description of the explanatory variables, data source, region and period is presented in the Table 1 used in different studies. Data Pre-processing is a crucial stage after data collection. This step enhances the model's performance, to which they will further provide the data for training and testing. Dengue incidence data collected contains information that might not be required, and there might be missing values. To handle these shortcomings, data pre-processing is a significant step. Figure 6 shows the steps followed in information pre-processing. The major concern for reviewers is missing data and data not being available completely (28). Jorge et al. (29) developed a three-stage to take the missing values in the dataset wherein first stage parameters with more than 20 per cent of missing values were eliminated. At the next stage, they discarded cases with a non-response rate higher than 80 per cent. There are no particular rules for selecting the proper imputation of missing variables. It relies on the dataset type, non-response type, pattern of loss of response, research aims, specific population features, general study organization characteristics, or available software. Given the data entry procedure's features and the dataset's epidemiological nature, they concluded that imputing the mean of the valid neighboring data to the missing values was the best option at the third stage (30).
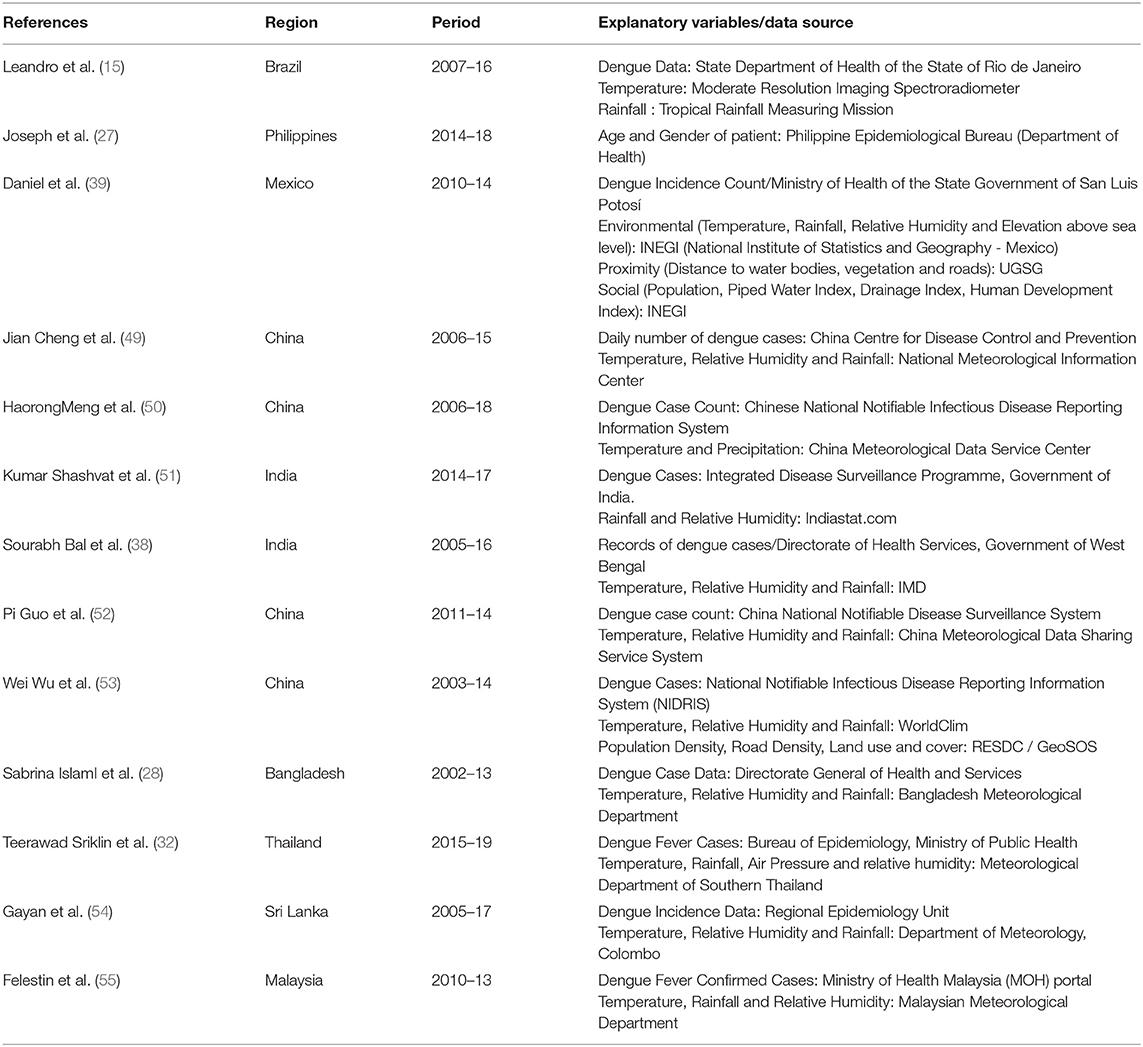
Table 1. Detailed representation of explanatory variables and data sources of different studies.
3.3. Climate Factors That Played a Major Role in Predicting Dengue
According to many studies, certain meteorological factors like temperature, rainfall, humidity, wind speed, air pressure and vegetation index displayed a positive correlation with the rise in dengue incidence. Hence, it helps us narrow down to a few concrete factors that can be used in further research to create dengue surveillance systems for different vulnerable groups. Figure 7 displays the percentage and combination of climatic factors that have been used in review papers, where temperature, rainfall and humidity account for 49 per cent. Therefore, other least used elements that show some relation with dengue incidence can be used for efficient prediction.
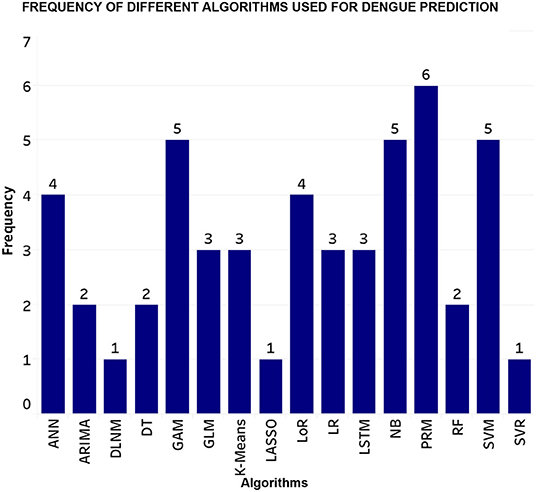
Figure 7. Frequency of machine learning techniques used for dengue incidence prediction (SVM, Support Vector Machine; NB, Naive Bayes; DLNM, Distributed Lag Non-Linear Model; PRM, Poisson Regression Model; LSTM, Long Short Term Memory, ANN, Artificial Neural Network; GLM, Generalized Linear Model; GAM, Generalized Additive Model; LoR, Logistic Regression; LR, Linear Regression; RF, Random Forest; DT, Decision Tree; SVR, Support Vector Regressor).
3.3.1. Temperature
The most critical weather component affecting mosquito vector growth and dispersion and a potential predictor of dengue outbreak is temperature (31). The density of the mosquito population, biting rates, gonotrophic cycle lengths, and vector size are all affected by temperature during the mosquito's incubation life cycle and behavior. The findings of Teerawad Sriklin et al. study.'s back with prior research suggest that severe temperatures alter the development of dengue vectors. As a result, the temperature has an impact on vectorial efficiency as well as the probability of an epidemic. Given the link between temperature and dengue cases, the predicted temperature change could worsen dengue transmission (28, 32).
3.3.2. Rainfall
Dengue transmission was found to be linked to rain and wet days. Rainfall has been identified as a role in the spread of dengue fever. Mosquitoes spend their whole life cycle in water before hatching into adult mosquitoes. Increased rainfall may create new habitat for larvae and vectors and boost adult survival (33).
3.3.3. Humidity
Despite widespread interest in the relationship among climatic conditions and positive dengue cases prevalence among researchers, research on relative humidity as a critical climatic component has been limited. Furthermore, the findings of the few study were equivocal and contradictory. They showed relative humidity as the most crucial predictor in an Indonesian investigation of dengue outbreaks in that nation, with a 3–4-month lag time. According to this study, low humidity in September and October is generally followed by a dengue outbreak early the following year. As a result, it's highly likely that if seasonal circumstances vary as a result of climate change, seasonal dengue outbreaks will shift as well (34).
3.3.4. Geographic Factors
The influence of residential regions on mosquito incidence became more evident under certain environmental circumstances, such as lower precipitation. According to research, mosquito incidence is very susceptible to high residential sites with a more significant density of residential streets. Roads feature drainage components that collect surface water runoff and release it in appropriate areas to avoid inland floods. However, concrete structures encroaching on channels or garbage filling them can often undermine adequate drainage in residential areas. These obstructions can prevent complete water flow, resulting in water accumulation places that can provide favorable habitat for Aedes aegypti. A growing body of research suggests a link between drainage and the presence of Aedes aegypti (28).
3.4. Determining Correlation Between Climatic Factors and Dengue Positive Cases
Correlation is a statistical method for deciding the degree to which two parameters are related, using correlation coefficients. Correlation coefficients are used to determine the strength of a linear relationship between two parameters. Correlation coefficient can be used to determine if a climatic element is positively or adversely associated with the increase of dengue fever cases (35). Various correlation strategies have been utilized in various research, and they have proven to help remove the climatic factors that were not very significant. The Pearson's correlation coefficient determines the statistical relationship between two variables. It is based on the covariance method. It is widely acknowledged as the most effective approach for determining the connection between two variables of interest. It offers information on the amount and direction of the link, or correlation, between the two variables. A non-parametric test called Spearman rank correlation predicts the degree of relationship among two variables. Pearson Correlation Coefficient (36) and Spearman's Rank Correlation Test (37) have been widely used. Sourabh Bal et al. carried out their study of dengue occurrence based on climatic factors for the region Kolkata, India, using auto-correlation coefficient and partial auto-correlation coefficient values. An auto-correlation analysis is used to examine dengue cases affected by prior instances. In addition, the Pearson correlation was used to assess for collinearity between the various climate variables (38). In the study carried out by Daniel Sánchez-Hernández et al. carried out correlation analysis to inspect they built the relationships of proximity, environmental, social factors and location about the occurrence of dengue, a multivariable logistic regression model. A logistic curve may be produced by graphing the connection between the explanatory and predicted variables, which will help us evaluate the correlation strength (39). Various correlation techniques have been according to the review Pearson, and spearman's correlation test were widely used and effective in most of the studies.
3.5. Dengue Prediction Modeling Techniques
Various models can predict dengue incidence based on climatic variables (40). Several studies carried out have used different models are described along with the results. Figure 8 depicts the steps and techniques that will required and are essential to develop an early monitoring dengue surveillance system.
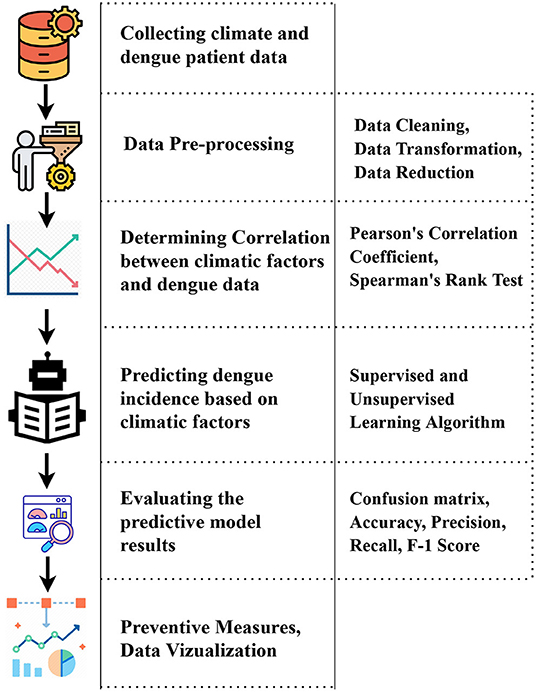
Figure 8. Process of developing a dengue surveillance system.
3.5.1. Support Vector Regression
SVMs and Support Vector Regression are both based on similar concepts. SVR's main goal is to find the best-fitting line. The hyperplane with the greatest number of points is the best fit line in SVR. In SVR, unlike other regression models, the goal is to fit the best line inside a threshold value. The complexity of SVR's reasonable time grows more than quadratically with the number of samples, making it difficult to scale to datasets with more than a few tens of thousands of samples. Linear SVR is faster than SVR; however, it solely considers the linear kernel. As the cost function ignores samples whose prediction is close to their goal. Based on the evaluation metrics like RMSE and MAE, SVR with linear kernel proved to be quite good at forecasting the number of dengue incidents in Jakarta. Their experiments with various penalty parameters for SVR with linear kernel yielded quite accurate outcomes. When cross-correlation between variables, the linear kernel has a higher prediction accuracy than the radial kernel (41).
3.5.2. Random Forest
Random Forest (42) is an ensemble technique that builds many separate bootstrapped trees from random small subsets of the data using bootstrap aggregation (bagging) (43). As it can handle large numbers of target variables even in complicated interactions, RF is utilized to tackle issues in classification and regression (44). Every tree in the random forest produces a class prediction, and the class with the most votes becomes the prediction of our model. Before training, three hyperparameters of random forest algorithms have to be established. The factors to be considered are the size of nodes, the number of trees and the number of characteristics sampled. This technique is used by Micanaldo et al. (45) in predicting dengue based on various explanatory variables.
3.5.3. Model-Based Recursive Partitioning
The combined effects of the chosen explanatory variables on OI and Dengue fever incidence, Micanaldo et al. (45) used a Model-Based (MOB) recursive partitioning. MOB is similar to CART (classification and regression tree) methods, which recursively partition datasets into subsets depending on independent variables at each step (46). The following steps are repeated iteratively by the MOB algorithm: (1) fit the data to a user-defined linear regression equation; (2) determine if other variables have an impact on model parameters.; (3) if so, using a threshold that results in the most significant changes in the linear model parameters based on the M-fluctuation test, split the model and data into two groups concerning the covariate.; and (4) In each of the subsamples, repeat steps 1–3. Until a specific stop condition is satisfied, the steps are repeated.
3.5.4. Distributed Lag Non-linear Models
Distributed Lag Non-Linear Model is modeling framework for representing links in time series data with non-linear and delayed effects flexibly. The establishment of cross basis, bi-dimensional functional space created by the combination of 2 sets of basis functions that characterize the relationships in the predictor and lag dimensions, respectively, is the cornerstone of this technique.
3.5.5. Generalized Linear Model
Generalized Linear Model is a sophisticated statistical modeling technique that enables us to construct a linear relationship between the answer and the predictors, even though their underlying relationship is not linear. This is possible because of the employment of a link function, which connects the response variable to a linear model. Here, the error distribution of the response variable does not have to be regular.
3.5.6. Generalized Additive Model
Generalized Additive Models are a sort of statistical model. Many nonlinear smooth functions replace the typical linear relationship between the response and targets to represent and capture data non-linearities. These flexible and soft approaches allow us to fit linear models that are either linearly or non-linearly dependent on many predictors to capture nonlinear correlations between response and predictors.
3.5.7. Multilayer Perceptron
A feed-forward ANN called a Multilayer Perceptron is a feed-forward artificial neural network. A hidden layer, an input layer, and an output layer are at least three levels of nodes. For a long time, ANN has been a reliable perceptive classifier for various applications, including medical diagnosis and disease early detection. MLP adapts the classic linear perceptron and employs a supervised learning technique to propagate the network. As a result, it can distinguish facts that cannot be separated. A perceptron forms a linear combination using input weights to produce a single output based on numerous real-valued inputs. They train on a collection of input-output pairs to learn how to express the correlation between inputs and outputs. The model's parameters, or weights and biases, are adjusted throughout training to minimize inaccuracy. Back-propagation is used to change the consequences and preferences about the error, which can be quantified in various ways (47).
3.5.8. K Nearest Neighbor Regression
Scavuzzo et al. (48) used the K-Neighbors Regressor module. Based on k-nearest neighbors, this technique infers a regression. Local interpolation of the training set's targets in the neighborhood is used to forecast the target. Only the first five principal components are used to deconstruct the original data. Four neighbors, Chebyshev metric, brute force and uniform weight, were the tuning settings available. Out of all the tested models, this model gave beast results for modeling the dengue vector population.
3.5.9. Auto-Regressive Integrated Moving Average Model
Xavier et al. (15) chose the ARIMA model, a family of autoregressive moving averages, to describe the relationship among the count of positive dengue cases (dependent variable) and meteorological parameters (explanatory variables). The ARIMA model's primary goal is to directly simulate the autocorrelation in a time series to capture it. Solid underlying mathematics and statistical theory are commonly used to predict time series data, making it easier to construct expected ranges. The ARIMA model is very adaptable, capturing a wide range of patterns. Choosing order and differencing are two fundamental principles in the ARIMA model.
3.5.10. Time Series Poisson Regression Model
Sang et al. (56) to determine the relationship between meteorological conditions and local dengue count, researchers developed this model called Time Series Poisson Regression. According to this model, dengue count was positively related to dengue count in the preceding month, imported cases in the previous month, the minimum temperature during the last month, and accumulative precipitation with 3-month lags.
Table 2 illustrates the detailed representation of latest research papers which has undertaken the study to understand the relation between dengue and meteorological patterns and the need to develop a dengue surveillance system.
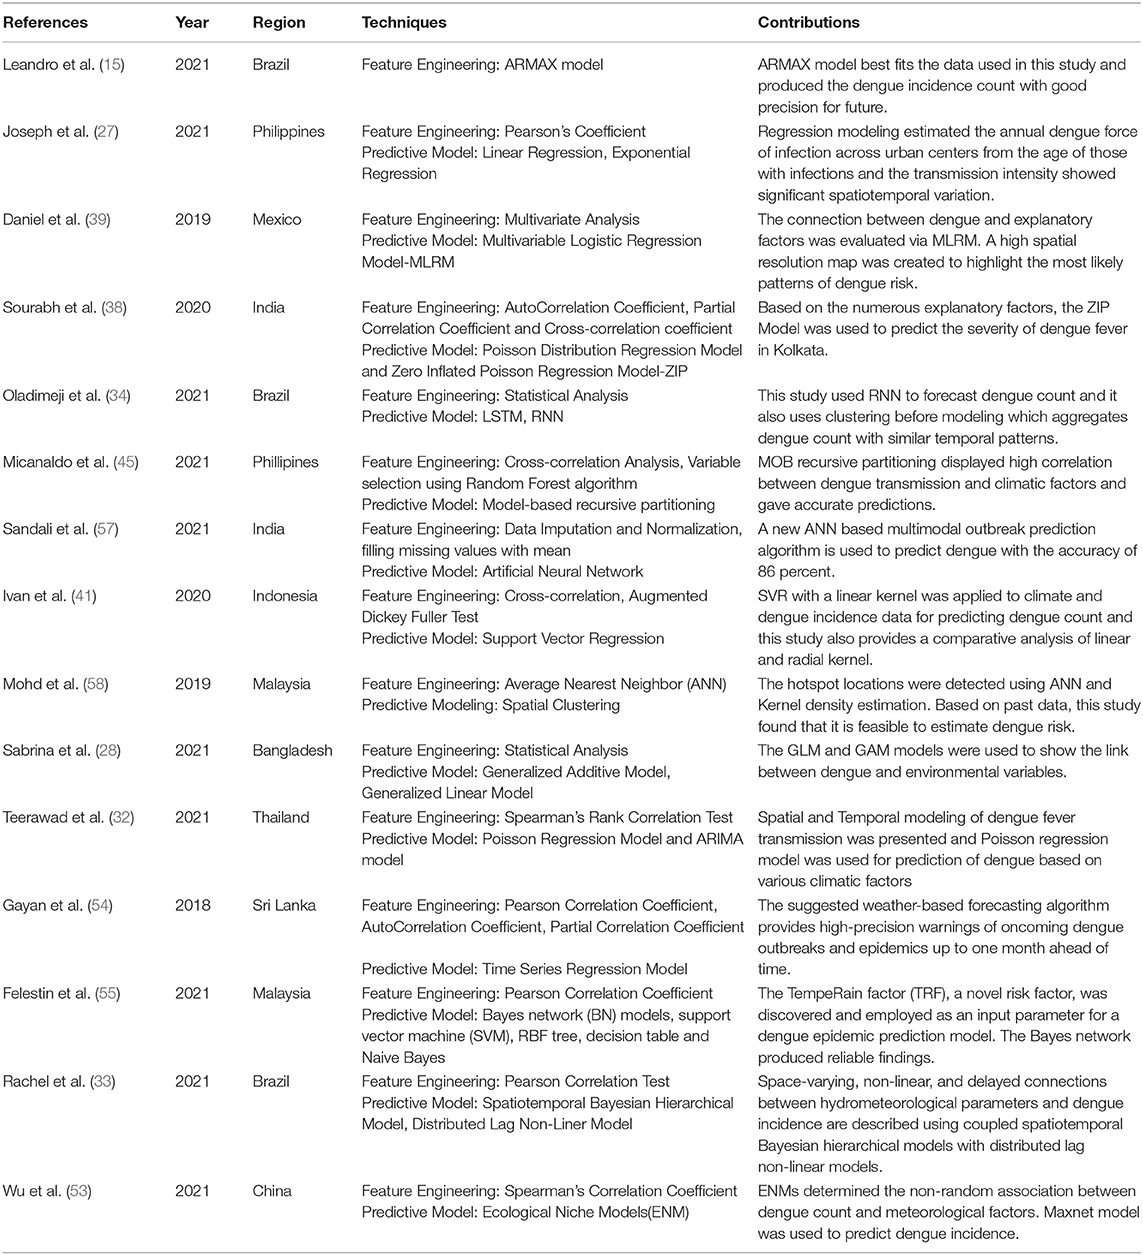
Table 2. Detailed representations of different models and feature engineering techniques used in different studies.
4. Discussion
According to the number of people infected, dengue fever is the most common arboviral disease in the world. Understanding the precise relationship between meteorology and dengue transmission is not a simple process because dengue transmission involves dengue viruses, vectors, and susceptible people. Furthermore, forecasting the future of dengue under various climate change scenarios involves a complete understanding of the association between climate and dengue and future climate and other variables. Despite this, a lot of progress has been achieved in this area. Despite the advances achieved in forecasting dengue's future, numerous uncertainties remain (59). To begin with, socio-demographic factors play a significant influence in dengue transmission, and including socio-demographic components into future dengue, projections remains a challenge. Second, in previous studies estimating the future of dengue, the increasing temperature has been commonly employed as a climate change indicator, with rainfall and humidity being under-researched. According to Hales et al., the climate indicator that most correctly predicts the occurrence of dengue fever is vapor pressure, which is a temperature and humidity measurements. However, the relationships between numerous environmental conditions and dengue transmission are complex and sometimes non-linear. Dengue modeling is an essential technique for early detection of dengue outbreaks, assessing risk factors for Severe Dengue, and possibly controlling the disease's vectors. Although much research has been done on these topics, it is critical to understand what areas of dengue modeling still have to be explored to build future research that will significantly reduce disease morbidity rates. The primary goal of this study was to provide an overview of dengue modeling and identify critical issues for future research. This section focuses on the limitations of the studies that have been reviewed. Some research problems or opportunities are described based on those restrictions.
4.1. Limitations, Research Challenges and Future Work Directions
4.1.1. Inclusion of Micro Climatic Factors
Researchers have widely used temperature, humidity, and rainfall are macro climatic factors. But to bring in more explanatory variables that can explain the rise in dengue incidence rise can aid in building a better dengue surveillance system (32, 55, 60, 61).
SOLUTION: There are many climatic variables like wind speed, air pressure, vegetation index, and we can add many other microclimatic factors to the model for better dengue incidence.
4.1.2. Exploring Different Geographic Locations
Many types of research stated the limitation that how dengue outbreak prediction model developed for one region cannot be used accurately for different areas as dengue incidence may or may not be related to the same climatic factors of one place and due to weather fluctuations and pattern of coastal regions might not give excellent predictive results from the model that was developed for non-coastal regions (55, 62–64).
SOLUTION: Exploring different regions other than that have already been investigated or studying the weather patterns of the country where more minor number studies have been carried out in predicting dengue incidence based on the weather forecast can help in understanding the relationship between different patterns of weather for various regions and dengue rise and eventually would help build a dengue surveillance system.
4.1.3. Data Limitations
Obtaining a dengue dataset that is completely fit for the model and has all characteristics is difficult to find. There are many issues faced by the researchers in this area like i) data being incomplete, ii) data being not available in required time lag like weekly or monthly and for a specific time-period and iii) data that is available only on a macro level like country-level or state-level and not on micro-level like city-level (15, 28, 45, 54, 63, 65).
SOLUTION: Data cleaning can be handled by using various data pre-processing techniques based on the data type. When data is not completed available, taking the average or mean of the available information can be helpful. To obtain data at the micro-level can be a tedious task, but with all the proper procedures, the patient's data can be obtained from the Health Department of the respective region.
4.1.4. Considering Vector Density and Mosquito Larvae Data
The main issue highlighted in most of the studies was the correlation between climatic factors and dengue incidence; whereas those are not the only factors that contribute to increased disease transmission of dengue, the main factor is the vector that carries the transmission (32, 33, 49).
SOLUTION: Considering the vector density, mosquito larvae data or land use would aid in gaining a better understanding of the main factor behind the rise in dengue cases. Considering these parameters would help predict the outbreak better and take preventive measures well in advance.
4.1.5. Taking Into Account the Effect of Vaccination After the Outbreak
The studies carried until now focus on determining the correlation between the climatic factor and dengue incidence and then using weather forecast of coming time to predict the dengue incidence and taking preventive measures. Still, the shortcoming that few researchers found is that there might be a fluctuation in predicting dengue incidence when every infected person might be vaccinated (66–68).
SOLUTION: As and when the vaccination of patients is done, the data of the patient's immune can be determined and kept a record of. Further, that data can be used whenever the prediction for other outbreaks is being carried out. Figure 9 represents the logical mapping of limitations and their possible solutions.
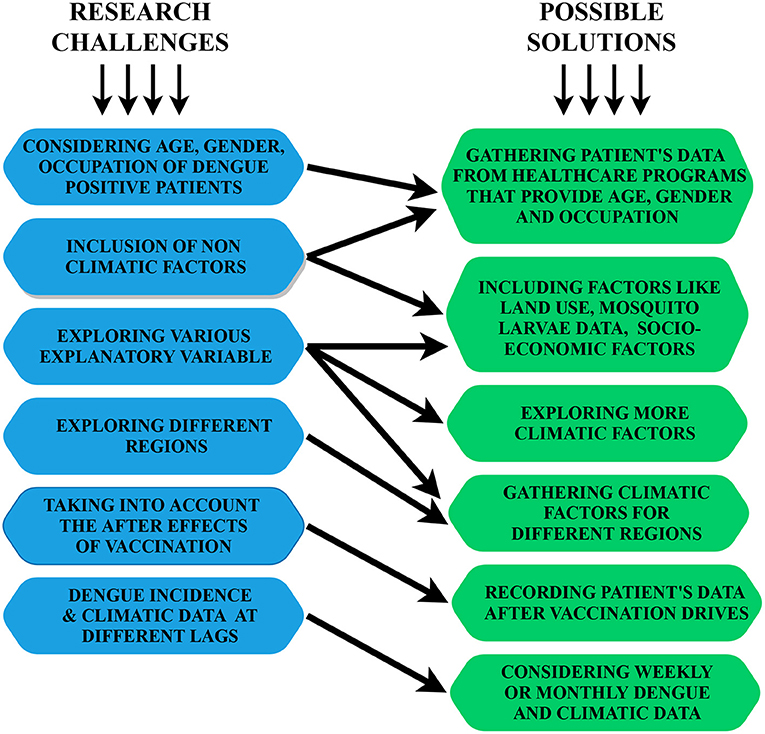
Figure 9. A logical mapping of research challenges and possible solutions.
4.2. Contributions
Dengue Surveillance system can aid the health sector in taking preventive measures for dengue outbreaks in advance. Also, it can help to be prepared for the worst of situations and reduce the vulnerability of epidemics. Several research studies have predicted the epidemic using machine learning approaches, including climatic factors. The present review discusses the most common data sources, data pre-processing stages, most common correlation techniques for dengue incidence and climatic factors, machine learning techniques, limitations, and future research directions. Table 3 represents the research challenges of the current study. The contribution of the presented student are:
• The present study gives a detailed insight into the amount of work done in predicting dengue incidence using different machine learning techniques based on various explanatory variables.
• To assist readers, we have discussed several data sources for dengue incidence count and weather variables.
• different approaches for determining the relation between dengue incidence and explanatory variables and various explanatory variables (climatic factors, demographic variables, vulnerable groups).
• Furthermore, we have discussed various dengue modeling techniques for predicting outbreaks.
• This work's main contribution is to outline open research concerns and limitations of various studies.
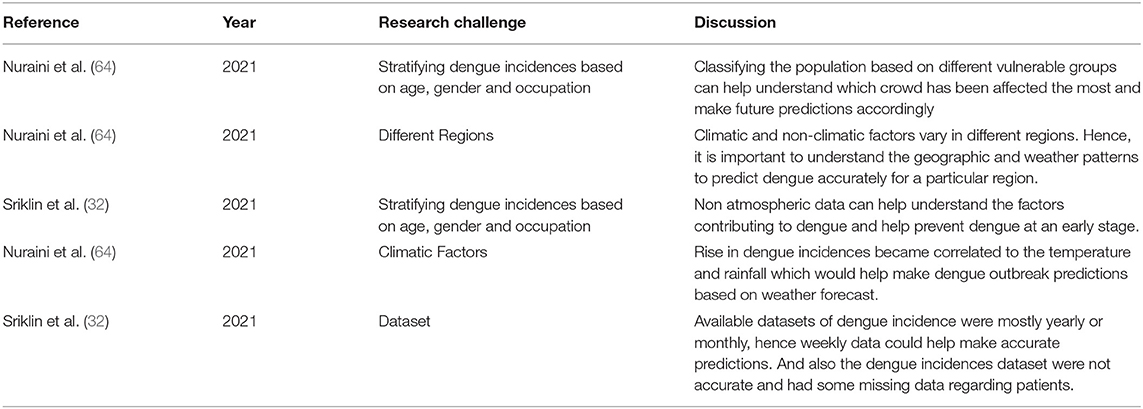
Table 3. Research challenges.
5. Conclusion and Future Enhancements
A systematic literature review was conducted on predicting dengue based on climatic change using machine learning techniques. The main objective was to understand the research and studies that have been carried in building a dengue outbreak prediction model. Forty articles were chosen and analyzed to determine the state-of-the-art from many scientific libraries. The results of the review represent that dengue modeling is continuously growing. Logistic Regression, LASSO Regression, and Support Vector Machine approaches were the most commonly used diagnostic models. Because of their ease of implementation and interpretation, they are the most widely used modeling techniques. Although alternative strategies, such as decision trees, are simple to understand, they have a large number of nodes and take a significant amount of mental work to comprehend a specific forecast. These models, on the other hand, are just a set of coefficients, which makes it appealing to learn about the impact of attributes on the predictor variable. Furthermore, continuous independent variables do not have a normal distribution, and continuous and discrete predictors can be used in the regression. In terms of feature types, climate data was the most commonly used in these models. Dengue incidence data of patients is not readily available through APIs, which has been a restriction in many studies and should be considered for future work by forecasting dengue incidence for sensitive groups such as the age and gender of patients. The examined articles had several flaws, including the lack of documentation of the pre-processing procedures employed, the unavailability of patient data, and incomplete data. Following the review of the papers' strengths and shortcomings, future research projects were identified: i) using microclimatic parameters such as wind speed, air pressure, or vegetation index, ii) using demographic and socioeconomic aspects, iii) exploring climatic conditions in different places, iv) using vector density data, and v) taking vaccination drives into account when building a prediction model. Forecasting the future of dengue fever in the context of climate change can assist governments and public health professionals in implementing timely and preventative steps to protect people from dengue in the future. To sum up, climate change is creating an alarming situation affecting many sectors. Dengue has been a reason of concern for a long time. Hence, monitoring the fluctuations of weather patterns can aid in creating a dengue surveillance system that would be of great help to the health sector in taking preventive measures well in advance.
Data Availability Statement
The original contributions presented in the study are included in the article/supplementary material, further inquiries can be directed to the corresponding author.
Author Contributions
SPat, SPan, and DB: conceptualization. SB, QI, and SI: funding acquisition. DB and SPat: investigation and methodology, writing of the original draft, and data curation. SB: project administration and visualization. QI and SI: resources and supervision. SPan and SB: writing of the review and editing. SPan: validation. All authors contributed to the article and approved the submitted version.
Funding
This work was supported by the Deanship of Scientific Research, Vice Presidency for Graduate Studies and Scientific Research, King Faisal University, Saudi Arabia (Project no. GRANT 268).
Conflict of Interest
The authors declare that the research was conducted in the absence of any commercial or financial relationships that could be construed as a potential conflict of interest.
Publisher's Note
All claims expressed in this article are solely those of the authors and do not necessarily represent those of their affiliated organizations, or those of the publisher, the editors and the reviewers. Any product that may be evaluated in this article, or claim that may be made by its manufacturer, is not guaranteed or endorsed by the publisher.
References
1. Parashar G, Chaudhary A, Rana A. Systematic mapping study of AI/machine learning in healthcare and future directions. SN Comput Sci. (2021) 2:1–8. doi: 10.1007/s42979-021-00848-6
2. Raisch S, Krakowski S. Artificial intelligence and management: the automation-augmentation paradox. Acad Manag Rev. (2021) 46:192–210. doi: 10.5465/amr.2018.0072
3. Galaz V, Centeno MA, Callahan PW, Causevic A, Patterson T, Brass I, et al. Artificial intelligence, systemic risks, and sustainability. Technol Soc. (2021) 67:101741. doi: 10.1016/j.techsoc.2021.101741
4. Dixit P, Payal M, Dutt V, Tuteja A. A review of machine learning approaches in clinical healthcare. Intell Healthcare. (2021) 113:243–58. doi: 10.1007/978-3-030-67051-1_15
5. Sunarti S, Rahman FF, Naufal M, Risky M, Febriyanto K, Masnina R. Artificial intelligence in healthcare: opportunities and risk for future. Gaceta Sanitaria. (2021) 35:S67–70. doi: 10.1016/j.gaceta.2020.12.019
6. Kiener M. Artificial intelligence in medicine and the disclosure of risks. Ai & Society. (2021) 36:705–13. doi: 10.1007/s00146-020-01085-w
8. Iwendi C, Huescas C, Chakraborty C, Mohan S. COVID-19 health analysis and prediction using machine learning algorithms for Mexico and Brazil patients. J Exp Theor Artif Intell. (2022) 1–21. doi: 10.1080/0952813X.2022.2058097
9. Nations U. What Is Climate Change? United Nations. Available online at: https://www.un.org/en/climatechange/what-is-climate-change
10. CDC. Climate Effects on Health. CDC (2021). Available online at: https://www.cdc.gov/climateandhealth/effects/default.htm.
11. Ebi KL, Nealon J. Dengue in a changing climate. Environ Res. (2016) 151:115–23. doi: 10.1016/j.envres.2016.07.026
12. Christophrs SS. Aëdes aegyptì (L.) the yellow fever mosquito; its life history, bionomics and structure. Aëdes aegyptì (L) the yellow fever mosquito; its life history, bionomics and structure (1960).
13. Wilke ABB, Vasquez C, Carvajal A, Medina J, Chase C, Cardenas G, et al. Proliferation of Aedes aegypti in urban environments mediated by the availability of key aquatic habitats. Sci Rep. (2020) 10:1–10. doi: 10.1038/s41598-020-69759-5
14. WHO. Dengue and Severe Dengue. Available online at: https://www.who.int/news-room/fact-sheets/detail/dengue-and-severe-dengue.
15. Xavier LL, Honório NA, Pessanha JFM, Peiter PC. Analysis of climate factors and dengue incidence in the metropolitan region of Rio de Janeiro, Brazil. PLoS ONE. (2021) 16:e0251403. doi: 10.1371/journal.pone.0251403
16. Duarte JL, Diaz-Quijano FA, Batista AC, Giatti LL. Climatic variables associated with dengue incidence in a city of the Western Brazilian Amazon region. Rev Soc Bras Med Trop. (2019) 52:e20180429. doi: 10.1590/0037-8682-0429-2018
17. Kakarla SG, Caminade C, Mutheneni SR, Morse AP, Upadhyayula SM, Kadiri MR, et al. Lag effect of climatic variables on dengue burden in India. Epidemiol Infect. (2019) 147:e170. doi: 10.1017/S0950268819000608
18. Arcari P, Tapper N, Pfueller S. Regional variability in relationships between climate and dengue/DHF in Indonesia. Singap J Trop Geogr. (2007) 28:251–72. doi: 10.1111/j.1467-9493.2007.00300.x
19. Ong YY, Tan GE. Climate Variability and Dengue in Singapore, Fiji, and Hong Kong: Small Bite, Big Threat. London: SAGE Publications Sage UK.
20. Promprou S, Jaroensutasinee M, Jaroensutasinee K. Climatic factors affecting dengue Haemorrhagic fever incidence in southern Thailand (2005).
21. Bhatt S, Gething PW, Brady OJ, Messina JP, Farlow AW, Moyes CL, et al. The global distribution and burden of dengue. Nature. (2013) 496:504–7. doi: 10.1038/nature12060
22. Climate change health. Available online at: https://www.who.int/news-room/fact-sheets/detail/climate-change-and-health.
23. Li C, Wu X, Sheridan S, Lee J, Wang X, Yin J, et al. Interaction of climate and socio-ecological environment drives the dengue outbreak in epidemic region of China. PLoS Negl Trop Dis. (2021) 15:e0009761. doi: 10.1371/journal.pntd.0009761
24. Wu PC, Guo HR, Lung SC, Lin CY, Su HJ. Weather as an effective predictor for occurrence of dengue fever in Taiwan. Acta Trop. (2007) 103:50–57. doi: 10.1016/j.actatropica.2007.05.014
25. Wong PF, Wong LP, AbuBakar S. Diagnosis of severe dengue: challenges, needs and opportunities. J Infect Public Health. (2020) 13:193–8. doi: 10.1016/j.jiph.2019.07.012
26. Laboratory Diagnosis and Diagnostic Tests - Dengue - NCBI Bookshelf. Available online at: https://www.ncbi.nlm.nih.gov/books/NBK143156/
27. Biggs JR, Sy AK, Sherratt K, Brady OJ, Kucharski AJ, Funk S, et al. Estimating the annual dengue force of infection from the age of reporting primary infections across urban centres in endemic countries. BMC Med. (2021) 19:217. doi: 10.1186/s12916-021-02101-6
28. Islam S, Haque CE, Hossain S, Hanesiak J. Climate variability, dengue vector abundance and dengue fever cases in dhaka, bangladesh: a time-series study. Atmosphere. (2021) 12:905. doi: 10.3390/atmos12070905
29. Jannat-Khah DP, Unterbrink M, McNairy M, Pierre S, Fitzgerald DW, Pape J, et al. Treating loss-to-follow-up as a missing data problem: a case study using a longitudinal cohort of HIV-infected patients in Haiti. BMC Public Health. (2018) 18:1–11. doi: 10.1186/s12889-018-6115-0
30. Mello-Román JD, Mello-Román JC, Gómez-Guerrero S, García-Torres M. Predictive models for the medical diagnosis of dengue: a case study in paraguay. Comput Math Methods Med. (2019) 2019:7307803. doi: 10.1155/2019/7307803
31. Alkhaldy I. Modelling the association of dengue fever cases with temperature and relative humidity in Jeddah, Saudi Arabi'a generalised linear model with break-point analysis. Acta Trop. (2017) 168:9–15. doi: 10.1016/j.actatropica.2016.12.034
32. Sriklin T, Kajornkasirat S, Puttinaovarat S. Dengue transmission mapping with weather-based predictive model in three southernmost provinces of thailand. Sustainability. (2021) 13:6754. doi: 10.3390/su13126754
33. Lowe R, Lee SA, O'Reilly KM, Brady OJ, Bastos L, Carrasco-Escobar G, et al. Combined effects of hydrometeorological hazards and urbanisation on dengue risk in Brazil: a spatiotemporal modelling study. The Lancet Planetary health. (2021) 5:e209–19. doi: 10.1016/S2542-5196(20)30292-8
34. Mudele O, Frery AC, Zanandrez LFR, Eiras AE, Gamba P. Dengue vector population forecasting using multisource earth observation products and recurrent neural networks. IEEE J Select Top Appl Earth Observat Remote Sens. (2021) 14:4390–404. doi: 10.1109/JSTARS.2021.3073351
35. Islam MZ, Rutherford S, Dung Phung M, Uzzaman N, Baum S, Huda MM, et al. Correlates of climate variability and dengue fever in two metropolitan cities in bangladesh. Cureus. (2018) 10:e3398. doi: 10.7759/cureus.3398
37. Zar JH. Significance testing of the spearman rank correlation coefficient. J Am Stat Assoc. (1972) 67:578–80. doi: 10.1080/01621459.1972.10481251
38. Bal S, Sodoudi S. Modeling and prediction of dengue occurrences in Kolkata, India, based on climate factors. Int J Biometeorol. (2020) 64:1379–91. doi: 10.1007/s00484-020-01918-9
39. Sánchez-Hernández D, Aguirre-Salado CA, Sánchez-Díaz G, Aguirre-Salado AI, Soubervielle-Montalvo C, Reyes-Cárdenas O, et al. Modeling spatial pattern of dengue in North Central Mexico using survey data and logistic regression. Int J Environ Health Res. (2019) 31:872–88. doi: 10.1080/09603123.2019.1700938
40. Pley C, Evans M, Lowe R, Montgomery H, Yacoub S. Digital and technological innovation in vector-borne disease surveillance to predict, detect, and control climate-driven outbreaks. Lancet Planetary Health. (2021) 5:e739–45. doi: 10.1016/S2542-5196(21)00141-8
41. Tanawi IN, Vito V, Sarwinda D, Tasman H, Hertono GF. support vector regression for predicting the number of dengue incidents in DKI Jakarta. Procedia Comput Sci. (2021) 179:747–53. doi: 10.1016/j.procs.2021.01.063
42. Iwendi C, Bashir AK, Peshkar A, Sujatha R, Chatterjee JM, Pasupuleti S, et al. COVID-19 patient health prediction using boosted random forest algorithm. Front Public Health. (2020) 8:357. doi: 10.3389/fpubh.2020.00357
44. Garge NR, Bobashev G, Eggleston B. Random forest methodology for model-based recursive partitioning: the mobForest package for R. BMC Bioinformatics. (2013) 14:1–8. doi: 10.1186/1471-2105-14-125
45. Micanaldo FE, Carvajal TM, Ryo M, Nukazawa K, Amalin DM, Watanabe K. Dengue disease dynamics are modulated by the combined influences of precipitation and landscape: a machine learning approach. Sci Total Environ. (2021) 792:148406. doi: 10.1016/j.scitotenv.2021.148406
46. Pirkle CM, Wu YY, Zunzunegui MV, Gómez JF. Model-based recursive partitioning to identify risk clusters for metabolic syndrome and its components: findings from the International Mobility in Aging Study. BMJ Open. (2018) 8:e018680. doi: 10.1136/bmjopen-2017-018680
47. Iwendi C, Mahboob K, Khalid Z, Javed AR, Rizwan M, Ghosh U. Classification of COVID-19 individuals using adaptive neuro-fuzzy inference system. Multimedia Syst. (2021) 1–15. doi: 10.1007/s00530-021-00774-w
48. Scavuzzo JM, Trucco F, Espinosa M, Tauro CB, Abril M, Scavuzzo CM, et al. Modeling Dengue vector population using remotely sensed data and machine learning. Acta Trop. (2018) 185:167–75. doi: 10.1016/j.actatropica.2018.05.003
49. Cheng J, Bambrick H, Frentiu FD, Devine G, Yakob L, Xu Z, et al. Extreme weather events and dengue outbreaks in Guangzhou, China: a time-series quasi-binomial distributed lag non-linear model. Int J Biometeorol. (2021) 65:1033–42. doi: 10.1007/s00484-021-02085-1
50. Meng H, Xiao J, Liu T, Zhu Z, Gong D, Kang M, et al. The impacts of precipitation patterns on dengue epidemics in Guangzhou city. Int J Biometeorol. (2021) 65:1929–37. doi: 10.1007/s00484-021-02149-2
51. Shashvat K, Basu R, Bhondekar AP. Application of time series methods for dengue cases in North India (Chandigarh). J Public Health. (2019) 29:433–41. doi: 10.1007/s10389-019-01136-7
52. Guo P, Liu T, Zhang Q, Wang L, Xiao J, Zhang Q, et al. Developing a dengue forecast model using machine learning: a case study in China. PLoS Negl Trop Dis. (2017) 11:e0005973. doi: 10.1371/journal.pntd.0005973
53. Wu W, Ren H, Lu L. Increasingly expanded future risk of dengue fever in the Pearl River Delta, China. PLoS Negl Trop Dis. (2021) 15:e0009745. doi: 10.1371/journal.pntd.0009745
54. Withanage GP, Viswakula SD, Nilmini Silva Gunawardena YI, Hapugoda MD. A forecasting model for dengue incidence in the District of Gampaha, Sri Lanka. Parasites Vectors. (2018) 11:1–10. doi: 10.1186/s13071-018-2828-2
55. Yavari Nejad F, Varathan KD. Identification of significant climatic risk factors and machine learning models in dengue outbreak prediction. BMC Med Inform Decis Mak. (2021) 21:141. doi: 10.1186/s12911-021-01493-y
56. Sang S, Gu S, Bi P, Yang W, Yang Z, Xu L, et al. Predicting unprecedented dengue outbreak using imported cases and climatic factors in Guangzhou, 2014. PLoS Negl Trop Dis. (2015) 9:e0003808. doi: 10.1371/journal.pntd.0003808
57. Raizada S, Mala S, Shankar A. Vector-Borne Disease Outbreak Prediction Using Machine Learning Techniques. In: Prakash KB, Kannan R, Alexander SA, Kanagachidambaresan GR, editors. Cham: Springer International Publishing (2021). p. 227–41.
58. Yajid MZM, Dom NC, Camalxaman SN, Nasir RA. Spatial-temporal analysis for identification of dengue risk area in Melaka Tengah district. Geocarto Int. (2019) 35:1570–9. doi: 10.1080/10106049.2019.1581265
59. Shabbir A, Shabbir M, Javed AR, Rizwan M, Iwendi C, Chakraborty C. Exploratory data analysis, classification, comparative analysis, case severity detection, and internet of things in COVID-19 telemonitoring for smart hospitals. J Exp Theor Artif Intell. (2022) p. 1-28. doi: 10.1080/0952813X.2021.1960634
60. Lee HS, Nguyen-Viet H, Nam VS, Lee M, Won S, Duc PP, et al. Seasonal patterns of dengue fever and associated climate factors in 4 provinces in Vietnam from 1994 to (2013). BMC Infect Dis. (2017) 17:1–9. doi: 10.1186/s12879-017-2326-8
61. Erraguntla M, Dave D, Zapletal J, Myles K, Adelman ZN, Pohlenz TD, et al. Predictive model for microclimatic temperature and its use in mosquito population modeling. Sci Rep. (2021) 11:1–11. doi: 10.1038/s41598-021-98316-x
62. Wu CH, Kao SC. Knowledge discovery in open data for epidemic disease prediction. Health Policy Technol. (2021) 10:126–34. doi: 10.1016/j.hlpt.2021.01.001
63. Espinoza-Gomez F, Newton-Sanchez OA, Nava-Zavala AH, Zavala-Cerna MG, Rojas-Larios F, Delgado-Enciso I, et al. Demographic and climatic factors associated with dengue prevalence in a hyperendemic zone in Mexico: an empirical approach. Trans R Soc Trop Med Hyg. (2021) 115:63–73. doi: 10.1093/trstmh/traa083
64. Nuraini N, Fauzi IS, Fakhruddin M, Sopaheluwakan A, Soewono E. Climate-based dengue model in Semarang, Indonesia: Predictions and descriptive analysis. Infect Dis Model. (2021) 6:598–611. doi: 10.1016/j.idm.2021.03.005
65. Gao Q, Liu Z, Xiang J, Tong M, Zhang Y, Wang S, et al. Forecast and early warning of hand, foot, and mouth disease based on meteorological factors: Evidence from a multicity study of 11 meteorological geographical divisions in mainland China. Environ Res. (2021) 192:110301. doi: 10.1016/j.envres.2020.110301
66. Chen Y, Ong JHY, Rajarethinam J, Yap G, Ng LC, Cook AR. Neighbourhood level real-time forecasting of dengue cases in tropical urban Singapore. BMC Med. (2018) 16:129. doi: 10.1186/s12916-018-1108-5
67. Colón-González FJ, Fezzi C, Lake IR, Hunter PR. The effects of weather and climate change on dengue. PLoS Negl Trop Dis. (2013) 7:e2503. doi: 10.1371/journal.pntd.0002503
Keywords: predictive models, machine learning, surveillance system, dengue, climatic factors
Citation: Bhatia S, Bansal D, Patil S, Pandya S, Ilyas QM and Imran S (2022) A Retrospective Study of Climate Change Affecting Dengue: Evidences, Challenges and Future Directions. Front. Public Health 10:884645. doi: 10.3389/fpubh.2022.884645
Received: 26 February 2022; Accepted: 26 April 2022;
Published: 27 May 2022.
Edited by:
Celestine Iwendi, School of Creative Technologies University of Bolton, United KingdomReviewed by:
Suyel Namasudra, Universidad Internacional de La Rioja, SpainJude Osamor, Glasgow Caledonian University, United Kingdom
Praise Young, Nnamdi Azikiwe University, Nigeria
Copyright © 2022 Bhatia, Bansal, Patil, Pandya, Ilyas and Imran. This is an open-access article distributed under the terms of the Creative Commons Attribution License (CC BY). The use, distribution or reproduction in other forums is permitted, provided the original author(s) and the copyright owner(s) are credited and that the original publication in this journal is cited, in accordance with accepted academic practice. No use, distribution or reproduction is permitted which does not comply with these terms.
*Correspondence: Surbhi Bhatia, c2JoYXRpYUBrZnUuZWR1LnNh