 Rajesh Kumar Chaurasia
 Kapil B. Shirsath1
 Utkarsha N. Desai
 Nagesh N. Bhat
 B. K. Sapra
94% of researchers rate our articles as excellent or good
Learn more about the work of our research integrity team to safeguard the quality of each article we publish.
Find out more
ORIGINAL RESEARCH article
Front. Public Health, 08 August 2022
Sec. Radiation and Health
Volume 10 - 2022 | https://doi.org/10.3389/fpubh.2022.845200
This article is part of the Research TopicDeveloping Novel Materials and New Techniques of Biological and Physical Retrospective Dosimetry for Affected Individuals in Radiological and Nuclear EmergenciesView all 8 articles
A rapid and reliable method for biodosimetry of populations exposed to ionizing radiation in the event of an incident or accident is crucial for initial triage and medical attention. DNA-double strand breaks (DSBs) are indicative of radiation exposure, and DSB-repair proteins (53BP1, γH2AX, ATM, etc.) are considered sensitive markers of DSB quantification. Phospho-53BP1 and γH2AX immunofluorescence technique serves as a sensitive, reliable, and reproducible tool for the detection and quantification of DSB-repair proteins, which can be used for biological dose estimations. In this study, dose-response curves were generated for 60Co-γ-rays induced phospho-53 Binding Protein 1 (phospho-53BP1) foci at 1, 2, 4, 8, 16, and 24 h, post-irradiation for a dose range of 0.05–4 Gy using fluorescence microscopy. Following ISO recommendations, minimum detection limits (MDLs) were estimated to be 16, 18, 25, 40, 50, and 75 mGy for dose-response curves generated at 1, 2, 4, 8, 16, and 24 h post-irradiation. Colocalization and correlation of phospho-53BP1 and γH2AX were also measured in irradiated peripheral blood lymphocytes (PBLs) to gain dual confirmation. Comparative evaluation of the established curve was made by γH2AX-immunofluorescence, dicentric chromosome assay (DCA), and reciprocal translocation (RT) assays by reconstructing the dose of 6 dose-blinded samples. Coefficients of respective in-house established dose-response curves were employed to reconstruct the blind doses. Estimated doses were within the variation of 4.124%. For lower doses (0.052 Gy), phospho-53BP1 and γH2AX assays gave closer estimates with the variation of −4.1 to + 9% in comparison to cytogenetic assays, where variations were −8.5 to 24%. For higher doses (3 and 4 Gy), both the cytogenetic and immunofluorescence (phospho-53BP1 and γH2AX), assays gave comparable close estimates, with −11.3 to + 14.3% and −10.3 to −13.7%, variations, respectively.
Biodosimetry is known to play a decision-making role to predict prognosis, determine the severity of the case(s), and help subsequent preparation of medical attention, in both planned and unplanned radiation exposures (1). Physical dosimeters like thermoluminescent dosimeters (TLD) and optically stimulated luminescent dosimeters (OSLD) are in practice for dosimetry of occupational radiation workers for long, though, the genuineness of excessive exposures is still ascertained by biodosimetry (2–4). There are various established biodosimetry tools, which can be employed in different scenarios of radiation exposures, for instance, acute (large dose, received in a short period of time) and chronic (sum of small doses received repeatedly, over long durations) radiation exposures. Radiation workers are prone to receive a chronic dose. Acute exposure could be either due to nuclear terrorism (involving, radiation exposure devices, radiation dispersal devices, and improvised nuclear devices) or due to accidents involving nuclear reactor and/or loss or mishandling of radioactive sources. No single biodosimetry tool is known, which can be reliably employed for biodosimetry in all scenarios of radiation exposures. Dicentric chromosome, micronucleus, and translocation assays can be employed for dosimetry of acute exposures, and reciprocal translocation assay is preferred for dosimetry of chronic exposures (5, 6). Dicentric chromosomes are radiation-specific and DCA is considered the gold standard assay for biodosimetry. Micronucleus is not radiation specific, though easy to quantify, and is considered as a method of choice when radiation specificity is not of prime importance (1, 5, 6). With a multi-parametric approach, multiple biological dosimetry methods, mutually supporting the outcomes of each technique, help to draw better scientific conclusions. Hence, it is necessary to establish multiple biological indicators of radiation exposure.
Predominantly, cytogenetic tools like dicentrics and translocations are still in regular practice for dosimetry of occupational radiation workers for regulatory purposes and management of radiological incidents. Dicentrics are categorized as unstable chromosome aberrations. Cells bearing dicentrics progress in the cell cycle to enter mitosis and it has been demonstrated that the number of dicentric chromosomes decreases by about 50% per cell division (7, 8). DCA is the best assay to be employed within a few months after exposure, if the dose is in the range of 0.1–5.0 Gy (whole body exposure) (9). Translocations are categorized as mitotically stable types of chromosome aberrations and represent the method of choice for retrospective biological dosimetry in the dose range of 0.25–4.0 Gy (whole-body exposure) (7, 10). It is a method of choice for past and cumulative dosimetry, up to several years to decades (9). In spite of such remarkable attributes, cytogenetic assays have some limitations for dosimetry of radiological emergencies and/or medical exposures, such as the long and laborious analysis (as cell culturing is obligatory), high MDLs of the assays, and the requirement of experienced technicians to analyze and score aberrations (9, 11).
DSB-repair proteins such as γH2AX, 53BP1, and ATM have gradually sought much attention and are evolving as a potent indicator for rapid biodosimetry. DSBs are frequently induced by radiation exposures; they are created as a result of two single-strand breaks formed on the opposite strands, in the close vicinity, typically in the range of 10–20 base pairs (12, 13). Immediately, after the formation of DSBs, the cell initiates the DNA damage response (DDR), in which signaling molecules like γH2AX, ataxia-telangiectasia-mutated (ATM) protein, ataxia-telangiectasia and rad3-related protein (ATR), and DNA-dependent protein kinase (DNAPKs) are crucial protein players. Minor histone variant, H2AX, gets phosphorylated at ser-139, immediately after DSB formation, in megabase ranges around the DSBs. The 53 Binding Protein 1 (53BP1) is a conserved, check-point protein, which can sense DNA–DSBs, and it gets recruited at the site of DSBs (14–18). Localization of γH2AX and phospho-53BP1 proteins at the site of DSBs can be visualized microscopically as distinct foci in the nuclear region. Certain other DDR proteins like phosphorylated-ATM, Mre11, and NBS1 exhibit similar characteristics and can be explored as an indicator of radiation exposure (19, 20). Phospho-53BP1 and γH2AX assays have emerged as a very sensitive, reliable, and reproducible method for the detection and quantification of DSBs (21). Besides radiological, occupational, and emergency biodosimetry applications, both cytogenetic indicators and phospho-53BP1 and γH2AX assays can serve as reliable tools for clinical applications, such as determination of radio-sensitivity and/or clinical estimation of scattered dose or bone marrow dose in therapeutic and diagnostic applications. In particular, in a few interventional and diagnostic applications, the doses are considerably lower than the MDLs of cytogenetic assays. The added advantage of the possibility of controlled collection of the blood sample after the procedure can further enhance the application of γH2AX and phospho-53BP1 foci assays. These assays have extensively been studied for dosimetry of planned exposures in clinical and non-clinical applications and in human and non-human samples (22–26). Unlike cytogenetic assays, γH2AX and phospho-53BP1 foci assays have not been much explored for biodosimetry of radiological incidences (unplanned exposures) involving human exposures. To apply protein markers (53BP1 and γH2AX foci assay) for biodosimetry, it is essential to highlight some inherent and technical limitations of these markers (27–29). Protein markers are short-lived (hours to days) since they disappear on the completion of DSB repair, contrary to cytogenetic markers that can be detected months and even years after radiation exposure (27). Another limitation of protein markers is the loss of linearity with dose due to overlapping of foci at higher doses (>2 Gy, at 30 min) (28): for accurate measurement of foci, overlapping of foci should not exceed 20% (29). Nevertheless, the sensitivity of protein markers is greater than any other established biodosimetry marker (21).
Biodosimetry Laboratory at Bhabha Atomic Research Center (BARC), the central facility in India, acts as a reference laboratory for the biodosimetry network established in the country. Dose-response curves generated act as a national standard and serve as a reference calibration curve for the other biodosimetry laboratories present in the national network. We are also in the process to extend this network with national and international laboratories.
The study was designed to (1) measure the background levels of phospho-53BP1 foci in the blood sample of 5 volunteers (age range 22–35 y) by immunofluorescence assay, (2) analyze ex vivo decay kinetics for the dose points 0, 1, 2, 3, and 4 Gy up to 24 h post-irradiation, (3) generate dose-response curves for 60Co-γ-rays (0–4 Gy)-induced phospho-53BP1 foci at 1, 2, 4, 8, 16, and 24 h post-irradiation, (4) estimate MDLs for all 6 dose-response curves, following ISO recommendations (30). Moreover, comparative evaluation of immunofluorescence (phospho-53BP1 and γH2AX) and cytogenetic assays (dicentrics and reciprocal translocations) was performed by reconstructing the dose of 6 dose-blinded samples.
The research proposal was approved by the institutional ethical committee (Bhabha Atomic Research Center, Medical Division, BARC). The project was executed following all the ethical guidelines provided. Five healthy volunteers, two females designated as V1 and V2 with ages 22 y and 24 y, and 3 males designated as, V3, V4, and V5 with ages, 25, 31, and 35 y were recruited to this study. None of the volunteers had any history of exposure to ionizing radiation or any other clastogenic agents such as smoking and alcohol consumption. A total of 25 ml blood sample was obtained in heparinized vacutainer tubes from each volunteer by puncturing the cubital vein by an expert phlebotomist.
Peripheral blood lymphocytes s were prepared from whole-blood sample by density gradient centrifugation using Histopaque-1077 (Sigma-Aldrich, USA) following the manufacturer's protocol with some modifications (31). In short, after 1:1 dilution with HBSS (Gibco Life Technologies, USA), blood samples were slowly and steadily layered on the top of the histopaque in fresh centrifuge tubes. Tubes were gently loaded and centrifuged at 2,500 rpm for 25 min at room temperature. Buffy coat layer was gently withdrawn from each tube and resuspended in RPMI (cell density 1 million/ml; Gibco Life Technologies, USA) without serum after two brief washes with RPMI. Lymphocyte suspensions were aliquoted in fresh centrifuge tubes (0.5 ml/tube) and were irradiated with 60C0-γ-rays in the dose range of 0.05–4.0 Gy using Blood Irradiator-2000, manufactured and supplied by the Board of Radiation & Isotope Technology (BRIT), DAE, India. All the irradiations were carried out at the dose rate of 1 Gy/min.
Following irradiation, lymphocyte suspensions were kept in ice until reaching the laboratory to reduce the pace of DNA repair. After receipt at the laboratory, cell suspensions were supplemented with 15% FCS (Gibco Life Technologies, USA) and were incubated for various incubation times (described below) in optimum conditions (5% CO2, 95% relative humidity, and 37°C temperature). Following incubation, cells were fixed with an equal volume of 4% paraformaldehyde (Gibco Life Technologies, USA; final working concentration of 2%) at 4°C for 30 min. Fixed cells were immunofluorescence-stained for the detection of phospho-53BP1 following our earlier established γH2AX protocol with some modification (32, 33). In short, fixed cell suspensions were spotted on 22 × 22 poly L-lysine (Sigma-Aldrich, USA) coated cover glasses and were allowed to adhere to the cover glasses for 1 h in a humidified chamber. Unattached cells were washed off with 1X PBS. Cells were permeabilized with detergent, 0.5% Triton X-100 (Gibco Life Technologies, USA) in PBS for 5 min and washed 3 times (5 min each) with PBS to remove remnants of detergent completely. Blocking was carried out with 5% FCS for 1 h in a humidified chamber and no washing was given afterward. A total of 50 μl of rabbit anti-phospho 53BP1 human monoclonal IgG (primary antibody; Cell Signaling Technology, Massachusetts, USA) with a dilution of 1:200 (in PBS with 2% FCS) was applied on each cell bearing cover glass and incubated for 1 h in a humidified chamber. Thereafter, unattached antibodies were washed off with 1X PBS, 3 times, 5 min each (the last wash was with PBST, PBS + 0.1% tween-20). Cells were then treated with Texas red-labeled goat anti-rabbit IgG (secondary antibody; Invitrogen, USA) and incubated in a humidified chamber for 1 h. Unattached antibodies were washed off with 1X PBS 3 times 5 min each [last wash was, with PBST, PBS + 0.1% tween-20 (Sigma-Aldrich, USA)]. Cells were air-dried, mounted with DAPI (Invitrogen, USA) with antifade, and sealed with rubber cement after incubation for 10 min.
Mounted slides were loaded on an automated fluorescence microscope, Axioscope Imager M1 (Carl Zeiss) installed with Metafer 4 software, and scanned for the detection and quantification of phospho-53BP1 foci using a Metacyte classifier at 63X magnification. More than 300 cells (in triplicate) were analyzed per dose point, for each volunteer in an automated mode (detection, capturing, and scoring of foci in each lymphocyte nucleus) to estimate foci yield per dose point per individual. Manual verifications were made for a few randomly selected dose points, and no statistically significant differences (p < 0.05, t-test) were observed in manual vs. automated scorings.
More than 300 PBLs were analyzed to score the background frequency of phospho-53BP1 foci in each sample (five individuals with triplicate sampling, total 15 samples). In total > 4,500 PBLs were scored.
The decay kinetics of phospho-53BP1 foci were studied in the blood sample of all 5 volunteers (details mentioned in Section Ethical approval, volunteer selection, and blood collection) for acute doses of 0, 1, 2, 3, and 4 Gy. For each set of experiments (per dose point), isolated PBLs were aliquoted into 6 parts (1 million per aliquot) and incubated in optimum conditions (5% CO2, 95% relative humidity, and 37°C temperature) for 1, 2, 4, 8, 16, and 24 h after irradiation. Following the given period of incubation, samples were fixed with 2% PFA and processed by immunofluorescence for the detection and quantification of phospho-53BP1 foci, as described above. Triplicate blood sampling and processing were carried out per dose point, per volunteer, for each incubation time.
Dose-response curves were generated with the blood samples of all five volunteers (V1–V5, details described above) after 1, 2, 4, 8, 16, and 24 h of incubation, post-irradiation (dose range 0.05–4 Gy). Irradiation, post-irradiation incubation, immuno-fluorescence staining, scanning, and scoring of phospho-53BP1 foci were carried out as described above.
The same antibodies and procedures mentioned in Section Immunofluorescence staining, imaging, and scoring of phospho-53BP1 foci were employed for the co-staining of phospho-53BP1 and γH2AX proteins (32). Imaging was carried out under 3 filters, blue (DAPI), red (Alexa Fluor 594), and green (FITC 488), for nucleus, phospho-53BP1, and γH2AX, respectively.
To validate established 60Co-γ-rays-induced phospho-53BP1 dose-response curves, a volunteer (male, age 27 y) was recruited who was not part of the dose-response curve study. Objectives were explained and ethical consent was obtained from him. A total of 24 ml blood sample was withdrawn from him by a phlebotomist and was equally divided into 6 parts (4 ml each) named Z1–Z6. These samples were irradiated with 60Co-γ-rays at different blinded doses. Following irradiation, all blinded samples were processed for detection and quantification of γH2AX foci, phospho-53BP1 foci, dicentric chromosome assay (DCA), and reciprocal translocations (RT).
Out of 4 ml of blood (of each sample, Z1–Z6), 2 ml was used for the isolation of PBLs for γH2AX and phospho-53BP1 assays. For γH2AX and phospho-53BP1 immuno-fluorescence staining, the same procedure was followed as described above, except that the primary and secondary antibodies were different for γH2AX staining. All blinded samples were fixed and processed for γH2AX and phospho-53BP1 after 1 and 4 h of incubation in optimum conditions (5% CO2, 95% relative humidity, and 37°C temperature) post-irradiation. To estimate the yield, more than 300 cells were analyzed for each blinded sample for γH2AX and phospho-53BP1 independently. Doses were reconstructed following coefficients of dose-response curves generated at 1 and 4 h post-irradiation.
The remaining 2 ml of blood (of each sample, Z1–Z6) was used for DCA and RT. For detection and quantification of dicentrics and reciprocal translocations, whole blood samples were incubated for 3 h in optimum conditions (5% CO2, 95% relative humidity, and 37°C temperature) after irradiation to allow repair to happen and give rise to post-repair events like dicentrics and translocations (34, 35). After incubation, four sets of whole blood cultures were set up for each blinded dose (in total 24 cultures), following our standard protocol (36), optimized as per IAEA and ISO recommendations (9, 30, 37). Cultures were terminated and processed at 52 h of incubation and two slides were prepared per culture. Long-term colcemid (Gibco Life Technologies, USA) treatment (added at 24th h, from culture setup) was given to avoid cells entering into the second cell division cycle (38). Slides were stained with Giemsa (Sigma-Aldrich, USA) for 10 min, rinsed with distilled water, air-dried, and mounted with DPX. Slides were scanned with Axio Imager M1 installed with the software Metafer 4 (Metafer4-V3.9.6) from MetaSystems (Altlusshein, Germany) in a semi-automated mode. Metafer 4 consists of two modules: MSearch to locate metaphases, and Autocapt for automated high-resolution image capturing at 63X magnification. To estimate the yield of dicentrics, more than 500 captured metaphases were analyzed manually per sample, following IAEA and ISO recommendations (9, 37).
Reciprocal chromosomal translocations were analyzed by FISH, using a whole chromosome paint probe (MetaSystems, Germany) for chromosome pairs 1 and 2 (fluorophore FITC for pair 1 and Texas Red for Pair 2) following the manufacturer's protocol with slight modifications (39–41). In brief, slides were first treated with RNase (Thermo Fisher Scientific, USA) and pepsin (Sigma-Aldrich, USA). After that, 16 μl probe (8 + 8, for chromosome pair 1 and 2) was applied to the slides, then covered with glass cover, and sealed with rubber–cement. Denaturation was carried out on a hotplate at 75°C (±1°C) for 3 min. Further, the slides were incubated overnight for hybridization in a humidified chamber at 37°C. After hybridization, rubber cement and coverglasses were removed, followed by a brief rinse in 0.4X SSE at RT. To avoid non-specific binding of the probes, slides were washed with 0.4X SSC at 72°C (±1°C) for 3 min followed by a rinse of 2X SSC containing 0.05% Tween-20 for 2 min. A brief rinse (two times) of distilled water was also given to dissolve and remove salts. Slides were dehydrated with ethanol series (80, 90, and 100%, 1 min each) and air-dried. Finally, slides were mounted in DAPI with antifade and scanned by Axio Imager M1, installed with software, Metafer 4, module ISIS. To estimate the yield of reciprocal translocations, more than 500 captured metaphases were analyzed per sample following IAEA and ISO recommendations (9, 41).
All experiments were carried out in three sets and the generated data were presented as mean ± standard deviation (SD) or mean ± standard error of mean (SEM). Student's t-test was conducted to compare means and determine statistical differences for different doses and time points. The level of significance was set to alpha = 0.05. MDLs were estimated for dose-response curves established at 1, 2, 4, 8, 16, and 24 h incubation after irradiation to ensure estimated doses are significantly higher than 0 at 95% CI. As suggested in ISO standards, 3σ (>99% CL) variation of the background frequency was used to estimate MDLs of all the established calibration curves. Curves were constructed following the least square method.
As illustrated in Figure 1A, the background level of phospho-53BP1 was measured in the PBLs of 5 volunteers. The mean cumulative yield was found to be 0.12 ± 0.057, varying from 0.047 ± 0.026 to 0.187 ± 0.061.
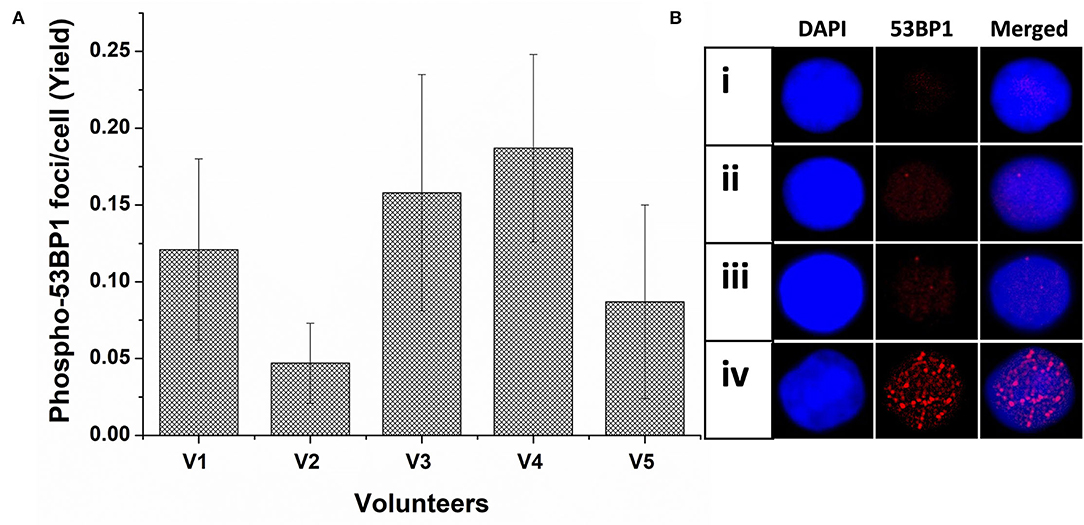
Figure 1. (A) Spontaneous frequency of phospho-53BP1 foci in non-stimulated and unirradiated PBLs of five volunteers (V1-V5). Error bars signify SD (5 × 3 i.e., five individuals with triplicate blood sampling). More than 300 PBLs were analyzed for estimating the spontaneous frequency of phospho-53BP1 in each volunteer. (B) Representative PBLs with (i) no foci (ii) one focus (iii) two foci (iv) numerous foci (could be apoptotic cell).
Among the cells (unirradiated) analyzed, most cells (~91%) were with no foci [Figure 1B(i)] and only a few cells were with foci [~9%, Figure 1B(ii,iii)]. Cells with one focus [~7% cells, Figure 1B(ii)] were predominant in comparison to cells with two foci [~2% Figure 1B(iii)]. None of the cells with ≥ 3 foci/cell were observed. A few cells (<0.6%) were found with numerous, overlapping, and indistinct foci [Figure 1B(iv)], considering them outlier (could be proapoptotic cell), and excluded from the scoring. Morphologically, observed foci were less prominent and smaller in size in comparison to foci induced in radiation-exposed cells.
Following acute exposure of 1, 2, 3, and 4 Gy of 60C0-γ-rays, phospho-53BP1 foci induction, maturation, and pattern of decay was studied in the lymphocyte of 5 volunteers up to a period of 24 h post-irradiation. In total, 15 samples (five volunteers with triplicate sampling) were fixed and immunofluorescence-stained for the detection of phospho-53BP1 after 0, 1, 2, 4, 8, 16, and 24 h of post-irradiation incubation. Figure 2A illustrates the background-corrected yields of phospho-53BP1 foci with standard deviations for all the doses and post-irradiation incubation time points. As reported earlier (14, 42, 43), phospho-53BP1 foci formation attains maturity at ≤ 1 h of incubation post-irradiation; therefore, data were acquired post 1 h incubation after irradiation, up to 24 h. As illustrated in Figure 2A, the yield of phospho-53BP1 foci was found to be rapidly decreasing with increasing incubation time. Statistical analysis demonstrated that the mean yield of irradiated samples was significantly higher (p < 0.05) than the unirradiated sham control, up to 24 h of post-irradiation incubation. The fitted curves corresponding to the experimental data show that after attaining saturation (1 h), the foci decay up to 24 h, followed by a single exponential decay pattern, which followed the mathematical expression Y = A1*exp(-x/t1) + Y0, where, A1, Y0, and K (=1/t1) represent the initial value of the exponential function, initial offset of the fit function, and rate of decay of phospho-53BP1 foci, respectively. A1, Y, and Y0 are expressed in phospho-53BP1 foci/cell, k (1/t1) is expressed in h−1, and X in h. As illustrated in Table 1, constants A1, Y, and Y0 are dose-dependent, which increase with increasing doses. However, constant K is almost independent of the initial dose delivered (i.e., the rate of decay of phospho-53BP1 foci is almost the same for all the doses). The parameter t1 represents the mean life of foci, which reflects the duration after which the number of foci becomes 1/e or 36% of the initial peak number of foci i.e., foci observed at 1 h of incubation after irradiation. The bar charts, illustrated in Figures 2C–H, show the dispersion of the number of foci in PBLs as a function of time after irradiation (1 Gy). For the data obtained at 1 and 2 h post-irradiation, the dispersion index was found to be close to one. Papworth's u-values were −0.89 and 1.54 for 1 and 2 h of incubation post-irradiation, respectively. U-values were within the range of −1.96 to + 1.96, indicating that foci distribution followed the Poisson distribution. Data obtained from 4, 8, 16, and 24 h of incubation post-irradiation showed over-dispersion of the foci (u-values were higher than 1.96).
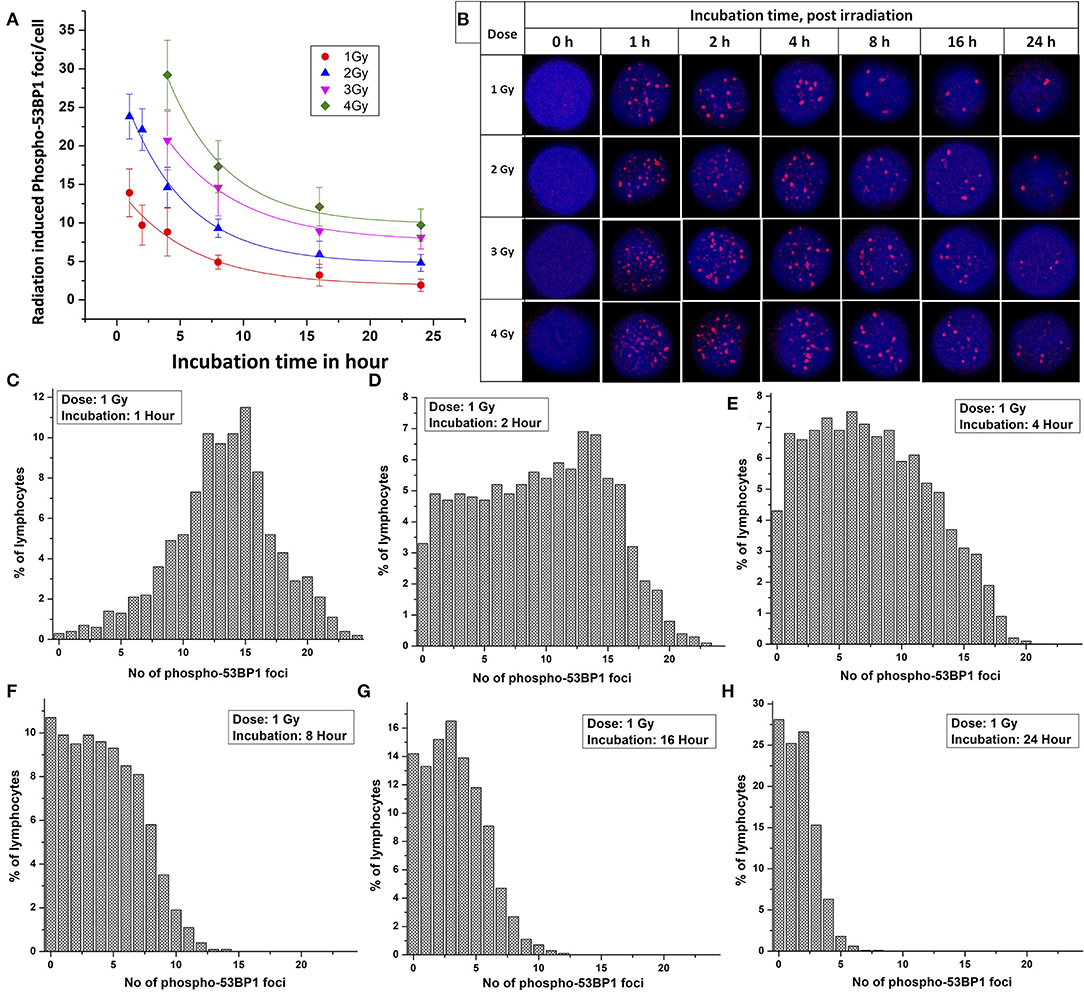
Figure 2. (A) Phospho-53BP1 foci, decay kinetics, in the blood sample of five volunteers [two females (with age 22 and 24 y) and three males (with age 25 y, 31 y and 35 y)] after irradiation with 1, 2, 3, and 4 Gy. Error bars represents SEM (n = 5 × 3, i.e., five volunteers with triplicate sampling). Number of cells analyzed/scored > 300/dose/time point/volunteer. (B) Illustration of the disappearance of phospho-53BP1 foci at 1, 2, 4, 8, 16, and 24 h of incubation after irradiation with 1, 2, 3, and 4 Gy. Dispersion of the number of phospho-53BP1 foci in PBLs irradiated with 1 Gy (cumulative data of all five volunteers) after incubation of (C) 1 h (D) 2 h (E) 4 h (F) 8 h (G) 16 h, and (H) 24 h.
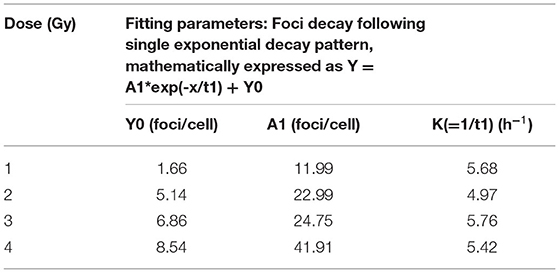
Table 1. Fitting parameters for phospho-53BP1 foci decay for doses 1, 2, 3, and 4 Gy up to 24 h of incubation after irradiation.
As illustrated in Table 2, the comparable half-lives demonstrate that phospho-53BP1 foci decay kinetics, i.e., DSB repair half-lives, are nearly independent of initial doses delivered. This gives an indication of efficient repair of DSBs even at high doses, and that the decay pattern (DSB-repair) follows a Poisson distribution (up to 2 h for 1 and 2 Gy, and up to 4 h for 3 and 4 Gy, u-values were within the range of −1.96 to +1.96).
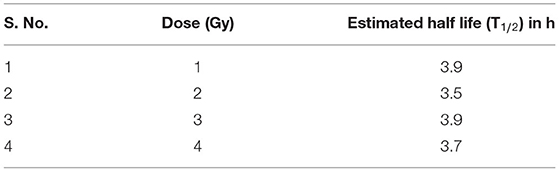
Table 2. Half-lives of phospho-53BP1 foci for doses of 1, 2, 3, and 4 Gy estimated using the formula T1/2 = 0.693*t1.
Dose-response curves were generated for 60C0-γ-rays-induced phospho-53BP1 in the PBLs of all 5 volunteers at 1, 2, 4, 8, 16, and 24 h post irradiation. Isolated PBLs were irradiated with 0, 0.05, 0.1, 0.25, 0.5, 1, 2, 3, and 4 Gy in serum-free RPMI medium and incubated in optimum conditions (5% CO2, 95% relative humidity, and 37°C temperature). Serum was added immediately after irradiation. Since growth factors are liable to radiation-induced denaturation, the presence of serum during irradiation was avoided. For the dose range 0.05–4 Gy, response curves were generated at 4, 8, 16, and 24 h of incubation, post-irradiation. The results of the experiments are plotted in Figures 3A–F. The regression analysis and data plotting were carried out using software OriginLab 9.65. The data were fitted by a linear model of expression Y = αD + C. Since background frequency was subtracted from all the dose and time point data sets, Y-intercept was kept at zero (C = 0).
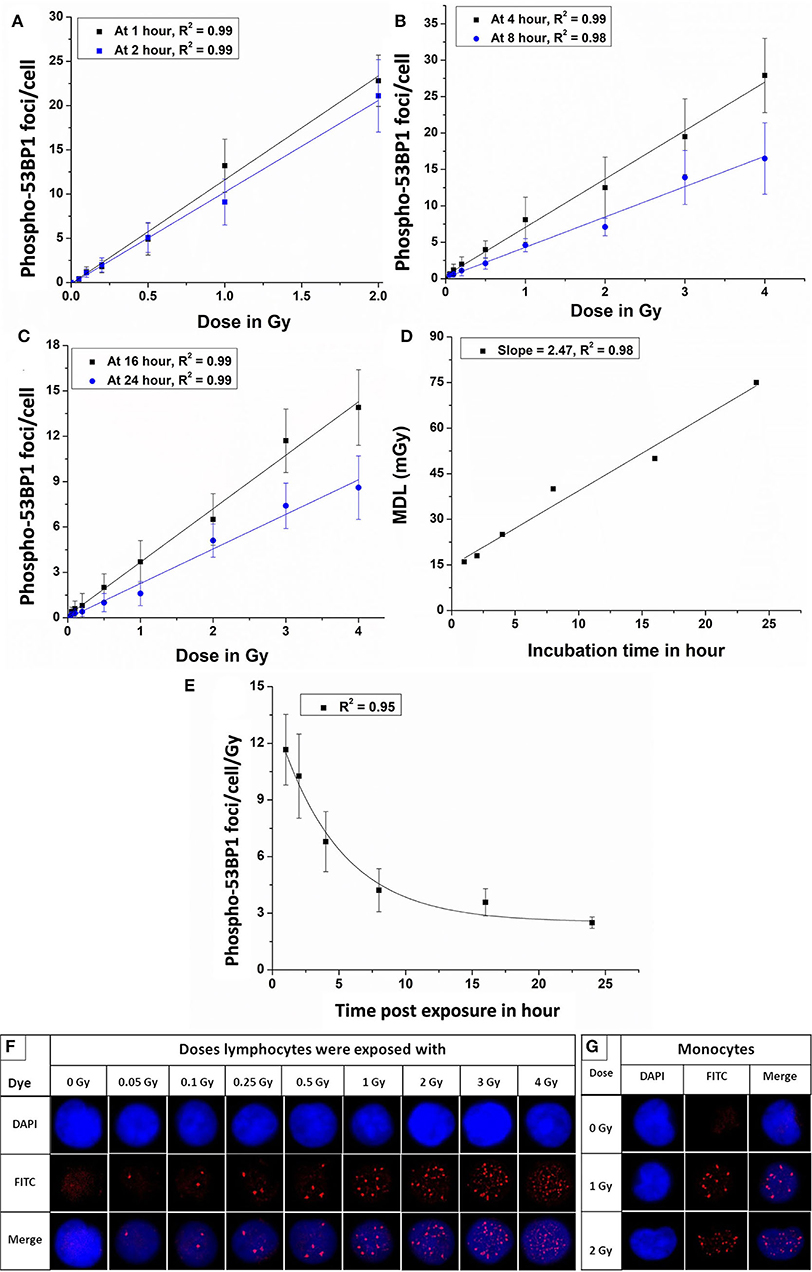
Figure 3. Dose-response curves for 60Co-γ-rays-induced-phospho-53BP1 foci formation post-irradiation incubation of (A) 1 and 2 h (B) 4 and 8 h (C) 16 and 24 h. (D) Estimated minimum detection limits of the dose-response curves established at 1, 2, 4, 8, 16, and 24 h of incubation, following ISO recommendations (3 sigma of the background frequency) (E) Variation of the slope (53BP1 foci/cell/Gy) of the established dose-response curves, generated at 1, 2, 4, 8, 16, and 24 h of incubation, post-irradiation. (F) Microscopic images showing an increasing number of phospho-53BP1 foci in the nucleus of PBLs with increasing doses (0 to 2.0 Gy after 1 h and 3 and 4 Gy after 4 h of incubation, post irradiation). (G) Representative images of monocytes (kidney-shaped nucleus) with and without 53BP1 foci (these cells were excluded from the scoring of 53BP1 foci).
The equations for the linear response curves generated, Figures 3A–C, are given below (after 1, 2, 4, 8, 16, and 24 h of incubation, respectively).
A good linear fit with the correlation coefficient (r) ~ 0.98 or better was observed.
The Equations 1–6 are obtained after fitting the experimental data points shown in Figures 3A–C. These equations can be applied for the estimation of unknown doses and has been applied in Section Comparative Evaluation of Established Response Curves by Phospho-53BP1, γH2AX, Dicentric, and Translocations Assays Using Dose-Blinded Samples.
Figure 3D shows the linear fit of the MDLs of the dose-response curves generated at different incubation time points (1–24 h), post-irradiation.
Figure 3E represents a pattern of change of the slopes (phospho-53BP1 foci per cell per Gy) vs. time post-exposure for 6 dose-response curves generated at 1–24 h post-irradiation. The exponential pattern of decay with the decay constant at 0.34 h−1 is observed. As illustrated in Figure 3F, the number of foci increased with increasing doses. All sets of data were in agreement with Poisson distribution, and Papworth's u-values were found to be ranging from −1.24 to + 0.99. U-values were within the range of −1.96 to +1.96, indicating that the foci distribution was followed the Poisson distribution. For the dose range 0.05–2 Gy, induced foci were distinct and non-overlapping throughout the observation period i.e., 1–24 h, post-irradiation. However, overlapping (indistinguishable foci) of foci were observed in the PBLs irradiated with 3 and 4 Gy with incubation of 1 and 2 h. Therefore, samples with higher doses (3 and 4 Gy) were incubated for longer durations (≥4 h) to allow some DSBs to get repaired, and subsequently the number of foci get reduced to the level of distinguishable range (44, 45). Figure 3G represents monocytes (with kidney-shaped nucleus), and these cells were not taken into account for the scoring of 53BP1 foci in any experiment.
Colocalization of candidate marker proteins of DDR, viz, phospho-53BP1 and γH2AX was studied in human PBLs in the dose range of 0–1 Gy. As illustrated in Figure 4A, γH2AX foci were stained with green, phospho-53BP1 foci were stained with red, and merged foci were combination of green + red (localized in close vicinity). It was observed that both kinds of foci (red and green) were localized in the nuclear region of the PBLs. Enumeration of foci indicated that 76–89% phospho-53BP1 and γH2AX foci were in close vicinity, indicating their colocalization, and the rest of the foci were located physically distant from each other, indicating their non-colocalization. Results exhibited that the number of foci colocalized were dependent on dose as well as the time of incubation post-irradiation. Fraction of colocalization was found to be increasing with the increasing dose and the incubation time after irradiation.
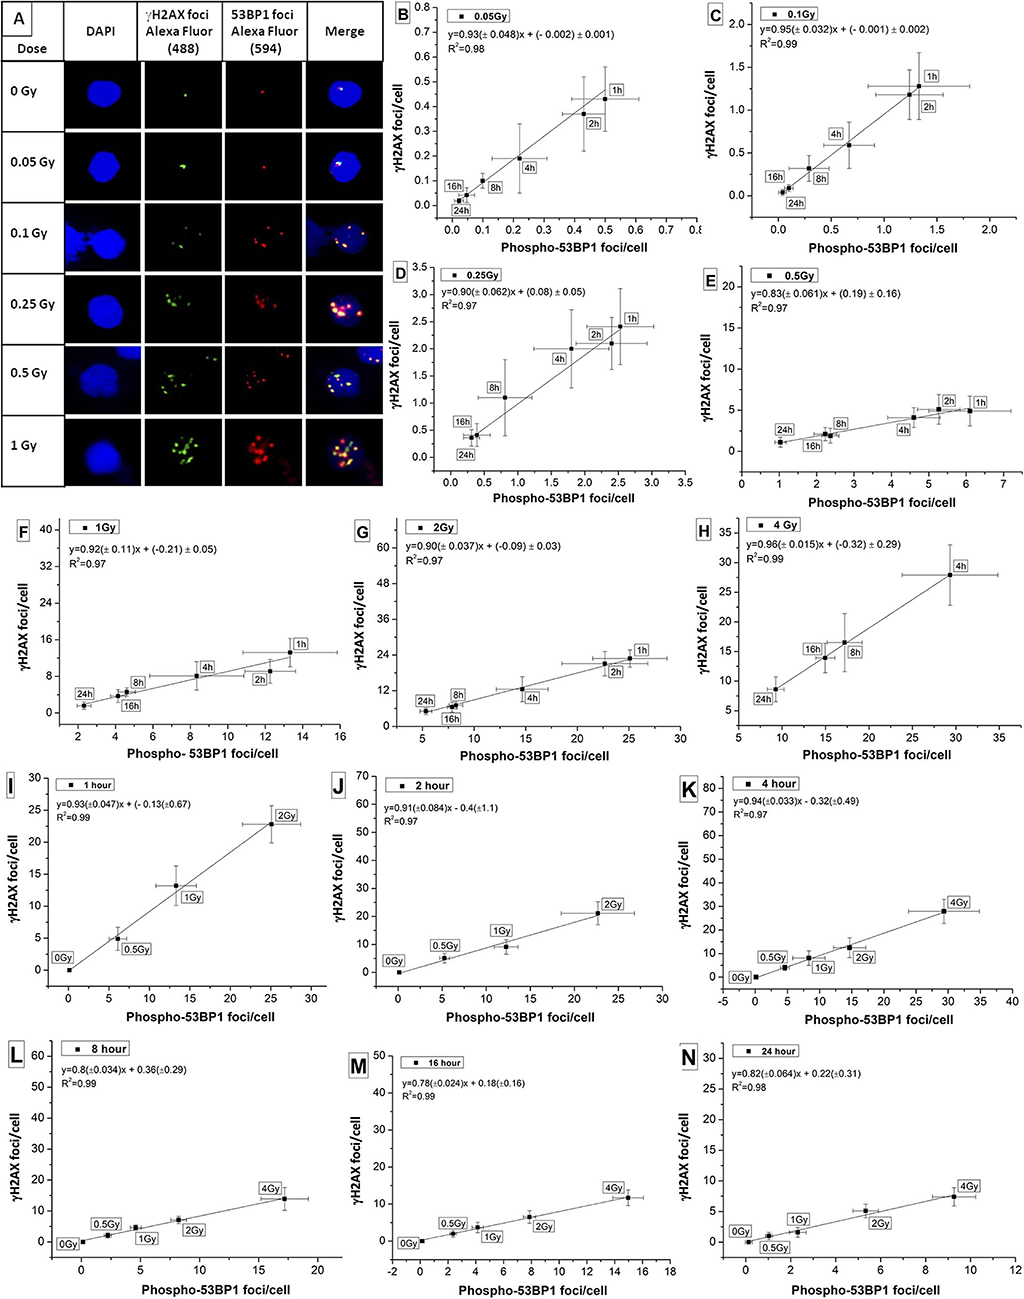
Figure 4. (A) Colocalization of phospho-53BP1 and γH2AX foci in the nucleus of human lymphocyte exposed with various doses (at 1 h incubation post irradiation). Correlations established between dose-response curves generated for phospho-53BP1 foci and γH2AX foci (data not shown) at dose points (B) 0.05 Gy (C) 0.1 Gy (D) 0.25 Gy (E) 0.5 Gy (F) 1 Gy (G) 2 Gy (H) 4 Gy with varying incubation time points (1–24 h) after irradiation. Correlations were established between dose-response curves generated for phospho-53BP1 foci and γH2AX foci, at (I) 1 h (J) 2 h (K) 4 h (L) 8 h (M) 16 h and (N) 24 h of incubation after irradiation with various doses (0–4 Gy).
Correlation was established for the phospho-53BP1 and γH2AX (data not shown here) at various doses (0.05–4 Gy) and incubation time points (1–24 h). For dose points 0.05, 0.1, 0.25, 0.5, 1, 2, and 4 Gy (at incubation of 1–24 h), the Pearson correlation coefficient (R2) was found in the range of 0.97 to 0.99 (Figures 4B–H), indicating a strong positive correlation. Similarly, correlations were established at the incubation of 1, 2, 4, 8, 16, and 24 h post-irradiation (0–2 Gy at 1 and 2 h, and 0–4 Gy at 4, 8, 16, and 24 h). Strong positive correlations (correlation coefficients between 0.97 and 0.99) were observed between these two proteins (Figures 4I–N).
These two DSB repair proteins (phospho-53BP1 and γH2AX) are considered almost equally sensitive and quantifiable markers of DSB detection. Together, they can give dual confirmation of dose estimation in relation to emergency biodosimetry and clinical investigations.
Established dose-response curves were validated with 6 dose-blinded samples and comparatively evaluated with cytogenetic and γH2AX immunofluorescence assays (Figures 5, 6, Table 3). Keeping in mind, the possibility of overlapping of foci (phospho-53BP1 and γH2AX) at higher doses, all blinded samples were fixed and processed at two different incubation time points (i.e., 1 and 4 h) post-irradiations. More than 300 cells were analyzed to score phospho-53BP1 and γH2AX foci independently in each blinded sample.
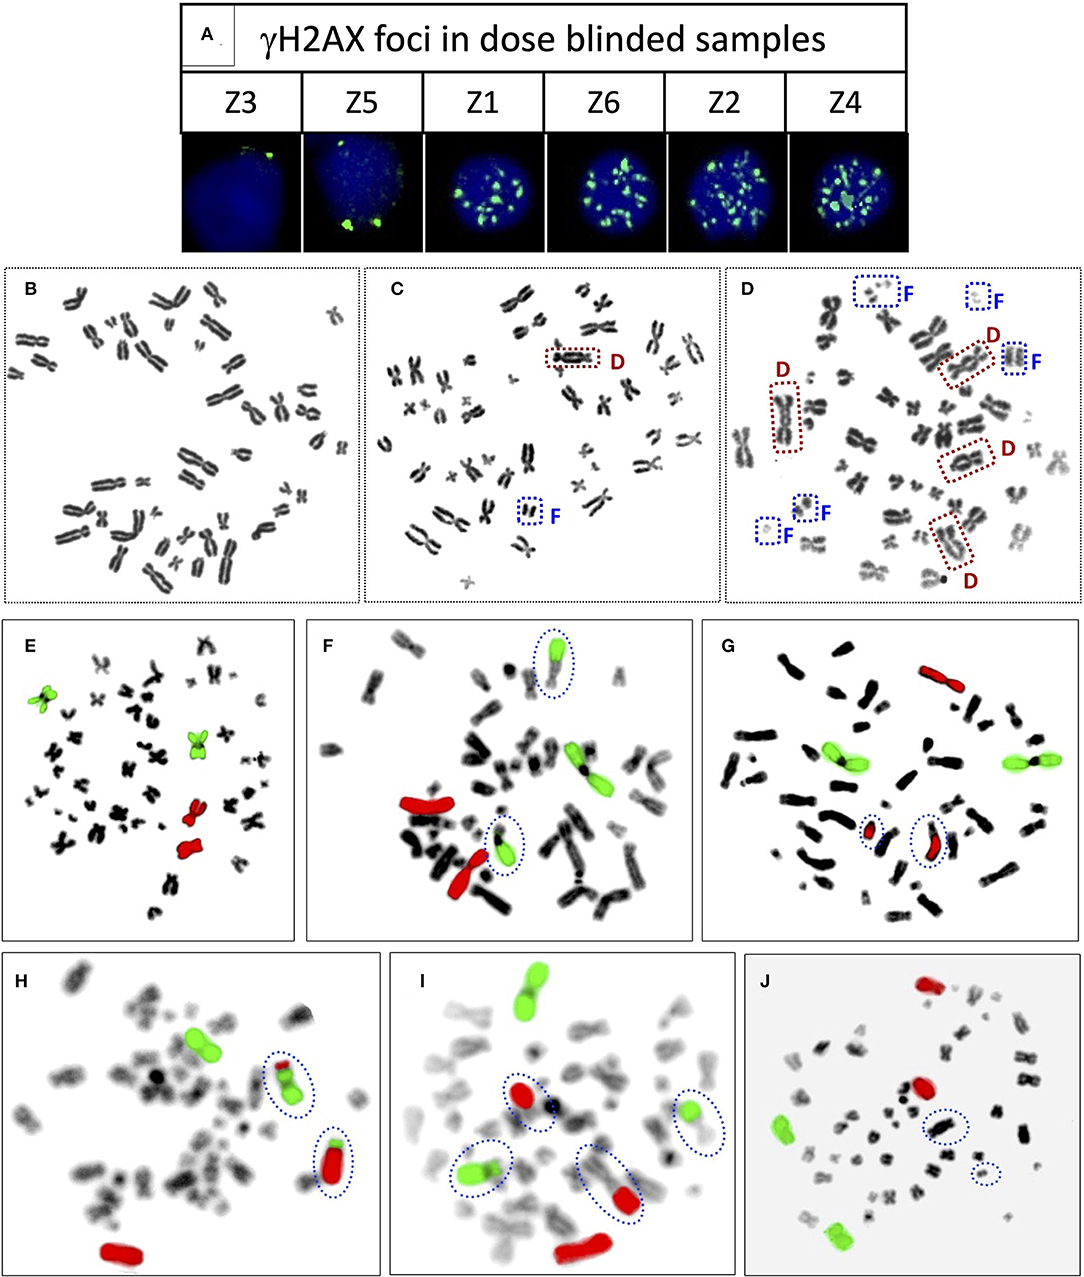
Figure 5. (A) Representative PBLs of dose blinded samples Z3 (1 h), Z5 (1 h), Z1 (1 h), Z6 (1 h), Z2 (4 h), and Z4 (4 h) with their respective number of γH2AX foci. Representative, Giemsa stained metaphase spreads with (B) no dicentric (C) one dicentric with one fragment (D) three dicentrics and one tricentric with five fragments. Representative metaphase spreads processed for FISH, chromosome pairs 1 and 2 hybridized with whole chromosome paint probes tagged with green and red fluorophores, respectively. Metaphase with (E) no aberration (F) one RT between green and black chromosomes (G) one RT between red and black chromosomes (H) one RT between green and red chromosomes (I) two RT, between green and black, and red and black (J) one dicentric, such metaphases were excluded from the scoring.
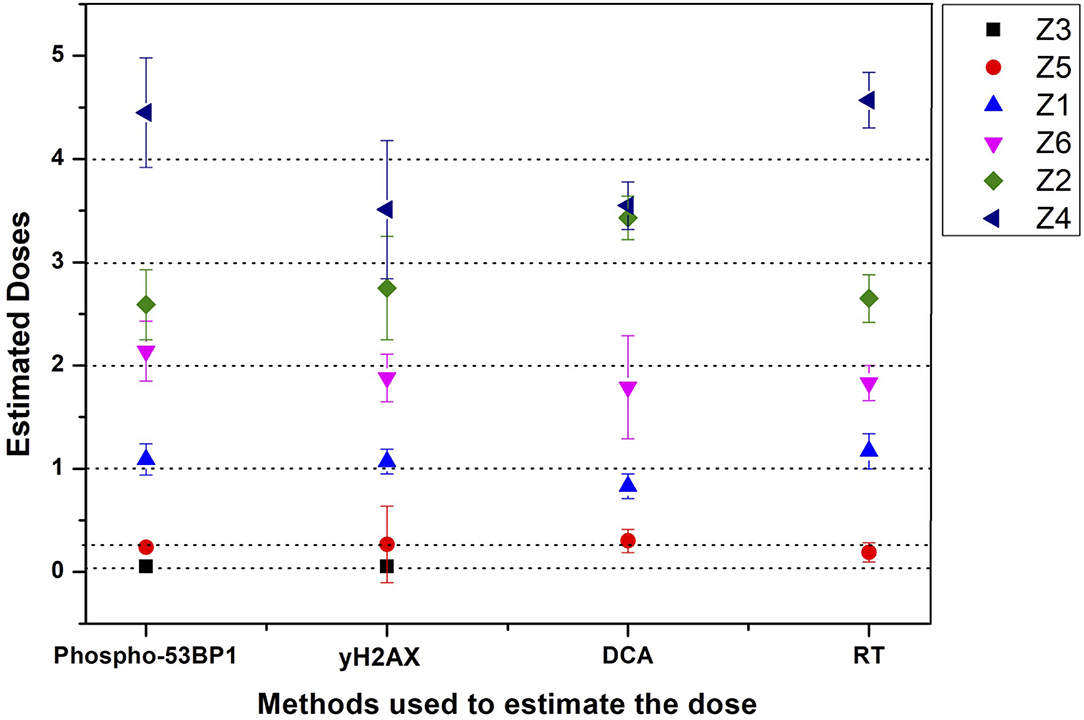
Figure 6. Graphical illustration of the estimated doses of blinded samples (Z1–Z6) by immunofluorescence (phospho-53BP1 and γH2AX) and cytogenetic (dicentric and reciprocal translocation) assays.
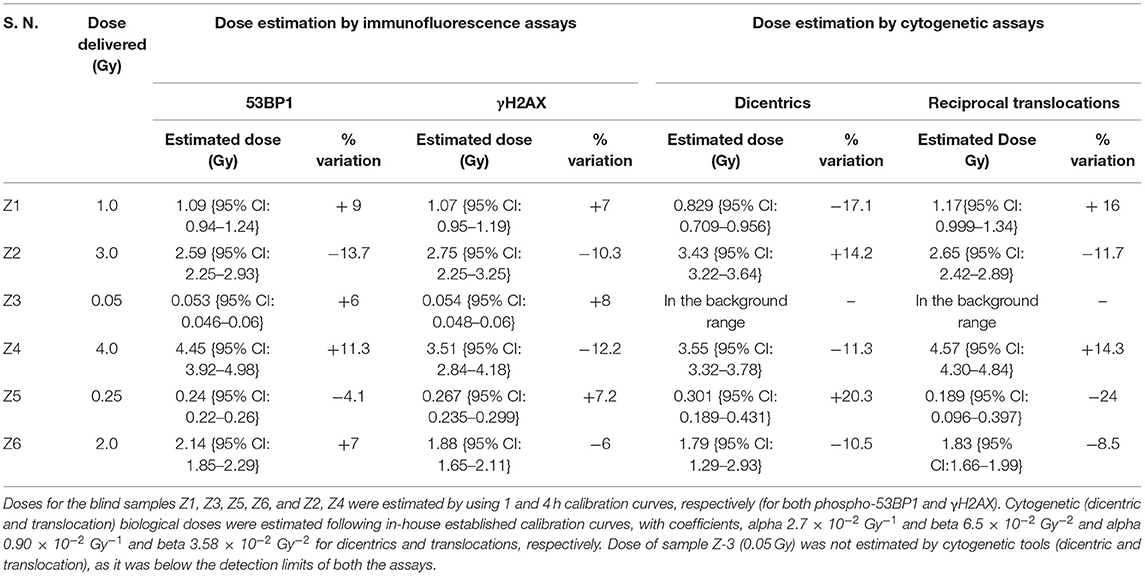
Table 3. Comparative evaluation of established response curve (phospho-53BP1) by estimating biological doses of 6 dose blinded samples by phospho-53BP1, γH2AX, dicentric, and translocation assays.
It was observed that foci were nonoverlapping and distinguishable in samples Z1, Z3, Z5, and Z6 (Figure 5A); however in samples Z2 and Z4, the foci were overlapping, numerous in number, and indistinguishable at 1 h of incubation post-irradiation. Therefore, the number of foci was quantified in samples Z1, Z3, Z5, and Z6 at 1 h of incubation, and the doses were estimated by applying coefficients generated at the 1 h dose-response curve. Incubation in optimum conditions leading to DSB repair and subsequent loss of foci allowed us to quantify the number of foci at 4 h of incubation in samples Z2 and Z4 (Figure 5A), and doses were estimated by applying coefficients generated at 4 h dose–response curve. Results presented in Table 3 show that estimated doses were well within ± 14% of the actual doses delivered.
All dose blinded samples were further processed by gold standard dicentric and reciprocal translocation assays as well. More than 500 metaphases were analyzed to score dicentrics (Figures 5B–D) and reciprocal translocations (Figures 5E–J), independently, following ISO and IAEA scoring criteria (9, 37, 41). Doses were estimated by using in-house established calibration curve for dicentrics with coefficients alpha of 2.7 × 10⁻² Gy−1 and beta of 6.5 × 10⁻² Gy−2 (36), and for reciprocal translocations with coefficients alpha of 0.90 × 10⁻² Gy−1 and beta of 3.58 × 10⁻²Gy−2 using chromosomal aberrations calculation software (CABAS). For sample Z3, yields of dicentrics and translocations were found in the range of variation (3 sigma) of the background frequency; hence it can be considered that Z3 was below the detection limits for both the assays. For the samples Z1–Z6 (except Z3), estimated doses were well within ±25% of the actual doses delivered. Diagrammatic illustration of blind-folded doses estimated by cytogenetic and immunofluorescence (phospho-53BP1 and γH2AX) assays is depicted in Figure 6.
The variation in the background frequency of phospho-53BP1 foci can serve as a tool for the establishment of MDL of the assay. Variation in the mean background frequency of phospho-53BP1 was measured in the blood sample of all five volunteers (V1–V5). As per ISO recommendations for the estimation of MDL of the assay, 3σ of the background frequency (0.12 ± 0.057 foci/cell) was estimated and it was found to be 0.171 foci/cell and their corresponding dose was ~15 mGy (applying dose–response curve equation generated at 1 h of incubation post-irradiation).
Rasche et al. reported the background level of phospho-53BP1 in 26 local healthy control volunteers of Berlin. The median number of foci observed was 0.04, ranging from 0 to 0.49 (46). In another study involving 3 healthy test volunteers conducted in the Department of Nuclear Medicine of the University Hospital Würzburg, Würzburg, Germany, the mean background level of phospho-53BP1 was 0.17 ± 0.04 foci/cell, ranging from 0.10 to 0.25 foci/cell (47). Recently, a study conducted in Bavaria, Germany has shown the baseline mean frequency in unirradiated sham control lymphocytes, which was 0.14 ± 0.04 (mean ± SE) (48). Overall, the observed background level of phospho-53BP1, in the reviewed population ranged from 0 to 0.49 foci/cell. The background frequency we observed in this study was within the range of the background frequency reported in the reviewed populations mentioned above. Background frequency of phospho-53BP1 is attributed to various endogenous and exogenous factors, which are known to induce reactive oxygen species (ROS) and subsequent DSBs in the cells (49–51). Some other cellular processes like cell-division and cell-differentiation can also induce DSBs (52, 53).
Earlier reports have shown that phospho-53BP1 decay kinetics follow single, as well as biexponential decay pattern (54–56). In this study, data were obtained up to 24 h, post-exposure, and it was observed that phospho-53BP1 foci decay followed a single exponential decay pattern (Figure 2A). On analysis of the published data, it was observed that fitting of the data obtained from longer incubation periods follows a biexponential decay pattern. However, fitting of the data obtained from comparatively shorter incubation period follows single-exponential decay pattern (54, 57–59). Biexponential decay pattern consists of an initial fast decay component (t1/2fast, shorter half-life) followed by a slow decay component (t1/2slow, comparatively longer half-life) (60, 61). Though, single exponential decay consists of only one decay component which falls in between the fast and slow decay components. In this study calculated t1/2 was found to be 3.5–3.9 h (for different doses, Table 2). Fast decay component corresponds to faster repair of simple DSBs and slow decay component corresponds to complex DSB repair, which is relatively slow and time-consuming. In case of single exponential decay pattern, t1/2 is relatively longer than t1/2fast and shorter than t1/2slow, which corresponds to the repair of simple as well as complex DSBs.
Ionizing radiation is known to induce heterogeneous DSBs in DNA, and some DSBs are associated with other DNA lesions, resulting in the formation of complex DSBs, which are difficult and time-consuming to get repaired, such foci persist for longer durations (Figure 2B) (62). Simple DSBs get repaired in a short span of time (within a few hours), though, clustered DSBs warrant adequate time (several hours to days depending upon the complexity in DNA damage) (63). Sometimes clustered DSBs remain unrepaired and can lead to apoptotic cell death (64). Graphical illustration for dispersion of phospho-53BP1 foci for 1 Gy is shown in Figures 2C–H. Due to the faster repair of simple DSBs, the distribution of cells with a higher number of foci shifted toward cells with a lower number of foci with increasing incubation time. Foci persisting up to 24 h of incubation indicate DSBs, which are difficult and time-consuming to get repaired (Figure 2B) (28).
Considering the possibilities of delay in blood sampling, following any unplanned radiation exposures or radiological emergencies, dose-response curves were generated up to a period of 24 h after radiation exposure. The time of exposure should be known to select and apply an appropriate dose-response curve to estimate the unknown dose. Following ISO recommendations (3 sigma, variation of the background frequency), MDLs were established for all 6 dose-response curves (Figure 3D) and it was found to be ~15, ~18, ~25, ~40, ~50, and ~75 mGy for the dose-response curves generated at 1, 2, 4, 8, 16, and 24 h (post-irradiation), respectively. Due to the inherent nature of DSB-repair of living cells, the number of phospho-53BP1 foci/cell decreases with increasing incubation time, leading to an increase in MDLs (65–67). MDLs were found to be increasing linearly with increasing post-irradiation incubation time with a slope of 2.47 mGy/h (Figure 3D). These findings can help to estimate the MDL of the assay at any given time of incubation, post-irradiation.
Currently, the colocalization of phospho-53BP1 and γH2AX foci, is considered as the most reliable and dependable marker of DSB enumeration (68, 69). Tagging together, these two proteins give dual confirmation (better confidence) for the quantification of DSB repair foci (phospho-53BP1 + γH2AX) and subsequent reconstruction of the dose. Figure 4A illustrated that up to 89% phospho-53BP1 and γH2AX foci were colocalized, though the rest of the foci were physically apart from each other. The difference in the number of phospho-53BP1 and γH2AX foci induced, at any given dose and incubation time (post irradiation) point, maybe the reason behind it (44, 45, 54). More exploration is warranted to understand the limitation of these candidate protein markers and kinetics of their colocalization (co-persistence) after DSB formation (or radiation exposure) (70–72).
Comparative evaluations of established response curves were made with immunofluorescence (phospho-53BP1 and γH2AX foci) and cytogenetic assays by estimating doses of dose blinded samples (Z1–Z6), illustrated in Table 3 and Figure 6. For the lower doses, i.e., samples Z1, Z3, Z5, and Z6 (≤ 2 Gy), estimated doses by immunofluorescence (i.e., by phospho-53BP1 and γH2AX) assays were reasonably close within 9% from the doses delivered. However, for higher doses i.e., samples Z2 and Z4 (≥3 Gy), the estimated doses were still close but showed variations within 14.3% of the actual doses delivered. These findings indicate that at lower doses (i.e., ≤ 2 Gy), immunofluorescence (γH2AX and phospho-53BP1) assays made closer estimates in comparison with higher doses i.e., ≥3 Gy.
The lowest blinded dose Z3 (0.05 Gy) was found to be below the detection limits of both the cytogenetic assays (dicentrics and translocations). As may be seen in Table 3, the estimated dose for the sample Z5 (0.25 Gy), showed substantial variation, within 24%, for dicentrics and translocations. In contrast, for the higher doses, cytogenetic assays made closer estimates (14.3 % variation) in comparison to lower doses (24% variation). For the higher doses (i.e., ≥3 Gy), both cytogenetic and immunofluorescence (γH2AX and phospho-53BP1) assays made comparable and closer estimates, which was within the variation of 14.3%.
Doses estimated for all the blinded samples (Z1–Z6), by all the implied assays were within the variation of −4.1 to −24% of the doses delivered. For the lower doses i.e., Z1, Z3, Z5, and Z6 immunofluorescence (γH2AX and phospho-53BP1) assays gave comparatively closer estimates (with maximum variation of + 9 %) in comparison to cytogenetic assays (−24% variation) and for the higher doses i.e., Z2 and Z4, cytogenetic and immunofluorescence (γH2AX and phospho-53BP1) assays made comparable close estimates, with the maximum variation of +14.3 and −13.7%, respectively.
All experiments of the present work were carried out with human peripheral blood mononuclear cells (PBMCs), isolated by Histopaque-1077, which majorly consist of lymphocytes (70–90%) and monocytes (10–20%) (73). In this study, only lymphocytes, characterized by uniform-round nucleus (74) were taken into account (Figures 1B, 2B, 3F). Monocytes, characterized by, indented-kidney shaped nucleus (75) (Figure 3G) were excluded from the scoring of phospho-53BP1 foci. In a glance, it was observed that the number of phospho-53BP1 foci in monocytes was comparable with the number of foci present in lymphocytes. Recently, Heylmann et al. reported that monocytes exhibit less radio-sensitivity than lymphocytes and the repair process progresses at a comparatively low pace, indicating long persistence of such DSB repair foci (76). It would be interesting to further explore the number and persistence of DSB repair foci in monocytes and its suitability for rapid biodosimetry tool.
In spite of being sensitive and a reliable marker, certain inherent limitations of these DDR proteins cannot be avoided. With the repair of DSBs, these proteins get dephosphorylated and the foci disappear with time, therefore post-exposure sample collection and knowing the proper chronology of exposure is essential, which is difficult in the case of radiological emergencies though possible in case of planned exposures (medical and occupational exposures) (44, 77, 78). The application window of the assay is shorter (maximum, 1–4 days) in comparison to cytogenetic markers that persist from months to decades (6, 27). MDL of the assay increases with the increasing time of blood collection after exposure (due to DSB repair), which cannot be circumvented (28, 45). After the collection of blood, the repair process can be slowed down by storing the sample in cold conditions (79, 80). MDLs of the cytogenetic assays remain constant over the application time window.
In this study, dose-response curves were established for 60C0-γ-rays-induced phospho-53BP1 for the dose range 0.05–4 Gy at 1, 2, 4, 8, 16, and 24 h, post-irradiation. These dose-response curves can be employed for rapid biodosimetry of radiological emergencies and various planned medical exposures when the chronology of exposures is known. Once the blood sample is obtained in the laboratory, the assay can be performed within 3–4 h and the dose can be estimated by applying coefficients of an appropriate calibration curve. With lower MDLs relevant in the range of doses involved in many therapeutic and diagnostic applications, γH2AX and phospho-53BP1 foci assays can serve as a handy tool. Comparative evaluations of phospho-53BP1 were made with γH2AX foci, dicentrics, and reciprocal translocation assays, and it was observed that at lower dose ranges (0.05–2 Gy) immunofluorescence assay (phospho-53BP1 and γH2AX) gave closer estimates than cytogenetic (DCA and RT) assays. However, at higher doses (3 and 4 Gy) all 4 assays gave comparably closer estimates.
The biodosimetry lab of BARC has established phospho-53BP1 along with other standard immunofluorescence and cytogenetic assays, such as γH2AX, DCA, translocation, micronucleus, etc. As per IAEA recommendations, together, all these assays and their in-house established dose-response curves can serve as tools for multi-parametric biological dose estimations to strengthen the statistical confidence.
The raw data supporting the conclusions of this article will be made available by the authors, without undue reservation.
The studies involving human participants were reviewed and approved by Institutional Ethical Committee (Bhabha Atomic Research Center, Medical Division). The patients/participants provided their written informed consent to participate in this study.
All authors listed have made a substantial contribution in designing the project, execution of experiments, generation and analysis of the data, and writing of the manuscript.
This work was supported by Bhabha Atomic Research Center, Mumbai, India (host institute) and external funding was not involved.
The authors declare that the research was conducted in the absence of any commercial or financial relationships that could be construed as a potential conflict of interest.
All claims expressed in this article are solely those of the authors and do not necessarily represent those of their affiliated organizations, or those of the publisher, the editors and the reviewers. Any product that may be evaluated in this article, or claim that may be made by its manufacturer, is not guaranteed or endorsed by the publisher.
The authors of the article would like to thank and express their sincere gratitude for constant encouragement and technical supports received from Usha Yadav, Shrikant Jagtap, and Pradosh J. Tondlekar of our lab.
1. Swartz HM, Williams BB, Flood AB. Overview of the principles and practice of biodosimetry. Radiat Environ Biophys. (2014) 53:221–32. doi: 10.1007/s00411-014-0522-0
2. Coleman CN, Hrdina C, Bader JL, Norwood A, Hayhurst R, Forsha J, et al. Medical response to a radiologic/nuclear event: integrated plan from the Office of the Assistant Secretary for Preparedness and Response, Department of Health and Human Services. Ann Emerg Med. (2009) 53:213–22. doi: 10.1016/j.annemergmed.2007.12.021
3. Weinstock DM, Case Jr C, Bader JL, Chao NJ, Coleman CN, Hatchett RJ, et al. Radiologic and nuclear events: contingency planning for hematologists/oncologists. Blood. (2008) 111:5440–5. doi: 10.1182/blood-2008-01-134817
4. Waselenko JK, MacVittie TJ, Blakely WF, Pesik N, Wiley AL, Dickerson WE, et al. Medical management of the acute radiation syndrome: recommendations of the Strategic National Stockpile Radiation Working Group. Ann Intern Med. (2004) 140:1037–51. doi: 10.7326/0003-4819-140-12-200406150-00015
5. Sproull MT, Camphausen KA, Koblentz GD. Biodosimetry: a future tool for medical management of radiological emergencies. Health Security. (2017) 15:599–610. doi: 10.1089/hs.2017.0050
6. Rothkamm K, Beinke C, Romm H, Badie C, Balagurunathan Y, Barnard S, et al. Comparison of established and emerging biodosimetry assays. Radiat Res. (2013) 180:111–9. doi: 10.1667/RR3231.1
7. Pala FS, Moquet JE, Edwards AA, Lloyd DC. In vitro transmission of chromosomal aberrations through mitosis in human lymphocytes. Mut Res. (2001) 474:139–46. doi: 10.1016/S0027-5107(00)00172-X
8. Kaddour A, Colicchio B, Buron D, El Maalouf E, Laplagne E, Borie C, et al. Transmission of induced chromosomal aberrations through successive mitotic divisions in human lymphocytes after in vitro and in vivo radiation. Sci Rep. (2017) 7:1–11. doi: 10.1038/s41598-017-03198-7
9. Ainsbury E, Barquinero JF, Beinke C, Blakely WF, Braselmann H, Carr Z, et al. Cytogenetic Dosimetry: Applications in Preparedness for and Response to Radiation Emergencies. IAEA International Atomic Energy Agency. - Ser. Vienna: Emergency Preparedness and Response (2011).
10. Ainsbury EA, Bakhanova E, Barquinero JF, Brai M, Chumak V, Correcher V, et al. Review of retrospective dosimetry techniques for external ionising radiation exposures. Radiat Prot Dosimetry. (2011) 147:573–92. doi: 10.1093/rpd/ncq499
11. Piotrowski I, Dawid A, Kulcenty K, Suchorska WM. Use of biological dosimetry for monitoring medical workers occupationally exposed to ionizing radiation. Radiation. (2021) 1:95–115. doi: 10.3390/radiation1020009
12. Khanna KK, Jackson SP. DNA double-strand breaks: signaling, repair and the cancer connection. Nat Genet. (2001) 27:247–54. doi: 10.1038/85798
13. Pastink A, Lohman PM. Repair and consequences of double-strand breaks in DNA. Mut Res. (1999) 428:141–56. doi: 10.1016/S1383-5742(99)00042-3
14. Schultz LB, Chehab NH, Malikzay A, Halazonetis TD. p53 binding protein 1 (53BP1) is an early participant in the cellular response to DNA double-strand breaks. J Cell Biol. (2000) 151:1381–90. doi: 10.1083/jcb.151.7.1381
15. Xia Z, Morales JC, Dunphy WG, Carpenter PB. Negative cell cycle regulation and DNA damage-inducible phosphorylation of the BRCT protein 53BP1. J Biol Chem. (2001) 276:2708–18. doi: 10.1074/jbc.M007665200
16. Anderson L, Henderson C, Adachi Y. Phosphorylation and rapid relocalization of 53BP1 to nuclear foci upon DNA damage. Mol Cell Biol. (2001) 21:1719–29. doi: 10.1128/MCB.21.5.1719-1729.2001
17. Rappold I, Iwabuchi K, Date T, Chen J. Tumor suppressor p53 binding protein 1 (53BP1) is involved in DNA damage–signaling pathways. J Cell Biol. (2001) 153:613–20. doi: 10.1083/jcb.153.3.613
18. Mochan TA, Venere M, DiTullio RA, Halazonetis TD. 53BP1 and NFBD1/MDC1-Nbs1 function in parallel interacting pathways activating ataxia-telangiectasia mutated (ATM) in response to DNA damage. Cancer Res. (2003) 63:8586–91.
19. Bekker-Jensen S, Lukas C, Kitagawa R, Melander F, Kastan MB, Bartek J, et al. Spatial organization of the mammalian genome surveillance machinery in response to DNA strand breaks. J Cell Biol. (2006) 173:195–206. doi: 10.1083/jcb.200510130
20. Keogh MC, Kim JA, Downey M, Fillingham J, Chowdhury D, Harrison JC, et al. A phosphatase complex that dephosphorylates γH2AX regulates DNA damage checkpoint recovery. Nature. (2006) 439:497–501. doi: 10.1038/nature04384
21. Popp HD, Brendel S, Hofmann WK, Fabarius A. Immunofluorescence microscopy of γH2AX and 53BP1 for analyzing the formation and repair of DNA double-strand breaks. J Visualized Exp. (2017) 129:56617. doi: 10.3791/56617
22. Penninckx S, Pariset E, Cekanaviciute E, Costes SV. Quantification of radiation-induced DNA double strand break repair foci to evaluate and predict biological responses to ionizing radiation. NAR Cancer. (2021) 3:zcab046. doi: 10.1093/narcan/zcab046
23. Djuzenova CS, Zimmermann M, Katzer A, Fiedler V, Distel LV, Gasser M, et al. A prospective study on histone γ-H2AX and 53BP1 foci expression in rectal carcinoma patients: correlation with radiation therapy-induced outcome. BMC Cancer. (2015) 15:1–10. doi: 10.1186/s12885-015-1890-9
24. Turner HC, Sharma P, Perrier JR, Bertucci A, Smilenov L, Johnson G, et al. The RABiT: high-throughput technology for assessing global DSB repair. Radiat Environ Biophys. (2014) 53:265–72. doi: 10.1007/s00411-014-0514-0
25. Raavi V, Perumal V, Paul SF. Potential application of γ-H2AX as a biodosimetry tool for radiation triage. Mutat Res. (2021) 787:108350. doi: 10.1016/j.mrrev.2020.108350
26. Vinnikov V, Belyakov O. “Clinical applications of biological dosimetry in patients exposed to low dose radiation due to radiological, imaging or nuclear medicine procedures,” in Seminars in Nuclear Medicine. Philadelphia, PA: WB Saunders (2021). p. 8. doi: 10.1053/j.semnuclmed.2021.11.008
27. Zahnreich S, Ebersberger A, Kaina B, Schmidberger H. Biodosimetry based on γ-H2AX quantification and cytogenetics after partial-and total-body irradiation during fractionated radiotherapy. Radiat Res. (2015) 183:432–46. doi: 10.1667/RR13911.1
28. Roch-Lefèvre S, Mandina T, Voisin P, Gaëtan G, Mesa JEG, Valente M, et al. Quantification of γ-H2AX foci in human lymphocytes: a method for biological dosimetry after ionizing radiation exposure. Radiat Res. (2010) 174:185–94. doi: 10.1667/RR1775.1
29. Böcker W, Iliakis G. Computational methods for analysis of foci: validation for radiation-induced γ-H2AX foci in human cells. Radiat Res. (2006) 165:113–24. doi: 10.1667/RR3486.1
30. International Organization for Standardization. Radiation Protection–Performance Criteria for Service Laboratories Performing Biological Dosimetry by Cytogenetics. Geneva: ISO. (2004) 19238:2014.
31. Rose NR, Friedman H. Manual of Clinical Immunology. Washington: American Society for Microbiology. (1976). p. 932.
32. Chaurasia RK, Bhat NN, Gaur N, Shirsath KB, Desai UN, Sapra BK. Establishment and multiparametric-cytogenetic validation of 60Co-gamma-ray induced, phospho-gamma-H2AX calibration curve for rapid biodosimetry and triage management during radiological emergencies. Mutat Res. (2021) 866:503354. doi: 10.1016/j.mrgentox.2021.503354
33. Chaurasia RK, Balakrishnan S, Kunwar A, Yadav U, Bhat N, Anjaria K, et al. Cyto-genotoxicity assessment of potential radioprotector. 3, 3′-diselenodipropionic acid (DSePA) in Chinese Hamster Ovary (CHO) cells and human peripheral blood lymphocytes. Mutat Res. (2014) 774:8–16. doi: 10.1016/j.mrgentox.2014.08.007
34. Vyas RC, Darroudi F, Natarajan AT. Radiation-induced chromosomal breakage and rejoining in interphase-metaphase chromosomes of human lymphocytes. Mutat Res. (1991) 249:29–35. doi: 10.1016/0027-5107(91)90130-G
35. Roukos V, Misteli T. The biogenesis of chromosome translocations. Nat Cell Biol. (2014) 16:293–300. doi: 10.1038/ncb2941
36. Bhat NN, Anjaria KB, Rao BS. Dose rate effect and its implications in biodosimetry using chromosomal aberration analysis. Radiat Protect Environ. (2003) 26:536–40.
37. International Organization for Standardization. Radiation Protection–Performance Criteria for Laboratories Performing Cytogenetic Triage for Assessment of Mass Casualties in Radiological or Nuclear Emergencies–General Principles and Application to Dicentric Assay. Geneva: ISO (2008).
38. Krishnaja AP, Sharma NK. Transmission of γ-ray-induced unstable chromosomal aberrations through successive mitotic divisions in human lymphocytes in vitro. Mutagenesis. (2004) 19:299–305. doi: 10.1093/mutage/geh031
39. Chaurasia RK, Shirsath KB, Sapra BK. Protocol for one-step selective lysis of red blood cells and platelets with long-term preservation of white blood cells (human) at ambient temperature. STAR Protocols. (2021) 2:100834. doi: 10.1016/j.xpro.2021.100834
40. Grigorova M, Balajee AS, Natarajan AT. Spontaneous and X-ray-induced chromosomal aberrations in Werner syndrome cells detected by FISH using chromosome-specific painting probes. Mutagenesis. (2000) 15:303–10. doi: 10.1093/mutage/15.4.303
41. International Organization for Standardization. Radiological Protection–Performance Criteria for Laboratories Using Fluorescence in situ Hybridization (FISH) Translocation Assay for Assessment of Exposure to Ionizing Radiation. Geneva: ISO (2019).
42. Lorat Y, Fleckenstein J, Görlinger P, Rübe C, Rübe CE. Assessment of DNA damage by 53PB1 and pKu70 detection in peripheral blood lymphocytes by immunofluorescence and high-resolution transmission electron microscopy. Strahlentherapie und Onkologie. (2020) 196:821–33. doi: 10.1007/s00066-020-01576-1
43. Jakl L, Marková E, Koláriková L, Belyaev I. Biodosimetry of low dose ionizing radiation using DNA repair foci in human lymphocytes. Genes. (2020) 11:58. doi: 10.3390/genes11010058
44. Ding D, Zhang Y, Wang J, Wang X, Fan D, He L, et al. γ-H2AX/53BP1/pKAP-1 foci and their linear tracks induced by in vitro exposure to radon and its progeny in human peripheral blood lymphocytes. Sci Rep. (2016) 6:1–11. doi: 10.1038/srep38295
45. Horn S, Rothkamm K. Candidate protein biomarkers as rapid indicators of radiation exposure. Radiat Measur. (2011) 46:903–6. doi: 10.1016/j.radmeas.2011.02.001
46. Rasche L, Heiserich L, Behrens JR, Lenz K, Pfuhl C, Wakonig K, et al. Analysis of lymphocytic DNA damage in early multiple sclerosis by automated gamma-H2AX and 53BP1 foci detection: a case control study. PLoS ONE. (2016) 11:e0147968. doi: 10.1371/journal.pone.0147968
47. Eberlein U, Peper M, Fernández M, Lassmann M, Scherthan H. Calibration of the γ-H2AX DNA double strand break focus assay for internal radiation exposure of blood lymphocytes. PLoS ONE. (2015) 10:e0123174. doi: 10.1371/journal.pone.0123174
48. Bucher M, Duchrow L, Endesfelder D, Roessler U, Gomolka M. Comparison of inexperienced operators and experts in γH2A. X and 53BP1 foci assay for high-throughput biodosimetry approaches in a mass casualty incident. Int J Radiat Biol. (2020) 96:1263–73. doi: 10.1080/09553002.2020.1793024
49. Cannan WJ, Pederson DS. Mechanisms and consequences of double-strand DNA break formation in chromatin. J Cell Physiol. (2016) 231:3–14. doi: 10.1002/jcp.25048
50. Tubbs A, Nussenzweig A. Endogenous DNA damage as a source of genomic instability in cancer. Cell. (2017) 168:644–56. doi: 10.1016/j.cell.2017.01.002
51. Sharma V, Collins LB, Chen TH, Herr N, Takeda S, Sun W, et al. Oxidative stress at low levels can induce clustered DNA lesions leading to NHEJ mediated mutations. Oncotarget. (2016) 7:25377. doi: 10.18632/oncotarget.8298
52. Chu G. Double strand break repair. J Biol Chem. (1997) 272:24097–100. doi: 10.1074/jbc.272.39.24097
53. Wuerffel RA, Du J, Thompson RJ, Kenter AL. Ig Sgamma3 DNA-specifc double strand breaks are induced in mitogen-activated B cells and are implicated in switch recombination. J Immunol. (1997) 159:4139–44.
54. Horn S, Barnard S, Rothkamm K. Gamma-H2AX-based dose estimation for whole and partial body radiation exposure. PLoS ONE. (2011) 6:e25113. doi: 10.1371/journal.pone.0025113
55. Lehn R. Effects of lamin A/C structure on 53BP1 foci kinetics, (Ph.D. Thesis), Technical University of Berlin (TUB), Berlin, Germany (2021).
56. Wozny AS, Alphonse G, Cassard A, Malésys C, Louati S, Beuve M, et al. Impact of hypoxia on the double-strand break repair after photon and carbon ion irradiation of radioresistant HNSCC cells. Sci Rep. (2020) 10:1–18. doi: 10.1038/s41598-020-78354-7
57. Olofsson D, Cheng L, Fernández RB, Płódowska M, Riego ML, Akuwudike P, et al. Biological effectiveness of very high gamma dose rate and its implication for radiological protection. Radiat Environ Biophys. (2020) 59:451–60. doi: 10.1007/s00411-020-00852-z
58. Markova E, Schultz N, Belyaev IY. Kinetics and dose-response of residual 53BP1/γ-H2AX foci: Co-localization, relationship with DSB repair and clonogenic survival. Int J Radiat Biol. (2007) 83:319–29. doi: 10.1080/09553000601170469
59. Martin NT, Nahas SA, Tunuguntla R, Fike F, Gatti RA. Assessing ‘radiosensitivity'with kinetic profiles of γ-H2AX, 53BP1 and BRCA1 foci. Radiother Oncol. (2011) 101:35–8. doi: 10.1016/j.radonc.2011.05.065
60. Groesser T, Chang H, Fontenay G, Chen J, Costes SV, Helen Barcellos-Hoff M, et al. Persistence of γ-H2AX and 53BP1 foci in proliferating and non-proliferating human mammary epithelial cells after exposure to γ-rays or iron ions. Int J Radiat Biol. (2011) 87:696–710. doi: 10.3109/09553002.2010.549535
61. Hanton F, Chaudhary P, Doria D, Gwynne D, Maiorino C, Scullion C, et al. DNA DSB repair dynamics following irradiation with laser-driven protons at ultra-high dose rates. Sci Rep. (2019) 9:1–10. doi: 10.1038/s41598-019-40339-6
62. Goodarzi AA, Noon AT, Deckbar D, Ziv Y, Shiloh Y, Löbrich M, et al. ATM signaling facilitates repair of DNA double-strand breaks associated with heterochromatin. Mol Cell. (2008) 31:167–77. doi: 10.1016/j.molcel.2008.05.017
63. Sage E, Shikazono N. Radiation-induced clustered DNA lesions: Repair and mutagenesis. Free Radical Biol Med. (2017) 107:125–35. doi: 10.1016/j.freeradbiomed.2016.12.008
64. Roos WP, Kaina B. DNA damage-induced cell death: from specific DNA lesions to the DNA damage response and apoptosis. Cancer Lett. (2013) 332:237–48. doi: 10.1016/j.canlet.2012.01.007
65. Sollazzo A, Brzozowska B, Cheng L, Lundholm L, Scherthan H, Wojcik A. Live dynamics of 53BP1 foci following simultaneous induction of clustered and dispersed DNA damage in U2OS cells. Int J Mol Sci. (2018) 19:519. doi: 10.3390/ijms19020519
66. Jezkova L, Zadneprianetc M, Kulikova E, Smirnova E, Bulanova T, Depes D, et al. Particles with similar LET values generate DNA breaks of different complexity and reparability: a high-resolution microscopy analysis of γH2AX/53BP1 foci. Nanoscale. (2018) 10:1162–79. doi: 10.1039/C7NR06829H
67. Taleei R, Nikjoo H. The non-homologous end-joining (NHEJ) pathway for the repair of DNA double-strand breaks: I. A mathematical model. Radiat Res. (2013) 179:530–9. doi: 10.1667/RR3123.1
68. Zastko L, Račková A, Petrovičová P, Durdík M, Míšek J, Marková E, et al. Evaluation of calyculin A effect on γH2AX/53BP1 focus formation and apoptosis in human umbilical cord blood lymphocytes. Int J Mol Sci. (2021) 22:5470. doi: 10.3390/ijms22115470
69. Nakamura AJ, Rao VA, Pommier Y, Bonner WM. The complexity of phosphorylated H2AX foci formation and DNA repair assembly at DNA double-strand breaks. Cell cycle. (2010) 9:389–97. doi: 10.4161/cc.9.2.10475
70. Belyaev IY. Radiation-induced DNA repair foci: spatio-temporal aspects of formation, application for assessment of radiosensitivity and biological dosimetry. Mutat Res. (2010) 704:132–41. doi: 10.1016/j.mrrev.2010.01.011
71. Lorat Y, Fleckenstein J, Görlinger P, Rübe C, Rübe CE. Concomitant chemotherapy increases radiotherapy-mediated DNA-damage in peripheral blood lymphocytes. BioRxiv. (2019) 2019:540575. doi: 10.1101/540575
72. Vandevoorde C, Gomolka M, Roessler U, Samaga D, Lindholm C, Fernet M, et al. EPI-CT: in vitro assessment of the applicability of the γ-H2AX-foci assay as cellular biomarker for exposure in a multicentre study of children in diagnostic radiology. Int J Radiat Biol. (2015) 91:653–63. doi: 10.3109/09553002.2015.1047987
73. Verhoeckx K, Cotter P, López-Expósito I, Kleiveland C, Lea T, Mackie A, et al. The Impact of Food Bioactives on Health: in vitro and ex vivo Models 388. Cham: Springer (2015). doi: 10.1007/978-3-319-16104-4
74. Jacob EA. Complete blood cell count and peripheral blood film, its significant in laboratory medicine: a review study. Am J Lab Med. (2016) 1:34. doi: 10.11648/j.ajlm.20160103.12
75. Sarrafzadeh O, Rabbani H, Talebi A, Banaem HU. Selection of the best features for leukocytes classification in blood smear microscopic images. In Medical Imaging 2014: Digital Pathology. Int Soc Opt Photon. (2014) 9041:90410P. doi: 10.1117/12.2043605
76. Heylmann D, Ponath V, Kindler T, Kaina B. Comparison of DNA repair and radiosensitivity of different blood cell populations. Sci Rep. (2021) 11:1–13. doi: 10.1038/s41598-021-81058-1
77. Moon SH, Nguyen TA, Darlington Y, Lu X, Donehower LA. Dephosphorylation of γ-H2AX by WIP1: an important homeostatic regulatory event in DNA repair and cell cycle control. Cell cycle. (2010) 9:2092–6. doi: 10.4161/cc.9.11.11810
78. López JS, Pujol-Canadell M, Puig P, Ribas M, Carrasco P, Armengol G, et al. Establishment and validation of surface model for biodosimetry based on γ-H2AX foci detection. Int J Radiat Biol. (2021) 2021:1–10. doi: 10.1080/09553002.2022.1998706
79. Allione A, Porcedda P, Russo A, Ricceri F, Simonelli V, Minoprio A, et al. Effect of blood storage conditions on DNA repair capacity measurements in peripheral blood mononuclear cells. Mutat Res. (2013) 749:73–9. doi: 10.1016/j.mrfmmm.2013.05.001
Keywords: 53BP1 foci, γH2AX foci, dicentrics and reciprocal translocations, rapid biodosimetry, radiation induced DNA-DSB detection, colocalization of γH2AX and 53BP1 foci
Citation: Chaurasia RK, Shirsath KB, Desai UN, Bhat NN and Sapra BK (2022) Establishment of in vitro Calibration Curve for 60Co-γ-rays Induced Phospho-53BP1 Foci, Rapid Biodosimetry and Initial Triage, and Comparative Evaluations With γH2AX and Cytogenetic Assays. Front. Public Health 10:845200. doi: 10.3389/fpubh.2022.845200
Received: 29 December 2021; Accepted: 19 May 2022;
Published: 08 August 2022.
Edited by:
Clarice Patrono, Centro Ricerche Casaccia, ItalyReviewed by:
Dmitry Klokov, Institute of Radioprotection and Nuclear Safety, FranceCopyright © 2022 Chaurasia, Shirsath, Desai, Bhat and Sapra. This is an open-access article distributed under the terms of the Creative Commons Attribution License (CC BY). The use, distribution or reproduction in other forums is permitted, provided the original author(s) and the copyright owner(s) are credited and that the original publication in this journal is cited, in accordance with accepted academic practice. No use, distribution or reproduction is permitted which does not comply with these terms.
*Correspondence: Rajesh Kumar Chaurasia, cmFqZXNoY0BiYXJjLmdvdi5pbg==; Nagesh N. Bhat, bmFnZXNobmJAYmFyYy5nb3YuaW4=
Disclaimer: All claims expressed in this article are solely those of the authors and do not necessarily represent those of their affiliated organizations, or those of the publisher, the editors and the reviewers. Any product that may be evaluated in this article or claim that may be made by its manufacturer is not guaranteed or endorsed by the publisher.
Research integrity at Frontiers
Learn more about the work of our research integrity team to safeguard the quality of each article we publish.