 Vasuki Rajaguru
 Tae Hyun Kim1
 Jaeyong Shin
- 1Department of Healthcare Management, Graduate School of Public Health, College of Medicine, Yonsei University, Seoul, South Korea
- 2Department of Preventive Medicine, College of Medicine, Yonsei University, Seoul, South Korea
- 3Institute of Health Services Research, Yonsei University, Seoul, South Korea
Background: Cancer is one of the leading chronic diseases, which causes premature mortality in Korea. Early detection has been reported to be associated with reduced mortality and morbidity. Consistent evidence reports that lower screening rates are associated with socioeconomic-based disparities. This study aimed to examine income-related disparities in cancer screening services and to analyze the association between utilization of cancer screening and individual characteristics, including income levels.
Methods: This study utilized the data from the Korea National Health and Nutrition Examination Survey (KNHANES), a population-based survey from 2013 to 2019. The study population included individuals aged 40 years or over. The variables were socioeconomic characteristics and perceived health status. Household income was categorized into quartiles from Q1 (the lowest income group) to Q4 (the highest income group). Multivariate logistic regression analysis was performed to analyze the association between cancer screening and individual characteristics and household income levels.
Results: There were 20,347 individuals included in this study. Among these, 14,741 (72.4%) had undergone cancer screening. There existed a gap in the utilization of cancer screening between the lowest (Q1) and highest (Q4) income quintiles owing to evident income disparities; Q4 thus had a significantly higher likelihood of undergoing cancer screening than other quintiles. Female sex, university and over education, number of chronic diseases, and private insurance coverage were positively associated with cancer screening (p < 0.001).
Conclusion: Our findings suggest that policymakers should develop and design strategies to increase awareness and efforts to improve the education and promotion of cancer screening among lower-income target groups.
Background
Cancer is a global public health challenge. The cancer incidence and mortality rate are rapidly increasing worldwide; also have been reported in developed countries over the last few decades (1, 2). The incidence of cancer has increased to an epidemic level in South Korea (2). The number of incident cancer cases was estimated at 229,180, of which 27.8% of cancer-related deaths occurred between 2011 and 2016 (3). The cancer-related economic burden was reported exhibited an average 8.9% annual growth rate in 2010 (4), accounting for 0.23% of the national gross domestic product and 1.36% of national healthcare expenditure in 2014 (5) and, in terms of the total cost, $1 was equal to 1,131.52 won in 2015, according to Statistics Korea (6).
Screening is seen by many as a key element in cancer control strategies (7). Cancer could be prevented by screening and early detection; ~50–60% of the cancer cases are detected early with the commonly used, well-organized strategies (8). Regular, population-based cancer screening results in earlier detection and increased survival, and there is evidence that regular risk-appropriate screening may reduce cancer mortality (9, 10).
In Korea, the National Cancer Screening Program (NCSP) has conducted population-based screening since 1999 for providing free screening services (2, 11); it was expanded rapidly for these groups, and this, in turn, increased the scope of screening. National Cancer Screening Program provides free cancer screening services for five common cancers: gastric, liver, colorectal, breast, and cervix to Medical Aid recipients and National Health Insurance beneficiaries in the lower 50% income population (10–12). In addition, special screening is also an opportunistic screening tool in outpatient clinics or private health assessment centers (10). However, in these cases, individuals must pay for opportunistic screening for all types of cancer-related screening procedures.
The literature findings revealed that utilization of cancer screening was associated with socioeconomic factors in Korea (13–20) and other countries (21–24), cognitive factors, and predisposing factors (24–30), health care system factors such as health insurance, and national screening programs (11–14, 25–28, 31). Previous studies have investigated the specific type of cancer related to economic inequality and disparity with different cancers (13–16, 21, 22, 24, 25, 29, 31–34). Differences in cancer screening related to socioeconomic status may contribute to morbidity and mortality variations across Korea (15, 16, 33, 34). Some studies have studied income inequalities that affect the utilization of cancer screening (13, 16–23, 28–32, 35).
Overall the decades, Korea also experienced rapid socioeconomic growth decline not only in the lifestyle changes but also in the wide of income inequality. Therefore, Korea's homogenous sample population analyzes the association between income disparities and various diseases in Korea (13–22, 32). Numerous studies have been reported, by using the different databases to analyze the relationship or factors associated with specific types of cancer screening than overall cancer screening (13–23, 25, 31, 32, 34). However, differences across income groups receiving the screening are still observed, with 41% in the lowest income quartile receiving screening compared with 54 % in the highest in 2012 (30).
Existing studies have been focused on socioeconomic disparity with specific types of cancer screening such as breast (22), cervical or both (13, 14, 22, 24, 32), colorectal (25), gastric (31), and thyroid (13). However, inconsistent results have been reported regarding overall cancer screening. Clarifying these inconclusive results is important because information on income disparity in cancer screening might be useful to identify the individuals at risk of cancer. As there is limited evidence on whether or not the NCSP program contributes to encouraging individuals with lower income to utilize the screening by using the nationally conducted cross-sectional survey. It is unknown whether the current population-based national screening program supports diminishing income-related disparities in cancer screening services (9–12, 16–18, 20). However, as studies cited above, increases in screening rates might not always appreciate equitably across socioeconomic or income status, and not yet been directly investigated so far using 5 years of data from the Korea National Health and Nutrition Examination Survey (KNHANES) after 2014 (6th cycle of the survey), the 8th survey (2019) has recently been reported, and also planned to provide the updated cancer screening trends before the pandemic era. In addition, the NCSP is a nationwide organized program, offering cancer screening for the population aged 40 years or over.
This study aimed to investigate the cancer screening rates and trends from 2013 to 2019 by using the KNHANES data among the population aged 40 years or over, we also assessed the contribution of socio-economic factors, including income-based disparities in the utilization of cancer screening.
Methods
Data Source and Population
This study used standardized cross-sectional data from the Korea National Health and Nutrition Examination Survey (KNHANES), which is a population-based survey that provides comprehensive data on health status, healthcare utilization, and socioeconomic status of an entire Korean population (16). It was established in 2007 and the survey has been conducted every year and composed as a cycle, it consists of survey data every 3 years. The KNHANES samples are based on a multi-stage clustered sample of the non-institutionalized Korean population from the household registries. The primary sampling units (PSU) were selected across Korea and the survey weights are provided by adjusting for complex survey designs with post-stratification. We used the 6th, 7th, and 8th surveys (8th survey data are available until 2019) from the KNHANES, over 40 years population are included in this study. It contains questions to obtain basic information on household income and individual characteristics regarding demographics, health status, and lifestyle.
Variables and Measurement
The Dependent Variable
The dependent variable of this study was whether participants had undergone a cancer screening (Question: “Have you undergone cancer screening in past 2 years?”; answer: “Yes” or “No”). The type of cancer screening was classified as (1) free of cost, (2) self-payment, or (3) partial payment screening at comprehensive cancer screening in public, private, or general hospitals.
Independent Variables
Socioeconomic Characteristics
The demographic characteristics included age, sex, education status, marital status, job, income, residence (based on the participant's residence), and types of insurance. The age group was divided into four groups (40–49, 50–59, 60–69, and ≥70 years) starting from age 40 years, which is the national cancer screening recommendation standard. Marital status was classified as married, single, and divorced/widowed. The education status had four categories: elementary school, middle school, high school, and university and over. The ccupation was classified as “yes” or “no” according to the participant's answer (all types of work or no work, respectively). Residential areas were divided into urban (city or town) and rural (village) areas. The level of household income was calculated by dividing the household monthly income by the square root of the household size (equalized income), and classified into four categories: lowest, middle, high, and highest in the quartile (35). In terms of insurance types, private medical benefit membership was recorded as “yes” or “no” and national health insurance was classified into two groups according to a response of “yes” (employee and family/self-membership) or “no” (no response).
Lifestyle and Health-Status Characteristics
Lifestyle and health-related variables included participants' perceived health status, stress, smoking, alcohol consumption, physical activity (moderate), cancer, and chronic diseases. Self-reported health status was classified into three categories: fair (very good/good), moderate, and bad (bad/very bad). In self-perceived stress level, "the participants were asked for their perceived stress levels, and four options were given for response: (1) very much, (2) much, (3) a little, and (4) almost none. They were then divided into two categories; the first two responses were considered as the high-level stress (Yes), and the last two were classified as the low-stress (No). Alcohol consumption was categorized into two groups according to the amount and frequency of alcohol consumed monthly included; (1) “Yes” (high-risk drinkers), defined as those who consume more than seven (for men) or five (for women) drinks on a single time at least once per month; and (2) “No” low-risk drinkers, defined as non-drinkers and those who drink less than once per month (19). Smoking was divided into current (present smoker/sometimes), former (past smoker), and never (lifetime non-smoker). Physical activity was defined as engaging in ≥10 min of physical activity that produces at least slight breathlessness and sweating less than once per week (20), and divided in to two categories that: “Yes” or “No” from the following question: “Do you engage in moderately intense sports, exercise or recreational activities that result in an elevated heart rate?” The presence or absence of cancer was recorded as “Yes” or “No” regarding all types considered among 18 diseases (all types of cancer). Chronic diseases were considered based on the International Classification of Diseases (ICD-10) code with recommended diseases: heart disease, stroke, depression, diabetes, arthritis, etc., and the responses were categorized as “1” (any one disease), “2” (any 2 diseases) or “3” (three and more).
“The study was conducted according to the guidelines of the Declaration of Helsinki and approved by the Institutional Review Board of affiliated University (2021-4-0986). In addition, the KNHANES was approved by the KDCA Institutional Review Board (2018-01-03-P-A) in 2018. All participants provided informed consent to participate in the KNHANES and it was ensured that they remained anonymous.”
Statistical Analysis
Data analysis was performed in three steps. First, chi-square verification was used to calculate the distribution of each covariate. Second, multivariate logistic regression models were used to determine the odds ratio (OR) and 95% confidence interval (CI) to assess the factors associated with cancer screening. Model 1. age, sex, education, marital status, occupation, residence, smoking, alcohol consumption was assigned as an independent variables, and Model 2. household income, chronic diseases, cancer and types of health insurance focused as an independent variables. Third, a subgroup analysis was performed to analyze the factors associated with cancer screening according to household income, with selected covariates. The differences in the influences of income on cancer screening was analyzed with adjusted odd ratio of covariates were examined by using interaction terms in which income quintiles. Statistical significance was defined as p < 0.05 (36, 37). All analyses were performed using SAS version 9.4 (SAS Institute Inc., Cary, NC, USA) (36, 37).
Results
Study Population and Distribution of Cancer Screening From 2013 to 2019
The total number of households participating in the KNHANES for 2013 through 2019 was 55,327. A total 20,347 male and female participants aged 40 years and older were included in this study (Figure 1). The frequency distribution of cancer screening was gradually incresased in 2019 and then and a lower percentage of participants exposed to cancer screening in 2013 (38%). The number of women who underwent cancer screening was higher than men (55.7 vs. 44.3%, respectively) (Figure 2).
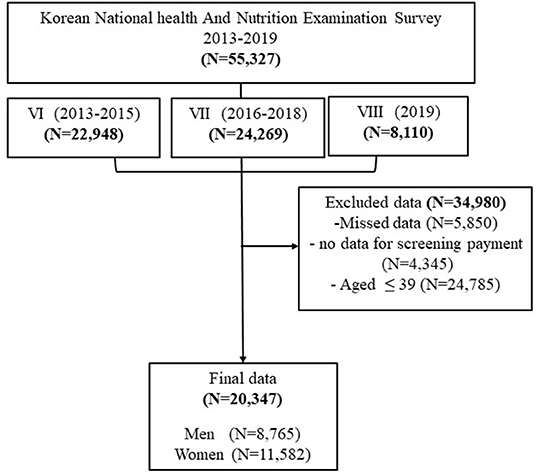
Figure 1. Flow diagrams showing selection of the study population.
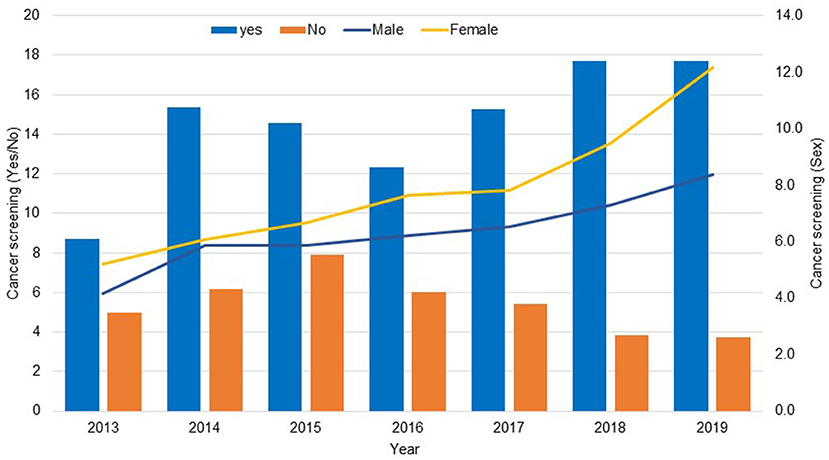
Figure 2. Frequency distribution of cancer screening (Yes/No) and sex based on the KNHANES data 2013–2019.
Chi-Sqaurte Test Analysis of Socioeconomic Characteristics of Cancer Screening
The final data consisted of 20,347 participants aged 40 years and over. Table 1 compares the characteristics of cancer screening. The frequency of cancer screening was 14,741 (72.4%). Regarding socioeconomic characteristics, most participants who underwent cancer screening were women (55.7%) and within the 50–59 years age group (27.8%). Regarding education, most of them had a university or over (33.2%). Regarding marital status, majority of participants were married (96%) and working (91.1%). About 2/3 of the participants were residing in urban areas (78.6%) and most participants had household income in the highest quartile (28.8%). The types of insurance reported included national health (94.4%) and private insurance (70.3%).
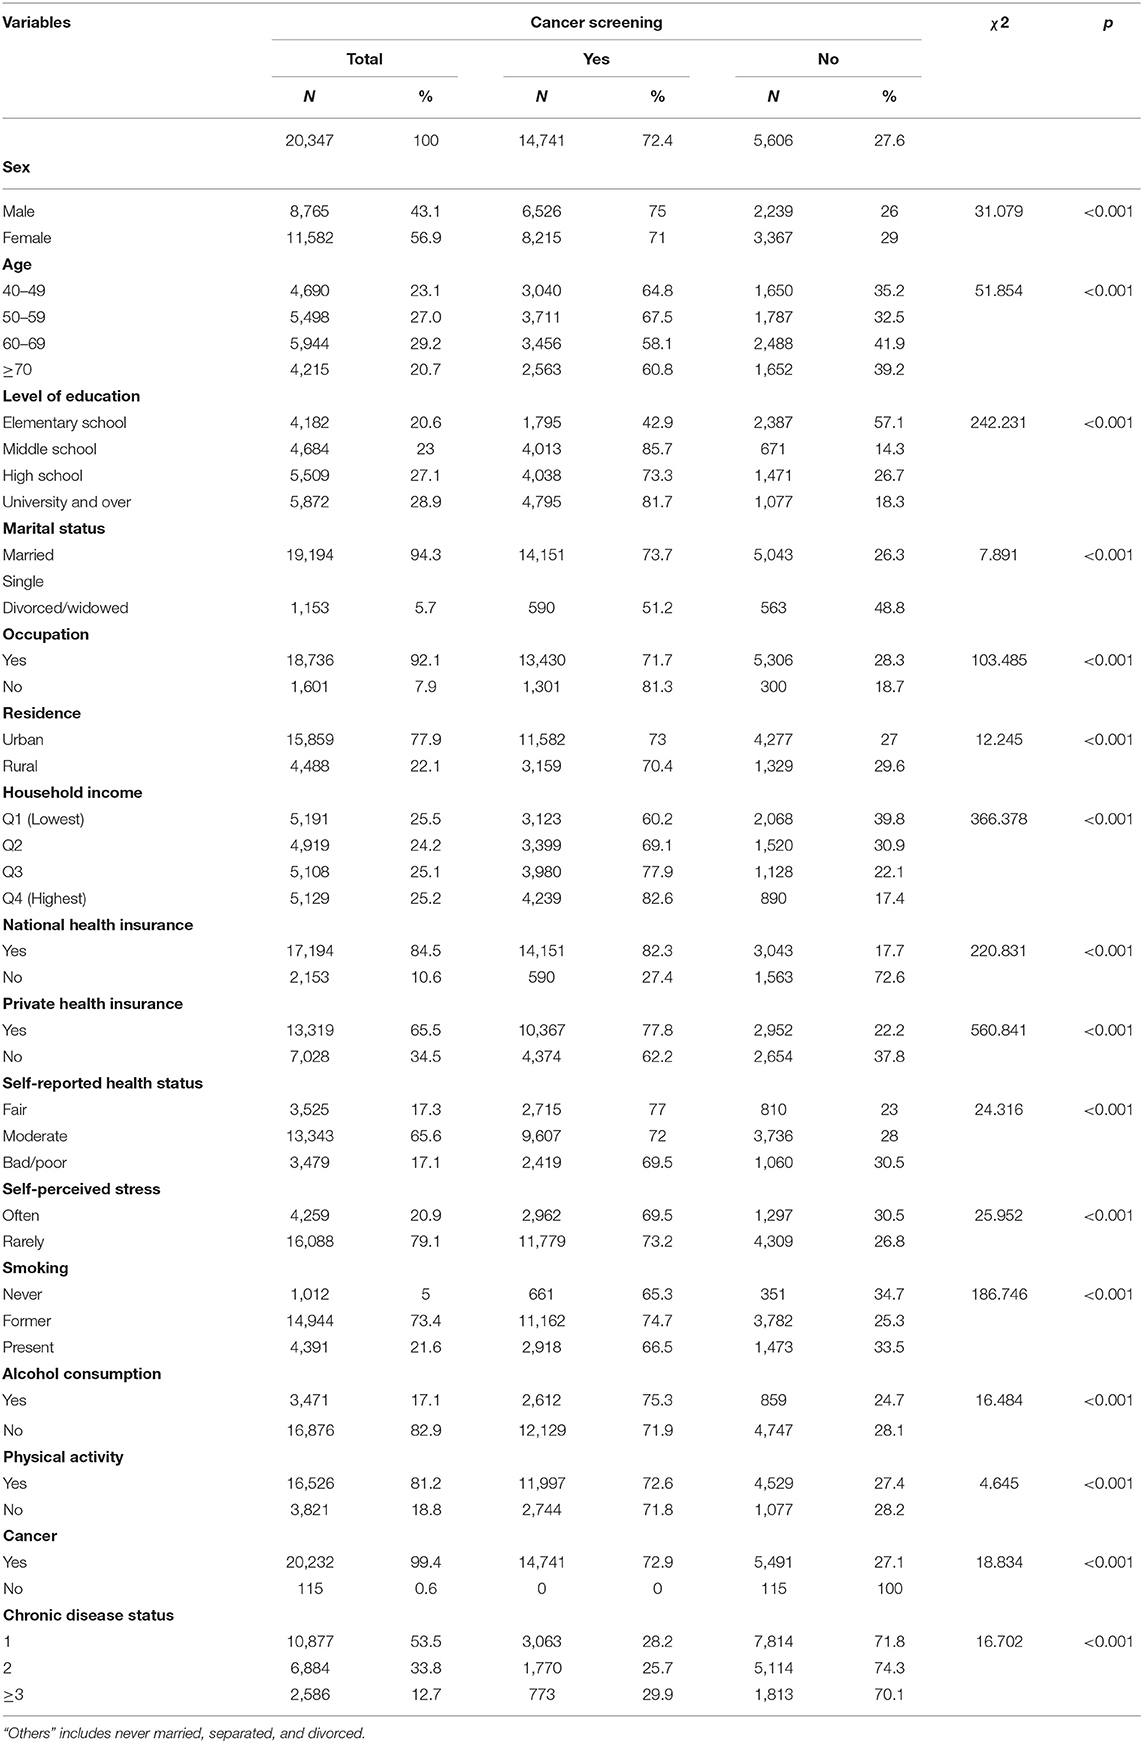
Table 1. Distribution of cancer screening based on general characteristics of participants.
Most participants self-reported fair health status (65.2%), rarely experienced self-perceived stress (79.9%), were former smokers (75.7%), and had habit of alcohol consumption (68.7%). Those who had regular physical activity (81.4%), and more than two chronic diseases (53%) are underwent cancer screening. Chi-square analysis results of comparison between the cancer screening and no screening with demographic variables showed statistically significant differences at p < 0.001 level (Table 1).
Comparison of Types of Cancer Screening Pauyment by Household Income
Table 2 shows cancer screening according to the type and household income. Payment data were not available in 2017 and 2018. Therefore, a total of 13,069 responses were analyzed to determine cancer screening payment types, and most of the participants responded to more than two types of cancer screening. Overall, the findings showed that the percentage of participants free of payment was higher (56.2%) than the percentage of participants with partial payment (45.1%) and self-payment (15.1%). In the case of self-payment cancer screening, the 4th quartile was 6.3%, partial payment (13.8%), and free payment was higher in the lowest group (14.7%). The results were statistically significant between the type of cancer screening payment and household income.
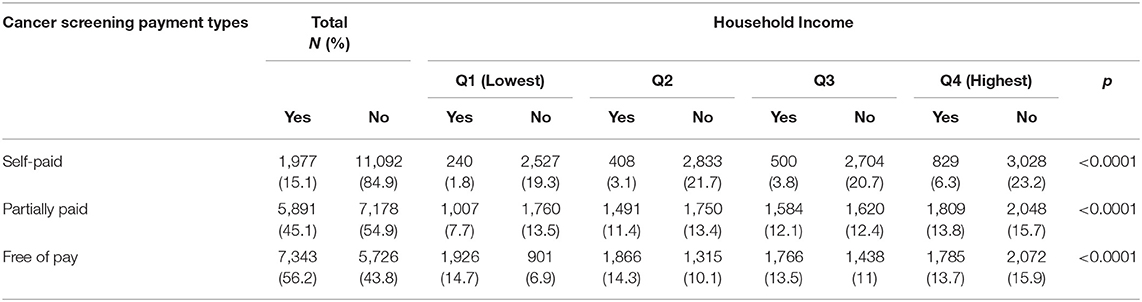
Table 2. Frequency distribution of types of cancer screening by household income.
Multivariate Logistic Regression Analysis of Factors Associated With Cancer Screening and Covariates
Table 3 summarizes the results of the multivariate logistic regression models of factors associated between cancer screening and selected independent variables. In Model 1, differences of cancer screening among male are showed less likelihood of cancer screening compared to women. The age of 50–59 years (OR = 1.07, 95% CI, 1.00–1.11) are showed good proportion than other age groups. The odds ratio of having a university or over (OR = 1.25, 1.02–1.47) was significantly associated with cancer screening rather than having an elementary-level education. In terms of occupation was significantly more likely to have cancer screening (OR = 1.41, 95% CI, 1.15–1.73) than the no occupation. Participants residing in urban areas (OR = 1.11, 95% CI, 1.02–1.19) and not consuming alcohol (OR = 1.24, 95% CI, 1.16–1.30) were more likely to undergo cancer screening than their counterparts.
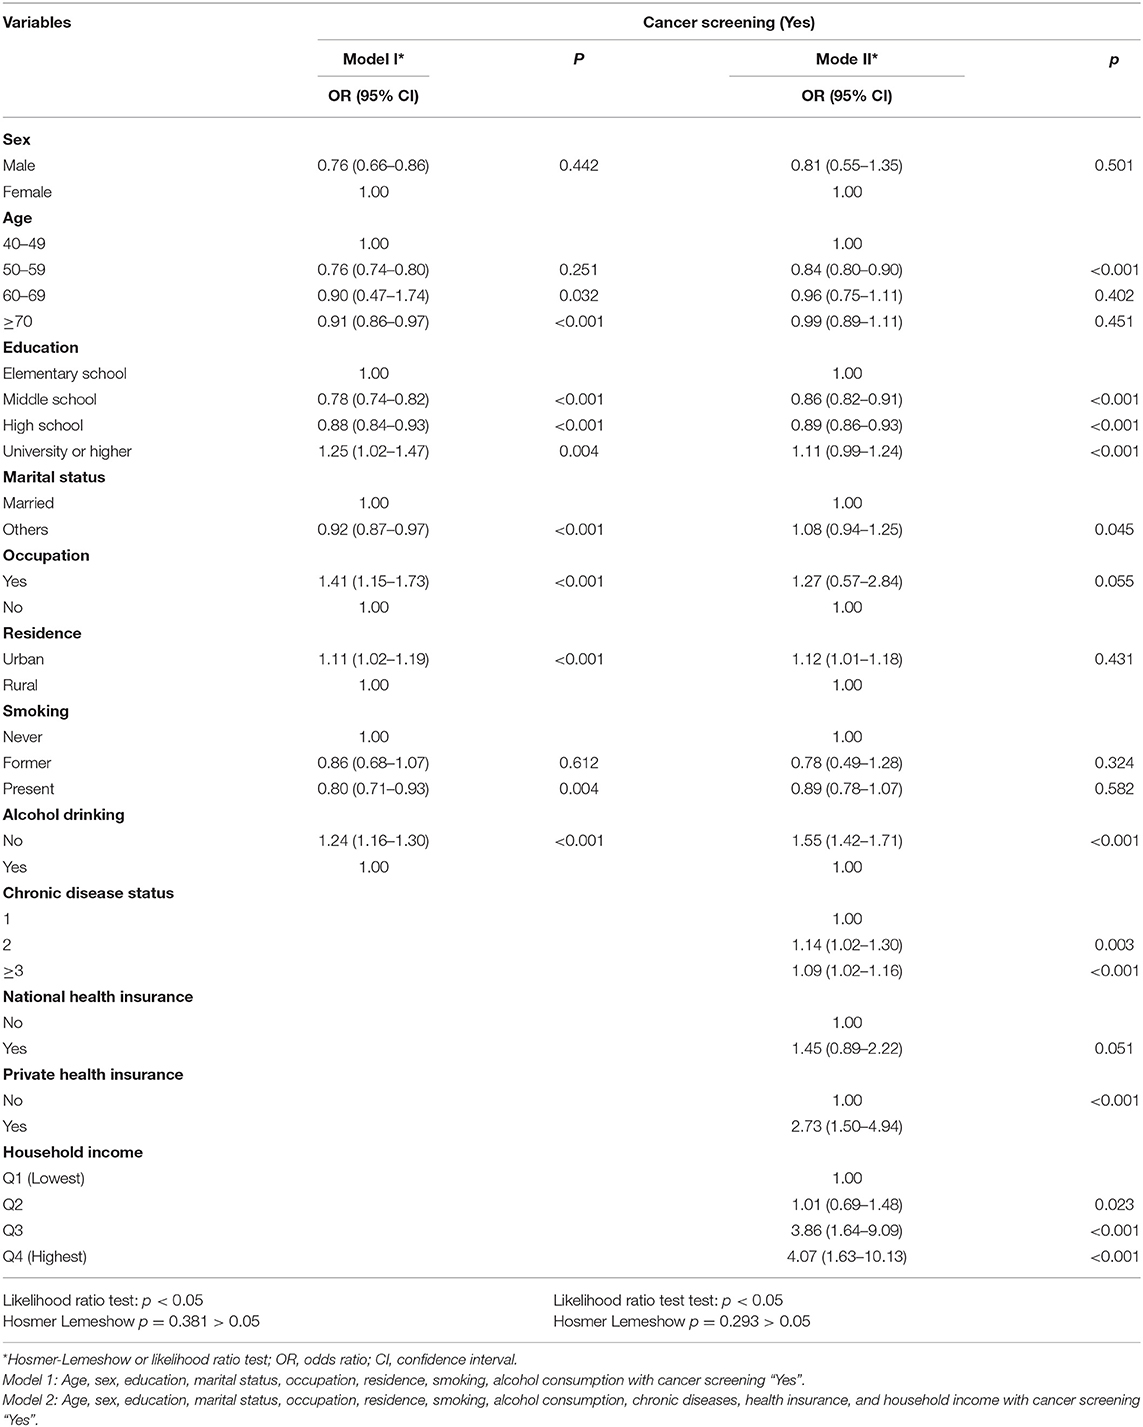
Table 3. Multivariate logistic regression of factors associated with cancer screening.
After adjusting for age, sex, Age, sex, education, marital status, occupation, residence, smoking, alcohol consumption, chronic diseases, health insurance, and household income in model 2, participants with two (OR = 1.14, 95% CI, 1.02–1.30) and ≥3 (OR = 1.06, 95% CI, 1.03–1.16) comorbidity were more likely to undergo cancer screening than individuals with 1 condition. Those who had private health insurance (aOR = 2.73, 95% CI, 1.50–4.94) were more likely to undergo cancer screening than those with no private health insurance. The participants in Q3 (OR = 3.86, 95% CI, 1.64–9.09) and Q4 (OR = 4.07, 95% CI, 1.63–10.13) were more likely to undergo cancer screening than those in Q1. As a result of the Likelihood ratio test, at least one of the independent variables used in the analysis was significant by rejecting the null hypothesis with p < 0.05 in all models. The p-value of Hosmer and Lemeshow goodness of-fit test logistic regression model showed >0.05, therefore, it can be confirmed that the model was fit to the data well (Table 3).
Subgroup Analysis of Household Income and Selected Covariates
The subgroup analysis of household income is presented in Table 4. Overall, we observed income-related disparities in cancer screening, i.e., the highest income quintile underwent more cancer screening than the lowest income quintile. In household income group Q4, women (aOR = 1.38, 95% CI, 1.24–1.54), individuals aged 40–49 years (aOR = 1.77, 95% CI, 1.08–2.92), and individuals with private insurance (aOR = 3.06, 95% CI, 1.60–5.13) were more likely to undergo cancer screening (p < 0.001) than those of the Q1 household income group. The highest income group of Q4 comprising participants with university and higher education and chronic diseases showed a higher aOR for undergoing cancer screening than those who had low household income, elementary-level education, and one chronic disease (Table 4).
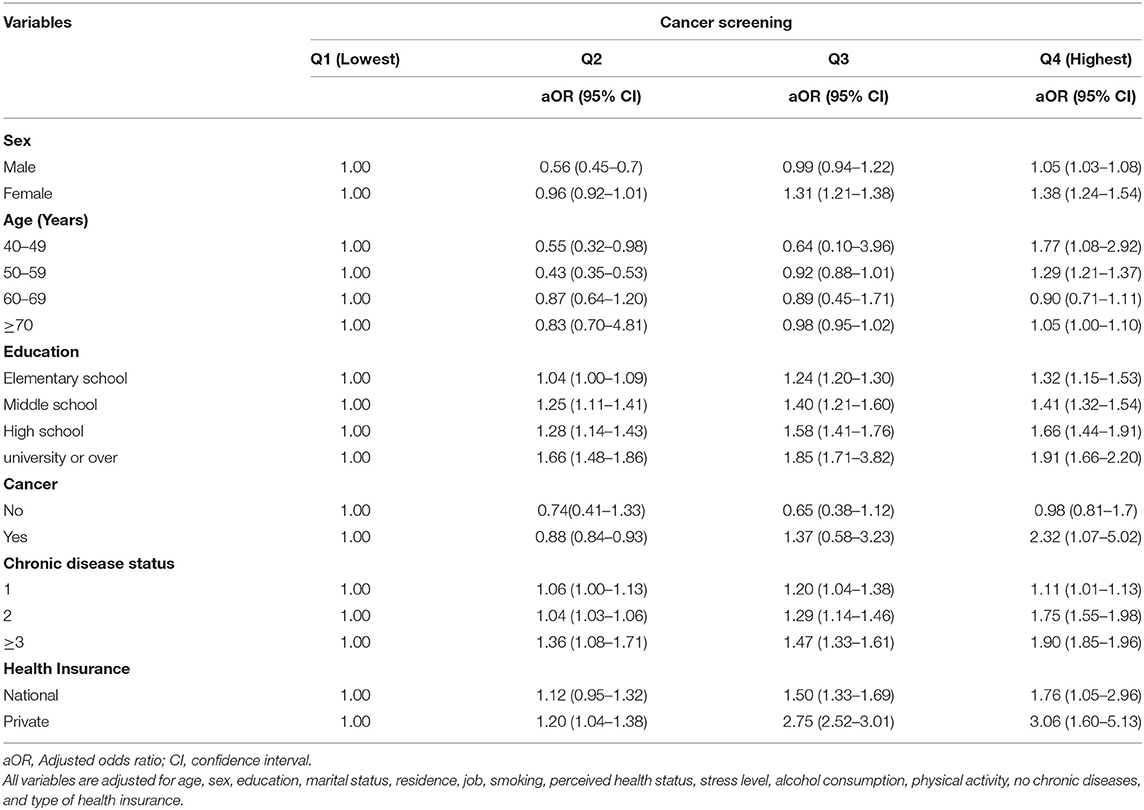
Table 4. Subgroup analysis of associations between cancer screening and household income.
Discussion
This study aimed to analyze income disparities in the utilization of cancer screening services by using data from the KHNANES from to 2013–2019 and identified associations of various socio-demographic and health status characteristics. The study findings suggest that income disparities in cancer screening are strongly associated with education, the number of chronic diseases, and private health insurance membership.
Using a large sample of nationwide data, this study found that socioeconomic status and lifestyle characteristics were associated with cancer screening utilization. Our findings revealed that, women have higher screening rates than men. This result emphasizes the need to generate more awareness about cancer screening among male participants. This may be explained by the fact that women have more routine health visits such gynecological visits then men. The age group of 50–59 years, highest education status, non-alcohol users, and urban residence were significantly associated with cancer screening participation.
Cancer screening showed an increasing trend among the age group of 50–59 years; it is widely accepted that middle aged individuals may be more health conscious than older individuals (14, 22, 25–27, 31). However, household work, working pressure, and time affect the other age groups' access to health service even though the services are free, making the population more vulnerable to preventable diseases (12, 13, 23, 26–28). Awareness about cancer screening services might change the attitude of older adults to utilize the service.
Regarding lifestyle, those who had university and higher education status, resided in an urban area, did not consume alcohol, never smoked, and exercised regularly had higher cancer screening utilization. According to the review of previous studies on factors related to cancer screening, most studies reported that drinking, exercise, and smoking did not have a significant correlation with cancer screening (14, 21, 22, 25, 31, 32). However, in some studies, alcohol, smoking, and exercise habits affected early cancer screening. It has been suggested that there is a significant relationship among these factors toward utilization of cancer screening (14, 25–28, 31, 32). Therefore, necessary action should be taken regarding health awareness and follow-up behaviors toward primary prevention with health care access and screening participation.
When an individual had to bear the complete expense to undergo cancer screening, it was found that Q4 had higher screening participation than Q1, evidently because those with lower incomes could not afford cancer screening. Therefore, individuals' socioeconomic condition, which determines their ability to pay for such care services, was considered a specific cause of poor cancer screening participation.
Regarding income, Q1 (lowest) was negatively associated with selected variables. According to the literature, there was no significant association between utilization of cancer screening and age, private insurance, smoking, moderate-intensity physical activity, and the presence or absence of cancer (13, 21, 27, 32). Sex, private insurance, and number of chronic diseases had a significant effect on the use of cancer screening in the highest income group. Overall, it was found that there are many significant variables affecting the use of cancer screening in the low-income group. These results are supported by findings in the literature, especially that participants in the lowest income group are less likely to utilize cancer screening services (12, 15, 16, 28, 29, 32, 34). It is necessary to raise awareness, develop education-related health behavior, and strengthen screening program recommended to motivate cancer screening in the low-income group.
Previous studies notified that barriers hindering participation in NCSP include less trust in these programs and a lack of awareness of the existence and importance of it (15, 17, 30, 35), since participants believed that the free screening services were of low quality (19, 20, 23, 29, 35). In addition, regarding utilization of cancer screening, there was a lower association among participants who did not have private insurance. In Korea, private insurance is not mandatory for all, and individuals can voluntarily enroll in private insurance in addition to the national health insurance (3, 7–9, 30). However, private insurance covers additional payment, which is not paid by the National Health Insurance. People with high health consciousness or with a high number of chronic conditions may be more likely to have private insurance such as covering cancer screening.
In Korea, NHI enrollment is compulsory for public officials and private school faculty members. An estimated 3–5% of people below the poverty line who cannot afford health insurance premiums are covered by Medicaid (Private insurance) (10, 33, 34). Although the NHI and Medicaid virtually made a guarantee to access universal health insurance coverage, low benefit levels and high out-of-pocket costs-imposed limits on the health services received by some beneficiaries, notably those in lower income brackets (13, 16, 19, 29). In our study, low-income participants had lower prevalence of cancer screening, similar to previous studies (13, 15, 16, 29, 33, 34). This might be due to increased concerns about health expenditure by low-income groups, which might affect utilization of health services such as cancer screening.
Furthermore, our findings suggest that socioeconomic status is a very important factor for providing equal access to prevention-oriented primary care. It is necessary to develop awareness-related interventions at the national and regional levels to reduce income disparities in cancer screening utilization. Our findings are similar to previous studies suggesting that income disparity impacts cancer screening positively (13, 14, 16, 17, 20–23, 29, 32). In addition, cancer screening was highly associated with education level, number of chronic diseases, and private insurance coverage (17, 24, 30, 33, 35). The findings revealed that, the causes of less cancer screening utilization is as an important public health challenge. To increase the proportion of older adults that implement regular preventive measures, it could be useful to improve population-based screening services.
The strength of our study lies on the large sample size and the population based self-reported survey data, and this study focused on income disparities with recently available secondary data. There are some policy implications based on the study findings are as follows: the intension of the cancer screening participation to be increased from the middle-aged adults, it could be viewed as a good impact factor of routine screening behavior. The healthcare professionals or policy administrators need to identify and providing the counseling about screening and early detection of cancer according to socio-economic status also important to reduce the income-based disparities in cancer screening. Cancer screening showed differences based on demographic characteristics such as education level, household income, occupation, and perceived health status, it is recommended to expand the scope of free screening for most common cancers and create an environment and individual general characteristics that would make it easier on participation of the people in cancer screening, such as providing paid vacation time, to resolve this income-based disparities. This study recommended to revise the cancer screening duration from “two years to one year” as a benchmark to determine whether the respondents undergone cancer screening.
Our results should be interpreted with reasonable limitations. First, cancer screening responses were self-reported and may not be accurate in determining type of cancer screening based on self, partial, and free payment. Therefore, we did not perform logistic regression analysis based on the type of cancer screening. However, literature reporting the association between cancer screening and household income is most likely based on the self-reported responses, which may have influenced the results. Second, Our study included chronic conditions but did not draw conclusions on the severity of the disease or types of cancer. Therefore, it is considered that vulnerabilities in utilizing cancer screening arise as a result of income disparity. Third, this study considered self-perceived stress level by two categories, and it was assessed by the question addressed in KNHANES data. Since the responses are based on respondent's self-report, this may have been affected the recall bias. Therefore, future studies could focus on standardized stress assessment tool such as DAAS-21, which is a set of three scales and more useful to consider even small changes in symptoms, rather than focusing on categorical differences.
Conclusions
In the present study, we found an association between the utilization of cancer screening and the household income group. There is a need to develop specific policies for the expansion of public screening programs for the low-income class, to provide more efficient early cancer screening. It was reported that there were also differences in factors associated with the use of cancer screening according to different categorical levels. We also found that the middle-aged group was a vulnerable group that was more likely to not utilize cancer screening than the older adult group. Cancer is widespread among middle-aged individuals >45 years, and it is a serious public health issue. Therefore, it is necessary to make more intention among middle-aged adults to participate in the cancer screening than older adults. Furthermore, attention and effective collaborative efforts by policymakers, health plan administrators, third-party payers, and healthcare providers are needed. In addition, there is a need to develop specific policies for the expansion of public screening programmes for the low-income class to provide more efficiency to encourage regular early cancer screening, especially in the middle-aged group. In the future, research on related factors will be necessary through analysis of the current use of cancer screening programs according to household income level by specific cancer type among middle-aged adults by using the National Health Insurance Service data.
To mitigate potential policy implications, we have developed the population-based cancer indicators and monitoring (38), under the National Cancer Center collboration project, Korea, which included cancer screening and early detection in order to find the community-based (socioeconomic status) vulnerable risk population. In addition, the planned methods (e.g., searching references lists, panel discussion, model development, independent data extraction or quality checks) are consistent with the highest standards for evidence synthesis. This study believed that the planned methods will identify and provide a rigorous evaluation of the cancer screening-related indicators and policy guidelines.
The recommended policy implications have been divided into population-based screening (38) and opportunistic screening (39) based on evidence of existing research. Opportunistic cancer screening programs differ in terms of the cancers screened, the duration between screenings, and the specific cancer type, based on individual decisions or recommended by the health care providers. The national policymakers continue to refine the research with an eye toward improving policies and appraise the evidence for cancer screening based on developed guidelines. We hope that our population-based cancer screening guidelines and opportunistic cancer screening will be used directly or indirectly to other countries or regions interested according to their organizational and healthcare pattern to improve the cancer screening trends among the entire population.
Data Availability Statement
The datasets presented in this study can be found in online repositories. The names of the repository/repositories and accession number(s) can be found below: https://knhanes.kdca.go.kr/knhanes/sub03/sub03_01.do.
Ethics Statement
The studies involving human participants were reviewed and approved by KNHANES was approved by the KDCA Institutional Review Board (2018-01-03-P-A) in 2018. Written informed consent for participation was not required for this study in accordance with the national legislation and the institutional requirements.
Author Contributions
VR, JS, SL, and THK: conceptualization. SL and JS: methodology. VR: data collection and investigation. VR and JS: writing—original draft preparation. SL and THK: writing. All authors read and approved the final manuscript.
Conflict of Interest
The authors declare that the research was conducted in the absence of any commercial or financial relationships that could be construed as a potential conflict of interest.
Publisher's Note
All claims expressed in this article are solely those of the authors and do not necessarily represent those of their affiliated organizations, or those of the publisher, the editors and the reviewers. Any product that may be evaluated in this article, or claim that may be made by its manufacturer, is not guaranteed or endorsed by the publisher.
Acknowledgments
This study used data from the Korea National Health and Nutrition Examination Survey (KNHANES) database. The authors would like to thank the Korea Centers for Disease Control and Prevention (KCDC) for microdata that are publicly available through the KNHANES website (http://knhanes.cdc.go.kr).
References
1. World Health Organization (WHO). Global Health Estimates 2020: Deaths by Cause, Age, Sex, by Country and by region, 2000-2019. WHO (2020). Available online at: https://www.who.int/data/global-health-estimates (accessed: December 11, 2020).
2. Korea Central Cancer Registry. Annual Report of Cancer Statistics in Korea in 2012. (2014). Available online at: http://ghdx.healthdata.org/record/south-korea-annual-report-cancer-statistics-korea-2012
3. Jung KW, Won YJ, Kong HJ, Lee ES. Cancer statistics in Korea: incidence, mortality, survival, and prevalence in 2016. Cancer Res Treat. (2019) 51:417–30. doi: 10.4143/crt.2019.138
4. Lee KS, Chang HS, Lee SM, Park EC. Economic burden of cancer in Korea during 2000–2010. Cancer Res Treat. (2015) 47:387–98. doi: 10.4143/crt.2014.001
5. Nguyen TXT, Han M, Ki M, Kim YA, Oh JK. The economic burden of cancers attributable to infection in the republic of Korea: a prevalence-based study. Int J Environ Res Public Health. (2020) 17:7592. doi: 10.3390/ijerph17207592
6. Kim YA, Lee YR, Park J, Oh IH, Kim H, Yoon SJ, et al. Socioeconomic burden of cancer in Korea from 2011 to 2015. Cancer Res Treat. (2020) 52:896–906. doi: 10.4143/crt.2019.398
7. Paci E, Broeders M, Hofvind S, Puliti D, Duffy SW, EUROSCREEN Working Group. European breast cancer service screening outcomes: a first balance sheet of the benefits and harms. Cancer Epidemiol Biomarkers Prev. (2014) 23:1159–63. doi: 10.1158/1055-9965.EPI-13-0320
8. Rebbeck TR, Burns-White K, Chan AT, Emmons K, Freedman M, Hunter DJ, et al. Precision prevention and early detection of cancer: fundamental principles. Cancer Discov. (2018) 8:803–811. doi: 10.1158/2159-8290.CD-17-1415
10. National Health Insurance Corporation. 2014 National Health Screening Statistical Yearbook. (2015). p. 12.
11. Ministry of Health Welfare and Family Affairs. The 2009 national cancer screening program information;2009. Available online at: http://www.mw.go.kr (accessed: October 10, 2010).
12. Suh M, Choi KS, Park B, Lee YY, Jun JK, Lee DH, et al. Trends in cancer screening rates among Korean men and women: results of the Korean National Cancer Screening Survey, 2004–2013. Cancer Res Treat. (2016) 48:1–10. doi: 10.4143/crt.2014.204
13. Kang HY, Kim I, Kim YY, Bahk J, Khang YH. Income differences in screening, incidence, postoperative complications, and mortality of thyroid cancer in South Korea: a national population-based time trend study. BMC Cancer. (2020). 20:1096. doi: 10.1186/s12885-020-07597-4
14. Park MJ, Park E, Choi KS, Jun JK, Lee H. Sociodemographic gradients in breast and cervical cancer screening in Korea: the Korean national cancer screening survey (KNCSS) 2005-2009. BMC Cancer. (2011) 11:257. doi: 10.1186/1471-2407-11-257
15. OECD. Poverty Gap (indicator), Internet (2019). Available online at: https://data.oecd.org/inequality/poverty-gap.htm#indicator-chart Cancer Control: knowledge into action, WHO (2016).
16. Jung HM, Lee JS, Lairson DR, Kim Y. The effect of national cancer screening on disparity reduction in cancer stage at diagnosis by income level. PLoS ONE. (2015). 10:e0136036. doi: 10.1371/journal.pone.0136036
17. Lee K, Lim HT, Hwang SS, Chae DW, Park SM. Erratum to: “Socioeconomic disparities in behavioral risk factors for cancer and use of cancer screening services in Korean adults aged 30 years and older: the Third Korean National Health and Nutrition Examination Survey, 2005. (KNHANES III)” [Public Health 124 (2010):698-704]. Public Health. (2011) 125:243. doi: 10.1016/j.puhe.2011.01.006
18. Ministry Ministry of Health and Welfare of Korea Korea Centers for Disease Control and Prevention. 2011 Korea Health Statistics. Seoul: Ministry of Health and Welfare of Korea (2012).
19. Korea Ministry of Health and Welfare. Trend in the Uptake of Cancer Screening: Adults Over the Age of 19. Seoul: Korea Ministry of Health and Welfare (2013).
20. Kim S, Kwon S, Subramanina SV. Has the national cancer screening program reduced income inequalities in screening attendance in South Korea? Cancer Causes Control. (2015) 26:1617–25. doi: 10.1007/s10552-015-0655-8
21. Goodwin BC, Rowe AK, Crawford-Williams F, Baade P, Chambers SK, Ralph N, et al. Geographical disparities in screening and cancer-related health behaviour. Int J Environ Res Public Health. (2020) 17:1246. doi: 10.3390/ijerph17041246
22. Damiani G, Federico B, Basso D, Ronconi A, Bianchi CB, Anzellotti GM, et al. Socioeconomic disparities in the uptake of breast and cervical cancer screening in Italy: a cross sectional study. BMC Public Health. (2012) 12:99. doi: 10.1186/1471-2458-12-99
23. Ahmed S, Shahid RK, Episkenew JA. Disparity in cancer prevention and screening in aboriginal populations: recommendations for action. Curr Oncol. (2015) 22:417–26. doi: 10.3747/co.22.2599
24. Coughlin SS, Leadbetter S, Richards T, Sabatino SA. Contextual analysis of breast and cervical cancer screening and factors associated with health care access among United States women, (2002). Soc Sci Med. (2008) 66:260–75. doi: 10.1016/j.socscimed.2007.09.009
25. Lim JH, Kim SY. Factors affecting colorectal cancer screening behaviors: based on the 4th Korean National Health and nutrition examination survey. Korean J Health Educ Promot. (2011) 28:69–80.
26. Lee M, Chang HS, Park E, Yu S, Sohn M, Lee SG. Factors associated with participation of Korean women in cervical cancer screening examination by age group. Asian Pac J Cancer Prev. (2011) 12:1457–62.
27. Kwak MS, Park EC, Bang JY, Sung NY, Lee JY, Choi KS. [Factors associated with cancer screening participation, Korea]. J Prev Med Public Health. (2005) 38:473–81.
28. Choi B, Um TR, Lee KS. Factors related to cancer screening behaviors. Epidemiol Health. (2018) 40:e2018011. doi: 10.4178/epih.e2018011
29. Heo J, Hwang J. Income-related inequalities: in cancer screening. Health Soc Welf Rev. (2014) 34:59–81. doi: 10.15709/hswr.2014.34.3.59
30. Kim HS, Park BK, Sung HK. Recent Rise in Household Savings Rate: Causes and Implications, Bank of Korea, Monthly Bulletin, 72 (2018).
31. Shin JY, Lee DH. Factors associated with the use of gastric cancer screening services in Korea: the Fourth Korea National Health and Nutrition Examination Survey 2008 (KNHANES IV). Asian Pac J Cancer Prev. (2012) 13:3773–9. doi: 10.7314/APJCP.2012.13.8.3773
32. Akinyemiju T, Ogunsina K, Sakhuja S, Ogbhodo V, Braithwaite D. Life-course socioeconomic status and breast and cervical cancer screening: analysis of the WHO's Study on Global Ageing and Adult Health (SAGE). BMJ Open. (2015) 6:e012753. doi: 10.1136/bmjopen-2016-012753
33. Lee YY, Jun JK, Suh M, Park B, Kim Y, Choi KS. Barriers to cancer screening among medical aid program recipients in the Republic of Korea: a qualitative study. Asian Pac J Cancer Prev. (2014) 15:589–94. doi: 10.7314/APJCP.2014.15.2.589
34. Chang HK, Myong J, Byun SW, Lee SJ, Lee YS, Lee HN, et al. Factors associated with participation in cervical cancer screening among young Koreans: a nationwide cross-sectional study. BMJ Open. (2017) 7:e013868. doi: 10.1136/bmjopen-2016-013868
35. Lee JW, Ahn SY, Kim KH. Study on factors that influence cancer screening rate in urban and rural areas. J Digit Convergence. (2012) 10:269–78.
36. World Health Organization. International Guide for Monitoring Alcohol Consumption and Related Harm. World Health Organization (2000). Available online at: https://apps.who.int/iris/handle/10665/66529
37. Ainsworth BE, Haskell WL, Whitt MC, Irwin ML, Swartz AM, Strath SJ, et al. Compendium of physical activities: an update of activity codes and MET intensities. Med Sci Sports Exerc. (2000) 32:S498–504. doi: 10.1097/00005768-200009001-00009
38. Rajaguru V, Jang J, Kim J, Kwon J, Cho O, Chung S, et al. Development of population-based cancer indicators and a measurement of cancer care continuum using a modified delphi method. Cancers. (2021) 13:4826. doi: 10.3390/cancers13194826
Keywords: cancer, cancer screening, income disparity, public health, health status
Citation: Rajaguru V, Kim TH, Shin J and Lee SG (2022) Income Disparities in Cancer Screening: A Cross-Sectional Study of the Korean National Health and Nutrition Examination Survey, 2013–2019. Front. Public Health 10:820643. doi: 10.3389/fpubh.2022.820643
Received: 23 November 2021; Accepted: 27 January 2022;
Published: 17 March 2022.
Edited by:
Mahmudul Alam, Universiti Utara Malaysia, MalaysiaReviewed by:
Bee Wah Tan, Universiti Utara Malaysia, MalaysiaBazeet Badru, Universiti Utara Malaysia, Malaysia
Copyright © 2022 Rajaguru, Kim, Shin and Lee. This is an open-access article distributed under the terms of the Creative Commons Attribution License (CC BY). The use, distribution or reproduction in other forums is permitted, provided the original author(s) and the copyright owner(s) are credited and that the original publication in this journal is cited, in accordance with accepted academic practice. No use, distribution or reproduction is permitted which does not comply with these terms.
*Correspondence: Sang Gyu Lee, bGVldmFuQHl1aHMuYWM=