 Alexandre Vallée
- Department of Clinical Research and Innovation, Foch Hospital, Suresnes, France
The spread of the COVID-19 pandemic has shown great heterogeneity between regions of countries, e. g., in the United States of America (USA). With the growing of the worldwide COVID-19 pandemic, there is a need to better highlight the variability in the trajectory of this disease in different worldwide geographic areas. Indeed, the epidemic trends across areas can display completely different evolution at a given time. Geo-epidemiological analyses using data, that are publicly available, could be a major topic to help governments and public administrations to implement health policies. Geo-epidemiological analyses could provide a basis for the implementation of relevant public health policies. With the COVID-19 pandemic, geo-epidemiological analyses can be readily utilized by policy interventions and USA public health authorities to highlight geographic areas of particular concern and enhance the allocation of resources.
Introduction
The spread of the COVID-19 pandemic has shown great heterogeneity between regions of countries, e.g., in the United States of America (USA) (1–4). Geo-epidemiological differences between incidence, infection and mortality rates have been correlated with arrival time of the COVID-19 virus (5), population age structure (6), socio-economic development and population density (7), the health insurance system (8), climatic and meteorological determinants (9), and anti-contagion policies and health practices (10). Recent studies have shown that the geo-epidemiological distribution of the epidemic waves has been heterogeneous across countries (11, 12). Thus, geo-epidemiological analyses using data, that are publicly available, could be of major importance to help governments implement efficient health policies (13–15).
With the worldwide COVID-19 pandemic, there is a need to better highlight the geo-epidemiological variability in the trajectory of this pandemic in different worldwide areas. Indeed, the epidemic trends across areas can change completely at a given time. Dynamics include increasing trends, leveling off, stationary incidence patterns, and decreasing trends. Moreover, the growth could be marked by several modes depicting different pandemic waves (16). The subnational level of the epidemic curves within a country will display different trends over time. Because the type and intensity of public health policies can vary across space, classifying and summarizing the geo-epidemiological dynamics of the COVID-19 pandemic is essential for real-time public health policy making (17).
The USA maps show no homogenous infection rates over time in regions regardless of the four waves (Figure 1A). On the day of the epidemic peaks for the waves, USA maps show very different infection rates between the regions on the day of the national peak regardless of the waves. This illustrates that local epidemic peaks appear at different times. The national peak may not be a good indicator for local management of the epidemic. Moreover, the distribution of new cases between the minimum of infection counts and the national peak time between the third and fourth wave shows that the fourth wave mainly developed in the southeast of the USA (Figure 1A, 4th wave) while during the national peak the states with the highest rates of infection were in the northwest (Figure 1C, 4th wave). Similar differences can be also observed for the rolling 7-day average before the national peak time of each wave (Figure 1B) and for the incidence of new cases at the day of the national epidemic peak (Figure 1C).
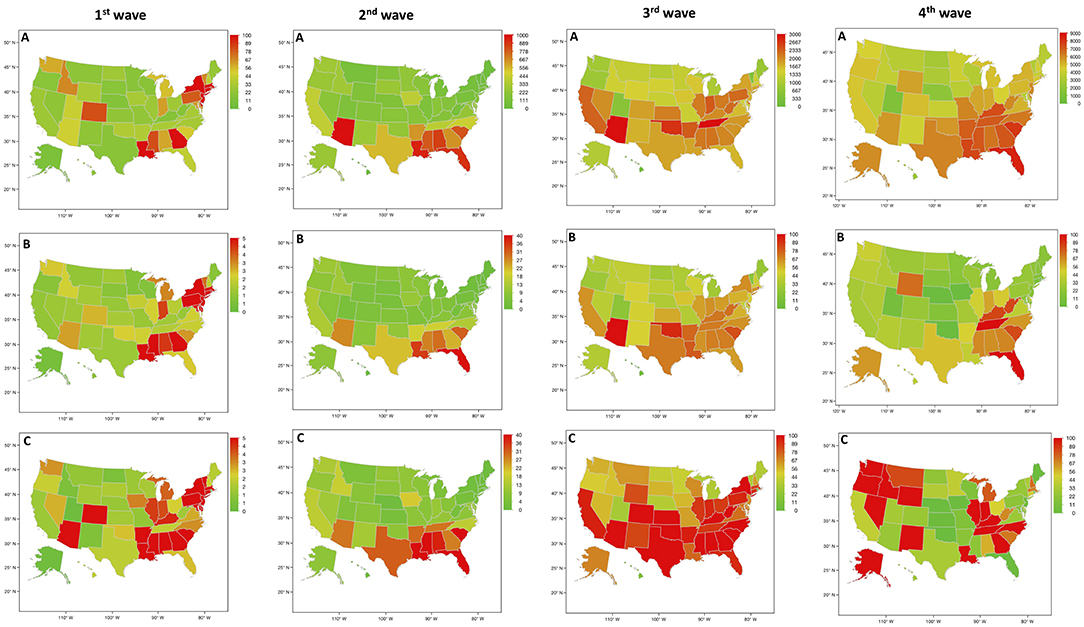
Figure 1. Count of new cases of COVID-19 patients across the USA for the four waves (new cases were reported by states divided by the population of each state and per 100.000 inhabitants). (A) New cases between the minimum of infection counts and the national peak time between two waves. (B) Rolling 7-day average before the national peak time of each wave. (C) Incidence of new cases for the national peak time of each wave.
The data that support the observations of this study are openly available in https://github.com/CSSEGISandData/COVID-19.
Discussion
Showing epidemic trends in advance may reveal more about the geographic risks and social and economic determinants which impact the mechanism of COVID-19 transmission, as well as how to respond to it. Several investigations have focused on the prediction of the epidemic trend of COVID-19 (18–21), but there are few reports of countries that report high-resolution, geo-epidemiological data. Aggregate (at the level of states- or country-wide) data of epidemics can be irrelevant when the local levels are not factored in the absence of geo-epidemiological data (22).
Geo-epidemiological analyses of epidemics could be described as the approach by which one compares epidemiological data of these epidemics across different geographical regions and populations, in the process identifying high geographical resolution (e.g., neighborhood or county/municipality level), environmental, geo-temporal, and socioeconomic factors. This approach provides valuable information about the global and regional burden of epidemics that could shape resource-planning, policy making, funding, healthcare considerations, and therapeutic intervention (23). Moreover, geo-epidemiology could prevent the errors and/or lack of practical (policy-related) consequences associated with low-resolution, spatial data, i.e., state- or country-level data.
Interdisciplinary analyses have been shown to investigate epidemics (24). The consideration of geo-epidemiology in the design of policies could improve the impact of such policies (24–26). Moreover, local geo-referenced and temporal data could unmask dynamic and complex associations influencing disease dissemination (27, 28). For example, investigations of the biogeography associated with rabies may detect markers promoting epidemic spread as well as barriers preventing dissemination (29). In geo-epidemiological investigations, disease mapping, disease clustering and individuals and ecological analyses are closely related (30).
A more comprehensive picture of a spatial problem can be achieved when the results of geographical aggregate-level data are combined with those at the individual level. Multilevel modeling, hierarchical and contextual analyses are phrases describing one of the various statistical methods in which this combination is allowed (31). Multilevel modeling is a powerful technique that can be utilized to determine how much of the ecological effect can be explained by variations in the distribution of individual-level risk factors. At this effect, attempts have been made to integrate this kind of analysis into geo- and social-epidemiology (32). There are also developments incorporating time changes along with spatial variation. Spatial models often lack transparency into the determinants of epidemiological dynamics. Thus, geo-epidemiological models are able to provide new insights into the spread of epidemics that are otherwise unavailable.
Geo-epidemiological differences in the trajectories of the COVID-19 pandemic in different worldwide areas should be investigated. Geo-epidemiological investigation can enhance an objective framework to investigate the epidemic geo-epidemiological dynamics in different areas within the same country. Functional data analyses have been utilized to investigate biologic mechanisms, stock market trends, weather patterns, underlying medical conditions, growth rates, and speech data. In the context of the COVID-19 pandemic, in China, clustering of curves was investigated to understand travel patterns of migrants (17, 33). Although attempts have been used to enhance the accuracy and validity of these estimates, the current data and algorithms focusing on domestic and international COVID-19 transmission are rather unclear, because of the spatiotemporal heterogeneity of the spread of the pandemic and poor understanding of its transmission processes. As an argument, only knowing the infection rate of a state as large as Texas, in the USA, or countries as extended as Russia and Chile do not facilitate cost-effective, site-specific and control measures. In contrast, it was analyzing actual geo-temporal-epidemiological data that it was discovered that many epidemics (including COVID-19) disseminate through preexisting connecting structures (e.g., road networks, airlines transports) (22, 27).
With the development of the epidemic, the spread of COVID-19 has gradually shifted from an imported case pattern to a local case pattern. Greater transmission risks observed in areas were in regions with low-detection capacity, high transportation, or economic connectivity to the epicenter of the outbreak.
Several studies have shown that the transmission of an infectious disease is modulated by viral characteristics and population susceptibility, as well as social and health conditions (34). Besides these common markers, the COVID-19 pandemic is also influenced by many specific markers, such as population age structure and human mobilities (19, 35).
Moreover, socioeconomic factors could show significant associations with COVID-19 transmission. The proportion of primary industries is found to be mainly correlated with the spatiotemporal mitigations of COVID-19 in provinces. The proportion of medical resources and rate of medical accessibility in an area have a major action in the prevention of infectious diseases (36, 37). Density of population, urban development, and access to transportation could also be correlated with COVID-19 transmission. Moreover, the risk of COVID-19 infection is also mainly modulated by the local population age structure (38).
In addition, the geo-epidemiological heterogeneity in the spread of infectious diseases comes from the socio-economic, and environmental differences among the geospatial units themselves (32). Compared with the possible climate associations implied by several investigations (39, 40), several investigations demonstrate that population density (41), and restrictions in health and mobility policies (42) have a considerable effect on the spread of COVID-19 pandemic. Mobility and connectivity (43), in association with high population density (44), can enhance the pandemic transmission more in terms of the geo-epidemiological differences, supported by research focused on USA county daily commute data (45) and mobility data for Boston (46).
In conclusion, geo-epidemiological heterogeneity of the COVID-19 pandemic has been observed in different USA regions. This observation could provide a basis for the implementation of geo-epidemiological analyses to influence public health policies. Thus, geo-epidemiology of COVID-19 transmission could be readily utilized by policy interventions and the USA public health authorities to highlight geographic areas of particular concern and enhance the allocation of resources.
Data Availability Statement
The datasets presented in this study can be found in online repositories. The names of the repository/repositories and accession number(s) can be found below: https://github.com/CSSEGISandData/COVID-19.
Author Contributions
AV had the original idea, performed the interpretation, wrote the article, and approved the final manuscript.
Conflict of Interest
The author declares that the research was conducted in the absence of any commercial or financial relationships that could be construed as a potential conflict of interest.
Publisher's Note
All claims expressed in this article are solely those of the authors and do not necessarily represent those of their affiliated organizations, or those of the publisher, the editors and the reviewers. Any product that may be evaluated in this article, or claim that may be made by its manufacturer, is not guaranteed or endorsed by the publisher.
Acknowledgments
The author thanks Polly Gobin for the re-writing and English correction.
References
1. CDC COVID-19 Response Team. Geographic differences in COVID-19 cases, deaths, and incidence - United States, February 12-April 7, 2020. MMWR Morb Mortal Wkly Rep. (2020) 69:465–71. doi: 10.15585/mmwr.mm6915e4
2. Khafaie MA, Rahim F. Cross-country comparison of case fatality rates of COVID-19/SARS-COV-2. Osong Public Health Res Perspect. (2020) 11:74–80. doi: 10.24171/j.phrp.2020.11.2.03
3. Juhn YJ, Wheeler P, Wi C-I, Bublitz J, Ryu E, Ristagno EH, et al. Role of geographic risk factors in COVID-19 epidemiology: longitudinal geospatial analysis. Mayo Clin Proc Innov Qual Outcomes. (2021) 5:916–27. doi: 10.1016/j.mayocpiqo.2021.06.011
4. Thorpe A, Scherer AM, Han PKJ, Burpo N, Shaffer V, Scherer L, et al. Exposure to common geographic COVID-19 prevalence maps and public knowledge, risk perceptions, and behavioral intentions. JAMA Netw Open. (2021) 4:e2033538. doi: 10.1001/jamanetworkopen.2020.33538
5. Middelburg RA, Rosendaal FR. COVID-19: how to make between-country comparisons. Int J Infect Dis IJID Off Publ Int Soc Infect Dis. (2020) 96:477–81. doi: 10.1016/j.ijid.2020.05.066
6. Dowd JB, Andriano L, Brazel DM, Rotondi V, Block P, Ding X, et al. Demographic science aids in understanding the spread and fatality rates of COVID-19. Proc Natl Acad Sci USA. (2020) 117:9696–8. doi: 10.1073/pnas.2004911117
7. Su D, Chen Y, He K, Zhang T, Tan M, Zhang Y, et al. Influence of socio-ecological factors on COVID-19 risk: a cross-sectional study based on 178 countries/regions worldwide. medRxiv. (2020). doi: 10.1101/2020.04.23.20077545
8. da Silveira Moreira R. COVID-19: intensive care units, mechanical ventilators, and latent mortality profiles associated with case-fatality in Brazil. Cad Saude Publica. (2020) 36:e00080020. doi: 10.1590/0102-311x00080020
9. O'Reilly KM, Auzenbergs M, Jafari Y, Liu Y, Flasche S, Lowe R. Effective transmission across the globe: the role of climate in COVID-19 mitigation strategies. Lancet Planet Health. (2020) 4:e172. doi: 10.1016/S2542-5196(20)30106-6
10. Hsiang S, Allen D, Annan-Phan S, Bell K, Bolliger I, Chong T, et al. The effect of large-scale anti-contagion policies on the COVID-19 pandemic. Nature. (2020) 584:262–7. doi: 10.1038/s41586-020-2404-8
11. Salje H, Tran Kiem C, Lefrancq N, Courtejoie N, Bosetti P, Paireau J, et al. Estimating the burden of SARS-CoV-2 in France. Science. (2020) 369:208–11. doi: 10.1126/science.abc3517
12. Gaudart J, Landier J, Huiart L, Legendre E, Lehot L, Bendiane MK, et al. Factors associated with the spatial heterogeneity of the first wave of COVID-19 in France: a nationwide geo-epidemiological study. Lancet Public Health. (2021) 6:e222–31. doi: 10.1016/S2468-2667(21)00006-2
13. Srivastava A, Chowell G. Understanding spatial heterogeneity of COVID-19 pandemic using shape analysis of growth rate curves. MedRxiv Prepr Serv Health Sci. (2020). doi: 10.1101/2020.05.25.20112433
14. Thomas LJ, Huang P, Yin F, Luo XI, Almquist ZW, Hipp JR, et al. Spatial heterogeneity can lead to substantial local variations in COVID-19 timing and severity. Proc Natl Acad Sci USA. (2020) 117:24180–7. doi: 10.1073/pnas.2011656117
15. Hou X, Gao S, Li Q, Kang Y, Chen N, Chen K, et al. Intracounty modeling of COVID-19 infection with human mobility: assessing spatial heterogeneity with business traffic, age, and race. Proc Natl Acad Sci USA. (2021) 118:e2020524118. doi: 10.1073/pnas.2020524118
16. Chowell G, Tariq A, Hyman JM. A novel sub-epidemic modeling framework for short-term forecasting epidemic waves. BMC Med. (2019) 17:164. doi: 10.1186/s12916-019-1406-6
17. Srivast A, Chowell G. Title: modeling study: characterizing the spatial heterogeneity of the COVID-19 pandemic through shape analysis of epidemic curves. Res Sq. (2021) rs.3.rs-223226. doi: 10.21203/rs.3.rs-223226/v1
18. Bai Z, Gong Y, Tian X, Cao Y, Liu W, Li J. The rapid assessment and early warning models for COVID-19. Virol Sin. (2020) 35:272–9. doi: 10.1007/s12250-020-00219-0
19. Cao Z, Zhang Q, Lu X, Pfeiffer D, Wang L, Song H, et al. Incorporating human movement data to improve epidemiological estimates for 2019-nCoV. medRxiv. (2020). doi: 10.1101/2020.02.07.20021071
20. Faranda D, Alberti T. Modeling the second wave of COVID-19 infections in France and Italy via a stochastic SEIR model. Chaos Woodbury N. (2020) 30:111101. doi: 10.1063/5.0015943
21. Arutkin M, Faranda D, Alberti T, Vallée A. Delayed epidemic peak caused by infection and recovery rate fluctuations. Chaos Woodbury N. (2021) 31:101107. doi: 10.1063/5.0067625
22. Rivas AL, van Regenmortel MHV. COVID-19 related interdisciplinary methods: Preventing errors and detecting research opportunities. Methods San Diego Calif. (2021) 195:3–14. doi: 10.1016/j.ymeth.2021.05.014
23. Shapira Y, Agmon-Levin N, Shoenfeld Y. Defining and analyzing geoepidemiology and human autoimmunity. J Autoimmun. (2010) 34:J168–77. doi: 10.1016/j.jaut.2009.11.018
24. Fasina FO, Mtui-Malamsha N, Mahiti GR, Sallu R, OleNeselle M, Rubegwa B, et al. Where and when to vaccinate? Interdisciplinary design and evaluation of the 2018 Tanzanian anti-rabies campaign. Int J Infect Dis IJID Off Publ Int Soc Infect Dis. (2020) 95:352–60. doi: 10.1016/j.ijid.2020.03.037
25. Masiira B, Makumbi I, Matovu JKB, Ario AR, Nabukenya I, Kihembo C, Kaharuza F, et al. Long term trends and spatial distribution of animal bite injuries and deaths due to human rabies infection in Uganda, 2001-2015. PLoS ONE. (2018) 13:e0198568. doi: 10.1371/journal.pone.0198568
26. Rivas AL, Febles JL, Smith SD, Hoogesteijn AL, Tegos GP, Fasina FO, et al. Early network properties of the COVID-19 pandemic - the Chinese scenario. Int J Infect Dis IJID Off Publ Int Soc Infect Dis. (2020) 96:519–23. doi: 10.1016/j.ijid.2020.05.049
27. Rivas AL, Chowell G, Schwager SJ, Fasina FO, Hoogesteijn AL, Smith SD, et al. Lessons from Nigeria: the role of roads in the geo-temporal progression of avian influenza (H5N1) virus. Epidemiol Infect. (2010) 138:192–8. doi: 10.1017/S0950268809990495
28. Rivas AL, Fasina FO, Hoogesteyn AL, Konah SN, Febles JL, Perkins DJ, et al. Connecting network properties of rapidly disseminating epizoonotics. PLoS ONE. (2012) 7:e39778. doi: 10.1371/journal.pone.0039778
29. Smith DL, Lucey B, Waller LA, Childs JE, Real LA. Predicting the spatial dynamics of rabies epidemics on heterogeneous landscapes. Proc Natl Acad Sci USA. (2002) 99:3668–72. doi: 10.1073/pnas.042400799
30. Rezaeian M, Dunn G, St Leger S, Appleby L. Geographical epidemiology, spatial analysis and geographical information systems: a multidisciplinary glossary. J Epidemiol Community Health. (2007) 61:98–102. doi: 10.1136/jech.2005.043117
31. Morgenstern H. Ecologic studies in epidemiology: concepts, principles, and methods. Annu Rev Public Health. (1995) 16:61–81. doi: 10.1146/annurev.pu.16.050195.000425
32. Merlo J, Chaix B, Ohlsson H, Beckman A, Johnell K, Hjerpe P, et al. A brief conceptual tutorial of multilevel analysis in social epidemiology: using measures of clustering in multilevel logistic regression to investigate contextual phenomena. J Epidemiol Community Health. (2006) 60:290–7. doi: 10.1136/jech.2004.029454
33. Gibbs H, Liu Y, Pearson CAB, Jarvis CI, Grundy C, Quilty BJ, et al. Changing travel patterns in China during the early stages of the COVID-19 pandemic. Nat Commun. (2020) 11:5012. doi: 10.1038/s41467-020-18783-0
34. Pini A, Stenbeck M, Galanis I, Kallberg H, Danis K, Tegnell A, et al. Socioeconomic disparities associated with 29 common infectious diseases in Sweden, 2005-14: an individually matched case-control study. Lancet Infect Dis. (2019) 19:165–76. doi: 10.1016/S1473-3099(18)30485-7
35. Brooke J, Jackson D. Older people and COVID-19: isolation, risk and ageism. J Clin Nurs. (2020) 29:2044–6. doi: 10.1111/jocn.15274
36. CDC COVID-19 Response Team. Preliminary estimates of the prevalence of selected underlying health conditions among patients with coronavirus disease 2019 - United States, February 12-March 28, 2020. MMWR Morb Mortal Wkly Rep. (2020) 69:382–386. doi: 10.15585/mmwr.mm6913e2
37. Wang L, Xu C, Wang J, Qiao J, Yan M, Zhu Q. Spatiotemporal heterogeneity and its determinants of COVID-19 transmission in typical labor export provinces of China. BMC Infect Dis. (2021) 21:242. doi: 10.1186/s12879-021-05926-x
38. CDC COVID-19 Response Team. Severe outcomes among patients with coronavirus disease 2019 (COVID-19) - United States, February 12-March 16, 2020. MMWR Morb Mortal Wkly Rep. (2020) 69:343–6. doi: 10.15585/mmwr.mm6912e2
39. Qi H, Xiao S, Shi R, Ward MP, Chen Y, Tu W, et al. COVID-19 transmission in Mainland China is associated with temperature and humidity: a time-series analysis. Sci Total Environ. (2020) 728:138778. doi: 10.1016/j.scitotenv.2020.138778
40. Wu X, Yin J, Li C, Xiang H, Lv M, Guo Z. Natural and human environment interactively drive spread pattern of COVID-19: a city-level modeling study in China. Sci Total Environ. (2021) 756:143343. doi: 10.1016/j.scitotenv.2020.143343
41. Rader B, Scarpino SV, Nande A, Hill AL, Adlam B, Reiner RC, et al. Crowding and the shape of COVID-19 epidemics. Nat Med. (2020) 26:1829–34. doi: 10.1038/s41591-020-1104-0
42. Roques L, Bonnefon O, Baudrot V, Soubeyrand S, Berestycki H. A parsimonious approach for spatial transmission and heterogeneity in the COVID-19 propagation. R Soc Open Sci. (2020) 7:201382. doi: 10.1098/rsos.201382
43. Viguerie A, Lorenzo G, Auricchio F, Baroli D, Hughes TJR, Patton A, et al. Simulating the spread of COVID-19 via a spatially-resolved susceptible-exposed-infected-recovered-deceased (SEIRD) model with heterogeneous diffusion. Appl Math Lett. (2021) 111:106617. doi: 10.1016/j.aml.2020.106617
44. Adekunle IA, Onanuga AT, Akinola OO, Ogunbanjo OW. Modelling spatial variations of coronavirus disease (COVID-19) in Africa. Sci Total Environ. (2020) 729:138998. doi: 10.1016/j.scitotenv.2020.138998
45. Xiong C, Hu S, Yang M, Luo W, Zhang L. Mobile device data reveal the dynamics in a positive relationship between human mobility and COVID-19 infections. Proc Natl Acad Sci USA. (2020) 117:27087–9. doi: 10.1073/pnas.2010836117
Keywords: COVID-19, COVID-19 pandemic, spatial heterogeneity, geo-epidemiology, COVID-19 transmission, public health
Citation: Vallée A (2022) Heterogeneity of the COVID-19 Pandemic in the United States of America: A Geo-Epidemiological Perspective. Front. Public Health 10:818989. doi: 10.3389/fpubh.2022.818989
Received: 20 November 2021; Accepted: 03 January 2022;
Published: 26 January 2022.
Edited by:
Ariel L. Rivas, University of New Mexico, United StatesReviewed by:
Folorunso Oludayo Fasina, University of Pretoria, South AfricaCopyright © 2022 Vallée. This is an open-access article distributed under the terms of the Creative Commons Attribution License (CC BY). The use, distribution or reproduction in other forums is permitted, provided the original author(s) and the copyright owner(s) are credited and that the original publication in this journal is cited, in accordance with accepted academic practice. No use, distribution or reproduction is permitted which does not comply with these terms.
*Correspondence: Alexandre Vallée, YWxleGFuZHJlLmcudmFsbGVlQGdtYWlsLmNvbQ==