 Petteri Oura1,2,3*
- 1Department of Forensic Medicine, Faculty of Medicine, University of Helsinki, Helsinki, Finland
- 2Forensic Medicine Unit, Finnish Institute for Health and Welfare, Helsinki, Finland
- 3Center for Life Course Health Research, Faculty of Medicine, University of Oulu, Oulu, Finland
Background: Deaths due to medical care appear common. Individuals with low socioeconomic position seem to be at a higher risk for sustaining a medical adverse event and premature death. This time series analysis aimed to assess educational gradients behind adverse event deaths in the US over the period 2010–2019.
Methods: Publicly available mortality and census data were retrieved from official sources. The data included age, sex, educational attainment, and underlying cause of death. Adverse event deaths were identified by ICD-10 codes Y40—Y84 and Y88. Four education categories were created in accordance with the International Standard Classification of Education 2011 coding scheme [No high school or General Educational Development (GED); High school or GED; Some college; Bachelor's degeree or higher]. To capture also highly educated individuals, the analysis was delimited to ≥30-year-olds. Age-adjusted mortality rates (AMRs) were compared between education categories by means of mortality plots and linear mixed models.
Results: A total of 25,897,334 certified deaths occurred among ≥30-year-olds during the study period. The underlying cause of death was an adverse event in a rarity of cases (0.12%, n = 31,997). Individuals with Bachelor's degeree or higher had the lowest adverse event AMRs (6.1–12.4 per million per year), followed by the Some college category (9.6–18.6), the High school or GED category (17.1–35.4), and finally the No high school or GED category (20.0–36.0). AMRs showed a gradual increase as education level decreased (p ≤ 0.001 against those with Bachelor's degeree or higher). Moreover, the temporal increase in adverse event AMRs was more pronounced among individuals with low than high education; the contrasts between categories were greatest toward the end of the study period.
Conclusion: The findings of this study suggest that the widening socioeconomic gradients in mortality extend also to fatal adverse events. Future studies should aim to analyze whether access to care, severity of the condition at presentation, quality of care, and social determinants of health may drive the gradients.
Introduction
Unintended injuries caused by medical management are commonly referred to as medical adverse events (1, 2). In this study, the term is used to capture a wide range of cases, both avoidable or unavoidable, including late complications and sequelae of injuries caused by medical management. Even though deaths due to medical care appear common (3–5), the theme has been lacking scientific attention (3, 6). Further efforts should be directed to the research and prevention of medical adverse events (7–13).
Socioeconomic gradients in illness and death are potentially avoidable and may thus be influenced to increase population health (14, 15). In particular, the quantification of socioeconomic gradients behind mortality is considered a crucial public health priority globally (16). Of the wide range of indicators available, education has been recommended as the general proxy for socioeconomic status, as it is considered a sufficiently reliable measure which remains relatively stable throughout adulthood. Importantly, it may be harmonized across countries to enable comparisons at the international level, and is considered more robust against reverse causality than other socioeconomic proxies such as income level (14, 17, 18).
Evidence has accumulated that low socioeconomic position is associated with premature mortality (19–21). Although individuals with low socioeconomic position seem to be at a higher risk for medical adverse events (22–24), previous research on socioeconomic gradients behind adverse event deaths has been scarce. Building on the official US mortality data from 2010 to 2019, this nationwide time series analysis aimed to characterize educational gradients behind medical adverse event deaths among ≥30-year-old individuals. Given the previous evidence on the association between low socioeconomic position, adverse events and premature all-cause mortality, low education level was hypothesized to be associated with higher adverse event mortality.
Materials and Methods
Dataset
The material of this study stemmed from US governmental organizations. The source population were US residents whose mortality data were retrieved from National Center for Health Statistics (Centers for Disease Control and Prevention, Department of Health and Human Services) and population data from Census Bureau (Department of Commerce) and Bureau of Labor Statistics (Department of Labor). The analysis was delimited to individuals aged ≥30 years in order to secure individuals from all education levels, including those at bachelor-level or higher.
Publicly available databases, all cleared of identifiable information, were queried in April 2022, conforming to the regulations set by the organizations. All queries were made strictly for research purposes. Ethical approvals were not sought as the analysis was fully registry-based and utilized already public datasets.
Mortality
Mortality data were obtained from the National Vital Statistics Online Data Portal, where “Mortality Multiple Cause” packages were retrieved from the years 2010–2019. The data included the decedents' age (accuracy of 1 year), sex (male/female), education (please see Section Education Level below), and underlying cause of death. Causes of death were documented in accordance with the 10th revision of the International Classification of Diseases coding system (ICD-10) (25).
Adverse event deaths, including late complications and sequelae of adverse events, were proxied by ICD-10 codes Y40—Y84 and Y88. These included the following subcategories (6):
• Complications of medical or surgical procedures without misadventure (Y83—Y84 and Y88.3)
• Medical or surgical misadventures (Y60—Y69 and Y88.1)
• Medication-related adverse events (Y40—Y59 and Y88.0)
• Device-related adverse events (Y70—Y82 and Y88.2).
In this study, complications of procedures were referred to as “procedure-related events.” Misadventures, medication-related events, and device-related events were combined as “other adverse events” as they were rare.
The annual numbers of all adverse event deaths, prodecure-related deaths, and other adverse event deaths were obtained in a piecewise manner, documenting each separately for age (10-year intervals), sex (males/females), and education categories (please see Section Education Level below).
Population
Population estimates were obtained using the Current Population Survey (CPS) Explore Data tool, where “CPS Basic Monthly” packages were retrieved for the years 2010–2019. The January population count was used as the at-risk population of the respective year. Population counts were obtained in a piecewise manner, separately for 10-year age intervals, sex (males/females), and education category (please see Section Education Level below). The 2010 population distribution was used as the reference for age-adjusted mortality rates.
Education Level
Table 1 presents the categories used to document educational attainment in the original mortality and census data. In mortality datasets, education was reported according to either the 1989 or 2003 revision of the death certificate; a key for combining the two versions has been proposed previously (26).
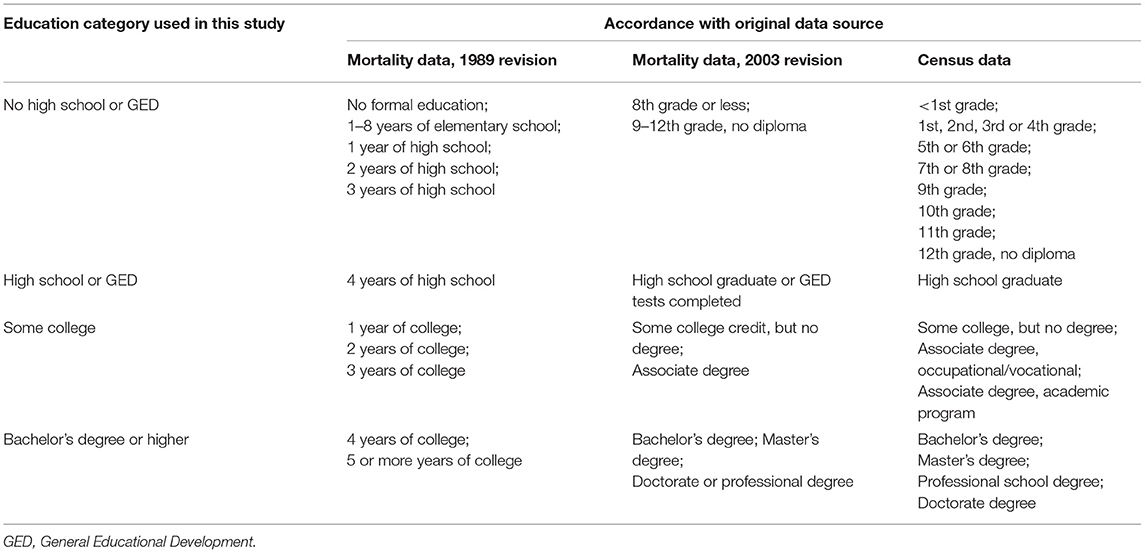
Table 1. Definitions of education categories and accordance with original data sources.
Conforming to the International Standard Classification of Education (ISCED) 2011 scheme (27), education data were converted to four mutually exclusive categories, as shown in Table 1.
Statistical Analysis
The general characteristics of the decedents were presented using percentages and frequencies for categorical variables, and medians and interquartile ranges (IQRs) for continuous variables.
Crude mortality rates (per million per year) were calculated as follows: number of deaths over a year/population count at the start of the year x 1,000,000. Crude mortality rates were calculcated in a piecewise manner for each age, sex, and education category. Then, age-adjusted mortality rates (AMRs) were calculated using the 2010 population distribution as the reference. Educational gradients in adverse event AMRs were illustrated by mortality plots.
Educational gradients were further quantified by constructing two-level linear mixed models with adverse event AMR as the outcome, and education category, year, and education*year interaction as predictors. Annual data were considered to be nested within education categories. Year was mean-centered to allow interpretation relative to a 1-year change over time. Sex*education and sex*education*year interactions were also explored but these were not statistically significant; as such, sex stratification was not deemed necessary. A complete-case approach was justified as only ≤ 4.4% of the decedents had missing data on education history. Beta coefficients, 95% confidence intervals (CI) and P-values were documented. Betas were interpreted as follows: Intercept indicates AMR in the reference education category (i.e., Bachelor's or higher) at the middle of the study period. Year indicates change in AMR relative to a 1-year change over time. Education indicates average difference in AMR between the reference category (i.e., Bachelor's or higher) and the remaining categories. Education*year indicates average difference in AMR relative to a 1-year change over time between the reference category (i.e., Bachelor's or higher) and the remaining categories.
Stata/MP version 17 (StataCorp, College Station, TX) and IBM SPSS Statistics version 27 (IBM, Armonk, NY) were used to perform the statistical analyses. Microsoft Excel version 2005 (Redmond, WA) was used to generate mortality plots. The threshold for statistical significance was set at P = 0.05.
Results
A total of 25,897,334 certified deaths occurred among ≥30-year-olds during the study period. The underlying cause of death was an adverse event in a rarity of cases (0.12%, n = 31,997); procedure-related events accounted for the majority of adverse events. General characteristics of decedents in terms of age, sex, and education are presented in Table 2.
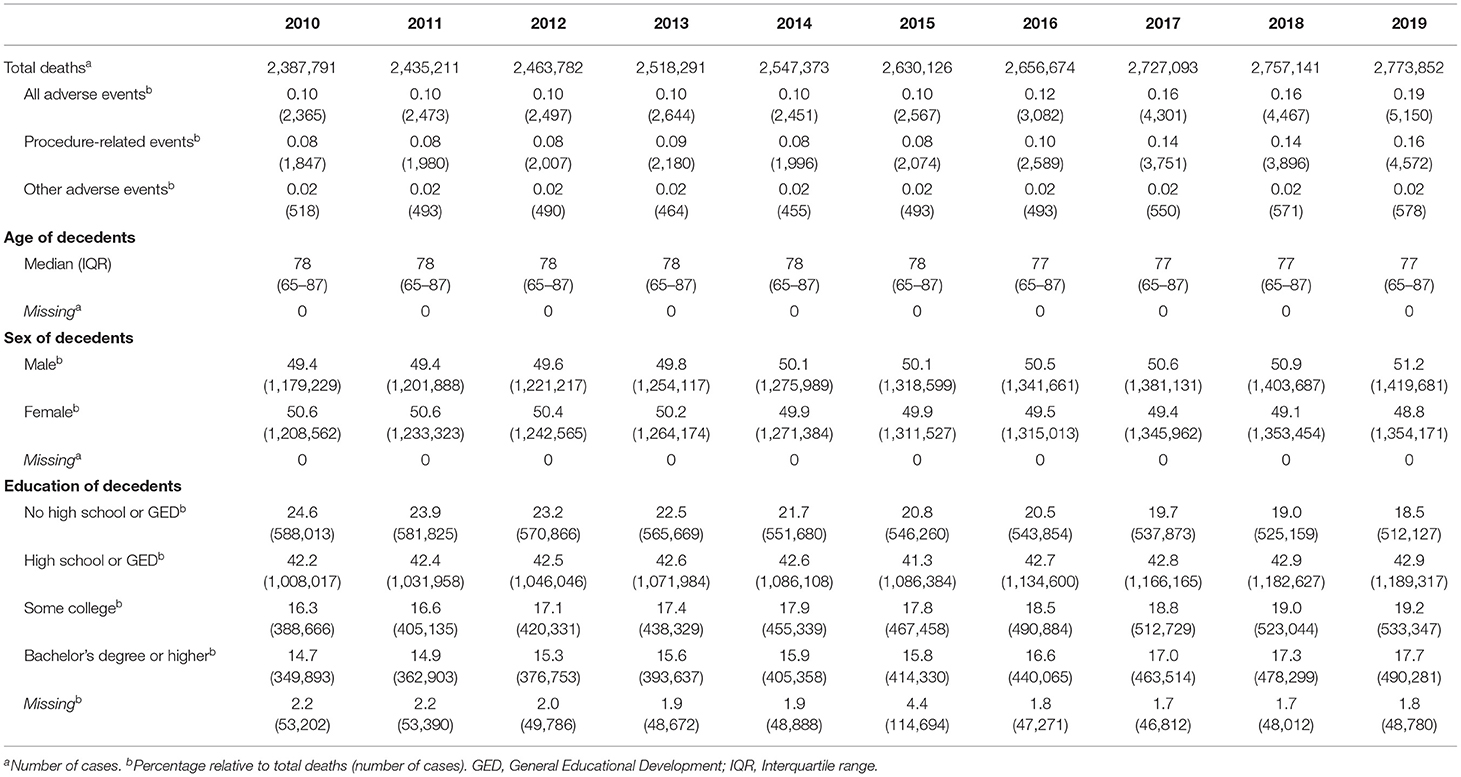
Table 2. General characteristics of the decedents. The dataset comprised ≥30-year-old decedents.
Figure 1 illustrates adverse event AMRs in education categories across the study period. In general, individuals with Bachelor's degeree or higher had the lowest AMR (6.1–12.4 per million per year for all adverse events), followed by the Some college category (9.6–18.6), the High school or GED category (17.1–35.4), and finally the No high school or GED category (20.0–36.0). Procedure-related events mainly drove the trend, whereas other adverse events were rare. The AMRs showed an increasing trend over time, particularly in the No high school or GED and High school or GED categories.
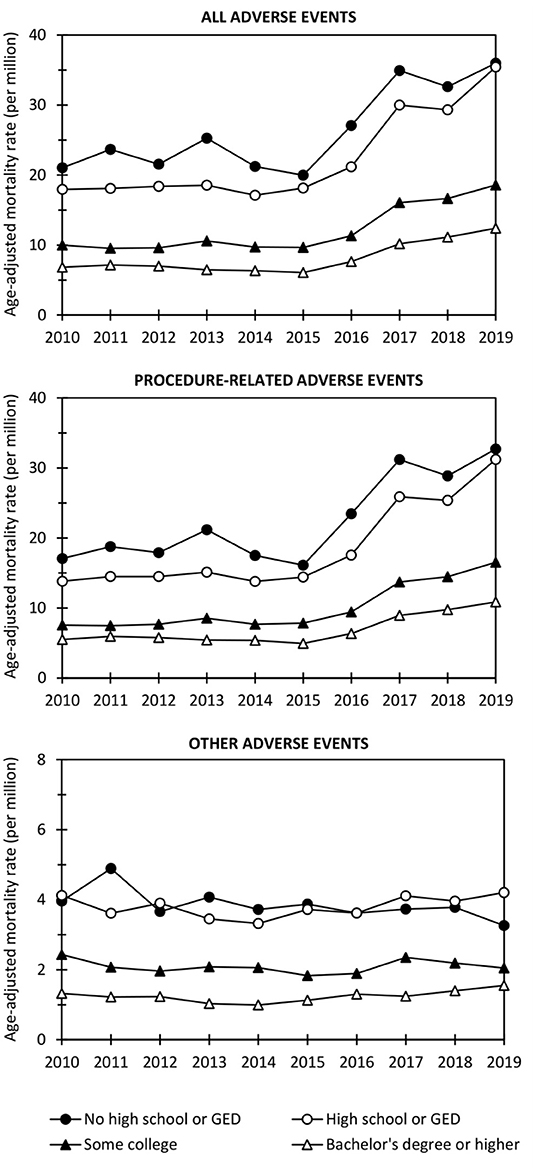
Figure 1. Age-adjusted mortality rates for all adverse events, procedure-related events, and other adverse events in education categories over the period 2010–2019. GED, General Educational Development.
Table 3 presents linear mixed models quantifying the associations of year, education, and education*year interaction with adverse event AMRs. Interpreting the year variable, AMRs for all adverse events and procedure-related events generally increased over the study period (p ≤ 0.042). Based on the education*year interaction, this temporal increase was pronounced among individuals in the No high school or GED and High school or GED categories (p ≤ 0.011). Most importantly, however, the models showed strong educational gradients in adverse event mortality; AMRs for all adverse events, procedure-related events, and other adverse events gradually increased as education level decreased. For example, against individuals with Bachelor's degree or higher, the remaining education categories had 4–18 units higher AMRs for all adverse events (p ≤ 0.001).
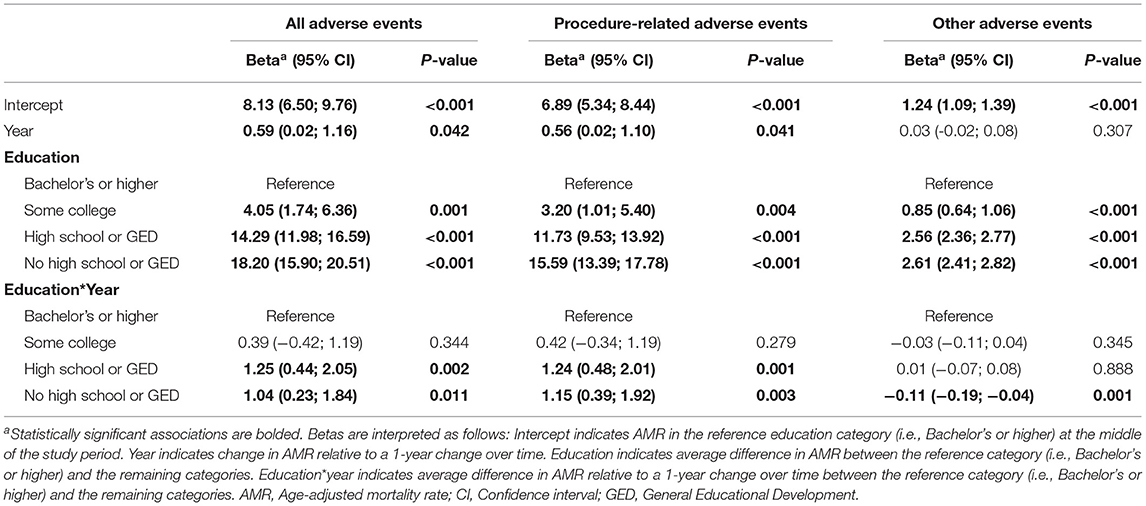
Table 3. Two-level linear mixed models with adverse event AMR (per million per year) as outcome, and education, year and education*year interaction as predictors.
Discussion
This time series analysis of 25,897,334 certified deaths among ≥30-year-old US residents aimed to assess educational gradients behind medical adverse event deaths over the period 2010–2019. In accordance with the a priori hypothesis, lower education was indeed associated with higher adverse event mortality; mortality gradients gradually increased as education level decreased. Moreover, the temporal increase in adverse event mortality was more pronounced among individuals with low than high education.
The quantification of socioeconomic gradients in mortality is a crucial public health priority (16, 28). Previous literature has documented the relationship between lower socioeconomic position and higher mortality using a variety of indicators including education (14, 19–21). Furthermore, previous evidence has suggested a higher risk of adverse events among patients with low socioeconomic status (22–24). The present findings are well in harmony with these data, clearly demonstrating that socioeconomic gradients in mortality extend to fatal adverse events. Interestingly, mortality gradients showed a gradual increase across the four education categories, suggesting a relatively linear relationship between educational attainment up to age 30 years and adverse event mortality.
The present findings support the existence of universal, cross-cutting gradients in adverse event mortality. Speculative explanations can be offered. As previously proposed in the context of surgical procedures (29), the socioeconomic gradients in health outcomes are likely driven by disparities in access to care, severity of the condition at presentation, quality of the medical care itself, and social determinants of health. Since the selection of health care providers and procedures that are available to individuals differ markedly by socioeconomic position, the association with adverse event mortality may be mediated by the number and type of healthcare contacts. As a speculative example, individuals with higher socioeconomic status have easier access to care and may also have higher rates of non-essential procedures such as cosmetic surgery, thus being susceptible to adverse events. On the other hand, patients of disadvantaged origin generally access care at lower quality providers (30) and appear to have higher rates of operative mortality in a variety of procedures (31). As such, future studies are invited to reassess the direction and strength of the gradients after accounting for healthcare contacts.
An alarming finding were the widening disparities between education categories over the study period. In particular, the increase in adverse event mortality was more pronounced among individuals at high-school level or lower, when compared to those at college-level or higher. The contrasts between education categories were greatest toward the end of the study period, implying that the issue is current and requires further exploration. While the present dataset is inconclusive in terms of identifying underlying factors, it can be speculated that the widening mortality gradients are probably attributed to growing disparities in the domains already introduced above, i.e., access to care, severity of the condition at presentation, quality of care, and social determinants of health (29). For example, it has been suggested that access to care may have become more important for the early detection and complication-free treatment of conditions, or that management of conditions may have become more complex and advanced in ways that favor individuals with high socioeconomic status (32). In the big picture, the widening socioeconomic gradients have also concerned all-cause mortality in the US (33); the present data show that adverse event deaths clearly contribute to this disparity. In contrast to the US, however, socioeconomic disparities in all-cause mortality have remained stable or followed a narrowing trend in Canada and Europe. European and Canadian trends in adverse events deaths remain to be studied, and if similar differences between countries are to be confirmed, transnational comparisons may help identify the underlying factors.
The present analysis demonstrated widening educational gradients behind fatal medical adverse events among US residents over the course of a decade, which has not been addressed in previous studies. However, as macro-level data are not sufficient for guiding preventive and counteractive measures, future studies are warranted. Primarily, studies should aim to analyze whether healthcare contacts (e.g., access to care, number and type of healthcare contacts, and quality of healthcare professionals and clinics) have a role in the equation. As suggested by the theory of proportionate universalism, counteractive actions need to be universal but in reasonable proportion to the level of disparity (34, 35). Although contrasts between the two education extremities were highest, it will not suffice to focus on the most disadvantaged groups.
Official data sources, nationwide coverage, and a decade-long study period constitute the main strengths of the study. The data are publicly accessible, enabling confirmatory and subsequent analyses around the topic. Education has been recommended as the most accurate proxy of socioeconomic position and was coded according to ISCED suggestions. However, this study also had limitations. It is generally evident that medical adverse events are underrepresented in cause-of-death statistics (3, 6). The retrospective nature of the data and lack of information on other domains than basic demographic traits prevented more detailed analyses of mediating and confounding factors.
Conclusion
The quantification of socioeconomic gradients in mortality remains a crucial public health priority. This time series analysis of 25,897,334 certified deaths among ≥30-year-old US residents demonstrated widening educational gradients behind fatal medical adverse events over the period 2010–2019, which has not been addressed in previous studies. Lower education was associated with higher adverse event mortality as mortality gradients gradually increased along with decreasing education level. Moreover, the temporal increase in adverse event mortality was more pronounced among individuals with low than high education; the contrasts between categories were greatest toward the end of the study period. The present findings support the existence of universal, cross-cutting gradients in adverse event mortality. As the present macro-level data are not sufficient for guiding preventive and counteractive measures, future studies are warranted. Speculatively, access to care, severity of the condition at presentation, quality of care, and social determinants of health may drive the gradients.
Data Availability Statement
Publicly available datasets were analyzed in this study. This data can be found here: https://www.cdc.gov/nchs/data_access/vitalstatsonline.htm#Mortality_Multiple and https://data.census.gov/mdat/#/.
Ethics Statement
Ethical review and approval was not required for the study on human participants in accordance with the local legislation and institutional requirements. Written informed consent for participation was not required for this study in accordance with the national legislation and the institutional requirements.
Author Contributions
PO is the sole author of the manuscript. He worked on the conception of the project, data collection, analysis and interpretation of the data and writing the manuscript.
Conflict of Interest
The author declares that the research was conducted in the absence of any commercial or financial relationships that could be construed as a potential conflict of interest.
Publisher's Note
All claims expressed in this article are solely those of the authors and do not necessarily represent those of their affiliated organizations, or those of the publisher, the editors and the reviewers. Any product that may be evaluated in this article, or claim that may be made by its manufacturer, is not guaranteed or endorsed by the publisher.
Acknowledgments
National Center for Health Statistics (Centers for Disease Control and Prevention, Department of Health and Human Services), Census Bureau (Department of Commerce), and Bureau of Labor Statistics (Department of Labor), US are acknowledged as the data sources.
Abbreviations
AMR, age-adjusted mortality rate; CI, confidence Interval; CPS, Current Population Survey; GED, General Educational Development; ICD-10, International Classification of Diseases, 10th revision; IQR, interquartile range; ISCED, International Standard Classification of Education; P, P-value; US, United States of America.
References
1. Garrouste-Oregas M, Pilippart F, Bruel C, Max A, Lau N, Misset B. Overview of medical errors and adverse events. Ann Intensive Care. (2012) 2:1–9. doi: 10.1186/2110-5820-2-2
3. Makary MA, Daniel M. Medical error-the third leading cause of death in the US. BMJ. (2016) 353:i2139. doi: 10.1136/bmj.i2139
4. Panagioti M, Khan K, Keers R, Abuzour A, Phipps D, Kontopantelis E, et al. Prevalence, severity, and nature of preventable patient harm across medical care settings: systematic review and meta-analysis. BMJ. (2019) 366:I4185. doi: 10.1136/bmj.l4185
5. Haukland E, Mevik K, von Plessen C, Nieder C, Vonen B. Contribution of adverse events to death of hospitalised patients. BMJ Open Quality. (2019) 8:e000377. doi: 10.1136/bmjoq-2018-000377
6. Oura P. Medical adverse events in the US 2018 mortality data. Prev Med Rep. (2021) 24:101574. doi: 10.1016/j.pmedr.2021.101574
7. Kohn L, Corrigan J, Donaldson M. To Err Is Human: Building a safer health system. Washington, DC: National Academy Press, Institute of Medicine (1999).
8. Landrigan CP, Parry GJ, Bones CB, Hackbarth AD, Goldmann DA, Sharek PJ. Temporal trends in rates of patient harm resulting from medical care. New Engl J Med. (2010) 363:2124–34. doi: 10.1056/NEJMsa1004404
9. Classen DC, Resar R, Griffin F, Federico F, Frankel T, Kimmel N, et al. “Global trigger tool” shows that adverse events in hospitals may be ten times greater than previously measured. Health Aff. (2011) 30:581–9. doi: 10.1377/hlthaff.2011.0190
11. Schwendimann R, Blatter C, Dhaini S, Simon M, Ausserhofer D. The occurrence, types, consequences and preventability of in-hospital adverse events - a scoping review. BMC Health Serv Res. (2018) 18:521. doi: 10.1186/s12913-018-3335-z
12. Rafter N, Hickey A, Condell S, Conroy R, O'Connor D, Vaughan D, et al. Adverse events in healthcare: learning from mistakes. QJM. (2014) 108:273–277. doi: 10.1093/qjmed/hcu145
13. Wu A, Shapiro J, Harrison R, Scott S, Connors C, Kenney L, et al. The impact of adverse events on clinicians: what's in a name? J Patient Saf. (2020) 16:65–72. doi: 10.1097/PTS.0000000000000256
14. Korda R, Biddle N, Lynch J, Eynstone-Hinkins J, Soga K, Banks E, et al. Education inequalities in adult all-cause mortality: first national data for Australia using linked census and mortality data. Int J Epidemiol. (2020) 49:511–8. doi: 10.1093/ije/dyz191
15. WHO Commission on Social Determinants of Health. Closing the Gap in a Generation: Health Equity Through Action on the Social Determinants of Health. Available online at: https://www.who.int/social_determinants/thecommission/finalreport/en (accessed April 25, 2022).
16. Mackenbach J, Meerding W, Kunst A. Economic costs of health inequalities in the European Union. J Epidemiol Community Health. (2011) 65:412–9. doi: 10.1136/jech.2010.112680
17. Mackenbach J, Menvielle G, Jasilionis D, Gelder R. Measuring Educational Inequalities in Mortality Statistics. OECD Statistics Working Papers, no. 2015/08. Paris: OECD Publishing (2015).
18. Duncan G, Daly M, McDonough P, Williams D. Optimal indicators of socioeconomic status for health research. Am J Public Health. (2002) 92:1151–7. doi: 10.2105/AJPH.92.7.1151
19. Steenland K, Hu S, Walker J. All-cause and cause-specific mortality by socioeconomic status among employed persons in 27 US States, 1984–1997. Am J Public Health. (2004) 94:1037–42. doi: 10.2105/AJPH.94.6.1037
20. Miech R, Pampel F, Kim J, Rogers R. The enduring association between education and mortality: the role of widening and narrowing disparities. Am Sociol Rev. (2011) 76:913–34. doi: 10.1177/0003122411411276
21. Lewer D, Jayatunga W, Aldridge R, Edge C, Marmot M, Alistair S, et al. Premature mortality attributable to socioeconomic inequality in England between 2003 and 2018: an observational study. Lancet Public Health. (2020) 5:e33–41. doi: 10.1016/S2468-2667(19)30219-1
22. Burstin HR, Lipsitz SR, Brennan TA. Socioeconomic status and risk for substandard medical care. JAMA. (1992) 268:2383–7. doi: 10.1001/jama.1992.03490170055025
23. Stockwell DC, Landrigan CP, Toomey SL, Westfall MY, Liu S, Parry G, et al. Racial, ethnic, and socioeconomic disparities in patient safety events for hospitalized children. Hosp Pediatr. (2019) 9:1–5. doi: 10.1542/hpeds.2018-0131
24. Shen JJ, Cochran CR, Mazurenko O, Moseley CB, Shan G, Mukalian R, et al. Racial and insurance status disparities in patient safety indicators among hospitalized patients. Ethn Dis. (2016) 26:443–52. doi: 10.18865/ed.26.3.443
25. World Health Organization. International Statistical Classification of Diseases and Related Health Problems 10th Revision (ICD-10). Available online at: https://icd.who.int/browse10/2019/en (accessed April 25, 2022).
26. Rostron B, Boies J, Arias E. Education reporting and classification on death certificates in the United States. Vital Health Stat. (2010) 2:1–21.
27. UNESCO. International Standard Classification of Education (ISCED) 2011. Montreal: UNESCO Institute for Statistics (2012).
28. Marmot M. Social determinants of health inequalities. Lancet. (2005) 365:1099–104. doi: 10.1016/S0140-6736(05)71146-6
29. de Jager E, Gunnarsson R, Ho Y-H. Disparities in surgical outcomes for low socioeconomic status patients in Australia. ANZ J Surg. (2022) 92:1026–32. doi: 10.1111/ans.17675
30. de Jager E, Levine AA, Udyavar NR, Burstin HR, Bhulani N, Hoyt DB, et al. Disparities in surgical access: a systematic literature review, conceptual model, and evidence map. J Am Coll Surg. (2019) 228:276–98. doi: 10.1016/j.jamcollsurg.2018.12.028
31. Birkmeyer NJO, Gu N, Baser O, Morris AM, Birkmeyer JD. Socioeconomic status and surgical mortality in the elderly. Med Care. (2008) 46:893–9. doi: 10.1097/MLR.0b013e31817925b0
32. Cutler DM, Lange F, Meara E, Richards-Shubik S, Ruhm CJ. Rising educational gradients in mortality: the role of behavioral risk factors. J Health Econ. (2011) 30:1174. doi: 10.1016/j.jhealeco.2011.06.009
33. Bosworth B. Increasing disparities in mortality by socioeconomic status. Annu Rev Public Health. (2018) 39:237–51. doi: 10.1146/annurev-publhealth-040617-014615
34. Marmot M, Allen J, Goldblatt P, Boyce T, McNeish D, Grady M, et al. Fair Society, Healthy Lives (The Marmot Review). London: Institute of Health Equity (2010).
Keywords: education, socioeconomic status, adverse event, mortality, US
Citation: Oura P (2022) Educational Gradients Behind Medical Adverse Event Deaths in the US—A Time Series Analysis of Nationwide Mortality Data 2010–2019. Front. Public Health 10:797379. doi: 10.3389/fpubh.2022.797379
Received: 18 October 2021; Accepted: 23 May 2022;
Published: 15 June 2022.
Edited by:
Angelo d'Errico, Azienda Sanitaria Locale TO3, ItalyReviewed by:
M. Rashad Massoud, University Research Co, United StatesTeresa Spadea, Local Health Authority Torino 3, Italy
Copyright © 2022 Oura. This is an open-access article distributed under the terms of the Creative Commons Attribution License (CC BY). The use, distribution or reproduction in other forums is permitted, provided the original author(s) and the copyright owner(s) are credited and that the original publication in this journal is cited, in accordance with accepted academic practice. No use, distribution or reproduction is permitted which does not comply with these terms.
*Correspondence: Petteri Oura, cGV0dGVyaS5vdXJhQGhlbHNpbmtpLmZp