 Francesco Durazzi
 François Pichard
 Daniel Remondini
 Marcel Salathé
94% of researchers rate our articles as excellent or good
Learn more about the work of our research integrity team to safeguard the quality of each article we publish.
Find out more
ORIGINAL RESEARCH article
Front. Public Health , 23 February 2023
Sec. Digital Public Health
Volume 10 - 2022 | https://doi.org/10.3389/fpubh.2022.1069931
Introduction: Online social media have been both a field of research and a source of data for research since the beginning of the COVID-19 pandemic. In this study, we aimed to determine how and whether the content of tweets by Twitter users reporting SARS-CoV-2 infections changed over time.
Methods: We built a regular expression to detect users reporting being infected, and we applied several Natural Language Processing methods to assess the emotions, topics, and self-reports of symptoms present in the timelines of the users.
Results: Twelve thousand one hundred and twenty-one twitter users matched the regular expression and were considered in the study. We found that the proportions of health-related, symptom-containing, and emotionally non-neutral tweets increased after users had reported their SARS-CoV-2 infection on Twitter. Our results also show that the number of weeks accounting for the increased proportion of symptoms was consistent with the duration of the symptoms in clinically confirmed COVID-19 cases. Furthermore, we observed a high temporal correlation between self-reports of SARS-CoV-2 infection and officially reported cases of the disease in the largest English-speaking countries.
Discussion: This study confirms that automated methods can be used to find digital users publicly sharing information about their health status on social media, and that the associated data analysis may supplement clinical assessments made in the early phases of the spread of emerging diseases. Such automated methods may prove particularly useful for newly emerging health conditions that are not rapidly captured in the traditional health systems, such as the long term sequalae of SARS-CoV-2 infections.
Public health monitoring is in the midst of a technological shift enabled by the availability and pervasiveness of real-time and geo-localized data. Mining, harmonizing, and extracting information from heterogeneous big data sources is offering unprecedented opportunities in disease early warning and surveillance (1). Compared with information extracted from traditional public health channels, digital resources can reduce the timeframe of outbreak detection and improve our understanding of risk factors at the level of entire populations (2).
In particular, communicable diseases are currently drawing the most attention in studies of digital public health surveillance (3). In the context of the ongoing COVID-19 pandemic, multiple attempts have been made by scientists and public health institutions to address the challenge raised by the disease spread through new technologies (4). On the one hand, efforts have been made to provide practical solutions to the containment of infections through digital contact tracing (5) and innovative diagnostic and case management practices (6). On the other hand, digital traces can be processed to now-cast the number of infections and monitor the evolution of patients' symptoms or public reaction to the pandemic over time (4). Online social media are certainly one of the most fruitful sources of data, and even more so since the beginning of the pandemic that led to an increased use of these web platforms (14% more users on Twitter from January 2020 to April 2020) (7, 8). The real-time analysis of social media was developed across several themes, including surveillance of public attitudes, characterization of infodemics, assessing mental health, detecting or forecasting COVID-19 cases, and identifying the government interventions (9).
The heterogeneous nature of the available online data suggests that social and psychological phenomena beyond the strictly sanitary context can be observed and studied. Research has largely focused on large-scale social considerations, which revealed the increasing polarization of the COVID-19 debate (10) and the prevalence of negative emotions in messages posted on Twitter, particularly at the beginning of the outbreak (7, 11). Additionally, it was shown that the high number of tweets with negative sentiment was partly due to the high rate of (i) angry tweets in response to news from authorities and politics, and (ii) sad tweets in response to news about confirmed cases and deaths (12). Although such studies allow estimating the prevalence of mental health issues associated with the pandemic status of COVID-19 at the population level (7), there has been—to the best of our knowledge—no social media investigation of behavioral changes in individuals infected with SARS-CoV-2.
From a medical point of view, it has been highlighted that the number of self-reports of symptoms displayed a temporal correlation with the number of confirmed cases (13, 14). The frequency of symptoms reported on Twitter was shown to be in good agreement with the prevalence of symptoms following confirmed infections (15) and allowed to identify patterns revealing the long-term criticality of the post-acute sequelae of COVID-19 (16). However, in order to carry out these studies, time-consuming practices of manual annotation and curation had to be employed, which limited the amount of usable data.
Given the aforementioned gaps, we tried to leverage the full potential of social media data by using automated methods for the filtering of very large volumes of tweets as well as the characterization of a broad set of topics. We were thus able to investigate the content changes on Twitter for users who publicly shared that they had tested positive for COVID-19. Our hypothesis at the early stage of this work was that several features of the content posted by Twitter users had potentially changed after they reported their SARS-CoV-2 infection. These changes may concern not only health statuses, but also emotions, topics, external references (i.e., websites). Using various Natural Language Processing (NLP) techniques, we extracted heterogeneous information from the tweets, and characterized the users' timelines by designing a pre-post study to observe content changes after the infection self-reports (test-positive tweets from now on). We thus verified the time correlation between test-positive tweets and confirmed cases in the major English-speaking countries and performed statistical tests to assess differences between the pre-period and the post-period with respect to the test-positive date.
Using the Crowdbreaks platform (17), we collected a stream of COVID-related tweets through the filtered streaming endpoint of the Twitter API. This dataset of around 323M original tweets consists of all the English-language tweets (i) posted from 13/01/2020 to 19/09/2021 and (ii) mentioning COVID-19 related keywords (“wuhan,” “ncov,” “coronavirus,” “COVID,” “SARS-CoV-2”). Tweets that were selected were those satisfying the condition imposed by the following regular expression:
r'/b (?<!/“)(?:I|We) (?: have |/'ve |ve | just |) tested positive for (?:covid|corona|sars-cov-2)|/b (?<!/”) (?:my|our) (?:covid|corona|sars-cov-2) test is positive|/b (?<!/“) (?:found out|turns out|confirms|confirm) I (?:ve|/'ve| have| got| contracted) (?:covid|corona|sars-cov-2)'.
This regular expression was built via multiple steps of refinement, as we read random samples of matched tweets and modified the filter to avoid false positives. Our primary aim was not to retrieve all users reporting their infection on Twitter; rather, we were concerned with collecting a sample large enough to run sound statistical analyses (hence our willingness to accept a lower sensitivity when prioritizing a high specificity). Still, because of the rigidity of regular expressions, we may have missed a non-negligible portion of users reporting the positivity of their test to COVID-19. For each one of the users having at least one match with the regular expression, we downloaded the full publicly available Twitter timeline from 1/1/2020 to 30/09/2021 calling the Twitter API v2.0 (18) for Academic research through the Python's package Twarc (19). Due to Twitter limitations, we could only retrieve the last 3,000 tweets written by each user up to 30/09/2021 (day of the API call). Ethical approval for the use of the data was obtained from the EPFL Human Research Ethics Committee (054-2022).
The common point between all users included in the dataset is that they reported testing positive to COVID-19 on Twitter. For each user, a pre-period (12 weeks) and a post-period (12 weeks) were defined with respect to the time of the so-called primary test-positive tweets, which marks the end of the pre-period and the start of the post-period. The tweets written by each user during this observation period were the main focus of our study and were used in all of the analyses. Some users reported testing positive to COVID-19 more than once, leading to a set of 268 secondary test-positive tweets. As our goal was to characterize changes in the users' Twitter timelines after their earliest SARS-CoV-2 infection online report, our analysis of self-reports of COVID-19 cases was based on the former set (primary test-positive tweets) only. Twitter accounts were further filtered according to the time of the primary test-positive tweets (25/03/2020 - 08/07/2021) and the number of tweets present in the pre- and the post-periods (at least 30 tweets per period posted over 5 weeks or more). This way, we were able to build a digital cohort of 12,121 users, who wrote a total of 5,932,306 tweets during the time of analysis. All subsequent analyses refer to this set of Twitter users.
Symptom mentions in tweets were extracted with MedCAT, which is a state-of-the-art Named Entity Recognition (NER) tool built to recognize and normalize clinical concepts in electronic health records (20). NER is an information extraction task carried out by a (statistical) model such that pre-defined categories are assigned as tags to the entities identified during the parsing of an unstructured text. MedCAT enabled to associate each tweet with a particular set of tags (no symptom, one symptom, or multiple symptoms encountered). However, after reading some of MedCAT's output, we realized that this model was limited due to its inability to recognize figurative uses of symptoms (e.g., “This situation hurts me,” “I am sick of this situation”), and we decided not to consider some symptom tags (“Pain,” “Sickness,” “Tired” and “Ache”) for the remainder of our analysis.
Since MedCAT was used beyond its original scope (processing of electronic health records) and applied to tweets, we compared the respective performances of MedCAT and a lexicon-based method developed for Twitter data (15). The authors of the latter study (Sarker et al.) were interested in extracting self-reports of COVID-19 symptoms from tweets and had manually reviewed the results of their model so as to obtain high levels of recall (15). By comparing the two methods we realized that MedCAT outperformed the lexicon-based approach over a set of manually annotated symptom-containing tweets, in particular considering the specificity (0.41 for MedCAT vs. 0.26 for the lexicon; cf. Supplementary material for details). Furthermore, “fatigue” and “tiredness” are disambiguated with MedCAT, which is not the case with the lexicon-based approach. As explained above, tags of tiredness were prone to being false positives, but this very problem did not occur with “fatigue.” Therefore, MedCAT enabled us to conduct analyses on self-reports of fatigue.
While hundreds of different symptom types may be recognized in our dataset, we decided to limit our analysis to a subset of symptoms pertaining to COVID-19 and Long COVID (i.e., post-acute sequelae of SARS-CoV-2 infection): fatigue, malaise, dyspnea, chest pain, fever, coughing, headache, sore throat, nausea, vomiting, dizziness, myalgia (16, 21, 22).
In order to tell apart actual self-reports of symptoms from generic chatter about symptoms, we used a fine-tuned deep learning model that aims to classify tweets with symptom mentions as either self-reports, non-personal reports, or news mentions (model with 3 classes) (23). Tweets with symptom mentions were retained for the following analysis if and only if their probability for being a self-report was larger than 0.9.
A NER model was applied to determine which emotions were expressed by individual users as they posted content on Twitter. The model used (SpanEmo) (24) was a multilabel classifier with 11 possible labels including the eight primary (25) emotions (joy, trust, fear, surprise, sadness, disgust, anger, anticipation) and three dyadic emotions (optimism, pessimism, love). If none of these 11 labels was predicted the tweet was considered as neutral.
Topics present in the tweets were identified using the distilled version of the BART-Large-MNLI model (26). Nine custom topic categories were defined for this zero-shot learning classifier, namely: Business & Industry, Computers & Internet & Electronics, Education & Reference, Entertainment & Music, Health, Politics & Government & Law, Science & Mathematics, Society & Culture, Sport. The model returns the probability for a tweet to be associated with a particular topic. In order to use the aforementioned topics as categorical features, the indicator function was applied to the output probabilities (a particular topic is present in a tweet only if the estimated probability for that topic is above 0.5). If the indicator function was equal to 0 for all nine classes, the tweet was considered as an instance of a 10th category called “Other.”
The following analysis was conducted for each user separately. First, user-specific tweets were split into two sets depending on their temporal position relative to the user's test-positive tweet (pre-intervention period or post-intervention period) and the timelines of all the users were aligned so that all the test-positive tweets happen to be on day 0. Then, numerical information was derived for every user by computing the weekly counts of tweets posted by individual accounts. Based on these user-specific time series, we were able to treat each user in the dataset separately and we tested whether the infection event (reflected by a given user's test-positive tweet) had a causal impact on the volume of tweets that were subsequently posted. To do so, we used the CausalImpact module of the Python package tfcausalimpact (27) (see Supplementary Figure 1). The statistical effect of the intervention (self-report of a given user's test-positive status) is inferred from the Bayesian one-sided tail-area probability of obtaining this effect by chance. The outcome of the model was one of the three following options depending on the effect and the magnitude of the p-value (statistical significance set at the 0.05 level): (i) the intervention (self-report of a given user's test-positive status) did not trigger a change in the user's posting volume; (ii) the intervention led to an increased activity; (iii) the intervention led to a decreased activity.
Using the same individual time series as for the previous analysis, we determined the average weekly number of tweets posted in the pre-period and the corresponding value in the post-period, obtaining a pair of pre-post counts for each user (12,121 pairs). Considering these individual data altogether, we applied a two-sided Wilcoxon signed-rank test in order to determine whether the rates in the pre-period and the post-period series were statistically different from each other. The results were computed with the R library stats (28). Pre-/post-comparisons of this type (i.e., Wilcoxon signed-rank test) were also conducted to statistically analyze the proportions of tweets associated with a particular class across all selected users. The possible classes correspond to the set of labels retrieved from the different models applied in this study (emotion/topic/URL/symptom classifiers). Wilcoxon signed-rank tests were applied with the false discovery rate controlled at the 0.05 level following the Benjamini-Hochberg post-hoc procedure.
Since the users may have reported symptoms with an increased prevalence in the post-period relative to the pre-period, we tried to estimate the duration of this behavioral change, hereafter referred to as symptom-reporting duration. To do so, we repeated pre-/post-comparisons for every symptom on modified timelines where weekly data from the post-period were iteratively removed until the increase of symptoms tweets was not significant. The procedure works as follows:
1. After removing tweets from week 0, we test whether the pre-/post-increase of symptom prevalence remains statistically significant for this modified dataset.
2. If the increase is not significant, that means that the symptom-reporting duration is shorter than 1 week and we consider the SRMD (i.e., symptom-reporting maximum duration) to be 1 week.
3. If the increase is significant, we additionally remove data from the next week and repeat the pre-/post-comparison.
This procedure can be applied iteratively to further weeks until the statistical test indicates no more significant changes between the pre-period and the modified post-period. Thus, each symptom can be associated with a specific SRMD that indicates the maximum number of weeks in the post-period accounting for the higher frequency of that particular symptom.
Figure 1 shows the distribution of the primary test-positive tweets over the observation period of the study (March 2020 to July 2021) for all 12,121 users included in our dataset.
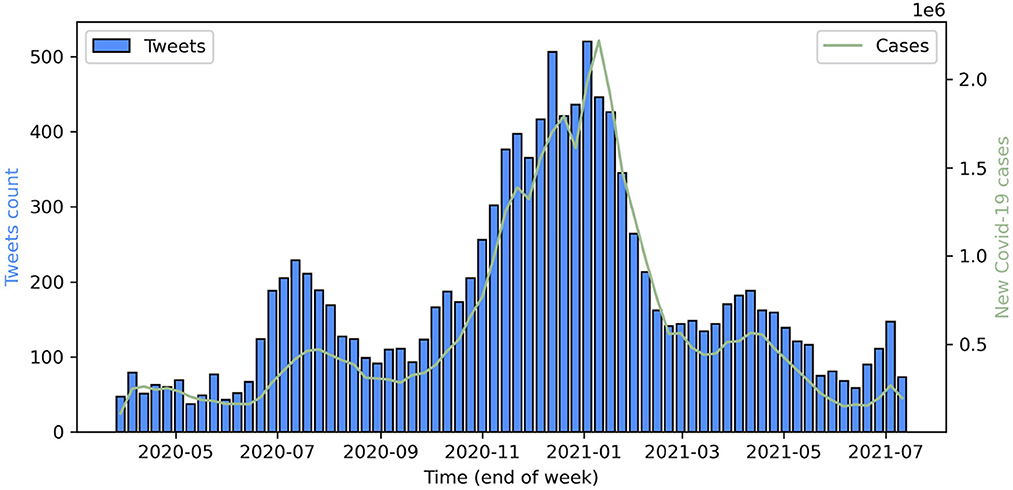
Figure 1. Blue bars: weekly counts of COVID-19 self-reports on Twitter data. Green line: cumulative confirmed new cases of COVID-19 in the USA, UK, Canada, and Australia.
A local maximum of self-reported cases was observed in July 2020, which turns out to be the time at which a second wave of COVID-19 cases was observed in the United States. The bar plot reveals another maximum in late 2020 (November and December) and in early 2021 (January). This period coincides with the third wave of infections in the United States. Comparing the volume of case self-reports with the time series of cumulative confirmed new cases in the four largest countries where English is the main language (USA, UK, Canada, and Australia), we find a high correlation (Pearson's coefficient = 0.96, p < 1E-06), which is even stronger when delaying the tweets by a week (Pearson's coefficient = 0.97). A possible explanation is that people acknowledge their infection state with self-tests before the official PCR test results.
After the emotions conveyed by the test-positive tweets were automatically identified with a state-of-the-art model (24), the possible classes (i.e., emotion labels) were ordered according to their frequency in this dataset. It turns out that there was no predominance of valence-negative emotions over valence-positive emotions (or vice-versa): for instance, the top four emotions were sadness, optimism, anticipation, and disgust (Supplementary Figure 2).
Figure 2 illustrates the relative importance of emotions in the test-positive tweets based on their monthly prevalence and shows that sadness and optimism were the most frequent emotions across the entire time range (March 2020 to July 2021). While optimism was predominant until July 2020, it was superseded by sadness between August 2020 and March 2021. This change can be noticed when comparing the proportion of test-positive tweets with optimism or sadness in the first and second peaks (July 2020 and December 2020, respectively), as confirmed by a proportion test (p-value = 0.02).
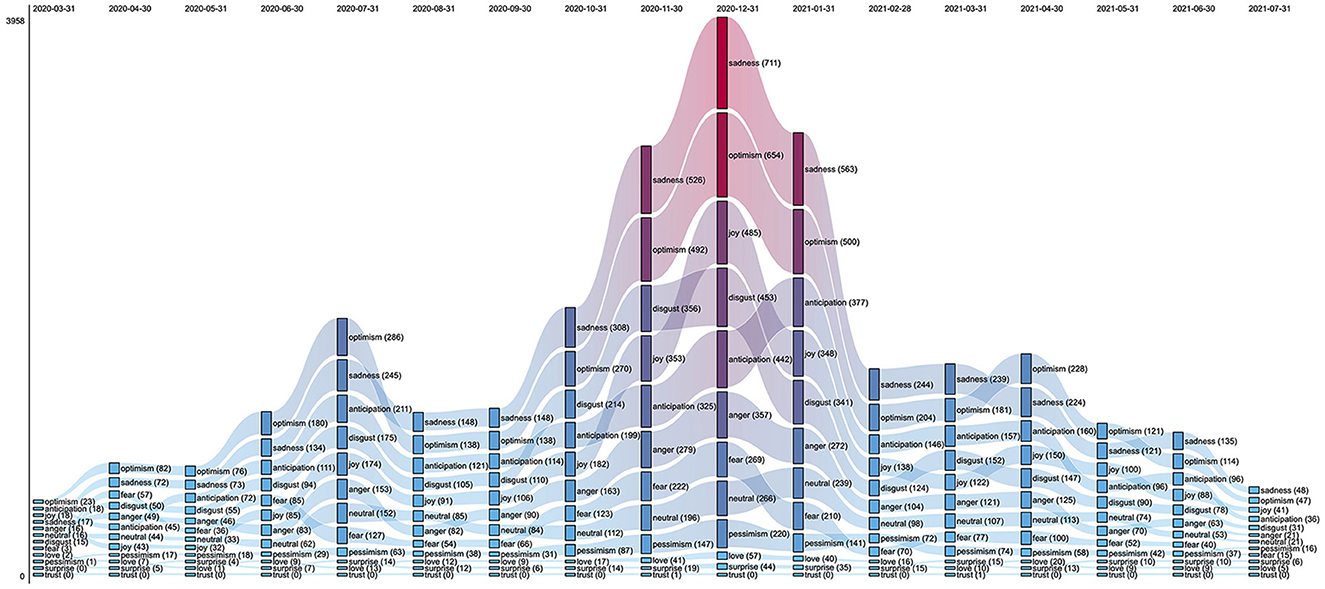
Figure 2. Ranked flow chart of the monthly counts of primary test-positive tweets, stratified by emotion. For each month, the emotions are sorted from the most abundant (Top) to the least abundant one (Bottom).
The above flow chart also shows that ranking variations were relatively rare over time. Although this holds for most classes, two changes are worth noting. The relative importance of joy gradually increased from May 2020 (8th position) until December 2020 (3rd position) and later oscillated between the third and fifth rank (January 2021 to July 2021). Ranking fluctuations were also observed with respect to fear, which was the third and fifth most abundant emotion tag in April 2020 and June 2020, respectively, but then moved gradually to lower ranks until the end of the observation period.
Each of the following subsections aims to characterize in greater detail each user's online activity before and after primary test-positive tweets were posted. As explained in the Methods section, the “pre-period” refers to the 3 months before the primary test-positive tweet of a user, while the “post-period” refers to the 3 months following the test-positive tweet.
Using a causal impact analysis framework for each user separately, we compared the weekly series of tweets counts posted during the post-period with the corresponding series in the pre-period. Table 1 indicates that the tweets count time series were statistically not different in the pre- and post-periods for 42.1% of all the 12,121 users, while there was an increase for 34.8% of all users and a decrease for the remaining 23.1%.
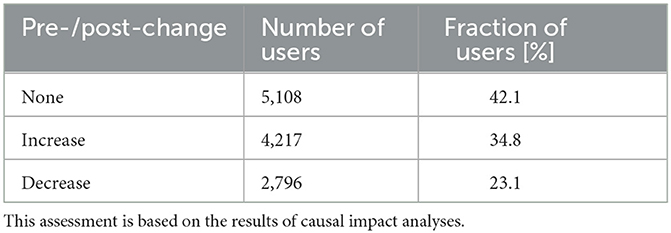
Table 1. Relative size of the categories of users grouped according to the change of their individual activity on Twitter after the respective time of their primary test-positive tweet.
A second test was applied at the collective level: the same data were analyzed by applying a Wilcoxon signed-rank test on all the pre-/post-pairs (one pair per user), whose result indicates a statistically significant global increase in the weekly rate of tweets (p-value < 1E-06) during the post-period.
Statistically significant changes between the pre-period and the post-period were observed for most emotions (see Figure 3 and Table 2).
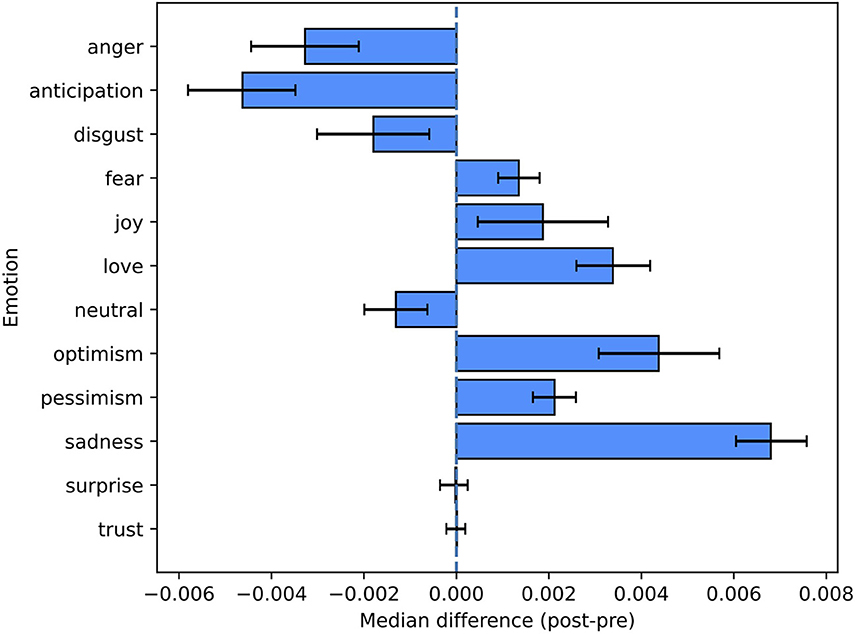
Figure 3. Pre-/post-comparison for emotion labels. This figure shows the non-parametric confidence intervals and the estimated pseudomedians of the differences between the proportions in the post-period and the ones in the pre-period.
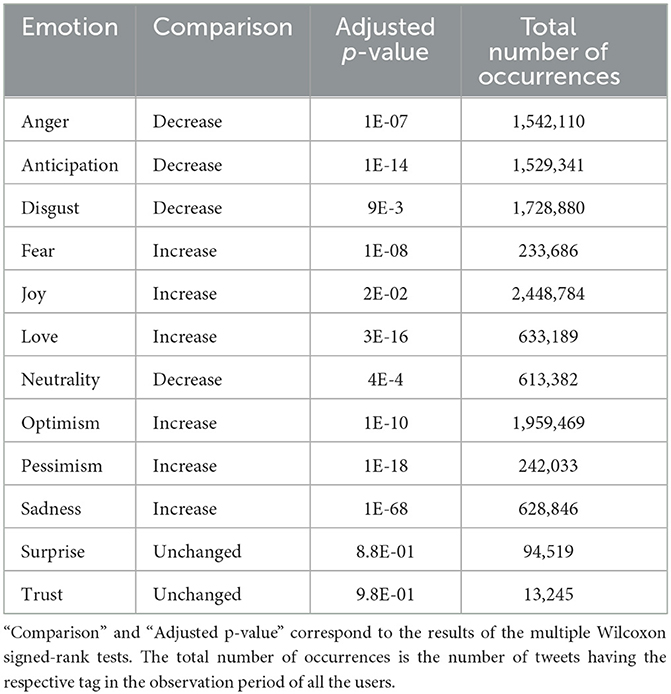
Table 2. Emotion tags and pre-/post-comparisons.
Occurrences of anger, anticipation, and disgust were less frequent in the post-period, but there were also emotions (fear, joy, love, optimism, pessimism, sadness) displaying an opposite trend. The proportion of neutral tweets statistically decreased in the post-period (p-value = 2E-04).
The above pre-/post-comparison shows that no statistically significant changes were observed for eight topic labels. The two remaining classes are the ”Other" category (less abundant after the primary test-positive tweets) and the “Health” category (more abundant in the post-period) (see Figure 4 and Table 3).
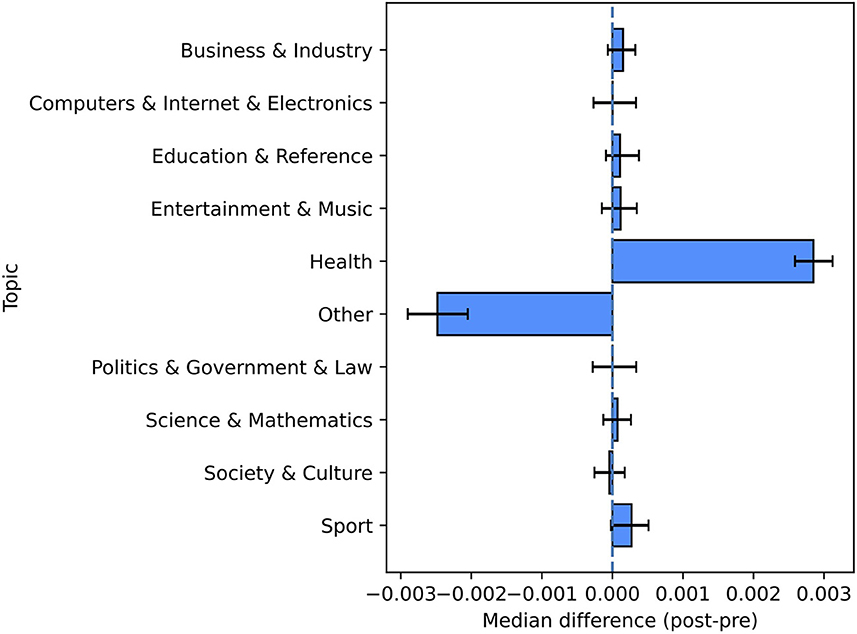
Figure 4. Pre-/post-comparison for the categories of topics. This figure shows the non-parametric confidence intervals and the estimated pseudomedians of the differences between the proportions in the post-period and the ones in the pre-period.
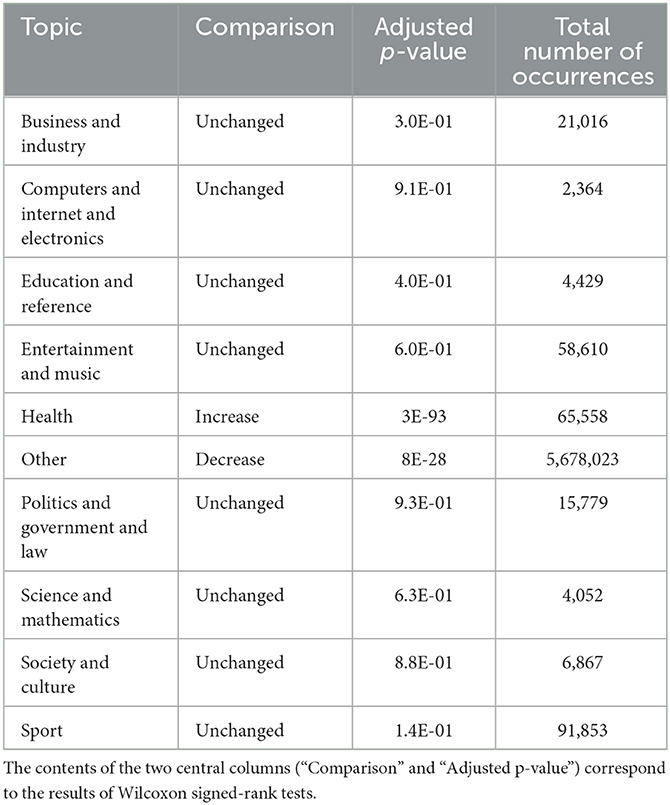
Table 3. Pre-/post-comparisons for the possible topics assigned to the tweets.
Figure 5 and Table 4 report the changes observed for a set of 12 symptoms commonly found in people infected with COVID-19 (16). The most encountered symptoms in the post-period were headache, fever and coughing, which were present in 39.3%, 33.7% and 33.4% of the users reporting symptoms in the post-period, respectively. All the symptoms were more present in the post-period, with the exception of the least reported ones (myalgia and malaise) which had very low counts overall (12 and 38 occurrences for myalgia and malaise, respectively).
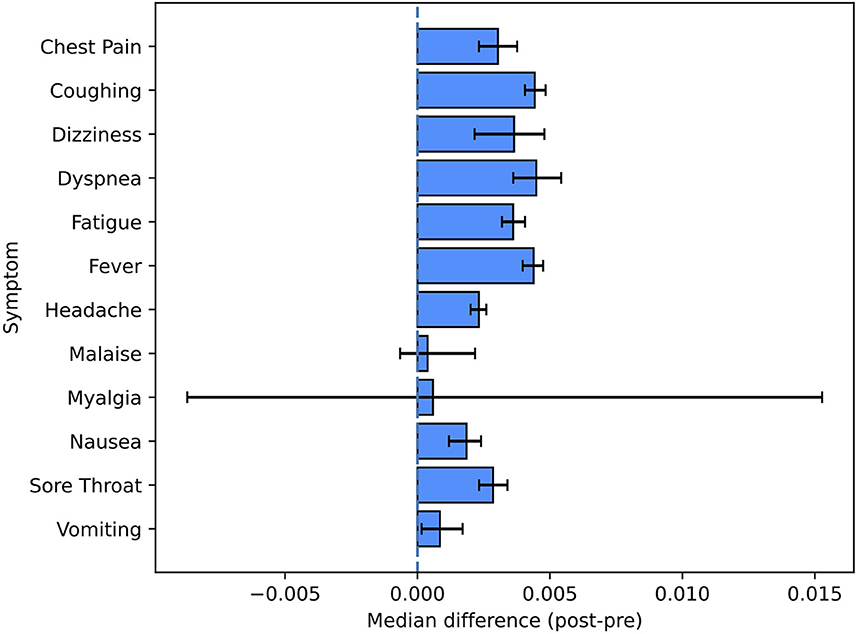
Figure 5. Pre-/post-comparison for symptom tags. This figure shows the non-parametric confidence intervals and the estimated pseudomedians of the differences between the proportions in the post-period and the ones in the pre-period.
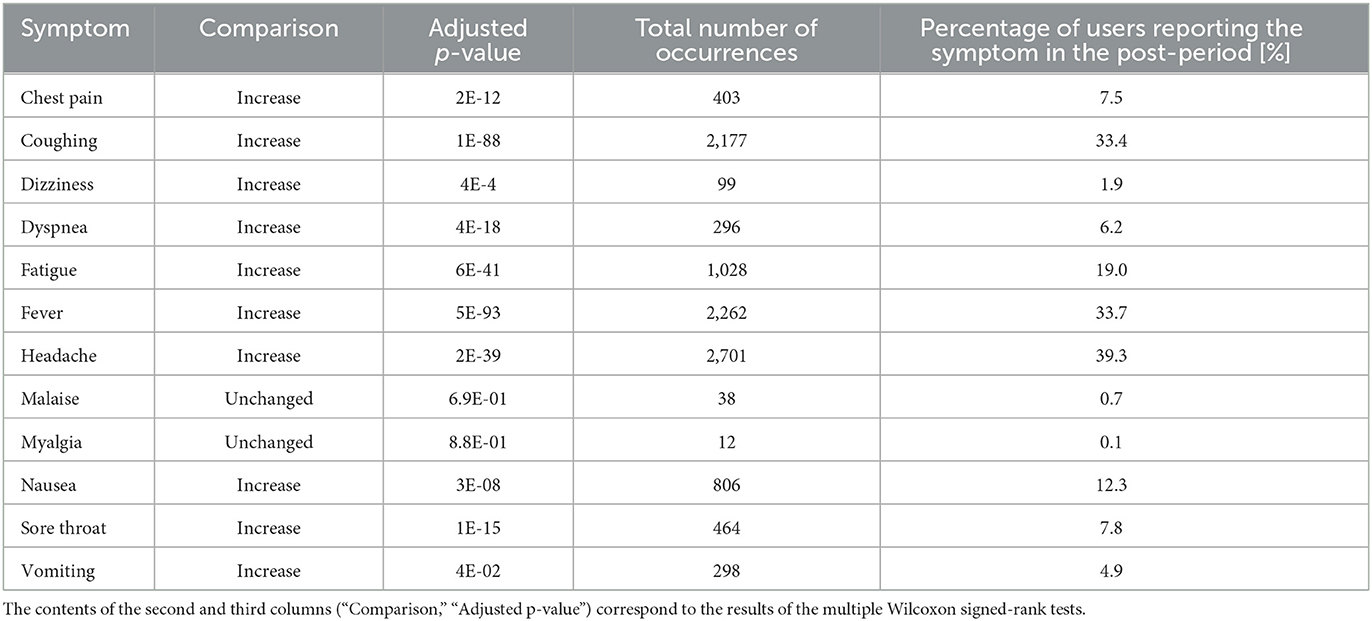
Table 4. Pre-/post-comparisons for the set of selected symptom tags.
Table 5 outlines the prevalence of the seven most frequent symptoms according to a medical study of COVID-19 cases reported to CDC between January 22, 2020 and May 30, 2020 (21). This table also provides the results of a study in which Twitter self-reports of symptoms were manually reviewed for a group of 203 users being infected by SARS-CoV-2 (study by Sarker et al.) (15). The post-period of our study covered 3 months (observation period of 12 weeks), while Sarker et al. considered all the tweets posted between February 1, 2020, and May 8, 2020.
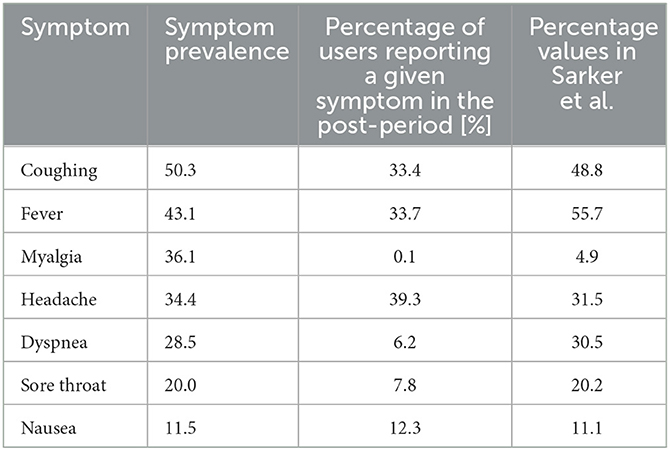
Table 5. Comparison of the results obtained in the current study with two external studies: (i) the prevalence of symptoms in COVID-19 cases according to a medical study of cases reported to CDC between January 22, 2020 and May 30, 2020 (21); (ii) the results of a study based on manually reviewed Twitter data (15).
According to our data analysis, all twelve selected symptoms were most reported during the week of the test-positive tweets (see Supplementary Figure 3), which marked the beginning of the post-period. To determine whether the frequency increase in the post-period had a lasting effect, we estimated the symptom-reporting maximum duration (SRMD) for each symptom, as defined in the Methods.
Table 6 indicates that the higher prevalence of five symptoms (dizziness, headache, nausea, sore throat, and vomiting) in the post-period lasted 1 week. Five other symptoms (chest pain, coughing, dyspnea, fatigue, and fever) were characterized by a longer symptom-reporting duration (up to 4 weeks). In particular, the duration of the increase of dyspnea- and fatigue-related tweets lasts up to the 3rd and 4th week in the post-period, respectively. The symptom-reporting durations are partially in line with the duration of symptoms for mild SARS-CoV-2 infections, which has been estimated (29) as 31 ± 26 days for fatigue, 19 ± 22 days for dyspnea, 14 ± 13 days for coughing, 12 ± 6 days for nausea/vomiting, 11 ± 15 days for headache. On the other hand, the 2-week duration of fever reporting on Twitter is longer than the 6 ± 9 days duration of the symptom, and the 1-week duration of sore throat reporting is shorter than the 13 ± 17 days symptom.
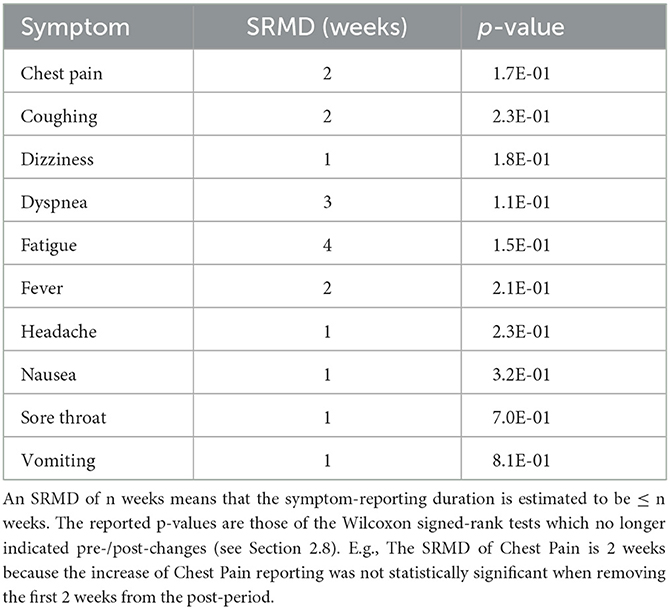
Table 6. SRMDs of SARS-CoV-2 symptoms.
In this work we were interested in gaining insights into the content changes following self-reports of SARS-CoV-2 infection on Twitter. We used a large dataset of tweets posted by users who claimed to be infected between March 2020 and July 2021. Self-reports of infections were identified with an ad-hoc regular expression minimizing the presence of false positives, as we prioritized specificity over sensitivity. The correlation between the volume of self-reports detected on Twitter with the COVID-19 case numbers in the major English-speaking countries was high, which supports our assumption that the thus-identified tweets are indeed related to confirmed SARS-CoV-2 infections.
A recent study pointed out the predominance of negative emotions (anxiety, fear and sadness) on Twitter during the onset of the COVID-19 pandemic (30) with respect to a 2019 baseline (11). By applying a state-of-the art emotion classifier (24), we found that sadness was one of the two most represented emotions in self-reports of SARS-CoV-2 infections over the entire time range (March 2020 to July 2021). Nevertheless, our dataset also included a large proportion of tweets conveying optimistic content; this may reflect the effort of infected people to express positivity and hope through social media.
The prevalence of five symptoms (coughing, fever, myalgia, dyspnea, and sore throat) was underestimated in our results with respect to a CDC report (21), while the respective values for the prevalence of headache and nausea were consistent with this same report. In contrast, another study about self-reports of symptoms by Sarker et al. (15) reported percentage values (see rightmost column of Table 5) that are well aligned with the actual values of symptom prevalence found in the medical literature (21), confirming that Twitter can be valuable data source. Still, the self-reporting of symptoms in studies based on social media data is not systematic, which may affect the results. The gap between our results and these two studies (15, 21) points to a suboptimal sensitivity of our methodology, which may be a consequence of our attempt to maximize the specificity of symptom annotations. Finally, it is worth noting that both Sarker et al.'s study (15) and the CDC report (21) were produced during the early phase of the pandemic (between February 2020 and June 2020, that is, when most tested people were likely to have more severe symptoms as vaccines were not available yet), whereas our study was based on symptom reports from March 2020 up to October 2021. The symptom prevalence may have shifted over time due to changing testing strategies, the effects of the COVID-19 vaccination campaigns, and the evolving properties of the predominant SARS-CoV-2 strains.
Furthermore, our analysis shows that 10 out of the 12 analyzed symptoms were more represented in the post-period as compared to the pre-period. While half of the increases could be attributed to more frequent mentions in the very same week of the infection self-reports (dizziness, headache, nausea, vomiting, and sore throat), some others were longer-lasting (fatigue, dyspnea, chest pain, coughing, and fever). The number of weeks characterized by an increased symptom-reporting prevalence was in good agreement with the observed duration of clinical symptoms in COVID-19 mild cases (29). Even if we were not able to assess whether the collected tweets were actually related to SARS-CoV-2 infections, the significant increase of symptoms self-reports and the consistency with clinical symptom durations suggest that we captured relevant information related to confirmed infections. This approach can be used to automatically gain knowledge about symptomatology from Twitter data, to improve and inform traditional public health surveillance and studies.
One of the strengths of our study is that we retrieved the full public Twitter timeline for each user. This way, we were able to get an unbiased view on their behavior on Twitter, without the constraints that could have been induced by keywords-based tweets collections. Furthermore, we built a pre-infection baseline of tweets which allowed us to analyze the content changes of infected Twitter users. A key limitation of the study is that the data are entirely observational and derived from short-text messages, which may not grasp the full complexity of the symptoms. In addition, our method only finds a subset of users who were willing to voluntarily disclose their SARS-CoV-2 infection on Twitter, which may represent a biased sample. While the number of users sampled with our method is strongly correlated with official COVID-19 numbers, the results of the analysis may not be fully representative of the behavior before and after a SARS-CoV-2 infection in the general population. We do note, however, that the symptomatic observations from the sample are broadly in line with reported observations from clinical studies. Finally, while manually curated approaches seem to provide more accurate estimates of symptom prevalence, such methods are practically inapplicable to large volumes of data, but this tradeoff between data accuracy and volume will be reduced in the future as NLP methods improve.
Our study shows how social media can be used to aggregate cohorts of digital users on which to investigate the effects of infectious diseases. By comparing the content posted by Twitter users before and after self-reported SARS-CoV-2 infections, we observed an increase of emotional and health-related content. Additionally, we observed an increased proportion of symptom-containing tweets after SARS-CoV-2 infections were reported, and we found that the number of weeks accounting for the increase in symptom reports was in line with the duration of COVID-19 symptoms estimated in clinical studies. We therefore believe that in the same way that digital public health surveillance can be useful to detect acute health issues (31), the proposed approach may also be useful for slowly emerging long-term health issues such as post-acute sequelae of COVID-19. In particular, the full spectrum of symptoms could be searched for with a NER-based pipeline similar to ours, to identify all the possible symptoms associated to an infection. In general, digital health surveillance for novel phenomena that are slow to be recognized by the medical system (as was the case for post-acute sequelae of COVID-19) can be a useful complement to conventional health surveillance systems.
The code for the analyses described in this study can be found in the following GitHub repository: https://github.com/digitalepidemiologylab/content_changes_paper. Shareable data from this study can be found on Zenodo: https://doi.org/10.5281/zenodo.7499496.
FD and FP collected and analyzed the data. FD, FP, DR, and MS designed the study and supervised the analysis. All authors wrote the paper. All authors contributed to the article and approved the submitted version.
This project was funded through the European Union's Horizon 2020 research and innovation program under grant agreement no. 874735. Versatile emerging infectious disease observatory—forecasting, nowcasting, and tracking in a changing world (VEO). Funding for the Crowdbreaks platform was provided by the Fondation Botnar.
We thank Claudia Sala for insightful discussions regarding statistical analysis.
The authors declare that the research was conducted in the absence of any commercial or financial relationships that could be construed as a potential conflict of interest.
All claims expressed in this article are solely those of the authors and do not necessarily represent those of their affiliated organizations, or those of the publisher, the editors and the reviewers. Any product that may be evaluated in this article, or claim that may be made by its manufacturer, is not guaranteed or endorsed by the publisher.
The Supplementary Material for this article can be found online at: https://www.frontiersin.org/articles/10.3389/fpubh.2022.1069931/full#supplementary-material
1. Kostkova P. Grand challenges in digital health. Front Public Health. (2015) 3:134. doi: 10.3389/fpubh.2015.00134
2. Salathé M, Bengtsson L, Bodnar TJ, Brewer DD, Brownstein JS, Buckee C, et al. Digital epidemiology. PLoS Comput Biol. (2012) 8:e1002616. doi: 10.1371/journal.pcbi.1002616
3. Shakeri Hossein Abad Z, Kline A, Sultana M, Noaeen M, Nurmambetova E, Lucini F, et al. Digital public health surveillance: a systematic scoping review. NPJ Digit Med. (2021) 4:41. doi: 10.1038/s41746-021-00407-6
4. Fagherazzi G, Goetzinger C, Rashid MA, Aguayo GA, Huiart L. Digital health strategies to fight COVID-19 worldwide: challenges, recommendations, and a call for papers. J Med Internet Res. (2020) 22:e19284. doi: 10.2196/19284
5. Cencetti G, Santin G, Longa A, Pigani E, Barrat A, Cattuto C, et al. Digital proximity tracing on empirical contact networks for pandemic control. Nat Commun. (2021) 12:1655. doi: 10.1038/s41467-021-21809-w
6. Jose T, Warner DO, O'Horo JC, Peters SG, Chaudhry R, Binnicker MJ, et al. Digital health surveillance strategies for management of coronavirus disease 2019. mcp:iqo. (2021) 5:109–17. doi: 10.1016/j.mayocpiqo.2020.12.004
7. Ni MY, Yang L, Leung CMC, Li N, Yao XI, Wang Y, et al. Mental health, risk factors, and social media use during the COVID-19 epidemic and cordon sanitaire among the community and health professionals in Wuhan, China: cross-sectional survey. JMIR Mental Health. (2020) 7:e19009. doi: 10.2196/19009
8. Digital 2020: April Global Statshot. DataReportal – Global Digital Insights. Available online at: https://datareportal.com/reports/digital-2020-april-global-statshot (accessed July 16, 2022).
9. Tsao SF, Chen H, Tisseverasinghe T, Yang Y, Li L, Butt ZA. What social media told us in the time of COVID-19: a scoping review. Lancet Digital Health. (2021) 3:e175–94. doi: 10.1016/S2589-7500(20)30315-0
10. Durazzi F, Müller M, Salathé M, Remondini D. Clusters of science and health related Twitter users become more isolated during the COVID-19 pandemic. Sci Rep. (2021) 11:19655. doi: 10.1038/s41598-021-99301-0
11. Metzler H, Pellert, M, Garcia, D,. Using Social Media Data to Capture Emotions Before During COVID-19. World Happiness Report. Sustainable Development Solutions Network. (2022). p. 30. Available online at: https://worldhappiness.report/ed/2022/using-social-media-data-to-capture-emotions-before-and-during-covid-19/#:~:text=The%20relationship%20between%20social%20mediaemotions%20of%20sadness%20and%20anxiety
12. Oliveira FB, Haque A, Mougouei D, Evans S, Sichman JS, Singh MP. Investigating the emotional response to COVID-19 news on twitter: a topic modeling and emotion classification approach. IEEE Access. (2022) 10:16883–97. doi: 10.1109/ACCESS.2022.3150329
13. Lampos V, Majumder MS, Yom-Tov E, Edelstein M, Moura S, Hamada Y, et al. Tracking COVID-19 using online search. NPJ Digit Med. (2021) 4:1–11. doi: 10.1038/s41746-021-00384-w
14. Ding Q, Massey D, Huang C, Grady CB, Lu Y, Cohen A, et al. Tracking self-reported symptoms and medical conditions on social media during the COVID-19 pandemic: infodemiological study. JMIR Public Health Surveill. (2021) 7:e29413. doi: 10.2196/29413
15. Sarker A, Lakamana S, Hogg-Bremer W, Xie A, Al-Garadi MA, Yang YC. Self-reported COVID-19 symptoms on Twitter: an analysis and a research resource. J Am Med Inform Assoc. (2020. 27:1310–5. doi: 10.1093/jamia/ocaa116
16. Banda JM, Adderley N, Ahmed WUR, AlGhoul H, Alser O, Alser M, et al. Characterization of long-term patient-reported symptoms of COVID-19: an analysis of social media data. Medrxiv. (2021). doi: 10.1101/2021.07.13.21260449
17. Müller MM, Salathé M. Crowdbreaks: tracking health trends using public social media data and crowdsourcing. Front Public Health. (2019) 7:81. doi: 10.3389/fpubh.2019.00081
18. Timelines Introduction. Available online at: https://developer.twitter.com/en/docs/twitter-api/tweets/timelines/introduction (accessed July 21, 2022).
19. twarc. Available online at: https://twarc-project.readthedocs.io/en/latest/ (accessed July 21, 2022).
20. Kraljevic Z, Searle T, Shek A, Roguski L, Noor K, Bean D, et al. Multi-domain clinical natural language processing with MedCAT: the medical concept annotation toolkit. Artif Intell Med. (2021) 117:102083. doi: 10.1016/j.artmed.2021.102083
21. Stokes EK. Coronavirus disease 2019case surveillance — United States, January 22–May 30, 2020. MMWR Morb Mortal Wkly Rep. (2020) 69:343–6. doi: 10.15585/mmwr.mm6924e2
22. Michelen M, Manoharan L, Elkheir N, Cheng V, Dagens A, Hastie C, et al. Characterising long COVID: a living systematic review. BMJ Global Health. (2021) 6:e005427. doi: 10.1136/bmjgh-2021-005427
23. Valdes A, Lopez J, Montes M. UACH-INAOE at SMM4H: a BERT based approach for classification of COVID-19 Twitter posts. In: Proceedings of the Sixth Social Media Mining for Health (#SMM4H) Workshop and Shared Task. Mexico City, Mexico: Association for Computational Linguistics (2021). p. 65–8. Available online at: https://aclanthology.org/2021.smm4h-1.10 (accessed November 08, 2021).
24. Alhuzali H, Ananiadou S. SpanEmo: Casting Multi-label Emotion Classification as Span-prediction. In: Proceedings of the 16th Conference of the European Chapter of the Association for Computational Linguistics: Main Volume. Association for Computational Linguistics (2021).
25. Plutchik R. A psychoevolutionary theory of emotions. Soc Sci Inform. (1982) 21:529–53. doi: 10.1177/053901882021004003
26. Patil S,. DistilBart-MNLI (2022). Available online at: https://github.com/patil-suraj/distillbart-mnli (accessed June 17, 2022).
27. Willfuks. tfcausalimpact (2022). Available online at: https://github.com/WillianFuks/tfcausalimpact/blob/d6057372603902e20026fd5695e29ad9de0285ca/notebooks/getting_started.ipynb (accessed July 14, 2022).
28. Bauer DF. Constructing confidence sets using rank statistics. J Am Stat Assoc. (1972) 67:687–90. doi: 10.1080/01621459.1972.10481279
29. Klein AZ, Magge A, O'Connor K, Amaro JIF, Weissenbacher D, Hernandez GG. Toward using twitter for tracking COVID-19: a natural language processing pipeline and exploratory data set. J Med Intern Res. (2021) 23:e25314. doi: 10.2196/25314
30. Garcia K, Berton L. Topic detection and sentiment analysis in Twitter content related to COVID-19 from Brazil and the USA. Appl Soft Comput. (2021) 101:107057. doi: 10.1016/j.asoc.2020.107057
Keywords: COVID-19, Twitter, deep learning, symptoms, Natural Language Processing (NLP)
Citation: Durazzi F, Pichard F, Remondini D and Salathé M (2023) Dynamics of social media behavior before and after SARS-CoV-2 infection. Front. Public Health 10:1069931. doi: 10.3389/fpubh.2022.1069931
Received: 14 October 2022; Accepted: 30 December 2022;
Published: 23 February 2023.
Edited by:
Wellington Pinheiro dos Santos, Federal University of Pernambuco, BrazilReviewed by:
Tore Bonsaksen, Inland Norway University of Applied Sciences, NorwayCopyright © 2023 Durazzi, Pichard, Remondini and Salathé. This is an open-access article distributed under the terms of the Creative Commons Attribution License (CC BY). The use, distribution or reproduction in other forums is permitted, provided the original author(s) and the copyright owner(s) are credited and that the original publication in this journal is cited, in accordance with accepted academic practice. No use, distribution or reproduction is permitted which does not comply with these terms.
*Correspondence: Daniel Remondini,  ZGFuaWVsLnJlbW9uZGluaUB1bmliby5pdA==
†These authors have contributed equally to this work and share first authorship
Disclaimer: All claims expressed in this article are solely those of the authors and do not necessarily represent those of their affiliated organizations, or those of the publisher, the editors and the reviewers. Any product that may be evaluated in this article or claim that may be made by its manufacturer is not guaranteed or endorsed by the publisher.
Research integrity at Frontiers
Learn more about the work of our research integrity team to safeguard the quality of each article we publish.