 Chen Long1,2
 Myeong Sook Yoon2*
- 1Health Services Management Department, Guizhou Medical University, Guiyang, China
- 2Department of Social Welfare, Jeonbuk National University, Jeonju, South Korea
Specific domains of the Sugar-Sweetened Media Literacy Scale (SSM-ML) have been shown to significantly assess sugar-sweetened beverage (SSB) calorie intake in the US population. This study aimed to describe the psychometric properties of the revised Chinese version of the SSB-ML (C-SSB-ML) and evaluate its validity and reliability. Results from 975 undergraduates at two of the largest universities in a province in southwest China showed that Cronbach's alphas for the overall scale, the three dimensions, and two-halves analysis were satisfactory (0.71–0.92). The criterion-related validity of the C-SSB-ML was positively associated with the e Health literacy scale (eHEALS). Confirmatory factor analysis showed that the three-factor model of the C-SSB-ML had adequate fit indices χ2 (153) = 4349.93, p < 0.001; Comparative fit index (CFI), Tucker-Lewis index (TLI), Incremental fit index (IFI) >0.90; Standardized Root Mean Square Residual (SRMR) <0.07; and Root Mean Square Error of Approximation (RMSEA) <0.08. Our findings provide evidence for a valid and reliable tool that can be used to assess sugar-sweetened media literacy in Chinese undergraduates and will help organizations leverage media literacy in strategy formulation to ensure SSB intake is controlled as much as possible through effective efforts on all fronts.
Introduction
Consumption of liquid carbohydrates, especially sugar-sweetened beverage (SSB), is not only high but has been increasing globally to varying degrees of significance for decades (1–7). In the United States, per capita consumption of SSB more than doubled from the late 20th century to the early twenty-first century (8), as well as the increase in daily calorie consumption per capita in China of SSB sold by Coca-Cola and PepsiCo by 215 and 147%, respectively, in the decade beginning in 2000 (9). Evidence, including prospective epidemiological studies, suggests that SSB intake is associated with obesity, both in adults and children (1, 10–16). Due to the rapid absorption of liquid carbohydrates, SSB may trigger glucose intolerance and insulin resistance and increase the risk of developing metabolic diseases such as latent autoimmune diabetes in adults, type 2 diabetes mellitus and metabolic syndrome in adults by increasing the dietary glycemic load in the presence of high consumption (1, 11–13, 17–20). SSB intake, even at low calorie levels, promotes higher triglyceride concentrations and is associated with adverse levels of inflammation and serum C-reactive protein, a biomarker of cardiovascular risk, and may lead to an increased risk of cardiovascular morbidity and mortality (13, 16, 20–24). Another issue of concern is the association between the intake of free sugars and dental caries, not only because dental caries is the most prevalent form of NCDs in the world (25–27) but also because the cost of treating dental caries accounts for 5–10% of the health budget of industrialized countries, likely exceeding the entire financial resources spent on children's health in most low-income countries (26–28). Increased SSB intake leads to poor diet quality while consuming more calories (29–31), not only a higher intake of high saturated and high trans fatty acids, but also lack of fiber, vitamins, and essential nutrients (10, 32–36). In addition, high intake of SSB has been observed to be associated with reduced bone mineral compactness and subsequent fractures (37–39).
During the transition from adolescence to adulthood, health-related behavior patterns are being established (40, 41). The transition from home to college may lead to poor choices in undergraduates' diet (40–43). They are in an obesogenic environment, have access to an all-you-can-eat cafeteria, where the food is often high in fat and sugar (17–19). In terms of promoting sound eating habits, undergraduates represent an important subgroup of young adults due to the challenges they face in making healthy choices (20). SSB make up an increasing proportion of calorie intake; during the decade beginning in 2000, SSB sales by Coca-Cola and PepsiCo witnessed an increase in per capita daily calorie consumption in China by 215 and 147%, respectively (21). A national cross-sectional survey in China in 2016 showed that 47% of adults residing in cities consumed more than one serving of SSB per day (22). The problem is that China, sandwiched between the powerful influence of the International Life Sciences Institute (ILSI) and various other SSB companies, remains decades behind in efforts to create a healthier diet for its citizens (23). Media presentations have influenced our perceptions of the foods presented, and the extent to which they now overwhelmingly present and advance foods high in sugar, fat and salt is undeniable (9, 44–48). In terms of promoting sound eating habits, undergraduates represent an important subgroup of young adults due to the challenges they face in making healthy choices (20). Media would now be able to add to this intrinsic inclination as they overwhelmingly present and advance unhealthy food options, with undeniable degrees of sugar, fat, and salt (24–27). Since the 1950s, Western scholars have been concerned about the role of mass media in consumer socialization (28). Media presentations influence our perceptions of the foods showcased and shape our perceptions of what we know, like, and how we should act (29, 30). In 2009, to explore the relationship between smoking and smoking-mediated literacy, antismoking media literacy (AML)—a theoretical framework focusing on skill sets in various domains of media literacy—was developed. Not only did the researchers find that higher smoking media literacy was significantly associated with lower current smoking prevalence, but they also found a strong independent association between higher smoking media literacy and lower susceptibility to future smoking in subsequent analyses (31, 32). Subsequently, based on AML, an ideal internal consistency assessment tool, SSB-ML, was developed (33) and validated among university students in Turkey (34). Result of a UNESCO project survey in China have shown that more than half of college students strongly believe that evaluating the information they find is difficult (49).
Based on the Antismoking Media Literacy (AML) (50, 51), Sugar-Sweetened Media Literacy Scale (SSM-ML), a theoretical framework focusing on skills in various domains of SSB media literacy was developed and validated as an ideal internal consistency assessment tool in American and Turkish populations (52, 53). Based on the gap that the impact of evolving media on eating behaviors has not received sufficient attention, this study aimed to examine the psychometric properties of the C-SSB-ML and to describe the variation in C-SSB-ML scores among undergraduate students with different demographic characteristics in a Chinese setting.
Materials and methods
Study design
A non-experimental, cross-sectional study using a survey was conducted the end of September and the beginning of November 2021 with 1,044 students from two of the largest universities located in a province in southwestern China. Participants were selected using incidental and snowball sampling, reaching the target population to the greatest extent possible through paper-based and online questionnaires.
Translation and adaptation
Before beginning the study, e-mail permission was sought from Dr. Yvonnes Chen, one of the main developers of the SSB-ML. In the first step of the translation process, two bilinguals were informed of the basic profile of the study sample population, and the original scale was translated from English to Chinese by these two individuals under the supervision of the study leader. Afterwards, a monolingual who was not good at English was asked to test and comment on the semantic ambiguities of the Chinese version. An English-specialized researcher back-translated the resulting version into English. The bilingual team compares the original scale with the back-translated scale and adjusts it to obtain the C-SSB-ML, Chinese version of SSB-ML. In the process, the words “TV”, “magazine” and “movie” in the original version were adjusted according to the media that Chinese undergraduates encounter in their daily lives and replaced by the words “Douyin (TikTok)”, “short video” and “social media”. The newly developed C-SSB-ML was tested in 20 participants (not included in this study) to check their understanding of the items being used in this study, this was done to assess if all 19 items were easy to provide ratings for and had no ambiguity among Chinese speakers. As the steps in Figure 1.
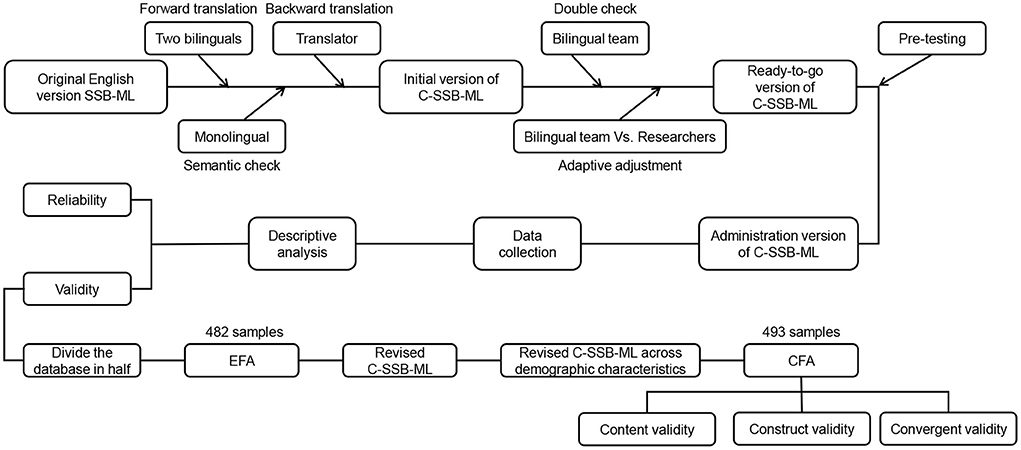
Figure 1. Flowchart of translation and adaptation process and data analysis.
Data collection and measures
For the sample size calculation, we carefully considered multiple criteria, firstly in order to have an idea of the problem involved, a careful attempt at a rule of thumb suggests that the sample size should always be more than 10 times the number of free model parameters (54, 55). Based on the six rules of Raykov et al. (56), our model parametric number was determined as follows, with 18 residual variance, 3 covariances between independent variables, and 18 factor loadings connecting the potential variables and their indicators, so our total number of model parameters is 39. Then, the sample size for the first step is determined as 390. Since we want to perform an average and independent database for each of EFA and CFA, our sample size should be at least 780. Also, the criteria for the EFA sample followed Comrey and Lee's suggested size range (57). Considering the response rate and missing values, we tried to reach the maximum number of respondents. Finally, a total of 1,044 participants agreed with the contents. Another inclusion criterion was to have consumed an SSB at least once in the past month and have a clear memory of the type and volume of SSB consumed regularly. Participants had the option of completing the survey through (https://www.wjx.cn/) or through a paper-and-pencil survey provided by their classroom teacher. In the end 975 valid surveys were located, with a response rate of 92.86%. 956 participants chose to complete the survey online, and 19 completed a paper-and-pencil survey, with each one lasting approximately 15–25 minutes.
Chinese version of the SSB-ML(C-SSB-ML)
The C-SSB-ML scale was developed to assess individuals' media literacy skills in SSB (52). 19 items are included on the scale. Each item is scored on a seven-point Likert-type scale as “1” for absolutely disagree, “4” for neutral, and “7” for absolutely agree. Functional skills, interactive skills, food selection skills, and critical thinking skills are assessed by this scale (53). The first dimension of the C-SSB-ML, Authors & Audiences (AA), focuses on describing the beverage industry as highly influential and manipulative. The second dimension is Messages and Meanings (MM), which focuses on describing images, symbols, and pictures that evoke an emotional response to achieve a specific marketing purpose. The last dimension involves Representation & Reality (RR), as there is a discrepancy between the real health effects of ingesting either tobacco or SSB and what marketers portray, and this dimension is concerned with that ironic discrepancy (50, 52). The Cronbach's alphas for the entire scale in the previous study were found to be 0.89 and 0.86 (52, 53), with the three sub-dimensions ranging from 0.65 to 0.83 (52).
The eHealth literacy scale (eHEALS)
The eHEALS was developed in 2006 (58), measures individuals' multidimensional skills in accessing, understanding, and evaluating health information from electronic media and using this knowledge to solve their health problems. The eHEALS is the first electronic health literacy assessment tool to measure netizens' self-awareness of their ability to seek and apply online health knowledge. There are eight items on the scale, each scored on a five-point Likert-type scale, from “strongly disagree” to “strongly agree”. Sample items include: “I know how to find helpful health resources on the Internet”; “I know how to use the Internet to answer my health questions”; and “I know what health resources are available on the Internet.” The Cronbach's alpha for the overall Chinese version of eHEALS was 0.91 and factor loading coefficients were between 0.69 and 0.87 (59).
Socio-demographic questions
This part consisted of five questions about the participant's age, gender, grade, body weight, and height (to calculate the BMI), and mother's education level.
Statistical analysis
Confirmatory factor analysis (CFA) was performed with AMOS 24.0, and the rest using SPSS 24.0. Differences in demographic characteristics of C-SSB-ML (overall and the three dimensions) scores and demographic characteristics were analyzed using one-way analyses of variance (ANOVA) and independent sample t-tests. Database was divided into two halves, with 482 samples in the first half used to perform explanatory factor analysis (EFA) and 493 samples in the other half used to perform CFA. Substance-factor relationships were determined using EFA. The criteria for factor loading included items having values≥ 0.50 on the primary factor, and no items cross loaded onto other factors. Kaiser-Meyer-Olkin (KMO) statistics and Barlett Sphericity test were used to assess the factorability of the correlation matrix. For factor extraction, the robust maximum likelihood method (RML) with correction for robust mean and variance-scaled was used. An analysis of the CFA was conducted to determine whether the items and dimensions explained the structure of the original scale. To determine whether the items and dimensions explained the structure of the original scale, CFA was performed on a second subsample using the maximum likelihood method (ML). The following criteria are used as cut-off points for ideal fits (60, 61), The goodness-of-fit was assessed by chi-square (χ2), chi-square/degrees of freedom (χ2/df), the Comparative fit index (CFI), the Tucker–Lewis index (TLI), Incremental fit index (IFI), the Root Mean Square Error of Approximation (RMSEA), and the Standardized Root Mean Square Residual (SRMR). Total score of the C-SSB-ML and discriminant validity among the three dimensions, as well as the convergent validity of eHEALS, were assessed using Pearson correlation analysis. The item-level content validity index (I-CVI) and the average of the I-CVI scores for all items on the scale (S-CVI/Ave) were used to assess the degree of relevance and representation of the elements in the instrument to the goal constructs. C-SSB-ML and three dimensions were tested for internal consistency using Cronbach's alpha coefficients (Figure 1).
Ethical considerations
This study was approved by the Human Trials Ethics Committee of Guizhou Medical University (dated 22.04.2021 and numbered 2021-LUNSHENDI-150). Respondents were informed of the content of the survey and voluntarily chose to fill out the questionnaire without any compensation, and were informed that they could withdraw at any time without penalty, and that all respondents signed an informed consent form (those who chose to fill out the online questionnaire received an electronic version of the informed consent form).
Results
Participant characteristics
The average age of the participants was 19.60 years (SD = 1.44, range = 17–24). Most of the participants were in their first year (74.40%), with the majority being female (61.40%). In terms of their mothers' education, most of participants reported as primary school/below (50.70%), followed by junior high school (27.80%), high school (11%), junior college/above (8.60%), and unaware (1.90%). Using the Working Group on Obesity in China (WGOC) Body Mass Index (BMI) standards (62), the sample was 87.80% underweight or normal (BMI from the lowest to 23.99) and 12.20% overweight or obese (BMI from 24 to 27.99).
Revised C-SSB-ML across socio-demographic characteristics
First, regarding the mean scores of the dimensions of C-SSB-ML, participants scored the highest on the MM dimension (M = 5.25, SD = 1) followed by RR (M = 4.88, SD = 1.12) the lowest was AA (M = 4.42, SD = 1). The mean score of C-SSB-ML overall was 4.91 (SD = 0.87). Out of a total of 18 items, the highest scoring item was “Two people may see the same short video on Douyin (TikTok) and get very different ideas about it” in the MM dimension (M = 5.57, SD = 1.30) and the lowest scoring item was “Certain sugary drink brands are designed to appeal to people like me” in the AA dimension (M = 3.94, SD = 1.61). Second, females had significantly higher mean scores than males in both the overall scale and MM dimension, and males had slightly higher mean score than females in the RR dimension but the difference was not statistically significant. Similarly, the three age groups showed statistically significant differences in overall scale and MM dimension score, with the middle age group scoring higher than the other two groups. However, the same pattern was not shown in terms of grade, not only is the difference presented in the scores of the AA dimension, but the highest scores are for 4th year undergraduates. Statistically differences due to BMI were shown in the overall scale, AA dimension and RR dimension, with the most prominent pattern being the coexistence of high BMI and high C-SSB-ML scores (see Table 1).
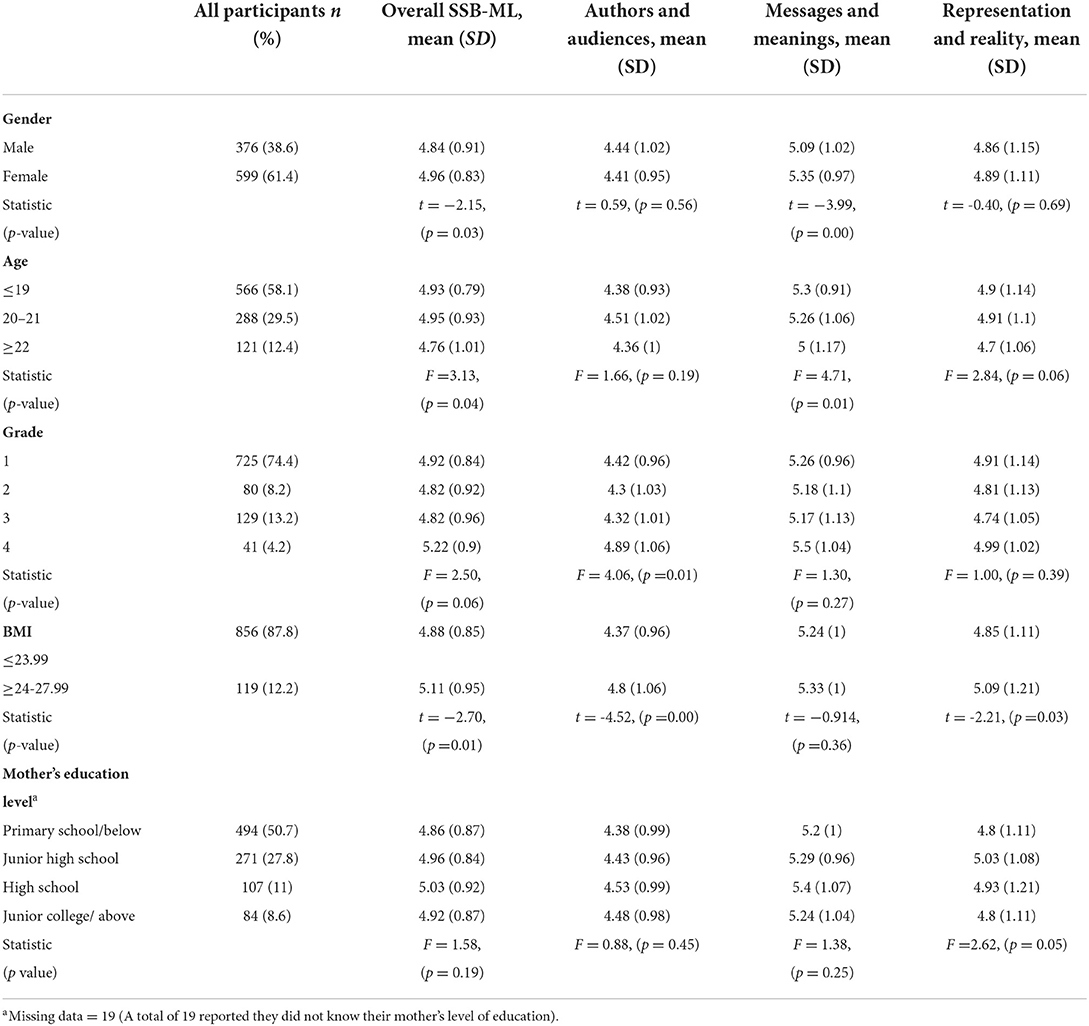
Table 1. Revised C-SSB-ML across socio-demographic characteristics.
Psychometric properties
Content validity
A panel of nine experts with extensive research experience in the field of health care, comprising three professors/associate professor, one graduate student and one practicing physician, and four PhD candidates. These experts were invited to rate the relevance of the scale's 18 items on a 4-point Likert scale (where 1 = not related, 2 = slightly related, 3 = quite related, and 4 =strongly related). I-CVI is calculated by the percentage of relevance ratings given to items 3 or 4 by content experts, and the average of the proportional correlations of all expert judgments was used to calculate the S-CVI/Ave. The S-CVI/Ave was 0.88 and I-CVI for all questions was equal to or higher than 0.78, and the revised C-SSB-ML had good content validity considering the number of experts (63, 64).
Construct validity
According to KMO, sampling adequacy measure was 0.93. The statistical significance of Barlett Sphericity test was χ2 (153) = 4349.93 (p < 0.001), suggesting that factor analysis can be applied to the data.
In order to further optimize the application model of SSB-ML in the Chinese context, the item with factor loading < 0.5, that is, “sugary drink ads show a healthy lifestyle to make people forget about the health risks, such as weight gain and diabetes” was removed. Subsequently, “wearing a shirt with a sugary drink logo on it makes you a walking advertisement” and “sugary drink in social media link drinking these beverages to things people want, like joy, good looks, and health” were moved to the first dimension. “When designing an advertisement campaign, sugary drink companies think very carefully about the people they want to buy their beverages” and “most social media information shows people drinking sugary drinks make it look more attractive than it really is” were moved to the second dimension. There are two reasons why this alignment was acceptable. First, there was a degree of overlap between the various constructs of media literacy (50, 51). Second, the first two items fit into the original theoretical frameworks of “authors of media messages target specific audiences,” and the latter two also fit into “media messages convey particular values and/or points-of-view” and “producers carefully construct media messages” (50). As Table 2 shows, factor loadings in the AA dimension ranged from 0.51 to 0.68; MM dimension, from 0.56 to 0.80; and RR dimension, from 0.71 to 0.81. In total, 58.94% of the total variance was explained, the first eigenvalue explained 29.40% of the total variance, and the ratio of the first to the second eigenvalue was 1.78, and the ratio of the first to the third eigenvalue reached 2.26, indicating that the scale has the potential to be two-dimensional when used as a survey instrument for Chinese populations.
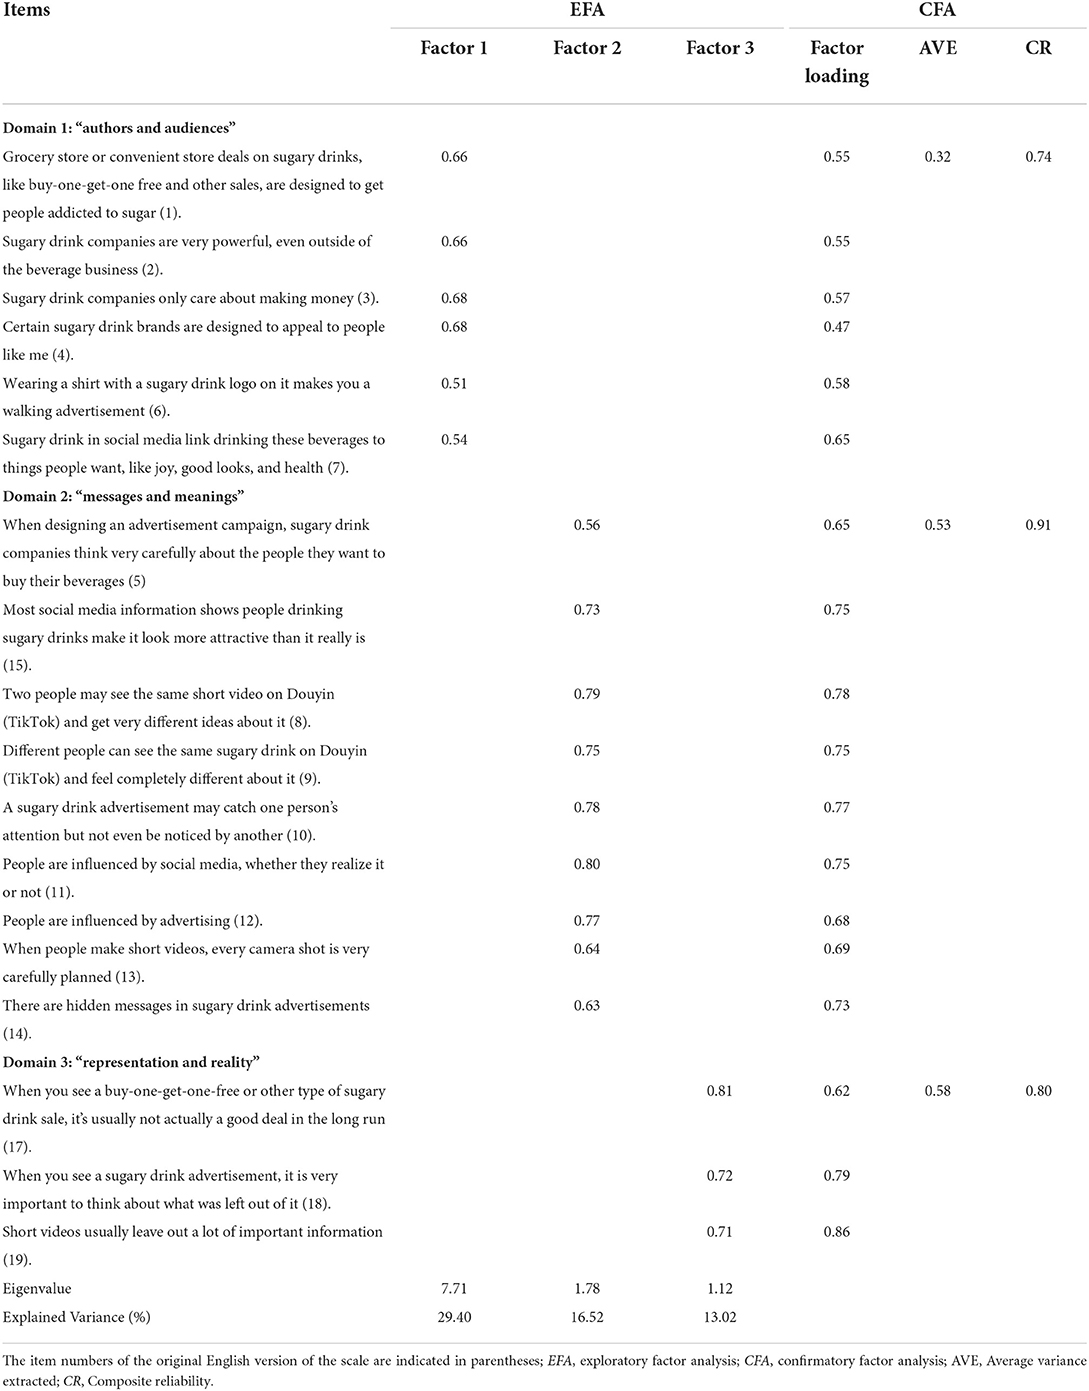
Table 2. Results of the exploratory and confirmatory factor analyses.
According to the CFA results, loadings of 18 items were medium to high (with values of 0.47–0.87) and the three-factor model for the 18 items exhibited a satisfactory fit as presented in Table 2. Fit indices indicated that three dimensions of C-SSB-ML represented the item responses in Chinese undergraduates with the following values: χ2/df = 3.63 (p < 0.001), CFI = 0.92, TLI = 0.91, IFI = 0.92, and these values are also considered acceptable (65–68). In addition, this study examined the two model fit indices from an absolute perspective: SRMR and RMSEA. Considering the total sample SRMR value of this study should be close to 0.08 (69, 70), the RMSEA value should be lower than 0.08 for acceptable model fit (60, 69, 70). The results of our study, SRMR of 0.06 and RMSEA of 0.07, are acceptable. Average variance extracted (AVE) and composite reliability (CR) were calculated for each domain, and although the CR values were excellent, one AVE did not reach 0.5, but the results were acceptable because it was higher than 0.3 (71).
Convergent validity
The convergent validity of the C-SSB-ML with one external measurement tool. As shown in Table 3, the convergent validity of the C-SSB-ML was also assessed in comparison with the eHEALS score. The eHEALS scores were significantly correlated with the total C-SSB-ML scores, as well as the scores of the three dimensions.
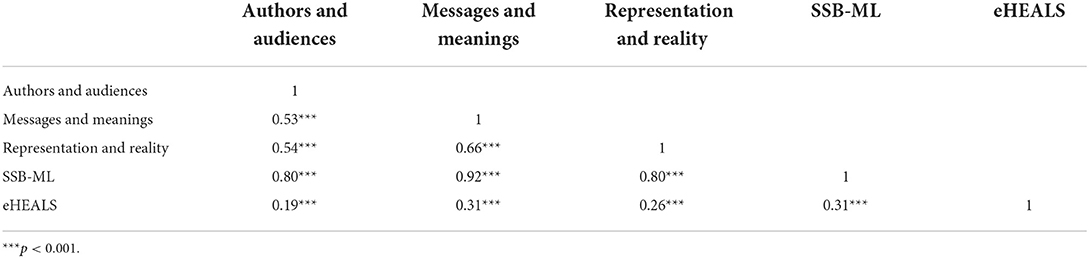
Table 3. Correlation between continuous variables of the revised C-SSB-ML and eHEALS.
Reliability
The Cronbach's alpha was 0.92 for the overall scale. The Cronbach's alpha of the subdimensions were 0.75, 0.92, and 0.82, for AA, MM, and RR, respectively. Based on the two-halves analysis, the Cronbach's alpha for the first and second halves, respectively, were 0.82 and 0.90. The Spearmen Brown coefficient was 0.83, the Guttman split-half coefficient was 0.83, and the correlation coefficient between the two halves was 0.71, which shows the high internal consistency of the scale.
Discussion
When looking at the C-SSB-ML across demographic characteristics, the first finding was that there was much room for improvement in the C-SSB-ML levels of Chinese undergraduate students. The mean (SD) for SSB-ML overall and across subdomains ranged from 5.83 (0.89) to 6.28 (0.57) for participants of similar age in the study by Chen et al., and were significantly higher than that in our study. However, the similarity between the results of the two studies was that respondents had the highest scores in the MM, followed by the RR, and the lowest in the AA (52).
Our primary finding showed that the relationship between gender and overall score of C-SSB-ML was in line with previous studies stating that females scored higher on the RR, MM, and the scale overall, but only the latter two differences were statistically significant. This suggests that the female participants tended to endorse the pluralistic structure of media literacy as a whole and SSB' critical attitude toward advertising intentions. This is consistent with previous studies in which females scored higher than males in media literacy sets or certain media literacy subdomains (72, 73). Participants with a BMI of 24–27.99 had significantly higher scores on the C-SSB-ML total scale, AA, and RR than those with a BMI less than or equal to 23.99. First, this suggests that higher BMI and higher media literacy scores can co-exist, which is consistent with the findings of a 2020 study (72). Furthermore, combined with the idea that larger female college students are more likely to have critical attitudes toward media images because they are less likely to be identified in them (74), our findings may suggest that such attitudes may be generalized to other media message areas. Second, this result implies that participants with a higher BMI are more sensitive to the marketing motives and techniques of media authors. In addition, fourth-year undergraduates scored significantly higher than freshman to junior undergraduates on all three subdomains and the overall scale, but no difference was significant, implying that fourth-year undergraduates were more willing to take a critical view of marketing techniques in the SSB industry.
Although the EFA results cannot be compared with the original study's findings (52), in a subsequent study, the factor loadings for the three dimensions were reported to be between 0.30 and 0.92, and a total of 49.90% of the variance can be explained by the sum of the three dimensions of the scale (53). Therefore, the current study indicates that the interpretation of factor loadings and scale variances is highly desirable.
In the initial study, Cronbach's alphas >0.65 were reported for the scale (52). In the Turkish version of the study, Cronbach's alphas were reported >0.65 in both the total scale and subdimensions, as well as in the two-halves (53). Our study is slightly higher than these two prior studies in terms of these values, indicating that the C-SSB-ML and previous studies are similar and has strong internal consistency.
In the literature, it is recommended to use CFA to study the structure determined by EFA, and a good fit is indicated if the model fit indicators are >0.90, the χ2/df is <5, RMSEA is <0.08, and SRMR is <0.07 (61, 75). The coefficient loadings in CFA in our study also showed satisfactory results between 0.47 and 0.86 (significantly higher than 0.3), and the model fit indicators were consistent with literature criteria.
Regarding convergent validity, the C-SSB-ML was highly correlated with eHEALS scores, a result that further confirmed the validity of the C-SSB-ML due to the highly established study of the applicability of eHEALS in the Chinese sample population.
Although we did our best to make the present study comparable to the initial study (52), there were still some context-based differences, such as we cannot completely exclude the effect due to the small range of BMI in the current sample population. Finally, it is worth noting that Guizhou province is an economically underdeveloped province in southwestern China, and our participants were representative of the undergraduate students in Guizhou. This representation can therefore not be extended to other provinces in China where the situation is quite different. Future investigations should be conducted in more diverse populations, as whether the SSB-ML subdomains are sensitive to different levels of media literacy needs to be further validated; similarly, the association between BMI and caloric intake of SSB in different populations should be further explored. As well as the association of SSB intake with media literacy, should be compared with the association of many other factors considered to be important predictors of this behavior.
Conclusions
Identifying which part of the media literacy skill set is most closely related to undergraduate students' SSB intake or motivation can help us design specific SSB control interventions. To our knowledge, this is the first study to validate the C-SSB-ML in a Chinese setting. We examined the psychometric properties of the C-SSB-ML and the results of the study point to the C-SSB-ML as a valid and reliable instrument and it may be an important component of SSB control interventions with Chinese undergraduates or young adults, especially because it is feasible and teachable.
Data availability statement
The original contributions presented in the study are included in the article/Supplementary material, further inquiries can be directed to the corresponding author/s.
Ethics statement
The studies involving human participants were reviewed and approved by the Human Trials Ethics Committee of Guizhou Medical University (numbered 2021-LUNSHENDI-150). The patients/participants provided their written informed consent to participate in this study.
Author contributions
CL and MY conceptualized this study, and they were also responsible for the data analysis. MY directed the study. CL was responsible for data gathering and the initial draft of the manuscript. Both authors contributed to this paper and approved the submitted version.
Conflict of interest
The authors declare that the research was conducted in the absence of any commercial or financial relationships that could be construed as a potential conflict of interest.
Publisher's note
All claims expressed in this article are solely those of the authors and do not necessarily represent those of their affiliated organizations, or those of the publisher, the editors and the reviewers. Any product that may be evaluated in this article, or claim that may be made by its manufacturer, is not guaranteed or endorsed by the publisher.
Supplementary material
The Supplementary Material for this article can be found online at: https://www.frontiersin.org/articles/10.3389/fpubh.2022.1009838/full#supplementary-material
References
1. Haque M, McKimm J, Sartelli M, Samad N, Haque SZ, Bakar MA, et al. Narrative review of the effects of sugar-sweetened beverages on human health: a key global health issue. J Popul Ther Clin Ph. (2020) 27:e76–e103. doi: 10.15586/jptcp.v27i1.666
2. Singh GM, Micha R, Khatibzadeh S, Shi P, Lim S, Andrews KG, et al. Correction: global, regional, and national consumption of sugar-sweetened beverages, fruit juices, and milk: a systematic assessment of beverage intake in 187 countries. PLoS ONE. (2019) 14:e0214344. doi: 10.1371/journal.pone.0214344
3. Vorster HH, Kruger A, Wentzel-Viljoen E, Kruger HS, Margetts BM. Added sugar intake in South Africa: findings from the adult prospective urban and rural epidemiology cohort study. Am J Clin Nutr. (2014) 99:1479–86. doi: 10.3945/ajcn.113.069005
4. Nielsen SJ, Popkin BM. Changes in beverage intake between 1977 and 2001. Am J Prev Med. (2004) 27:205–10. doi: 10.1016/j.amepre.2004.05.005
5. Zhang N, Morin C, Guelinckx I, Moreno LA, Kavouras SA, Gandy J, et al. Fluid Intake in Urban China: results of the 2016 Liq. In 7 national cross-sectional surveys. Eur J Nutr. (2018) 57:77–88. doi: 10.1007/s00394-018-1755-5
6. Greenhalgh S. Soda industry influence on obesity science and policy in China. J Public Health Pol. (2019) 40:5–16. doi: 10.1057/s41271-018-00158-x
7. Gulati S, Misra A. Sugar intake, obesity, and diabetes in India. Nutrients. (2014) 6:5955–74. doi: 10.3390/nu6125955
8. Popkin BM. Patterns of beverage use across the lifecycle. Physiol Behav. (2010) 100:4–9. doi: 10.1016/j.physbeh.2009.12.022
9. Naderer B, Matthes J, Spielvogel I. How brands appear in children's Movies. A Systematic Content Analysis of the Past 25 Years. Int J Advert. (2019) 38:237–57. doi: 10.1080/02650487.2017.1410000
10. Malik VS, Schulze MB, Hu FB. Intake of sugar-sweetened beverages and weight gain: a systematic review. Am J Clin Nutr. (2006) 84:274–88. doi: 10.1093/ajcn/84.2.274
11. Malik VS, Popkin BM, Bray GA, Després J-P, Hu FB. Sugar-sweetened beverages, obesity, type 2 diabetes mellitus, and cardiovascular disease risk. Circulation. (2010) 121:1356–64. doi: 10.1161/CIRCULATIONAHA.109.876185
12. Malik VS, Popkin BM, Bray GA, Després J-P, Willett WC, Hu FB. Sugar-sweetened beverages and risk of metabolic syndrome and type 2 diabetes: a meta-analysis. Diabetes Care. (2010) 33:2477–83. doi: 10.2337/dc10-1079
13. Hauner H, Bechthold A, Boeing H, Brönstrup A, Buyken A, Leschik-Bonnet E, et al. Evidence-based guideline of the German nutrition society: carbohydrate intake and prevention of nutrition-related diseases. Ann Nutr Metab. (2012) 60:1–58. doi: 10.1159/000335326
14. Nishida C, Uauy R, Kumanyika S, Shetty P. The joint who/Fao expert consultation on diet, nutrition and the prevention of chronic diseases: process, product and policy implications. Public Health Nutr. (2004) 7:245–50. Epub 2007/01/02. doi: 10.1079/PHN2003592
15. Raben A, Vasilaras TH, Møller AC, Astrup A. Sucrose compared with artificial sweeteners: different effects on ad libitum food intake and body weight after 10 week of supplementation in overweight subjects. Am J Clin Nutr. (2002) 76:721–9. doi: 10.1093/ajcn/76.4.721
16. Malik VS, Hu FB. The role of sugar-sweetened beverages in the global epidemics of obesity and chronic diseases. Nat Rev Endocrinol. (2022) 18:205–18. doi: 10.1038/s41574-021-00627-6
17. El-Malky AM, Naik RG, Elnouman AA. Sugary beverages consumption and latent autoimmune diabetes in adults: systematic review and meta-analysis. Clin Diabetol. (2020) 9:118–27. doi: 10.5603/DK.2020.0007
18. Janssens JP, Shapira N, Debeuf P, Michiels L, Putman R, Bruckers L, et al. Effects of soft drink and table beer consumption on insulin response in normal teenagers and carbohydrate drink in youngsters. Eur J Cancer Prev. (1999) 8:289–95. doi: 10.1097/00008469-199908000-00004
19. Schulze MB, Liu S, Rimm EB, Manson JE, Willett WC, Hu FB. Glycemic index, glycemic load, and dietary fiber intake and incidence of type 2 diabetes in younger and middle-aged women. Am J Clin Nutr. (2004) 80:348–56. doi: 10.1093/ajcn/80.2.348
20. Neelakantan N, Park SH, Chen G-C, van Dam RM. Sugar-sweetened beverage consumption, weight gain, and risk of type 2 diabetes and cardiovascular diseases in Asia: a systematic review. Nutr Rev. (2021) 80:50–67. doi: 10.1093/nutrit/nuab010
21. Liu S, Manson JE, Buring JE, Stampfer MJ, Willett WC, Ridker PM. Relation between a diet with a high glycemic load and plasma concentrations of high-sensitivity c-reactive protein in middle-aged women. Am J Clin Nutr. (2002) 75:492–8. doi: 10.1093/ajcn/75.3.492
22. Huang C, Huang J, Tian Y, Yang X, Gu D. Sugar sweetened beverages consumption and risk of coronary heart disease: a meta-analysis of prospective studies. Atherosclerosis. (2014) 234:11–6. doi: 10.1016/j.atherosclerosis.2014.01.037
23. Fung TT, Malik V, Rexrode KM, Manson JE, Willett WC, Hu FB. Sweetened beverage consumption and risk of coronary heart disease in women. Am J Clin Nutr. (2009) 89:1037–42. doi: 10.3945/ajcn.2008.27140
24. Yin J, Zhu Y, Malik V, Li X, Peng X, Zhang FF, et al. Intake of sugar-sweetened and low-calorie sweetened beverages and risk of cardiovascular disease: a meta-analysis and systematic review. Adv Nutr. (2020) 12:89–101. doi: 10.1093/advances/nmaa084
25. Marcenes W, Kassebaum NJ, Bernabé E, Flaxman A, Naghavi M, Lopez A, et al. Global burden of oral conditions in 1990–2010: a systematic analysis. J Dent Res. (2013) 92:592–7. doi: 10.1177/0022034513490168
26. Petersen PE. The world oral health report 2003: continuous improvement of oral health in the 21st century—the approach of the who global oral health programme. Commun Dent Oral. (2003) 31 Suppl 1:3–23.
27. Moynihan P. “The role of diet in the prevention of dental diseases”. In:Limeback H, , editor. Comprehensive Preventive Dentistry. Amsterdam: John Wiley & Sons (2012). p. 99–114. doi: 10.1002/9781118703762.ch6
28. Petersen PE, Bourgeois D, Ogawa H, Estupinan-Day S, Ndiaye C. the global burden of oral diseases and risks to oral health. B World Health Organ. (2005) 83:661–9.
29. Almiron-Roig E, Palla L, Guest K, Ricchiuti C, Vint N, Jebb SA, et al. Factors that determine energy compensation: a systematic review of preload studies. Nutr Rev. (2013) 71:458–73. doi: 10.1111/nure.12048
30. DeSalvo KB, Olson R, Casavale KO. Dietary guidelines for Americans. JAMA. (2016) 315:457–8. doi: 10.1001/jama.2015.18396
31. Mattes RD. Dietary compensation by humans or supplemental energy provided as ethanol or carbohydrate in fluids. Physiol Behav. (1996) 59:179–87. doi: 10.1016/0031-9384(95)02007-1
32. Pundziute-Lyckå A., Persson L-Ak, Cedermark G, Jansson-Roth A, Nilsson U, Westin V, et al. Diet, growth, and the risk for type 1 diabetes in childhood: a matched case-referent study. Diabetes Care. (2004) 27:2784–9. doi: 10.2337/diacare.27.12.2784
33. Mullie P, Deliens T, Clarys P. Relation between sugar-sweetened beverage consumption, nutrition, and lifestyle in a military population. Mil Med. (2016) 181:1335–9. doi: 10.7205/MILMED-D-15-00453
34. Yoshino F, Yoshida A, Umigai N, Kubo K, Lee M-C-I. Crocetin reduces the oxidative stress induced reactive oxygen species in the stroke-prone spontaneously hypertensive rats (Shrsps) brain. J Clin Biochem Nutr. (2011) 49:182–7. doi: 10.3164/jcbn.11-01
35. Bonnefont-Rousselot D. Glucose and reactive oxygen species. Curr Opin Clin Nutr. (2002) 5:561–8. doi: 10.1097/00075197-200209000-00016
36. Prasad K, Dhar I. Oxidative stress as a mechanism of added sugar-induced cardiovascular disease. Int J Angiol. (2014) 23:217–26. doi: 10.1055/s-0034-1387169
37. Ahn H, Park YK. Sugar-sweetened beverage consumption and bone health: a systematic review and meta-analysis. Nutr J. (2021) 20:41. doi: 10.1186/s12937-021-00698-1
38. Wyshak G. Teenaged girls, carbonated beverage consumption, and bone fractures. Arch Pediat Adol Med. (2000) 154:610–3. doi: 10.1001/archpedi.154.6.610
39. Whiting SJ, Healey A, Psiuk S, Mirwald R, Kowalski K, Bailey DA. Relationship between carbonated and other low nutrient dense beverages and bone mineral content of adolescents. Nutr Res. (2001) 21:1107–15. doi: 10.1016/S0271-5317(01)00324-4
40. Greene GW, White AA, Hoerr SL, Lohse B, Schembre SM, Riebe D, et al. Impact of an online healthful eating and physical activity program for college students. Am J Health Promot. (2012) 27:e47–58. doi: 10.4278/ajhp.110606-QUAN-239
41. Nelson MC, Story M, Larson NI, Neumark-Sztainer D, Lytle LA. Emerging adulthood and college-aged youth: an overlooked age for weight-related behavior change. Obesity. (2008) 16:2205–11. doi: 10.1038/oby.2008.365
42. Frehlich LC, Eller LK, Parnell JA, Fung TS, Reimer RA. Dietary intake and associated body weight in canadian undergraduate students enrolled in nutrition education. Ecol Food Nutr. (2017) 56:205–17. doi: 10.1080/03670244.2017.1284066
43. Nelson MC, Kocos R, Lytle LA, Perry CL. Understanding the perceived determinants of weight-related behaviors in late adolescence: a qualitative analysis among college youth. J Nutr Educ Behav. (2009) 41:287–92. doi: 10.1016/j.jneb.2008.05.005
44. Annala M, Vinnari M. Content analysis of Tv food advertising using climate impact and a nutritional impact index. Ecol Econ. (2019) 159:68–74. doi: 10.1016/j.ecolecon.2019.01.017
45. Coates AE, Hardman CA, Halford JC, Christiansen P, Boyland EJ. Food and beverage cues featured in Youtube videos of social media influencers popular with children: an exploratory study. Front Psychol. (2019) 10:2142. doi: 10.3389/fpsyg.2019.02142
46. Vilaro MJ, Barnett TE, Watson AM, Merten JW, Mathews AE. Weekday and weekend food advertising varies on children's television in the usa but persuasive techniques and unhealthy items still dominate. Public Health. (2017) 142:22–30. doi: 10.1016/j.puhe.2016.10.011
47. Bandura A. Social cognitive theory of mass communication. Media Psychol. (2001) 3:265–99. doi: 10.1207/S1532785XMEP0303_03
48. Birch LL, Fisher JO. Development of eating behaviors among children and adolescents. Pediatrics. (1998) 101:539–49. doi: 10.1542/peds.101.S2.539
49. Zhang X, Li S, Zhang H. Media and information literacy of university students in china: status quo, issues, and improvement. J Am Inf Sci Tec. (2018) 2:83–92.
50. Primack BA, Sidani J, Carroll MV, Fine MJ. Associations between smoking and media literacy in college students. J Health Commun. (2009) 14:541–55. doi: 10.1080/10810730903089598
51. Primack BA, Hobbs R. Association of various components of media literacy and adolescent smoking. Am J Health Behav. (2009) 33:192–201. doi: 10.5993/AJHB.33.2.8
52. Chen Y, Porter KJ, Estabrooks PA, Zoellner J. Development and evaluation of the sugar-sweetened beverages media literacy (Ssb-Ml) scale and its relationship with SSB consumption. Health Commun. (2017) 32:1310–7. doi: 10.1080/10410236.2016.1220041
53. Demir D, Bektas M, Demir S, Bektas I. Psychometric properties of the Turkish version of the sugar-sweetened beverages media literacy scale for university students. Curr Psychol. (2021) 40:2561–9. doi: 10.1007/s12144-019-00325-7
55. Hu L-t, Bentler PM, Kano Y. Can test statistics in covariance structure analysis be trusted? Psychol Bull. (1992) 112:351. doi: 10.1037/0033-2909.112.2.351
56. Raykov T, Marcoulides GA. A First Course in Structural Equation Modeling. New York, NY: Routledge (2000).
57. Comrey AL, Lee HB. A First Course in Factor Analysis. London: Psychology press (2013). doi: 10.4324/9781315827506
58. Norman CD, Skinner HA. Ehealth literacy: essential skills for consumer health in a networked world. J Med Internet Res. (2006) 8:e506. doi: 10.2196/jmir.8.2.e9
59. Jun-Shuai G, Xiao-Peng Y, Yu-Ying S, Dan N, Xue-Min L, Lu W. Adaptation and evaluation of chinese version of eheals and its usage among senior high school students. Ch J Health Educ. (2013) 29:106–8. doi: 10.16168/j.cnki.issn.1002-9982.2013.02.019
60. van de Schoot R, Lugtig P, Hox J, A checklist for testing measurement invariance. Eur J Dev Psychol. (2012) 9:486–92. doi: 10.1080/17405629.2012.686740
61. Yu C-Y. Evaluating Cutoff Criteria of Model Fit Indices for Latent Variable Models with Binary and Continuous Outcomes. Los Angeles, CA: University of California (2002).
62. Zhou B-F. Cooperative meta-analysis group of the working group on obesity in C. predictive values of body mass index and waist circumference for risk factors of certain related diseases in Chinese adults—study on optimal cut-off points of body mass index and waist circumference in Chinese Adults. Biomed Environ Sci. (2002) 15:83–96. doi: 10.1046/j.1440-6047.11.s8.9.x
63. Lynn MR. Determination and quantification of content validity. Nurs Res. (1986) 35:382–6. doi: 10.1097/00006199-198611000-00017
64. Polit DF, Beck CT, Owen SV. Is the cvi an acceptable indicator of content validity? Appraisal and recommendations. Res Nurs Health. (2007) 30:459–67. doi: 10.1002/nur.20199
65. Tabachnick BG, Fidell LS, Ullman JB. Using Multivariate Statistics, 5th edn. Boston, MA: Pearson (2007).
66. Bentler PM, Bonett DG. Significance tests and goodness of fit in the analysis of covariance structures. Psychol Bull. (1980) 88:588–606. doi: 10.1037/0033-2909.88.3.588
67. Brown TA. Confirmatory factor analysis for applied research. New York, NY: Guilford publications (2015).
68. Browne MW, Cudeck R. single sample cross-validation indices for covariance structures. Multivar Behav Res. (1989) 24:445–55. doi: 10.1207/s15327906mbr2404_4
69. Hu Lt, Bentler PM. Cutoff criteria for fit indexes in covariance structure analysis: conventional criteria vs. new alternatives. Struct Equ Model. (1999) 6:1–55. doi: 10.1080/10705519909540118
70. Hu L-t, Bentler PM. Fit indices in covariance structure modeling: sensitivity to underparameterized model misspecification. Psychol Methods. (1998) 3:424. doi: 10.1037/1082-989X.3.4.424
71. Fornell C, Larcker DF. Evaluating structural equation models with unobservable variables and measurement error. J Marketing Res. (1981) 18:39–50. doi: 10.1177/002224378101800104
72. Kes D, Aydin Yildirim T. The relation between levels of media literacy and attitudes and beliefs concerning obesity in university students. Soc Work Public Health. (2020) 35:645–54. doi: 10.1080/19371918.2020.1810192
73. Levin-Zamir D, Lemish D, Gofin R. Media health literacy (Mhl): development and measurement of the concept among adolescents. Health Educ Res. (2011) 26:323–35. doi: 10.1093/her/cyr007
74. Irving LM, Berel SR. Comparison of media-literacy programs to strengthen college women's resistance to media images. Psychol Women Q. (2001) 25:103–11. doi: 10.1111/1471-6402.00012
75. Hooper D, Coughlan J, Mullen MR. Structural equation modelling: guidelines for determining model fit. Electron J Bus Res Methods. [Internet]. (2008) 6:53–60. Available online at: https://academic-publishing.org/index.php/ejbrm/article/view/1224/1187
Keywords: sugar-sweetened beverages, sugar-sweetened beverages media literacy, undergraduates, psychometric properties, validation
Citation: Long C and Yoon MS (2022) Psychometric properties of the Chinese version of the sugar-sweetened beverages media literacy scale for undergraduates. Front. Public Health 10:1009838. doi: 10.3389/fpubh.2022.1009838
Received: 02 August 2022; Accepted: 27 September 2022;
Published: 14 October 2022.
Edited by:
Harshad Thakur, Tata Institute of Social Sciences, IndiaReviewed by:
Paul Vicuña Serrano, Federal University of Rio Grande Do Sul, BrazilZhihao Yang, Erasmus Medical Center, Netherlands
Copyright © 2022 Long and Yoon. This is an open-access article distributed under the terms of the Creative Commons Attribution License (CC BY). The use, distribution or reproduction in other forums is permitted, provided the original author(s) and the copyright owner(s) are credited and that the original publication in this journal is cited, in accordance with accepted academic practice. No use, distribution or reproduction is permitted which does not comply with these terms.
*Correspondence: Myeong Sook Yoon, eW9vbjY0QGpibnUuYWMua3I=