 Cristin D. W. Kaspar
 Juan Lu
- 1Children's Hospital of Richmond, Virginia Commonwealth University, Richmond, VA, United States
- 2Division of Epidemiology, Department of Family Medicine and Population Health, Virginia Commonwealth University, Richmond, VA, United States
Importance: High uric acid (UA) is hypothesized to worsen kidney and cardiovascular disease morbidity via activation of systemic inflammation. Clinical trials of UA modification report reduction of the inflammatory marker high sensitivity C-reactive protein (hs-CRP) as an outcome measure, but studies have not demonstrated that hyperuricemia independently increases hs-CRP when adjusted for important confounders such as body mass index (BMI), sex, and age.
Objective: To identify clinical risk factors for elevated hs-CRP, including but not limited to hyperuricemia, through a cross-sectional analysis of the National Health and Nutrition Examination Survey (NHANES) 2015–2018.
Results: In the final multivariate logistic regression model, the exposure with the strongest effect on the odds of elevated hs-CRP was BMI in the fourth quartile, OR = 13.1 (95% CI 6.25–27.42), followed by female sex (OR = 4.9, 95% CI 2.92–8.34), hyperuricemia (OR = 2.2, 95% CI 1.36–3.45), urine albumin creatinine ratio (ACR; OR = 1.5, 95% CI 1.09–2.18), poor overall health (OR = 1.4, 95% CI 1.18–1.58), and interactions between hyperuricemia and sex (OR = 1.4, 95% CI 1.05–1.83), and between BMI and sex (OR = 1.2, 95% CI 1.03–1.47). Notably, chronic kidney disease (CKD) and CKD surrogates were not associated with hs-CRP despite urine ACR maintaining a significant independent effect.
Conclusions: In this national population-based study, we demonstrated that hyperuricemia significantly increases the odds of elevated hs-CRP, independent from BMI, female sex, urine ACR, and overall health status. Further study is recommended to better understand the sex difference in this association and the role of albuminuria, but not CKD, in systemic inflammation.
Introduction
Recent epidemiologic studies have found that elevated serum uric acid (UA), or hyperuricemia, is independently associated with hypertension, acute kidney injury, and both accelerated decline and increased mortality of patients with chronic kidney disease (CKD) (1–4). One mechanism by which hyperuricemia is proposed to contribute to morbidity and mortality is through direct activation of inflammation. This proinflammatory response occurs below the historically-accepted definition of hyperuricemia, which is a sex-specific serum UA level i.e., associated with clinical gout disease and around the point of supersaturation of UA in serum >7 mg/dl (5–9). Both soluble and crystalline UA activate the Nod-like receptor proteinase 3 (Nlrp3) inflammasome, which triggers the systemic release of proinflammatory cytokines interleukin (IL)-1β, IL-18, and IL-6 (10–16). Indeed, recent studies have shown deleterious effects of UA utilizing a lower definition of hyperuricemia, UA ≥5.5 mg/dl (1, 17–19). The measurement of inflammation in vitro using interleukin and cytokine levels, while highly specific, is limited in the clinical setting due to the expense and availability of specific assays (20, 21). The high sensitivity C-reactive protein (hs-CRP), on the other hand, is an acute phase protein and considered a “downstream” inflammatory molecule released by the liver in response to IL-6 when activated by the Nlrp3 inflammasome and other inflammatory states. Hs-CRP is an inexpensive FDA-approved test and is widely applied in clinical settings as a marker of generalized increased inflammation. As such, it has been applied increasingly in research settings as a surrogate marker of inflammation including in UA reduction clinical trials (19, 22–27). However, no study to our knowledge has associated high UA independently with high hs-CRP. This is a necessary step to demonstrate whether hs-CRP is an appropriate outcome measure in UA reduction trials.
The National Health and Nutrition Examination Survey (NHANES) is an annual survey of the United States population that uniquely combines both survey questionnaires with laboratory and physical exam results. Beginning in 2015, the survey added hs-CRP measurements to the panel of laboratory tests. We, therefore, designed this study of a nationally representative pediatric and adult aged cross-sectional sample of the United States population using NHANES 2015–18 data to identify clinical risk factors for elevated hs-CRP, including but not limited to hyperuricemia [as defined by a serum UA ≥5.5 mg/dl (1, 4)].
Methods
The National Health and Nutrition Examination Survey utilizes a complex random sampling method to survey about 5,000 Americans per year in a nationally representative and weighted sample. The demographic, physical examination, current health, and kidney health questionnaires, and laboratory result datasets from the 2015–16 and 2017–18 public use files were merged for this analysis, maintaining four-year sampling and survey weight to correct for variance estimation. The first year that included hs-CRP was 2015, and 2017–18 is the most recently released dataset. Variables of interest were those with plausible or hypothetical association with elevated inflammation, such as body mass index (BMI), race/ethnicity, biological sex, self-report of overall health status, CKD by estimated glomerular filtration rate (eGFR), personal history of dialysis or personal history of being told the participant had “weak/failing kidneys” in the prior 12 months, urine albumin to creatinine ratio (urine ACR), and UA. To conduct the investigation, several variables were recoded as detailed in the following ways.
Serum UA was categorized into normal (serum UA <5.5 mg/dl) and elevated (≥5.5 mg/dl) based on previously reported definitions of hyperuricemia (4, 18). Categories of UA low (<2.5 mg/dl), normal (2.5–5.5 mg/dl), high (5.6–7.9 mg/dl), and very high (>8 mg/dl) were used in a chi-square test for trend analysis between UA and hs-CRP. The definition of normal or elevated hs-CRP was referred from the specific chemical analyzer used by the NHANES central laboratory.
The continuous age variable was categorized into five subgroups utilizing the United Nations recommended classification for use in health services and nutrition data (28): youth (<14 years), young adulthood (15–24 years), middle adulthood (25–44 years), older adulthood (45–64 years), and elderly/retirement (≥65 years). Elevated BMI is associated with high UA levels (1) and was included in this analysis as a potential confounder. While the 2015–16 NHANES dataset included a BMI percentile variable that allowed for BMI categorization (underweight, normal, overweight, obese) using recommended age- and gender-specific definitions by the Centers for Disease Control, this variable was not included in the 2017–18 dataset. Therefore, in order to utilize all BMI data in this analysis, we transformed the normally distributed pediatric (age <20 years) and adult (age ≥20 years) data into age group-specific quartiles (1st = 0–24, 2nd = 25–49, 3rd = 50–74, 4th = 75–100th percentiles).
Participants with CKD were defined according to the Kidney Disease Improving Global Outcomes classification as eGFR <60 ml/min/1.73 m2 using the appropriate pediatric-modified Schwartz (29) or adult CKD-EPI equations (30). The NHANES datasets also include results of an untimed single spot urine Albumin to creatinine ratio (urine ACR) value, with normal defined as urine ACR <100 and ≥100 mg/g considered abnormally elevated in this analysis. NHANES participants were also asked to self-report on their overall health status, and this variable was used as a surrogate for potential inflammation generating chronic medical conditions. Those participants who self-reported to be in good, very good, or excellent overall health were recategorized as “good health” and those with poor or worse self-reports to be in “poor health.”
Statistical Analysis
Categorical variables were summarized by observed and weighted frequencies and weighted proportions with corresponding 95% confidence intervals (CI). Crude odds ratios (OR) and 95% CI were calculated for variables of interest associated with the outcome of interest, elevated hs-CRP. A chi-square test for trend analysis was performed on increasing UA strata and elevated hs-CRP. A univariate logistic regression was used to determine if each variable of interest was associated with elevated hs-CRP and accepted into an initial multivariate model if p < 0.05. The remaining variables were then entered in a multivariate logistic regression model, and backward selection was used with a criterion to exit the model of p > 0.1. The likelihood ratio and score and the Wald tests were used to determine the overall goodness of fit of the model, p < 0.05, and if there was a gross lack of fit, then the variables would be transformed. Variables were checked for interaction and interaction terms included in the final model if p < 0.05. AIC of different models was compared for final model selection. The adjusted OR and 95% CI of the final multivariate logistic regression model are reported. SAS v.9.4 was used for all statistical analyses.
Results
The merged 2015 through 2018 datasets include data from 19,225 unique observations. The weighted population mean of hs-CRP was 3.43 (SD = 0.1) and followed a parametric distribution. The weighted population serum UA mean of the hyperuricemic group was μ = 6.61 (SD = 0.02) vs. μ = 4.35 (SD = 0.02) of the normal UA group. A linear relationship existed between the continuous variables of serum UA and hs-CRP, but with minimal correlation (R2 = 0.008, p < 0.001). A test for trend between UA and hs-CRP is shown in Table 1 with a significant positive relationship between increasing strata of UA and odds of elevated hs-CRP (X2 = 995.81440, p < 0.0001).
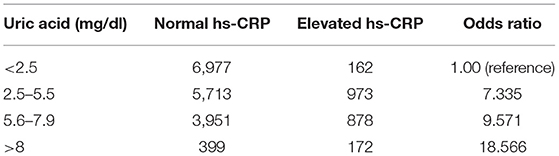
Table 1. Odds ratio test for trend, uric acid, and elevated hs-CRP.
The weighted population eGFR mean of the CKD group was μ = 48.80 (SD = 0.64) vs. μ = 87.09 (SD = 0.52) of the non-CKD group. Table 2 includes the summary statistics of several demographic and clinical characteristics of the study population. The observed, weighted frequencies, and weighted proportions with 95% CI are reported for each variable of interest.
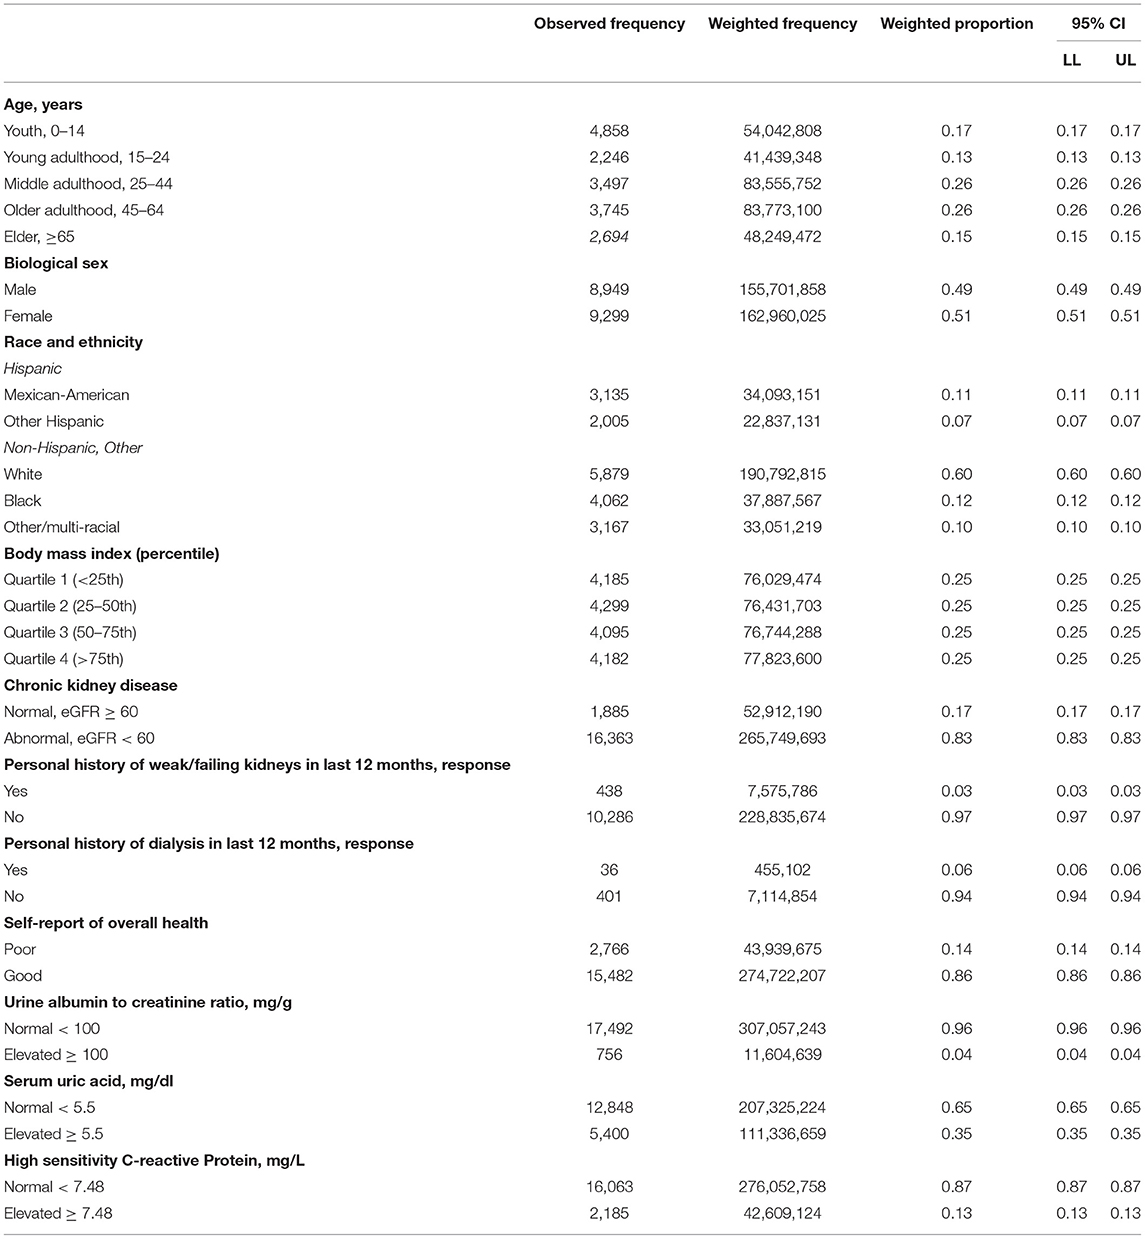
Table 2. Summary statistics.
In Table 3, the crude OR and 95% CI are reported for each variable of interest by the outcome of elevated hs-CRP. The variables “personal history of dialysis in the prior 12 months,” of respondents 20 years and older, and race/ethnicity were not significantly associated with elevated hs-CRP in the crude analysis. CKD, broadly categorized by eGFR <60, age, and personal history of weak/failing kidneys, did not meet the criteria to remain in the multivariate model. Age and race/ethnicity were kept in the multivariate model a priori per standard practice. Hyperuricemia, elevated BMI (second to fourth quartiles), female sex, abnormal albuminuria, and overall self-report of poor health significantly increased the odds of having elevated hs-CRP in the univariate analysis.
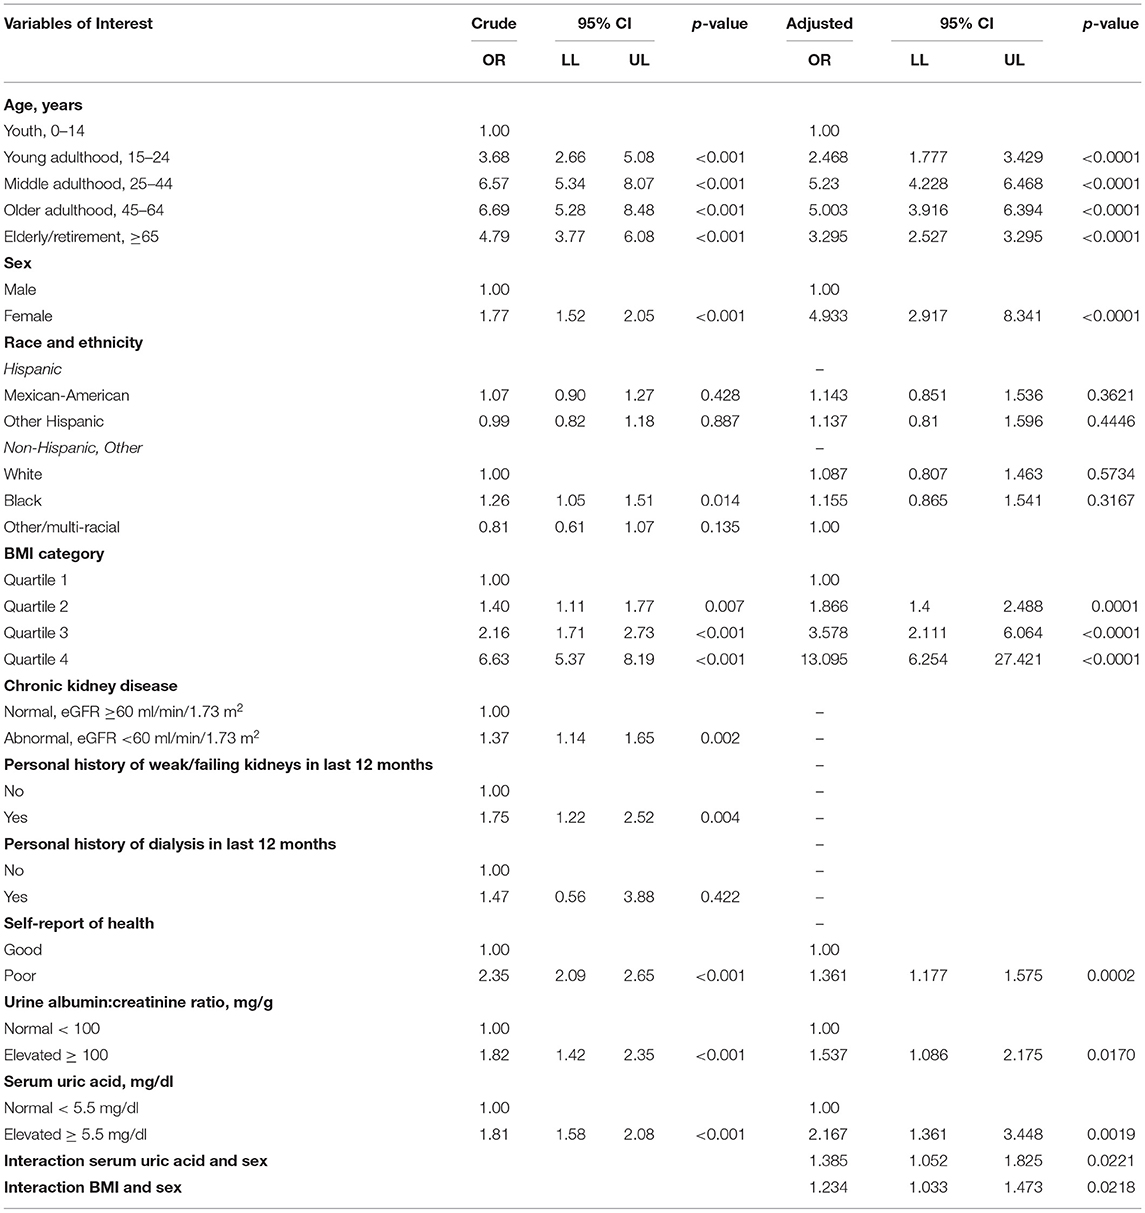
Table 3. Crude and adjusted odds ratio, outcome elevated hs-CRP.
Interactions between UA and urine ACR, sex, BMI, self-report of overall health, and age were checked. Only the interaction between UA and sex, and BMI and sex were statistically significant (p < 0.001), and therefore, both were included in the final multivariate model. The final adjusted ORs and 95% CIs are reported in Table 3. All quartiles of BMI above the referenced first quartile significantly increased the odds of elevated hs-CRP, the fourth quartile having the largest effect at 13.1 (CI 6.25–27.42). Female sex increased the odds of elevated hs-CRP by 4.9 (CI 2.92–8.34), and hyperuricemia by 2.2 (CI 1.36–3.45). Interestingly self-report of poor overall health increased odds of hs-CRP by 1.4 (CI 1.18–1.58), and abnormal urine ACR by 1.5 (CI 1.09–2.18).
Discussion
To our knowledge, this is the first analysis of the association between hs-CRP and hyperuricemia that utilizes a large nationally representative sample of pediatric and adult participants. After adjustment for multiple variables, we found that race/ethnicity was not associated with the outcome. The most significant effect on the odds of elevated hs-CRP was from having a fourth quartile BMI where the odds are 13 times as large as the first quartile BMI. BMI quartiles also held a dose-dependent effect, with the odds of elevated hs-CRP increasing for each level of BMI above the first quartile. This finding is consistent with other studies where obesity is related to markers of increased systemic inflammation (31, 32). Female sex over male sex had the next greatest effect on the odds of elevated hs-CRP, with nearly five times greater odds. A gender difference has been noted by several studies related to poorer outcomes of disease morbidity and mortality, and higher expression of inflammation among women (33–35). The effect of female sex-UA interaction was also demonstrated in one study of adult chronic heart failure patients (36). Hyperuricemia was found to independently increase 5-year all-cause mortality in adults with chronic heart failure only in women and not met. Age held a reverse “U” shaped curve with increased odds overall above pediatric age groups for elevated hs-CRP in the middle age subgroups and lessened odds in the elderly.
Interestingly, CKD, represented in this analysis in multiple ways by eGFR <60, a personal history of weak/failing kidneys, or personal history of dialysis in the last 12 months, was not found to be significant in the adjusted analysis. In the NHANES dataset, the number of positive self-reports for weak/failing kidneys or personal history of dialysis was low, which may have been a limiting factor in this analysis. In contrast, abnormal albuminuria, a condition that develops in some types of CKD, remained significant in the multivariate model, and increased the probability of elevated hs-CRP by 54%. One study found both abnormal urine ACR and CKD (defined similarly to the study analysis) to be associated with biomarkers of inflammation but utilized a smaller and adult-only population (N = 3,294) from the Framingham Offspring Cohort (37). Proteinuria is a known accelerator of CKD progression via induction of renal tubular inflammatory cell infiltration and fibrogenesis (38, 39). This analysis seems to indicate that proteinuria increases systemic inflammation, but that CKD does not. This difference and the mechanism by which this occurs should be investigated in future studies.
Finally, hyperuricemia, as defined by a serum UA ≥5.5 mg/dl, increased the odds of elevated hs-CRP by 2.17. We expected to find an interaction between BMI and UA; however, the p-value for this interaction term was not statistically significant (p < 0.05) despite multiple studies suggesting such a relationship (40–42). A possible explanation is that while a diet that leads to UA overproduction such as with high consumption of purines and fructose-containing foods may result in hyperuricemia and an elevated BMI, one may also develop hyperuricemia from renal underexcretion of UA. Renal underexcretion of UA may be secondary to renal dysfunction or genetic polymorphisms in UA transporter proteins (6), causing hyperuricemia independent of BMI. Our uniquely large study population allowed identifying these independent effects, compared with other studies that had smaller and less diverse patient populations, subject to more bias or confounding.
Conclusions
Using national population-based data, this study demonstrated that hyperuricemia is significantly associated with increased odds of elevated hs-CRP in a dose-dependent manner, but that the greatest effect came from the fourth quartile BMI, female sex, and age, which was consistent with previous studies. Further studies are recommended to better understand the sex difference in this association, the role of albuminuria, but not CKD, in elevated hs-CRP, as well as to further validate the utility of hs-CRP as an outcome measure in UA modification trials.
Data Availability Statement
The raw data supporting the conclusions of this article will be made available by the authors, without undue reservation.
Author Contributions
Material preparation, data processing, and analysis were carried out by CK. The first draft of the manuscript was written by CK. All authors commented on the previous versions of the manuscript, contributed to the conception and design of the study, and read and approved the final manuscript.
Conflict of Interest
The authors declare that the research was conducted in the absence of any commercial or financial relationships that could be construed as a potential conflict of interest.
Publisher's Note
All claims expressed in this article are solely those of the authors and do not necessarily represent those of their affiliated organizations, or those of the publisher, the editors and the reviewers. Any product that may be evaluated in this article, or claim that may be made by its manufacturer, is not guaranteed or endorsed by the publisher.
References
1. Shatat IF, Abdallah RT, Sas DJ, Hailpern SM. Serum uric acid in US adolescents: distribution and relationship to demographic characteristics and cardiovascular risk factors. Pediatr Res. (2012) 72:95–100. doi: 10.1038/pr.2012.47
2. Culleton BF, Larson MG, Kannel WB, Levy D. Serum uric acid and risk for cardiovascular disease and death: the Framingham heart study. Ann Intern Med. (1999) 131:7–13. doi: 10.7326/0003-4819-131-1-199907060-00003
3. Hayden MR, Tyagi SC. Uric acid: a new look at an old risk marker for cardiovascular disease, metabolic syndrome, and type 2 diabetes mellitus: the urate redox shuttle. Nutr Metab. (2004) 1:10. doi: 10.1186/1743-7075-1-10
4. Loeffler LF, Navas-Acien A, Brady TM, Miller ER III, Fadrowski JJ. Uric acid level and elevated blood pressure in us adolescents. Hypertension. (2012) 59:811–7. doi: 10.1161/HYPERTENSIONAHA.111.183244
5. Johnson RJ, Bakris GL, Borghi C, Chonchol MB, Feldman D, Lanaspa MA, et al. Hyperuricemia, acute, and chronic kidney disease, hypertension, and cardiovascular disease: report of a scientific workshop organized by the National Kidney Foundation. J Kidney Dis. (2018) 71:851–65. doi: 10.1053/j.ajkd.2017.12.009
6. Mandal AK, Mount DB. The molecular physiology of uric acid homeostasis. Annu Rev Physiol. (2015) 77:323–45. doi: 10.1146/annurev-physiol-021113-170343
7. Sautin YY, Johnson RJ. Uric acid: the oxidant-antioxidant paradox.nucleosides, nucleotides and nucleic acids. (2008) 27:608–19. doi: 10.1080/15257770802138558
8. Sanchez-Lozada LG, Tapia E, Santamaria J, Avila-Casado C, Soto V, Nepomuceno T, et al. Mild hyperuricemia induces vasoconstriction and maintains glomerular hypertension in normal and remnant kidney rats. Kidney Int. (2005) 67:237–47. doi: 10.1111/j.1523-1755.2005.00074.x
9. Maahs DM, Caramori L, Cherney DZI, Galecki AT, Gao C, Jalal D, et al. Uric acid lowering to prevent kidney function loss in diabetes: the Preventing Early Renal Function Loss (PERL) allopurinol study. Curr Diab Rep. (2013) 13:550–9. doi: 10.1007/s11892-013-0381-0
10. Conley SM, Abais JM, Boini KM, Li P-L. Inflammasome activation in chronic glomerular diseases. Curr Drug Targets. (2017) 18:1019–29. doi: 10.2174/1389450117666160817103435
11. Wang W, Wang X, Chun J, Vilaysane A, Clark S, French G, et al. Inflammasome-independent NLRP3 augments TGF-β signaling in kidney epithelium. J Immunol. (2013) 190:1239–49. doi: 10.4049/jimmunol.1201959
12. matias ml, romão m, weel ic, ribeiro vr, nunes pr, borges vt, et al. endogenous and uric acid-induced activation of NLRP3 inflammasome in pregnant women with preeclampsia. PLoS ONE. (2015) 10:e0129095. doi: 10.1371/journal.pone.0129095
13. Vilaysane, Chun J, Seamone ME, Wang W, Chin R, Hirota S, et al. The NLRP3 inflammasome promotes renal inflammation and contributes to CKD. Am Soc Nephrol. (2010) 21:1732–44. doi: 10.1681/ASN.2010020143
14. Braga TT, Forni MF, Correa-Costa M, Ramos RN, Barbuto JA, Branco P, et al. Soluble uric acid activates the NLRP3 inflammasome. Sci Rep. (2017) 7:39884. doi: 10.1038/srep39884
15. McDermott MF, Kingsbury SR, Conaghan PG. The role of the NLRP3 inflammasome in gout. J Inflamm Res. (2011) 4:39. doi: 10.2147/JIR.S11330
16. Martinon F, Pétrilli V, Mayor A, Tardivel A, Tschopp J. Gout-associated uric acid crystals activate the NALP3 inflammasome. Nature. (2006) 440:237–241. doi: 10.1038/nature04516
17. Kaspar CDW, Beach I, Newlin J, Sisler I, Feig D, Smith W. Hyperuricemia is associated with a lower glomerular filtration rate in pediatric sickle cell disease patients. Pediatr Nephrol. (2020) 35:883–9. doi: 10.1007/s00467-019-04432-2
18. Feig DI, Soletsky B, Johnson RJ. Effect of allopurinol on blood pressure of adolescents with newly diagnosed essential hypertension. JAMA. (2008) 300:924. doi: 10.1001/jama.300.8.924
19. Ghane Sharbaf F, Assadi F. Effect of allopurinol on the glomerular filtration rate of children with chronic kidney disease. Pediatr Nephrol. (2018) 33:1405–9. doi: 10.1007/s00467-018-3943-1
20. Hilden J, Gerds TA. A note on the evaluation of novel biomarkers: do not rely on integrated discrimination improvement and net reclassification index. Stat Med. (2014) 33:3405–14. doi: 10.1002/sim.5804
21. Rota M, Antolini L, Valsecchi MG. Optimal cut-point definition in biomarkers: the case of censored failure time outcome. BMC Med Res Methodol. (2015) 15:24. doi: 10.1186/s12874-015-0009-y
22. Toldo S, Abbate A. The NLRP3 inflammasome in acute myocardial infarction. Nat Rev Cardiol. (2018) 15:203–14. doi: 10.1038/nrcardio.2017.161
23. Van Tassell BW, Toldo S, Mezzaroma E, Abbate A. Targeting interleukin-1 in heart disease. Circulation. (2013) 130:e63. doi: 10.1161/CIRCULATIONAHA.114.010274
24. Ikonomidis, Michalakeas CA, Parissis J, Paraskevaidis I, Ntai K, Papadakis I, et al. Inflammatory markers in coronary artery disease. BioFactors. (2012) 38:320–8. doi: 10.1002/biof.1024
25. Abbate A. The heart on fire: inflammasome and cardiomyopathy. Exp Physiol. (2013) 98:385. doi: 10.1113/expphysiol.2012.069021
26. Mohammed FA, Mahdi N, Sater MA, Al-Ola K, Almawi WY. The relation of C-reactive protein to vasoocclusive crisis in children with sickle cell disease. Blood Cells Mol Dis. (2010) 45:293–6. doi: 10.1016/j.bcmd.2010.08.003
27. Hatzipantelis ES, Pana ZD, Gombakis N, Taparkou A, Tzimouli V, Kleta D, et al. Endothelial activation and inflammation biomarkers in children and adolescents with sickle cell disease. Int J Hematol. (2013) 98:158–63. doi: 10.1007/s12185-013-1392-y
28. United Nations. Provisional Guidelines on Standard International Age Classifications. New York, NY: Department of International Economic and Social Affairs (1982). p. 32.
29. Schwartz GJ, Muñoz A, Schneider MF, Mak RH, Kaskel F, Warady BA, et al. New equations to estimate GFR in children with CKD. J Am Soc Nephrol. (2009) 20:629–37. doi: 10.1681/ASN.2008030287
30. Levey AS, Stevens LA, Schmid CH, Zhang Y, Castro AF, Feldman HI, et al. A new equation to estimate glomerular filtration rate. Ann Intern Med. (2009) 150:604–12. doi: 10.7326/0003-4819-150-9-200905050-00006
31. Singer K, Eng DS, Lumeng CN, Gebremariam A, Lee JM. The relationship between body fat mass percentiles and inflammation in children. Obesity. (2014) 22:1332–6. doi: 10.1002/oby.20710
32. Lukens JR, Dixit VD, Kanneganti TD. Inflammasome activation in obesity-related inflammatory diseases and autoimmunity. Discov Med. (2011) 12:65–74.
33. Casimir GJ, Lefèvre N, Corazza F, Duchateau J. Sex and inflammation in respiratory diseases: a clinical viewpoint. Biol Sex Differ. (2013) 4:16. doi: 10.1186/2042-6410-4-16
34. Casimir GJA, Mulier S, Hanssens L, Zylberberg K, Duchateau J. Gender differences in inflammatory markers in children. Shock. (2010) 33:258–62. doi: 10.1097/SHK.0b013e3181b2b36b
35. Casimir GJA, Mulier S, Hanssens L, Knoop C, Ferster A, Hofman B, et al. Chronic inflammatory diseases in children are more severe in girls. Shock. (2010) 34:23–6. doi: 10.1097/SHK.0b013e3181ce2c3d
36. Stubnova V, Os I, Høieggen A, Solbu MD, Grundtvig M, Westheim AS, et al. Waldum-Grevbo B, gender differences in association between uric acid and all-cause mortality in patients with chronic heart failure. BMC Cardiovasc Disord. (2019) 19:4. doi: 10.1186/s12872-018-0989-8
37. Upadhyay, Larson MG, Guo CY, Vasan RS, Lipinska I, O'Donnell CJ, et al. Inflammation, kidney function, and albuminuria in the Framingham Offspring cohort. Nephrol Dial Transplant. (2011) 26:920–6. doi: 10.1093/ndt/gfq471
38. Wong CS, Pierce CB, Cole SR, Warady BA, Mak RHK, Benador NM, et al. Association of proteinuria with race, cause of chronic kidney disease, and glomerular filtration rate in the chronic kidney disease in children study. J Am Soc Nephrol. (2009) 4:812–9. doi: 10.2215/CJN.01780408
39. Abbate M, Zoja C, Remuzzi G. How does proteinuria cause progressive renal damage? J Am Soc Nephrol. (2006) 17:2974–84. doi: 10.1681/ASN.2006040377
40. Choi HK, Ford ES. Prevalence of the metabolic syndrome in individuals with hyperuricemia. Am J Med. (2007) 120:442–7. doi: 10.1016/j.amjmed.2006.06.040
41. Ali N, Perveen R, Rahman S, Mahmood S, Rahman S, Islam S, et al. Prevalence of hyperuricemia and the relationship between serum uric acid and obesity: a study on Bangladeshi adults. PLoS ONE. (2018) 13:e0206850. doi: 10.1371/journal.pone.0206850
Keywords: hyperuricemia, National Health and Nutrition Examination Survey, inflammation markers, elevated BMI, sex, C-reactive protein
Citation: Kaspar CDW and Lu J (2021) Hyperuricemia, Elevated Body Mass Index, Female Sex, and Albuminuria Increase the Probability of Elevated High-Sensitivity C-Reactive Protein: Results From the National Health and Nutrition Examination Survey 2015–2018. Front. Public Health 9:689219. doi: 10.3389/fpubh.2021.689219
Received: 31 March 2021; Accepted: 05 July 2021;
Published: 12 August 2021.
Edited by:
Angelo d'Errico, Azienda Sanitaria Locale TO3, ItalyReviewed by:
Md Shajedur Rahman Shawon, University of New South Wales, AustraliaMehmet Ağirbaşli, Istanbul Medeniyet University, Turkey
Copyright © 2021 Kaspar and Lu. This is an open-access article distributed under the terms of the Creative Commons Attribution License (CC BY). The use, distribution or reproduction in other forums is permitted, provided the original author(s) and the copyright owner(s) are credited and that the original publication in this journal is cited, in accordance with accepted academic practice. No use, distribution or reproduction is permitted which does not comply with these terms.
*Correspondence: Cristin D. W. Kaspar, Y3Jpc3Rpbi5rYXNwYXJAdmN1aGVhbHRoLm9yZw== orcid.org/0000-0003-2720-9325