 Collins Okoyo1,2*
 Suzy J. Campbell3
 Mark Minnery3
 Chrispin Owaga4
 Nelson Onyango2
 Graham Medley5
 Charles Mwandawiro1
- 1Eastern and Southern Africa Centre of International Parasite Control, Kenya Medical Research Institute, Nairobi, Kenya
- 2School of Mathematics, College of Biological and Physical Sciences, University of Nairobi, Nairobi, Kenya
- 3Deworm the World, Evidence Action, Washington, DC, United States
- 4Deworm the World, Evidence Action, Nairobi, Kenya
- 5Faculty of Public Health and Policy, London School of Hygiene and Tropical Medicine, London, United Kingdom
Background: Soil-transmitted helminths (STH) are among the most common parasitic infections globally, disproportionately affecting children. Treatment of STH in Kenya is often targeted at preschool (PSAC) and school aged (SAC) children delivered through annual mass drug administration (MDA) in primary schools. Understanding group-specific prevalence and dynamics between treatment and coverage is critical for continued treatment success. This study aims to provide detailed information on group-specific infection prevalence and relative reductions (RR), and their relationships with treatment coverage over time. Additionally, it aims to quantify the correlation between the observed school level infection prevalence and treatment coverage.
Methods: Secondary analysis of existing data collected between 2012 and 2018 by the monitoring and evaluation (M&E) program of the National School-Based Deworming (NSBD) program was used. The M&E program conducted surveys utilizing cross-sectional study design, at four survey time points, in a nationally-representative sample of schoolchildren across counties in Kenya. In each participating school, the program randomly sampled 108 children per school, of both groups. Infection prevalence was estimated using binomial regression, RR in prevalence using multivariable mixed effects model, statistical correlations using structural equation modeling, and change-point-analysis using the binary segmentation algorithm.
Results: Overall, STH prevalence for PSAC was 33.7, 20.2, 19.0, and 17.9% during Year 1 (Y1), Year 3 (Y3), Year 5 (Y5), and Year 6 (Y6) surveys, respectively with an overall RR of 46.9% (p = 0.001) from Y1 to Y6. Similarly, overall STH prevalence for SAC was 33.6, 18.4, 14.7, and 12.5% during Y1, Y3, Y5, and Y6 surveys, respectively with an overall RR of 62.6% (p < 0.001). An overall (all time points) significant but very weak negative correlation was found between treatment coverage and undifferentiated STH prevalence (r = −0.144, p = 0.002) among PSAC but not in SAC. Further, we observed inter-county heterogeneity variation in infection prevalence, RR, as well as correlations.
Conclusion: The analysis showed that after six rounds of MDA, prevalence of STH has significantly declined among both groups of children, however not to a point where it is not a public health problem (below 1%). The analysis, additionally established an overall significant but weak negative correlation between treatment coverage and prevalence, indicating that the current treatment coverage might not be sufficient to drive the overall STH prevalence to below 1%. These findings will allow STH control programs in Kenya to make decisions that will accelerate the attainment of STH elimination as a public health problem.
Introduction
Soil-transmitted helminths (STH) primarily Ascaris lumbricoides, Trichuris trichuira, and the hookworms; Necator americanus and Ancylostoma duodenale are among the most widespread neglected tropical diseases (NTDs) globally, affecting more than 1.5 billion people each year (1). The current World Health Organization (WHO) guidelines for the control of STH recommend provision of treatment through mass drug administration (MDA) to vulnerable groups, namely, preschool aged children (PSAC), school aged children (SAC), and women of childbearing age (WCA) (2–4). Under the guidelines both infection monitoring and treatment through MDA focus primarily on treatment frequency driven by undifferentiated prevalence for SAC, with MDA recommended for PSAC and WCA in situations where sustainable delivery mechanisms exist (2).
The focus of the current guidelines on SAC is in recognition that the highest burden of infection generally falls among this group, with subsequent risk of detrimental impact on growth (5) and development (6). The WHO also recognizes the substantial burden of infection among PSAC and the need to scale up coverage of MDA to reach 75% among PSAC as well as SAC by 2020 (3, 7, 8). Treatment coverage and resulting prevalence have shown mixed trends globally, with some countries lagging behind (9). Despite this, many countries have made considerable gains in increasing treatment coverage for SAC, however, less than half of endemic countries also target treatment toward PSAC. These countries yield low coverage levels of ~50% with considerable variability of coverage year on year and across their geography (10). Understanding prevalence and coverage, but also how the two interact across key age-groups is key to future deworming efforts.
The Kenyan National School Based Deworming (NSBD) program was launched in 2012 with the aim of reducing the burden of the disease among SAC. The program provides annual MDA to 66 endemic sub-counties spread out across four endemic regions; Western, Nyanza, Rift Valley, and Coast and three regions with minimal risk; Central, Eastern and North Eastern (11, 12). The NSBD program which forms a key component of the country's national response strategy to control STH and schistosome infections, as a public health problem, functions by administering treatment to all SAC including those out of school (in this case PSAC). The program has so far offered consistent and high MDA coverage for the last 6 years, with some variation at the county level (13). The program's impact, both in terms of treatment coverage and infection control, has been consistently monitored through a robust monitoring and evaluation (M&E) program (14). In large part due to the success of the program, national STH infection levels among school children have declined, as reported by the M&E component of the NSBD program (14–17).
Previous studies (14–17) have described the prevalence and intensity of helminth infection using the Kenyan M&E data across seven years of the program, however, undifferentiated between PSAC and SAC. There has also yet to be correlational analysis performed for risk of infection stratified by treatment coverage across counties covered by the NSBD program. Recognizing the importance of understanding levels and drivers of infection differentiated among PSAC and SAC, we combine pre-existing datasets on treatment coverage and infection prevalence to provide detailed trend correlational, and change-point analyses for counties covered by the NSBD program. This is with the aim of better informing STH control programs to make decisions that will accelerate the attainment of elimination of STH as a public health problem in Kenya.
Materials and Methods
This was a secondary analysis of existing data collected as part of the M&E component of the Kenyan NSBD program. The study utilized secondary data to; differentiate prevalence between PSAC and SAC for the 6 years of the NSBD, then identify any correlations between changes in treatment coverage at the county level and risk of STH infection. Finally, a change point analysis was performed to demonstrate tipping points at which the greatest reductions in prevalence can be seen relative to changes in coverage. Data was drawn from two primary sources; prevalence surveys and MDA coverage monitoring performed as part of the NSBD program. Both datasets and details of analyses performed are described below.
Prevalence Data
Large scale surveys for STH prevalence have been conducted at Year 1 (Y1), Year 3 (Y3), Year 5 (Y5), and Year 6 (Y6) since the NSBD inception. Detailed design for these surveys are provided in previous studies (14–17). Briefly, all previous surveys utilized a cross-sectional study design in a nationally-representative, stratified, two-stage sample of schoolchildren across counties in Kenya. For Y1, Y3, and Y5 surveys, an average of 200 schools per survey round in 16 counties in four regions; Western, Nyanza, Rift Valley, and Coast were surveyed before treatment to measure national infection levels. However, for the Y6 survey, 100 schools (5 schools per county) were sampled in 20 counties in six regions; Western, Nyanza, Rift Valley, Coast, Eastern and North Eastern.
In each of the sampled schools, 18 children (nine girls and nine boys) were sampled randomly from each of the six classes, including one early childhood development (ECD) class and classes 2–6, using random numbers, for a total of ~108 children per school. During each survey point, the program processed and examined in duplicate single stool samples from each selected child for identification of STH eggs using the Kato-Katz thick smear technique (16, 18).
Specifically for this study, we structured our analysis by two age groups of children as defined by the Kenyan Ministry of Education; PSAC (children aged 2–4 years) and SAC (children aged 5–14 years) to determine the trend in infection prevalence and its correlation with treatment coverage in the two age groups. This kind of age structured analysis will allow comparability of our results to many other age-structured STH modeling work.
The infection prevalence was defined as the number of children tested positive for each infection divided by the total number of children examined in the school. On the other hand, school level infection prevalence was defined as the averaged infection prevalence observed among schoolchildren surveyed at that school (sample size of 108 children). In this analysis, we determined infection prevalence for two age groups separately, being prevalence data for PSAC and SAC during the four survey time points; Y1, Y3, Y5, and Y6 pre-treatment surveys, so as to enable the calculation of the trend in prevalence and relative reduction (RR) over the 6-year period in the modeling. The overall relative reduction in prevalence was defined as the difference in the infection prevalence between Y1 and Y6 surveys.
Figure 1 shows the number of schools extracted from the NSBDP's M&E database and the number included in this analysis. The M&E program planned to follow the same number of schools (200 schools during Y1 to Y5 and 100 schools during Y6) longitudinally each survey year, however, the following situations led to the final number of schools included in this analysis being inconsistent at some survey points: (1) 27 schools were surveyed too close to Y3 survey hence their time for reinfection was much shorter than the rest of the schools and they were deemed to overestimate the treatment impact. These schools were excluded from the analysis. (2) Some schools had no ECD centers hence they did not have data for PSAC. Such schools were therefore excluded in the analysis for PSAC data. (3) One school was found to be closed down after Y3 survey and was therefore not surveyed during Y5, this school was excluded from the analysis. (4) After Y5 survey, the M&E plan was changed and provided for survey of only 100 schools (five schools per county) during Y6 survey. Taking into account all these situations that led to inconsistent number of schools in some survey years especially among PSAC group and the fact that same number of children were randomly sampled in each school, the analysis objective, which was to determine trend in infection prevalence and its correlation with treatment coverage all aggregated at the county level, was not significantly affected by this inconsistency.
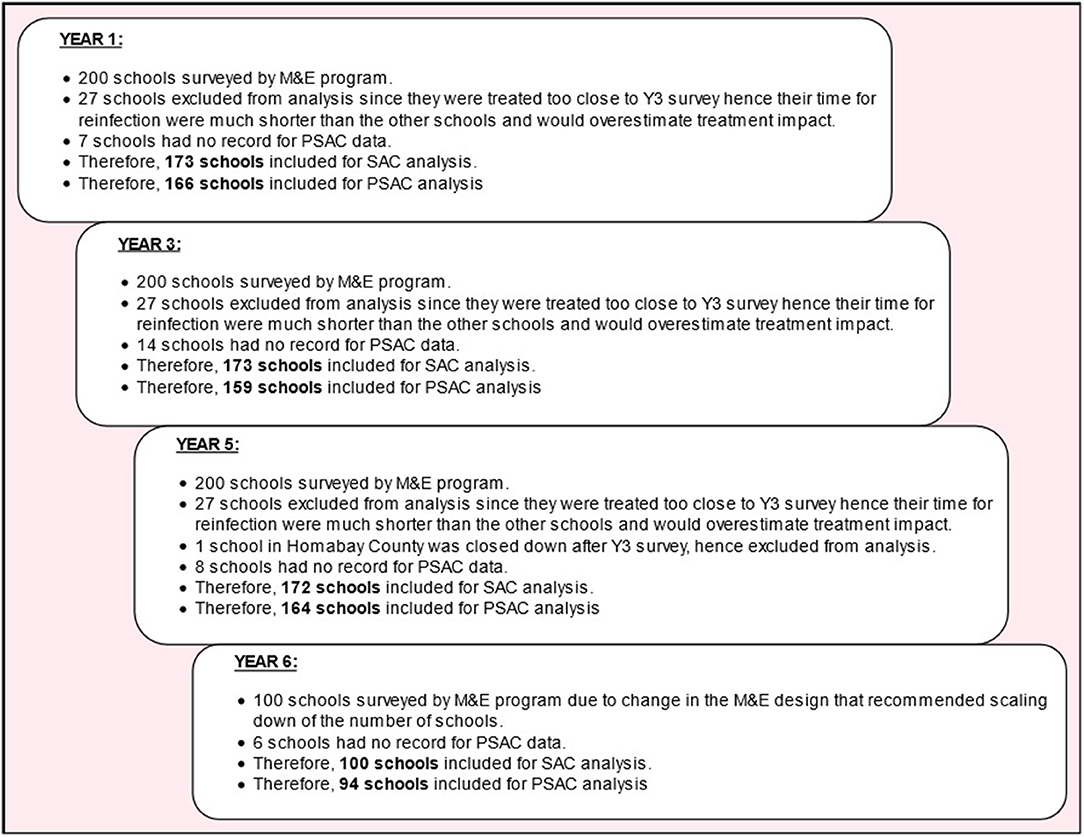
Figure 1. Schema illustrating the number of schools extracted from the NSBDP's M&E database and the number of schools included in this analysis.
Treatment Coverage Data
Treatment coverage information for each school is usually recorded within the NSBD program by Evidence Action; an international non-governmental organization, who provides technical support to the government's NSBD program. School-level treatment coverage for each infection were aggregated and presented at the sub-county level. Treatment coverage was determined as the number of children who received treatment for each infection divided by the number targeted at each participating school. Similarly, we calculated the previous year's treatment coverage levels for each of the two age groups separately during the four survey time points with the exception of Y1 survey since there was no previous year treatment. Treatment for STH infections was offered annually to the targeted children using single dose of albendazole in 28 counties in Kenya, consecutively for 6 years. All the 20 counties included in the M&E program were covered for treatment following the WHO guidelines (19). Importantly, treatment was delivered at school level.
Statistical Analyses
The analysis was conducted for two groups of children (PSAC and SAC) dewormed at the participating schools. The PSAC group of children was defined as those children aged 2–4 years and may not be necessarily enrolled in the school, who were dewormed after presenting themselves at the nearby participating primary school on the deworming day. The SAC group of children was defined as those children aged 5–14 years and enrolled in the primary school, and who were dewormed at their participating primary school on the deworming day.
Infection prevalence, amongst each group of children, was defined as the number of children who were tested positive for a particular STH infection using the Kato-Katz technique by the NSBD program (i.e., ). For each prevalence estimate calculated, the 95% confidence intervals (CIs) were determined using binomial regression model, taking into account clustering by schools. The relative reductions in STH infection prevalence for each group of children was defined as the difference in prevalence between Y1 and Y6 surveys (i.e., 100%) and RR estimates calculated using multivariable mixed effects models with random intercepts for schools and counties, and the associated p-values obtained using Wald test. Hence, RR reflected the infection prevalence reduction levels after treatment (in this case, after five rounds of treatment) in comparison with the initial (Y1) prevalence.
Statistical correlations (r) between infection prevalence and the previous year's treatment coverage were determined at county-level and the p-values estimated using structural equation modeling (SEM), allowing for variations across school clusters. The structure of the SEM model used is shown in Appendix A1. The decision to use SEM over an ordinary correlation model was based on its ability to simultaneously perform statistical tests while handling missing data more elegantly (20, 21). Further, the correlation analysis was stratified by county since each county represents a different transmission pattern and dynamics. Significance levels, for either RR or correlations, were set at p ≤ 0.05.
Further, we conducted change point analysis in order to investigate the survey year points associated with significant changes in infection prevalence over the 6 year period, following the yearly MDAs. Briefly, change point analysis helps solve the problem of estimating point(s) at which some statistical properties (e.g., mean) of a time series data show significant change, potentially as a result of an intervention (or lack thereof). More information on the methodology and implementation of this technique is well-illustrated in previous studies (22, 23). In this analysis, we detected significant change point(s) along the 6 year implementation period of the program using the binary segmentation algorithm implementable in the R package “changepoint” (24).
Statistical analyses were carried out using either STATA version 14.1 (STATA Corporation, College Station, TX, USA) or R statistical software (25), where appropriate. All graphs were developed using the ggplot package implemented in R (26). Maps for school-level prevalence overlaid with their respective subcounty-level treatment coverage were developed using ArcGIS Desktop version 10.2.2 software (Environmental Systems Research Institute Inc., Redlands, CA, USA).
Results
Number of Schools and Children Included in the Study
For PSAC group, during Y1, Y3, Y5, and Y6 pre-treatment survey points, children aged 2–4 years were included in the analysis in 166 schools (1,949 children), 159 schools (1,366 children), 164 schools (1,992 children), and 94 schools (781 children), respectively. The number of schools and PSAC children included in the final analysis per county at each survey time point is shown in Table 1. The mean age of PSAC children was 3.7 years (standard deviation 0.5 years) with 51.0% being females.
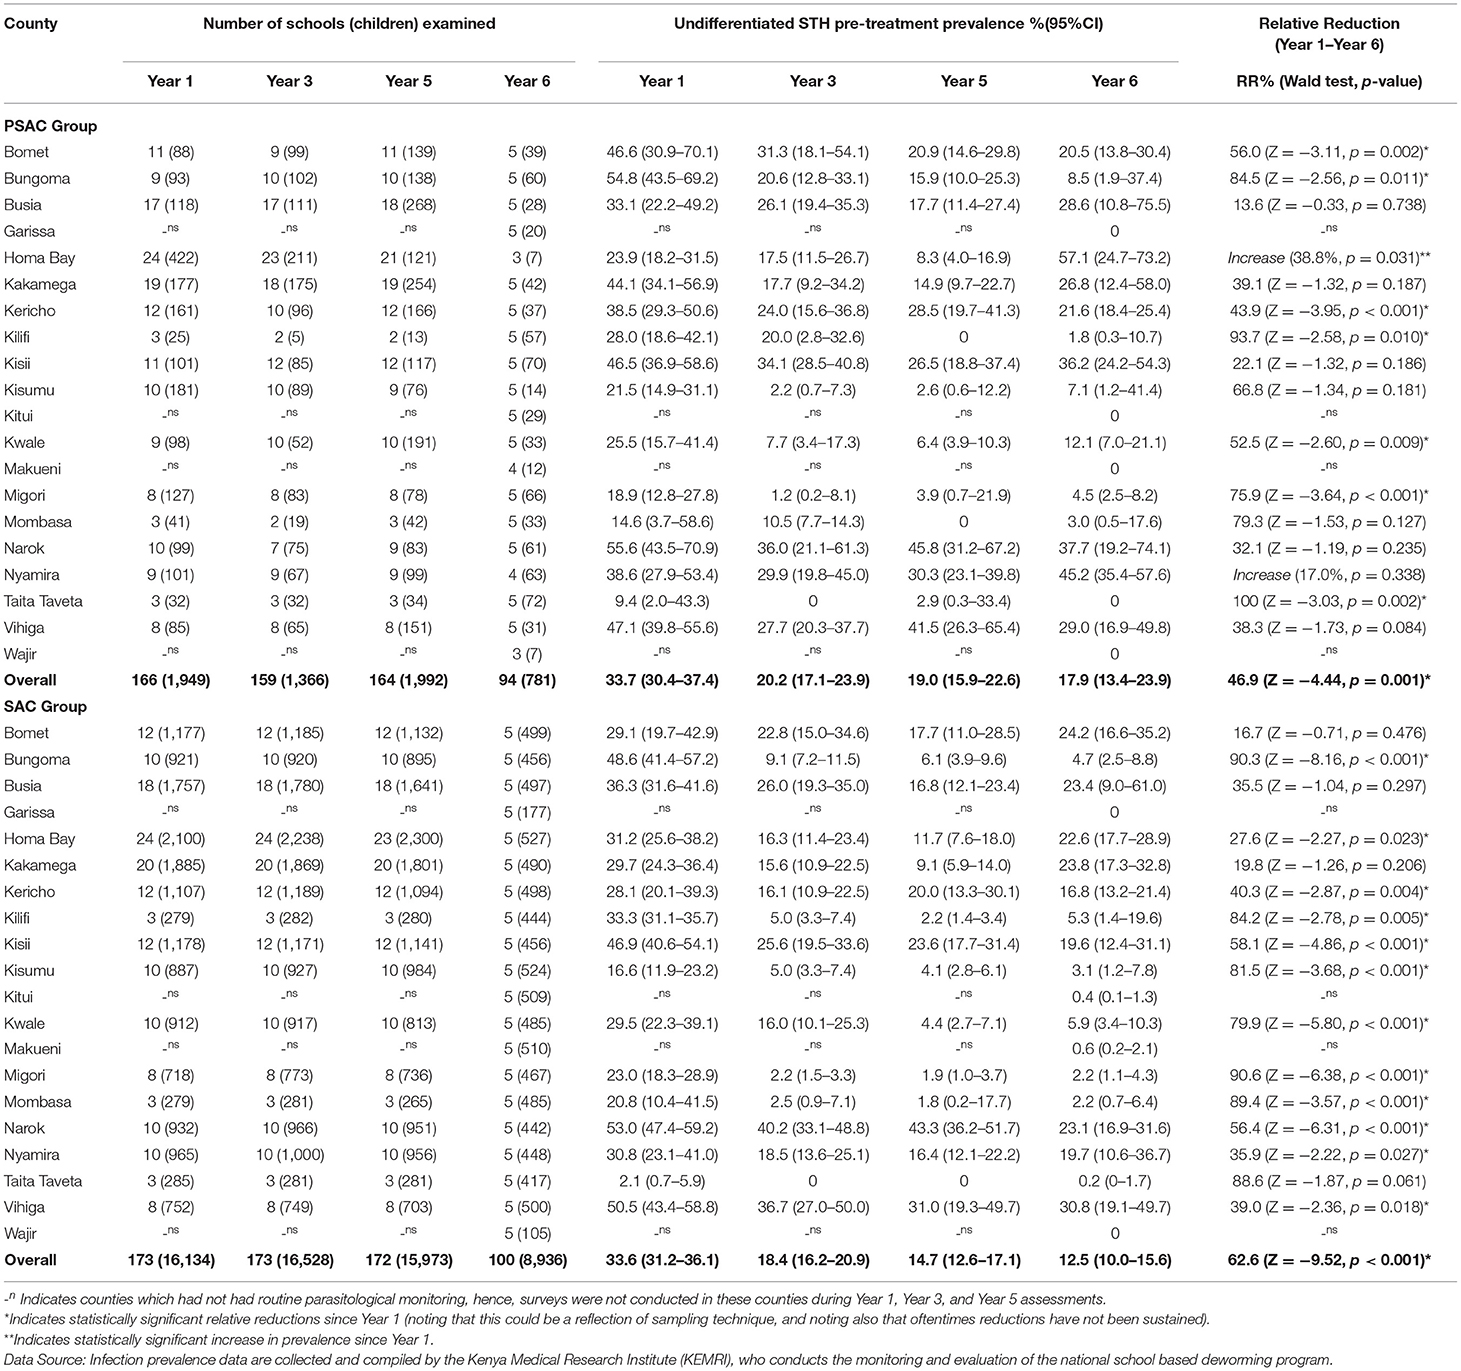
Table 1. Number of schools (children) examined, undifferentiated STH pre-treatment prevalence % (95% CI), and relative reductions % (Wald test: Z-statistic, p-value) by county for preschool (PSAC) and school (SAC) aged group of children in 20 counties in Kenya.
For SAC group, during Y1, Y3, Y5, and Y6 pre-treatment survey points, children aged 5–14 years were included in the analysis in 173 schools (16,134 children), 173 schools (16,528 children), 172 schools (15,973 children), and 100 schools (8,936 children), respectively. The number of schools and SAC children included in the final analysis per county at each time point is shown in Table 1. The mean age of SAC children was 10.1 years (standard deviation 2.1 years) with 50.2% being females.
Treatment Coverage
Overall treatment coverage for PSAC, for each annual MDA from Y1 through to Y6 was 21.6, 82.4, 91.9, 87.5, 75.0, and 84.8%, respectively. Treatment coverage varied within counties across different years of MDA. Across all years there were counties that did not reach WHO recommended MDA coverage of ≥75% coverage (4, 27). In Y1 no county reached ≥75%, in Y2 seven counties, in Y3 one county, in Y4 three counties, in Y5 five counties, and in Y6 five counties. County-level summary of the PSAC STH treatment coverage is outlined in Table 2.
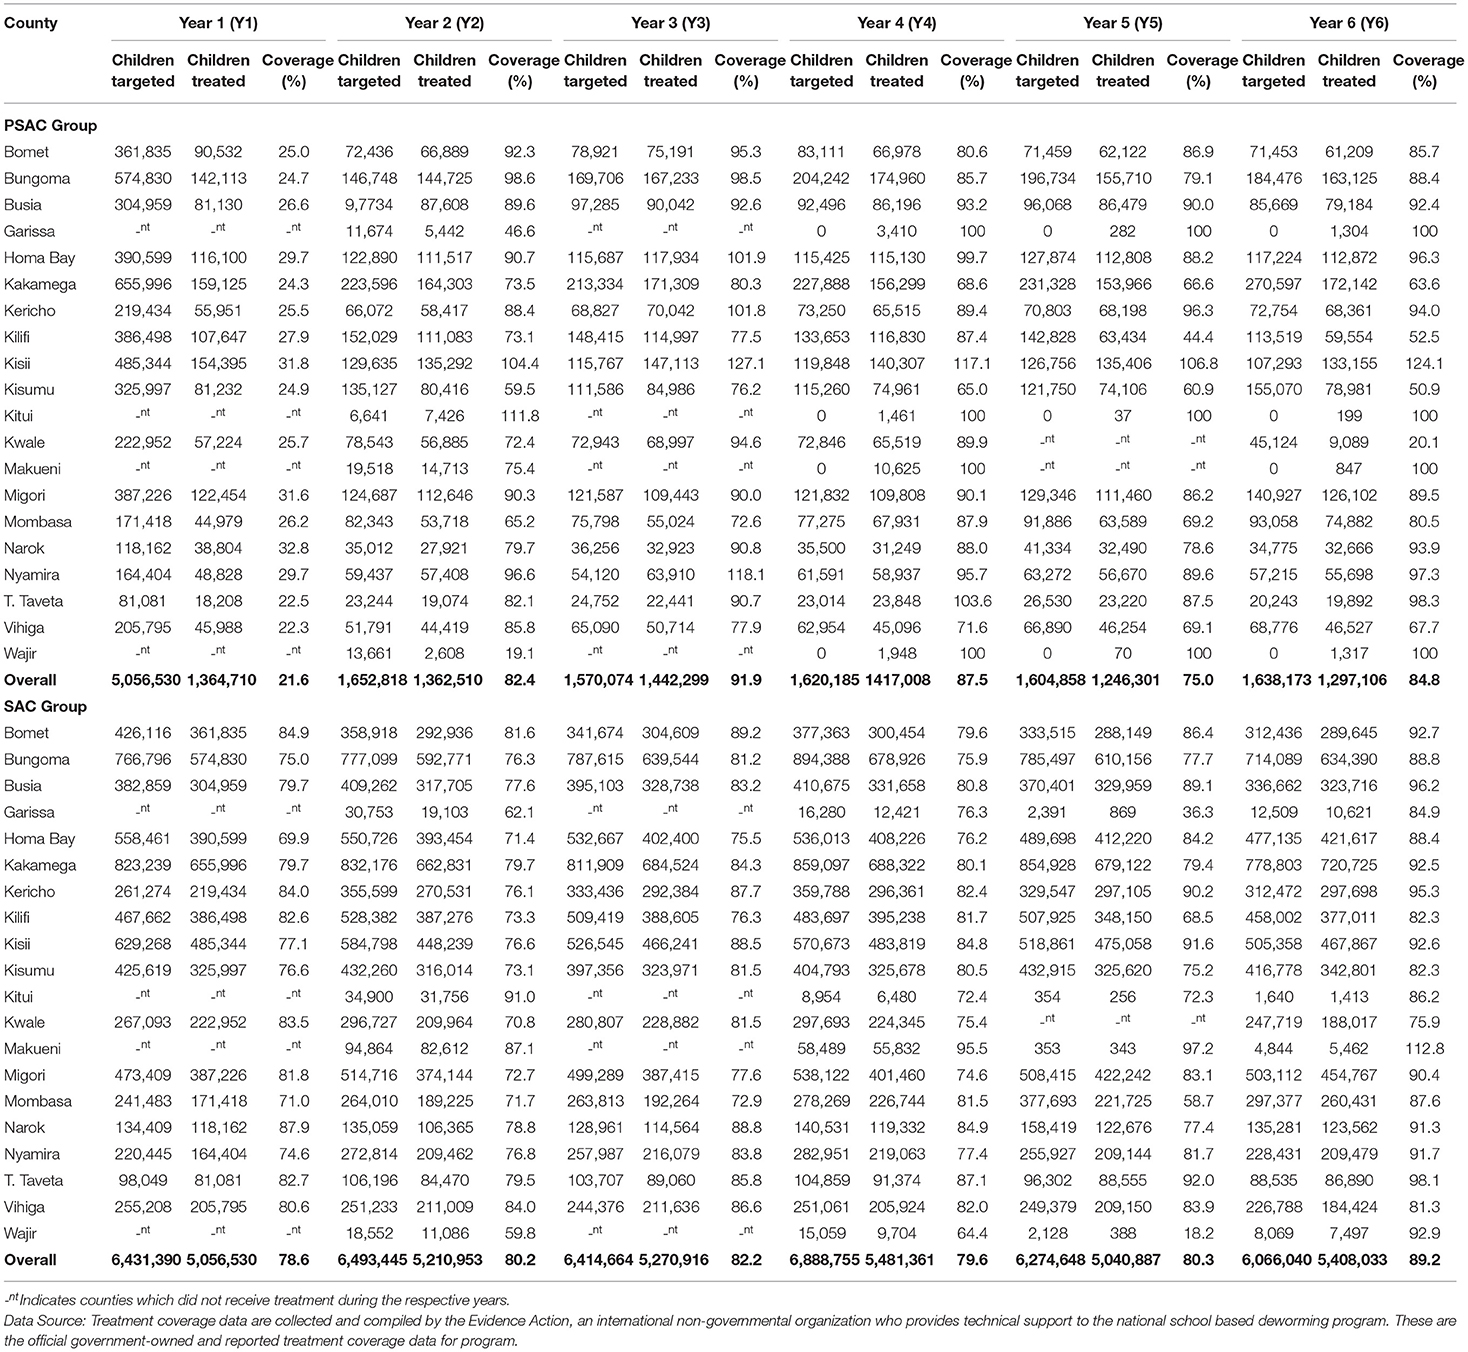
Table 2. County level summary of STH treatment coverage (%) for preschool (PSAC) and school (SAC) aged group of children in 20 counties in Kenya.
For SAC, the overall STH treatment coverage for each annual MDA from Y1 through Y6 was high, at 78.6, 80.2, 82.2, 79.6, 80.3, and 89.2%, respectively. During Y1 MDA, three counties did not achieve treatment coverage of ≥75%, in Y2 eight counties, in Y3 one county, in Y4 three counties, in Y5 five counties, and in Y6 all counties achieved ≥75% coverage (Table 2).
PSAC Infection Prevalence
Overall, 33.7% (95% CI: 30.4–37.4%), 20.2% (95% CI: 17.1–23.9%), 19.0% (95% CI: 15.9–22.6%), and 17.9% (95% CI: 13.4–23.9%) of PSAC children were infected with at least one STH species during Y1, Y3, Y5, and Y6 surveys, respectively, with an overall relative reduction of 46.9% (p = 0.001) from Y1 to Y6 (Table 1). The PSAC prevalence of undifferentiated STH differed within counties with highest prevalence, during Y6, observed in Homabay (57.1%) followed by Nyamira (45.2%), Narok (37.7%) and Kisii (36.2%) and zero prevalence observed in Garissa, Kitui, Makueni, Taita Taveta, and Wajir counties. County level relative reduction indicated that only two counties; Kilifi and Taita Taveta, reduced the PSAC prevalence by over 90% (Table 1). Comparison of the county-level trends in PSAC pre-treatment undifferentiated STH prevalence and treatment coverage is outlined in Figure 2A.

Figure 2. County-level trend of STH infections prevalence and treatment coverage for year 1 (Y1), year 3 (Y3), year 5 (Y5), and year 6 (Y6) survey time points among preschool PSAC) and school (SAC) aged group of children in Kenya. The overlay of undifferentiated STH prevalence with treatment coverage is shown in (A), Ascaris lumbricoides (B), Trichuris trichiura (C), and hookworm (D).
Ascaris lumbricoides was the most prevalent STH species among PSAC during all four survey time points; Y1, 22.5% (95% CI: 19.3–26.3); Y3, 16.4% (95% CI: 13.5–19.9); Y5, 15.3% (95% CI: 12.5–18.8); and Y6, 13.9% (95% CI: 10.0–19.4), with a statistically significant overall relative reduction (RR = 38.2%, p = 0.003). Counties showed differing levels of A. lumbricoides prevalence. At Y6, the counties with highest A. lumbricoides prevalence among PSAC, of over 20% were; Nyamira (45.2%), Kisii (34.8%), Vihiga (29.0%), Homabay (28.6%), Kakamega (26.8%), Kericho (21.6%), and Bomet (20.5%). Three counties; Kisumu, Kwale and Taita Taveta, showed a statistically significant relative reduction in A. lumbricoides prevalence of over 90% (Table 3). Comparison of the county-level trends in PSAC pre-treatment A. lumbricoides prevalence and treatment coverage is outlined in Figure 2B.
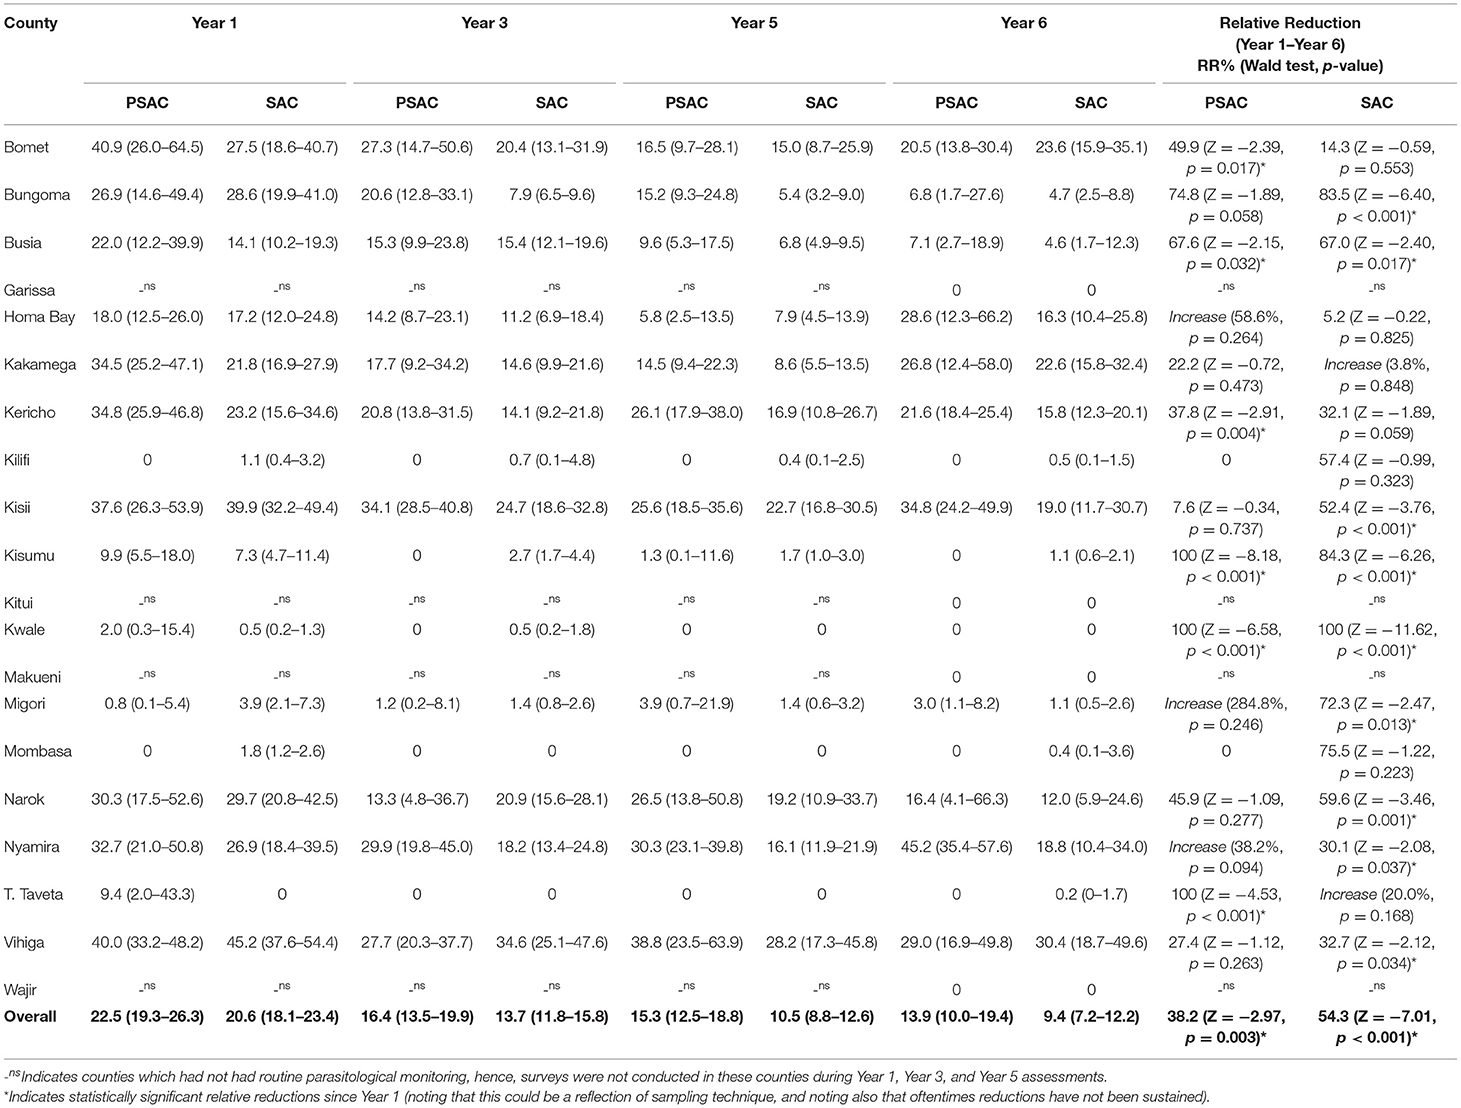
Table 3. Preschool (PSAC) and school (SAC) aged pre-treatment prevalence % (95% CI) and relative reductions % (Wald test: Z-statistic, p-value) for Ascaris lumbricoides infection in 20 counties in Kenya.
Trichuris trichiura was the second most prevalent STH species among PSAC in three of four surveys and least prevalent in Y1. T. trichiura prevalence was; Y1 5.9% (95% CI: 4.3–8.1); Y3 4.2% (95% CI: 2.6–6.7); Y5 4.5% (95% CI: 3.0–6.8); and Y6 4.8% (95% CI: 2.5–9.0), with a non-significant overall relative reduction (RR = 19.2%, p = 0.426). Overall T. trichiura prevalence among PSAC appeared to steadily increase after the initial reduction between Y1 and Y3. Counties showed differing levels of infection prevalence. At Y6, three counties showed highest PSAC T. trichiura prevalence of over 20%; Busia (28.6%), Homabay (28.6%), and Narok (23.0%). Further, during Y6, nine counties had reduced their prevalence to zero and three counties i.e., Bomet, Migori, and Nyamira, showed a statistically significant relative reduction in prevalence of over 90%. However, infection prevalence increased (significantly) in three counties; Busia, Homabay, and Kilifi (Table 4). Comparison of the county-level trends in PSAC pre-treatment T. trichiura prevalence and treatment coverage is outlined in Figure 2C.
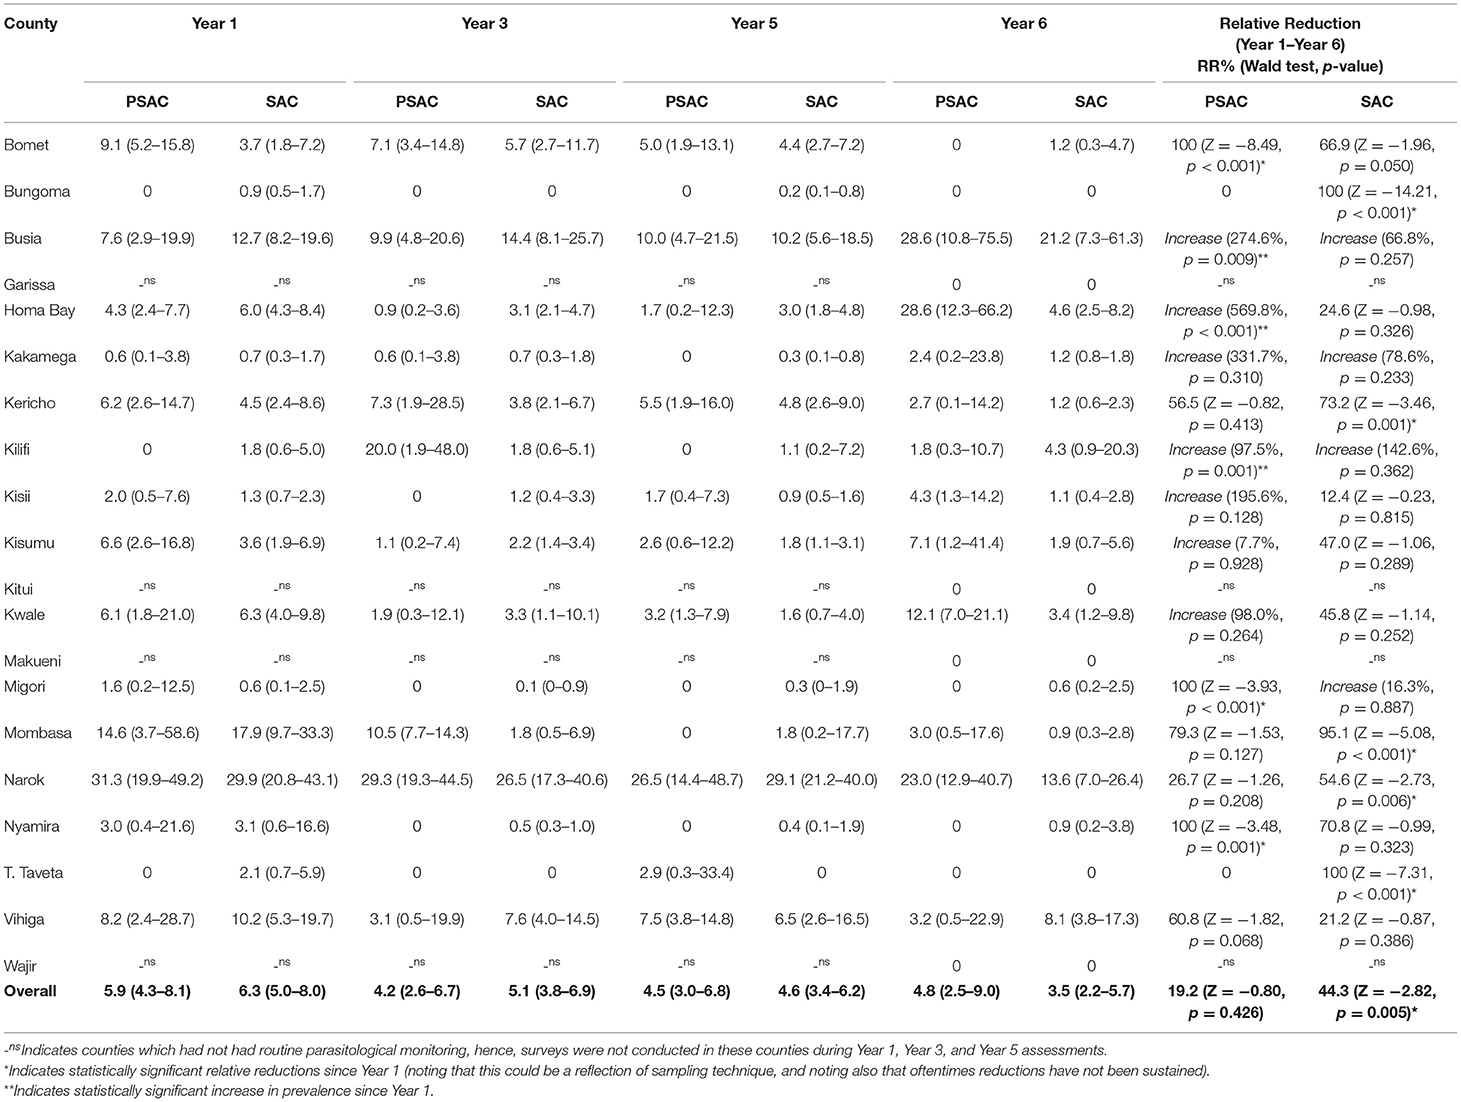
Table 4. Preschool (PSAC) and school (SAC) aged pre-treatment prevalence % (95%CI) and relative reductions % (Wald test: Z-statistic, p-value) for Trichuris trichiura infection in 20 counties in Kenya.
Hookworm was the least prevalent STH detected among PSAC across all years with the exception of Y1 where it was the second most. Prevalence of hookworm among PSAC reduced steadily across all surveys; Y1 13.2% (95% CI: 11.0–15.9); Y3 1.8% (95% CI: 1.1–2.8); Y5 1.2% (95% CI: 0.8–1.9); and Y6 0.5% (95% CI: 0.2–1.3), with an overall significant relative reduction (RR = 96.1%, p < 0.001). Although, not representative at the county level, estimates suggested 16 counties had reduced hookworm prevalence to zero during the Y6 survey, and the remaining four counties had prevalence between 1.4 and 2.4%. This resulted in 13 counties significantly reducing the infection prevalence by over 90% (Table 5). Comparison of the county-level trends in PSAC pre-treatment hookworm prevalence and treatment coverage is outlined in Figure 2D.
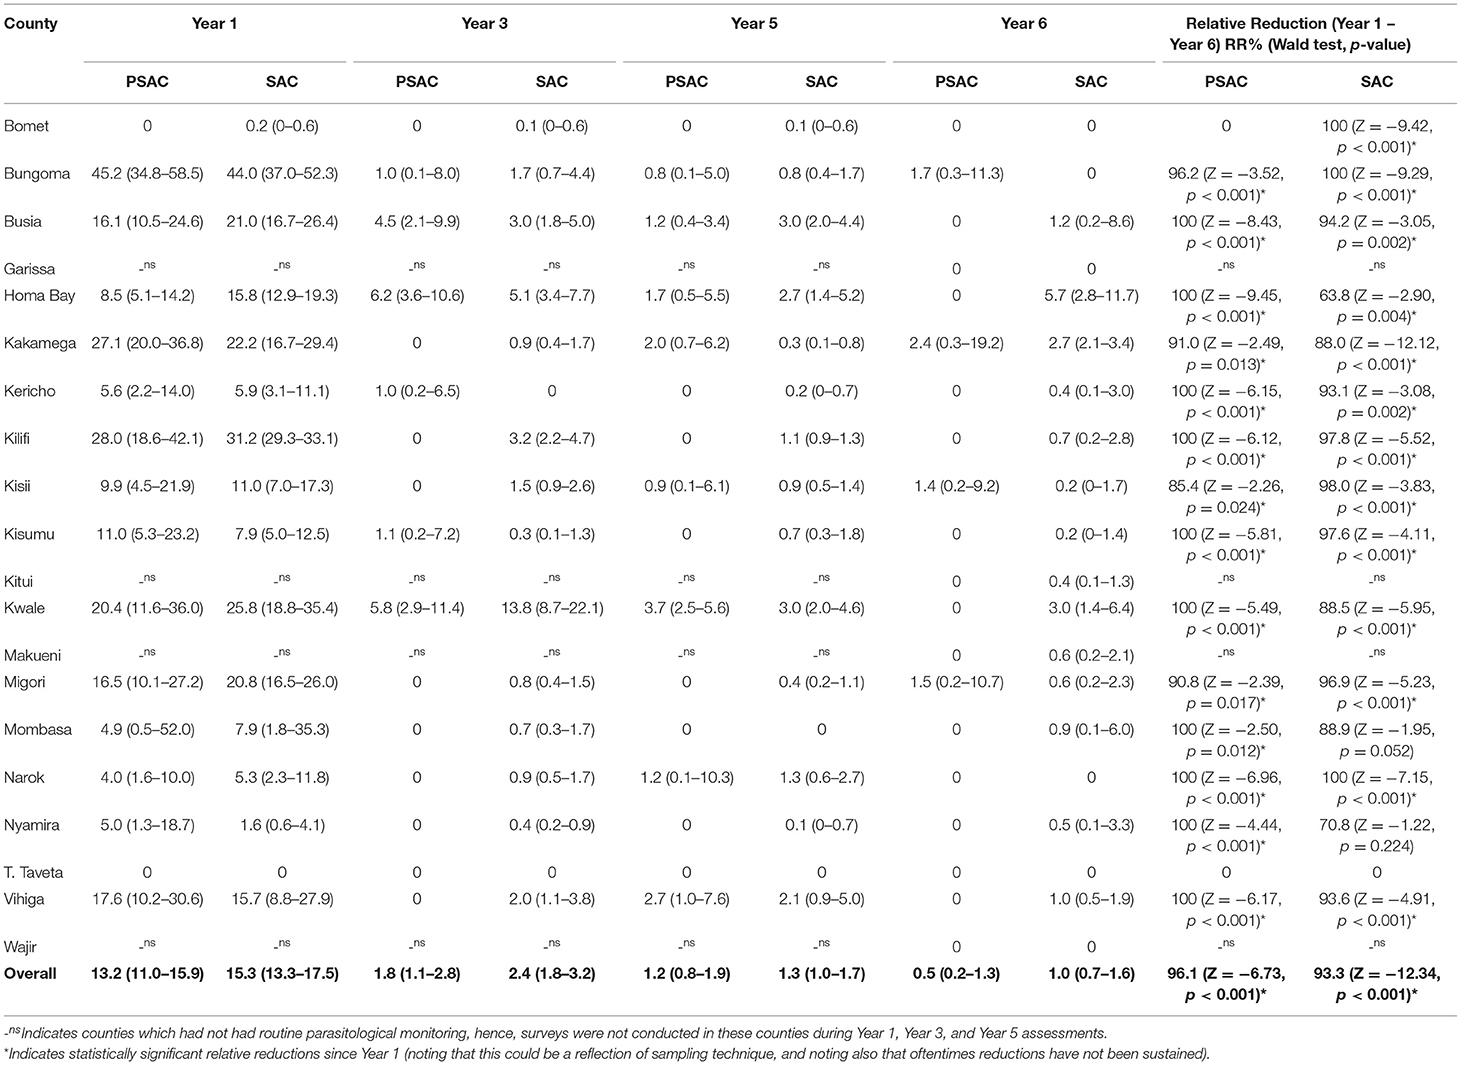
Table 5. Preschool (PSAC) and school (SAC) aged pre-treatment prevalence % (95%CI) and relative reductions % (Wald test: Z-statistic, p-value) for hookworm infection in 20 counties in Kenya.
SAC Infection Prevalence
Overall, 33.6% (95% CI: 31.2–36.1%), 18.4% (95% CI: 16.2–20.9%), 14.7% (95% CI: 12.6–17.1%) and 12.5% (95% CI: 10.0–15.6%) of SAC children were infected with at least one STH species during Y1, Y3, Y5, and Y6 surveys, respectively, with an overall significant relative reduction of 62.6% (p < 0.001) (Table 1). Similarly SAC prevalence of undifferentiated STH differed within counties with highest prevalence, during Y6, observed in Vihiga (30.8%) followed by Bomet (24.2%), Kakamega (23.8%), Busia (23.4%), and Narok (23.1%) and no infections detected in Garissa and Wajir counties. However, Kitui, Makueni, and Taita had their prevalence below 1%. County level relative reduction indicated that only two counties; Bungoma and Migori, reduced the SAC prevalence by over 90% (Table 1). Comparison of the county-level trends in SAC pre-treatment undifferentiated STH prevalence and treatment coverage is outlined in Figure 2A.
Ascaris lumbricoides remained the most prevalent STH species among SAC during all the four survey time points despite the prevalence steadily declining. Prevalence for A. lumbricoides was estimated at; Y1 20.6% (95% CI: 18.1–23.4); Y3 13.7% (95% CI: 11.8–15.8); Y5 10.5% (95% CI: 8.8–12.6); and Y6 9.4% (95% CI: 7.2–12.2), with a statistically significant overall relative reduction (RR = 54.3%, p < 0.001). Further, we noted that the overall prevalence of A. lumbricoides among SAC was lower than PSAC prevalence at each respective survey time point. Similarly, counties showed differing level of infection prevalence. At Y6, the counties with higher SAC A. lumbricoides prevalence (>20%) were only Vihiga (30.4%) and Bomet (23.6%). This demonstrated fewer counties with SAC prevalence >20% compared to PSAC, who recorded seven counties with prevalence >20%. Only one county, Kwale, statistically significantly reduced A. lumbricoides prevalence by over 90% (Table 3). Comparisons of county-level trends in SAC pre-treatment A. lumbricoides prevalence and treatment coverage is outlined in Figure 2B.
Trichuris trichiura was the second most prevalent STH species among SAC for three surveys but least prevalent during Y1. Prevalence of T. trichiura for SAC was estimated at; Y1 6.3% (95% CI: 5.0–8.0); Y3 5.1% (95% CI: 3.8–6.9); Y5 4.6% (95% CI: 3.4–6.2); and Y6 3.5% (95% CI: 2.2–5.7), with a statistically significant overall relative reduction (RR = 44.3%, p = 0.005). The reduction in the T. trichiura prevalence appeared steady from Y1 to Y6. Counties showed differing levels of prevalence (Table 4). Comparison of the county-level trends in SAC pre-treatment T. trichiura prevalence and treatment coverage is outlined in Figure 2C.
Hookworm was the least prevalent form of STH infection among SAC in all the surveys except Y1, where it was second. Prevalence of hookworm among SAC reduced steadily across all surveys; Y1 15.3% (95% CI: 13.3–17.5); Y3 2.4% (95% CI: 1.8–3.2); Y5 1.3% (95% CI: 1.0–1.7); and Y6 1.0% (95% CI: 0.7–1.6), with an overall statistically significant relative reduction (RR = 93.3%, p < 0.001). Overall SAC hookworm prevalence was higher among SAC than PSAC across all surveys. Similarly, counties showed differing levels of infection prevalence. Six out of the 20 counties reduced hookworm prevalence to zero during the Y6 survey, and remaining counties showed prevalence between 0.2 and 5.7%. Ten counties significantly reduced prevalence by over 90% (Table 5). Comparison of the county-level trends in SAC pre-treatment hookworm prevalence and treatment coverage is outlined in Figure 2D.
Correlations Between Prevalence and Treatment Coverage for PSAC Group
Data from all surveys suggested significant but a weak negative correlation between treatment coverage and undifferentiated STH prevalence (r = −0.144, p = 0.002) (Table 6). At Years 3 and 5, no overall significant correlation was observed while at Y6, undifferentiated STH was significantly but weakly positively correlated with treatment coverage (r = 0.277, p < 0.001). Differing county-level correlations for undifferentiated STH were observed over all time points and during Y3, Y5, and Y6, as shown in Table 6. In one county, Migori, there was a strong (r > 0.7) significant negative correlation between prevalence and treatment coverage overall; nine other counties had a weak (r < 0.7) significant negative correlation overall. Ten of the 20 counties showed no overall significant correlation. At Y3, no strong significant negative or positive correlation was seen in any county, but weak negative and positive correlations were seen in four and three counties, respectively. At Y5, no strong correlations were seen as well, but weak negative correlations were seen in three counties. At Y6, a strong negative correlation was seen in Kisii (r = −0.712, p < 0.001), with weak negative correlation seen in Bungoma County and strong positive correlation seen in Bomet County. Whilst the general trend amongst those correlations that were significant was for negative rather than positive correlations, only two counties, Narok and Vihiga, showed statistically significant negative correlations across each consecutive time point (Y3 and Y6). Further, frequently there were insufficient PSAC observations to analyze correlations at county level at separate time points.
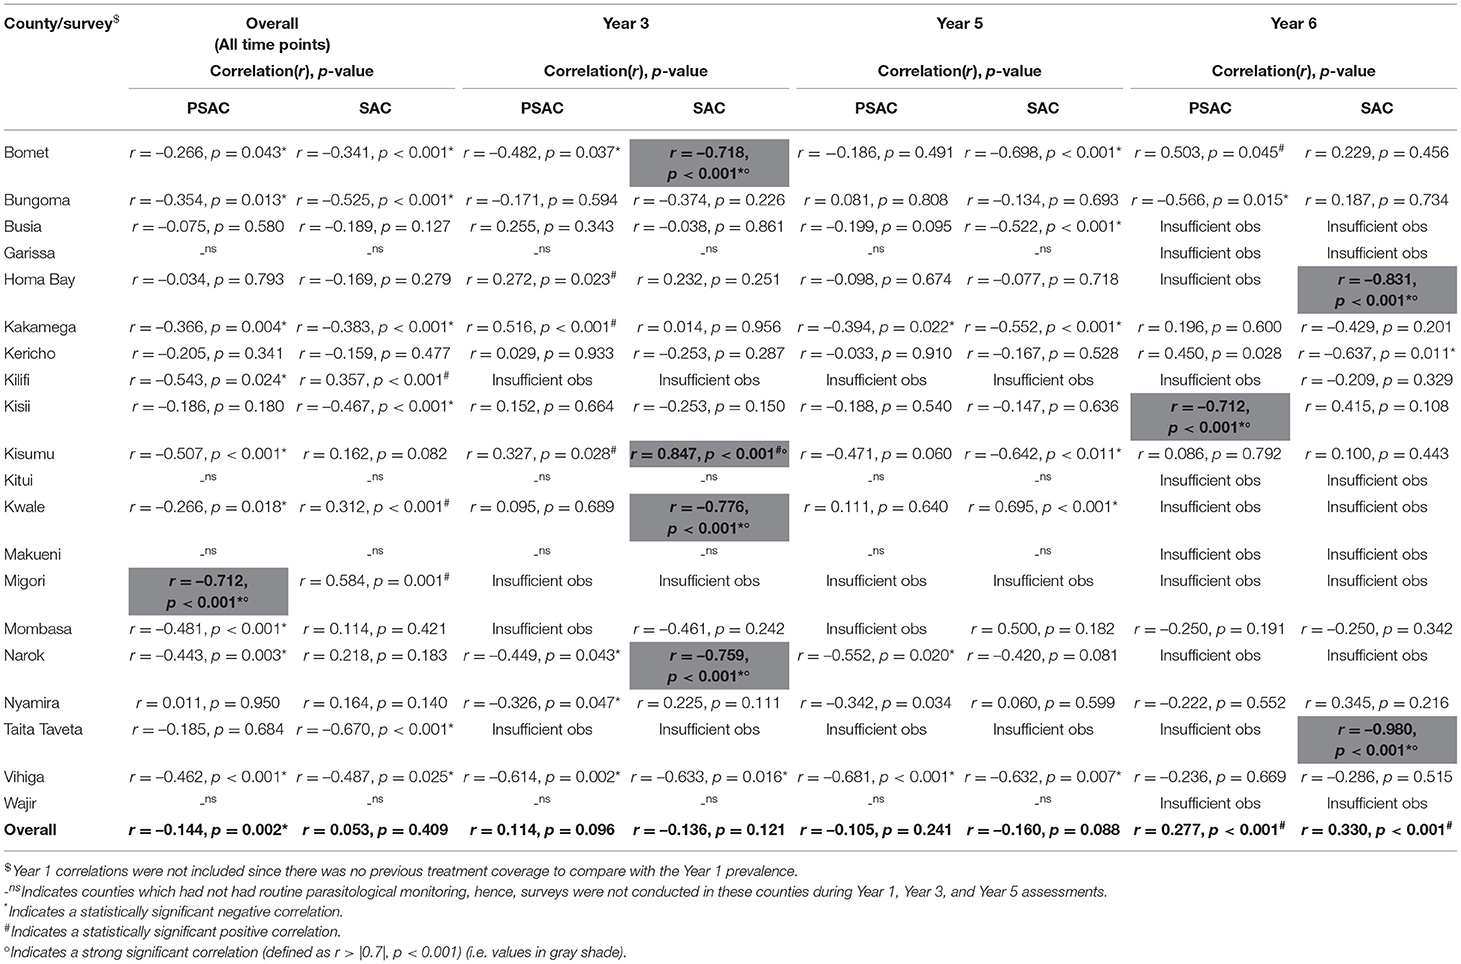
Table 6. Overall and survey time point correlations between pre-treatment undifferentiated STH prevalence of infection and previous year treatment coverage by county among pre-school (PSAC) and school (SAC) aged group of children in Kenya.
For differentiated STH across all time points, treatment coverage was only significantly (but weakly) negatively correlated with hookworm infection (r = −0.307, p < 0.001) while no significant correlations were found between either A. lumbricoides (r = −0.081, p = 0.111) or T. trichiura (r = −0.016, p = 0.697) and treatment coverage. Across all time points, hookworm was strongly, significantly and negatively correlated with treatment coverage in two counties; Kilifi (r = −0.809, p < 0.001) and Migori (r = −0.716, p < 0.001), but weakly, significantly and negatively correlated with treatment coverage in 10 counties. A. lumbricoides was weakly, significantly and negatively correlated with treatment coverage in three counties; Narok (r = −0.319, p = 0.011), Taita Taveta (r = −0.501, p = 0.039), and Vihiga (r = −0.420, p < 0.001). Similarly, T. trichiura was weakly, significantly and negatively correlated with treatment coverage in two counties; Mombasa (r = −0.481, p < 0.001) and Vihiga (r = −0.286, p = 0.003), and weakly, significantly and positively correlated in two counties; Kilifi (r = 0.100, p = 0.009) and Taita Taveta (r = 0.296, p = 0.034) (Table 7).
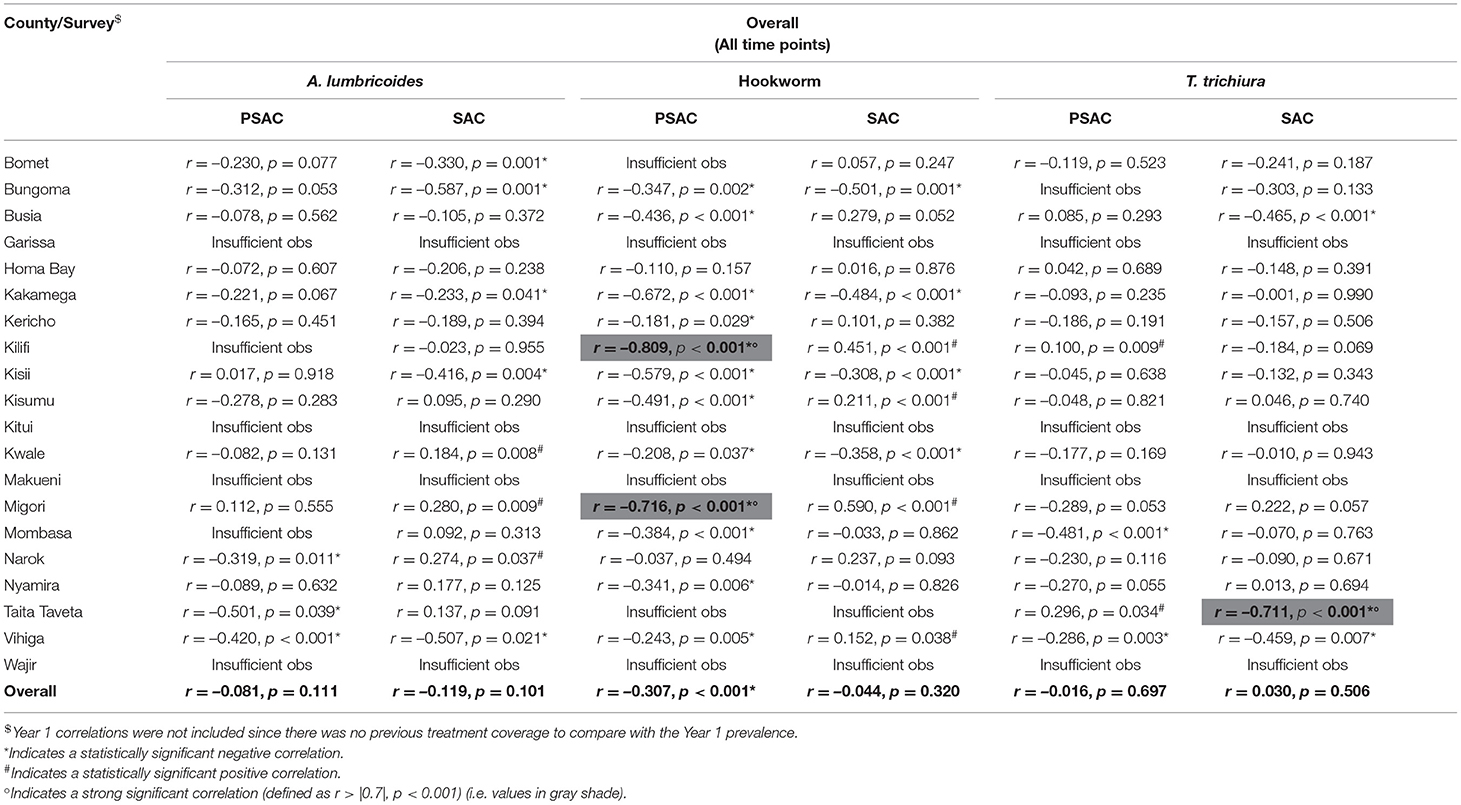
Table 7. Overall correlations between pre-treatment differentiated STH prevalence of infection and previous year treatment coverage by county among pre-school (PSAC) and school (SAC) aged group of children in Kenya.
County-level correlations, for each specific survey time point, for the differentiated STH infections are outlined in the Supplementary Table 1. Over all counties, A. lumbricoides prevalence had a significant weak positive correlation with treatment coverage at the Y6 survey (r = 0.325, p < 0.001) (Supplementary Table 1); there were no other significant correlations (either negative or positive) over all counties seen for any species at any other survey time points. By county, the only strong correlation seen was in Y6 in Kisii, where a significant positive correlation was seen (r = 0.824, p = 0.001). Whilst other significant negative or positive, correlations were seen within counties at different time points, they were weak, with again no trend emerging across time points for any differentiated STH within any county. Often, there were again insufficient observations to assess this at county level by time point.
Ascaris lumbricoides infection was weakly, significantly and negatively correlated with treatment coverage in Bomet (r = −0.664, p < 0.001), Nyamira (r = −0.326, p = 0.047), and Vihiga (r = −0.614, p = 0.002) counties during Y3; Kakamega (r = −0.376, p = 0.030), Kisii (r = −0.545, p = 0.028), Nyamira (r = −0.342, p = 0.034), and Vihiga (r = −0.669, p < 0.001) during Y5; and Bungoma (r = −0.604, p = 0.014) and Kisii (r = −0.625, p = 0.002) during Y6. However, it was significantly positively correlated with the treatment coverage in Busia (r = 0.471, p = 0.010) and Kakamega (r = 0.516, p < 0.001) counties during Y3, and Bomet (r = 0.503, p = 0.045) and Kericho (r = 0.450, p = 0.028) during Y6 (Supplementary Table 1).
Hookworm infection showed weak significant negative correlations only in Busia County (r = −0.326, p = 0.048) during Y3; in Homabay (r = −0.312, p = 0.006), and Kakamega (r = −0.224, p = 0.049) during Y5 survey. However, no significant (negative or positive) correlation was observed during Y6 survey (Supplementary Table 1).
Trichuris trichiura showed weak significant negative correlations in Kericho (r = −0.400, p = 0.016) and Narok (r = −0.459, p = 0.041) counties during Y3 survey; in Kisii (r = −0.504, p = 0.014) and Narok (r = −0.597, p = 0.001) during Y5 survey; and a strong negative correlation in Kisii County (r = −0.824, p < 0.001) during Y6 survey. However, it showed a significant positive correlation in Homabay (r = 0.200, p = 0.020) during Y3 (Supplementary Table 1).
Geographical distribution of undifferentiated STH pre-treatment prevalence overlaid with the previous year's treatment coverage for the PSAC group is shown in Figure 3, the figure helped to visualize the PSAC county and/or subcounty level correlations between prevalence and treatment coverage. Even though, it can be observed that the PSAC prevalence appeared to have reduced over the years, it was still high especially in many areas in Western parts of Kenya. Further, we noted that the treatment coverage during all the survey years was high (>75%), however, this high coverage did not clearly translate to low PSAC prevalence in the respective areas.

Figure 3. Geographical distribution of the undifferentiated STH pre-treatment prevalence overlaid with the previous year treatment coverage (A: Year 1, B: Year 3, C: Year 5, and D: Year 6) for the preschool aged (PSAC) group of children in Kenya.
Correlations Between Prevalence and Treatment Coverage for SAC Group
Table 6 outlines the correlations between pre-treatment undifferentiated STH prevalence and previous year's treatment coverage among SAC for Y3, Y5, and Y6 surveys. A weak significant positive correlation was observed during Y6 (r = 0.330, p < 0.001), this indicated that prevalence of STH continued to increase even as coverage increased. Nonetheless, these overall correlations mask underlying negative and positive county-level correlations. In overall, weak negative county-level correlations were observed in Bomet (r = −0.482, p = 0.037), Bungoma (r = −0.525, p < 0.001), Kakamega (r = −0.383, p < 0.001), Kisii (r = −0.467, p < 0.001), Taita Taveta (r = −0.670, p < 0.001), and Vihiga (r = −0.487, p = 0.025), with a weak positive correlation in three counties; Kilifi, Kwale, and Migori. During Y3 survey, strong negative correlations were observed in Bomet (r = −0.718, p < 0.001), Kwale (r = −0.776, p < 0.001), and Narok (r = −0.759, p < 0.001), and weak negative correlation in Vihiga, and further, a strong positive correlation observed in Kisumu (r = 0.847, p < 0.001). During Y5 survey, no strong correlation was observed but weak negative correlations were observed in six counties. During Y6 survey, strong negative correlations were observed in two counties; Homabay (r = −0.831, p < 0.001) and Taita Taveta (r = −0.980, p < 0.001), with a weak negative correlation in Kericho.
Overall correlations between Ascaris lumbricoides infection prevalence and treatment coverage is shown in Table 7, and this overall correlation was non-significant. However, five counties; Bomet, Bungoma, Kakamega, Kisii, and Vihiga showed weak significant negative correlations, while Kwale and Migori indicated a weak significant positive correlation (Table 7). Specific survey time point correlations are shown in the Supplementary Table 1. During Y3 survey, strong significant negative correlations were observed in Bomet (r = −0.727, p < 0.001) and Kisumu (r = −0.721, p = 0.047), a weak significant negative correlation in Vihiga (r = −0.613, p = 0.029). During Y5, weak significant negative correlations were observed in Bomet (r = −0.670, p < 0.001), Kakamega (r = −0.527, p < 0.001), Kisumu (r = −0.608, p = 0.013), and Vihiga (r = −0.645, p = 0.004). During Y6, a strong significant negative correlation was observed in Taita Taveta (r = −0.980, p < 0.001), and weak significant negative correlation in Kericho (r = −0.675, p = 0.002) (Supplementary Table 1).
Overall correlation between hookworm infection prevalence and treatment coverage is shown in Table 7, and this overall correlation was non-significant. However, five counties; Bomet, Bungoma, Kakamega, Kisii, and Vihiga showed overall weak significant negative correlations, while Kilifi, Kisumu, Migori, and Vihiga indicated a weak significant positive correlation (Table 7). Specific survey time point correlations are shown in the Supplementary Table 1. During Y3 survey, weak significant negative correlations were observed in Kwale (r = −0.626, p = 0.003) and Mombasa (r = −0.100, p = 0.001), and a weak significant positive correlation in Busia (r = 0.456, p = 0.005), and Kisumu (r = 0.676, p < 0.001). During Y5, weak significant negative correlations were observed in Kakamega (r = −0.431, p < 0.001) and Narok (r = −0.421, p = 0.008), while weak significant positive correlations were observed in Busia (r = 0.692, p < 0.001), Kericho (r = 0.495, p = 0.009), Kisii (r = 0.556, p = 0.014), and Kwale (r = −0.497, p = 0.010). During Y6, weak significant negative correlations were observed in Kakamega (r = −0.461, p = 0.048) and Vihiga (r = −0.670, p < 0.001) (Supplementary Table 1).
Overall correlation between Trichuris trichiura infection prevalence and treatment coverage is shown in Table 7, and this overall correlation was non-significant. However, one county; Taita Taveta (r = −0.711, p < 0.001), showed a strong significant negative correlation, while Busia and Vihiga showed weak significant negative correlations (Table 7). Specific survey time point correlations are shown in Supplementary Table 1. During Y3 survey, strong significant negative correlations were observed in Kisii (r = −0.708, p < 0.001) and Kwale (r = −0.967, p < 0.001), and weak significant negative correlations in Narok (r = −0.637, p < 0.001), and Vihiga (r = −0.617, p < 0.001). During Y5, a strong significant negative correlation was observed in Narok (r = −0.706, p < 0.001) and strong significant positive correlations in Kwale (r = 0.798, p < 0.001) and Nyamira (r = 0.946, p < 0.001). Further, weak significant negative correlations were observed in Bomet, Busia, Kakamega, and Vihiga. During Y6, a strong significant negative correlation was observed in Homabay (r = −0.903, p < 0.001), and weak significant negative correlations in Kisii and Mombasa (Supplementary Table 1).
Geographical distribution of undifferentiated STH pre-treatment prevalence overlaid with the previous year's treatment coverage for the SAC group is shown in Figure 4, the figure helped to visualize the SAC county and/or subcounty level correlations between prevalence and treatment coverage. From the figure, it can be observed that the SAC prevalence had reduced tremendously over the years, in most subcounties, the treatment coverage was high (>75%). Actually, in most areas especially during Y6 where the treatment coverage was above 75%, the prevalence was seen to be below 20% (these areas can be analogously viewed as portraying negative correlations). On the other hand, some areas did show high prevalence of 20% and above despite their subcounty treatment coverage being above 75% (these areas can be seen to portray positive correlations). However, there was no clear pattern of this correlation in the map, indicating heterogeneity in the subcounty/county correlation analysis.

Figure 4. Geographical distribution of the undifferentiated STH pre-treatment prevalence overlaid with the previous year treatment coverage (A: Year 1, B: Year 3, C: Year 5, and D: Year 6) for the school aged (SAC) group of children in Kenya.
Minimum Coverage for Sustained Reductions in Prevalence
Analysis of the minimum treatment coverage required to ensure a reduction of the infection prevalence over time for both age groups was demonstrated by use of the non-linear relationship curves. Observed non-linear relationships between STH prevalence and previous year treatment coverage is shown in Figure 5. From the figure, it was observed that for program-wide reduction of undifferentiated STH in both PSAC and SAC, a likely minimum treatment coverage of 82% is required. Additionally, for each differentiated STH species, likely minimum treatment coverage of 85% for hookworm, 84% for A. lumbricoides, and 74% for T. trichiura is required to be maintained.

Figure 5. Non-linear relationship between STH infections prevalence (A: Undifferentiated STH, B: Ascaris lumbricoides, C: Hookworm, and D: Trichuris trichiura) and treatment coverage for year 1, year 3, and year 6 survey time points among the general children population (both PSAC and SAC combined) in Kenya. Note that Year 1 was not displayed since there was no previous year treatment coverage to compare with the baseline prevalence.
Change Point Analysis
Change point analysis was performed to investigate the survey year points associated with significant changes in prevalence following the previous year(s) MDA. From this analysis, it was determined that a significant change in PSAC undifferentiated prevalence occurred during Y2 survey (i.e., after one round of MDA) for all the STH infections except T. trichiura, which didn't show any significant change points in prevalence (Figure 6).
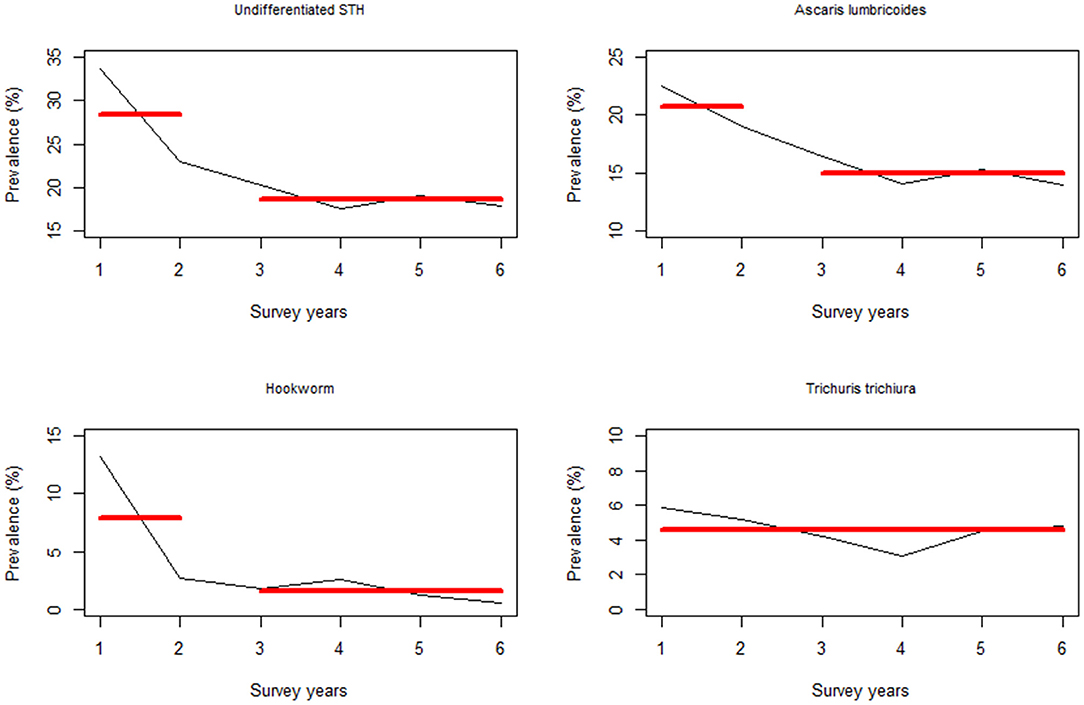
Figure 6. Change point analysis using binary segmentation method for the pre-treatment prevalence (%) among the preschool aged (PSAC) group of children in Kenya.
Additionally, the change points associated with the SAC infection prevalence occurred during Y2 survey time point for undifferentiated STH and hookworm infection, while for A. lumbricoides it occurred during Y3 (i.e., after two rounds of MDA). Similarly, there was no significant change points associated with T. trichiura (Figure 7).
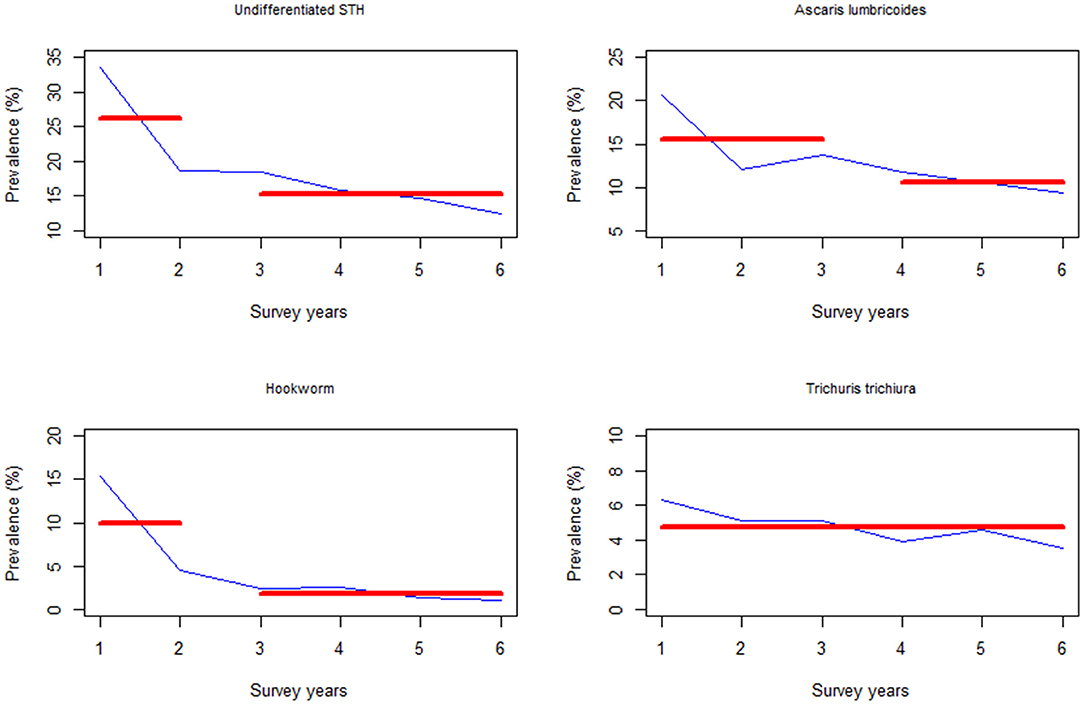
Figure 7. Change point analysis using binary segmentation method for the pre-treatment prevalence (%) among the school aged (SAC) group of children in Kenya.
Discussion
In this study, we quantified the correlation between the observed school level STH prevalence and treatment coverage, in order to understand how treatment coverage influenced observed reduction or increase in prevalence at county level. Past mathematical models have predicted that high sustained treatment coverage levels (above 75%) in low and medium transmission settings can eventually result in transmission interruption, but in high transmission areas the high coverage needs to be coupled with biannual treatment frequency and extended to include adults, in order to achieve transmission interruption (28). In addition, we provided analysis comparing the STH infections prevalence among PSAC and SAC groups of children within schools participating in M&E activities of the Kenyan NSBD program at four key evaluation survey time points following 6 years of sustained annual mass treatment. This will provide information to Kenyan STH control programs about STH burden among the two most vulnerable populations in the country. Previous studies of data from M&E activities as part of the NSBD program have focused on infection burden in the general school going children population without disaggregation between these two critical age groups (14–17).
Average treatment coverage through all six surveys was reportedly above 78%, which exceeds the WHO minimum effective treatment coverage level of 75% (19). In each age group, the yearly treatment coverage was also above 75% with the exception of PSAC during Y1 where coverage was only an average of 21.6% across counties. This was likely due to the initially low awareness of the program only offering treatment to enrolled children resulting in non-enrolled PSAC, a likely substantial proportion, being left untreated. County-level treatment coverage among each age group was heterogeneous and varied from year to year. Efforts should be made by the NSBD program to ensure that county level treatment coverage remains above the WHO recommended thresholds.
PSAC and SAC Infection Prevalence
After 6 years of MDA and rigorous M&E, we found that 17.9% of PSAC and 12.5% of SAC were infected with at least one STH infection, noting that both groups of children had similar infection burdens just prior to the implementation of the NSBD program (Y1). Our analysis suggested a slightly higher infection burden among PSAC than SAC. The fact that PSAC children still harbor a higher burden of STH infection points to a missed opportunity for treating this vulnerable group of children by STH control programs during deworming activity. Consideration should be given to increasing the deworming coverage for PSAC.
Prevalence of differentiated STH infections differed across age structures, with A. lumbricoides being prevalent among PSAC while hookworm and T. trichiura being predominant among SAC across all surveys. This finding is in line with the current research pointing to an increase in hookworm and T. trichiura prevalence and intensity with age (29–31). This suggests that the NSBD program might have had less impact on the community-wide prevalence where these two infections are likely be common, especially among adults (32, 33). As suggested in previous studies, a large burden of STH infections are likely harbored in adults, underscoring the importance of potentially broadening treatment coverage to encompass the general community (28, 32).
An overall significant decline in prevalence for undifferentiated STH infections and specifically for hookworm and A. lumbricoides in both groups of children was observed, however, prevalence reductions for T. trichiura were only significant among SAC and not significant among PSAC. Previous studies have shown that single dose oral albendazole is efficacious against these two species of STH (34–36), but likely less efficacious against T. trichiura (34–37). Again, the observed non-significant reductions especially for T. trichiura could be due to the changing treatment coverage levels among each group of children, and differing county level coverage as well as considerable fluctuations in coverage targets and reported coverage within counties over time. For significant prevalence reductions to be observed for T. trichiura, higher treatment coverage levels may be warranted. Alternately dual drug therapy involving ivermectin co-administered with albendazole or mebendazole may be effective (38).
Correlations Between Prevalence and Treatment Coverage for PSAC and SAC Groups
Correlational analysis suggested that prevalence reduced as treatment coverage increased or maintained at sufficient coverage level. Counterintuitively however, other analyses suggested infection prevalence increased or remained high despite high (or an increase in) treatment coverage. This suggests that increases in treatment coverage alone are not sufficient to influence reductions in infection prevalence. This finding is emphasized if a sudden increase in treatment coverage is followed a spell of consistently low coverage levels.
Correlational analyses are useful for investigating the relationship between STH prevalence and MDA coverage, however these remain non-causal. As a general rule, under the methods followed in this study, correlations of r < 0.7 are seen as relatively weak with too much potential for chance or confounding to be interpreted as meaningful. For this reason, even where statistically significant, weak correlations coupled with small sample sizes are particularly problematic to interpret. Insufficient sample sizes especially at the county level were a major barrier in this study. In the analyses that were conducted, the “overall” (all counties, all time points) correlations remain most reliable for inferring potential relationships, largely due to larger sample sizes.
Overall, across all survey time points, significant negative correlations between infection prevalence and treatment coverage were observed for undifferentiated STH infections among PSAC, however not for SAC. This suggests that treatment coverage directly affects reductions in PSAC prevalence. This finding however, may be influenced by relatively few PSAC being included in the M&E surveys, compared to their SAC counterparts.
County level correlations were observed between increased coverage in MDA and reductions in prevalence; for both PSAC and SAC in Bomet, Bungoma, Kakamega, and Vihiga counties; for PSAC only in Kilifi, Kwale, Mombasa, Kisumu, and Migori; and for SAC only in Kisii and Taita Taveta. The observed significant negative correlations in the coastal counties of Kilifi, Kwale, Mombasa, and Taita Taveta may be attributed to additional community-wide treatments provided by other partner programs that used albendazole. For instance, the Kenyan Lymphatic filariasis Elimination Program has annually provided, on average, 10 rounds of antifilarial tablets; diethylcarbamazine citrate (DEC) and albendazole to the entire at-risk populations aged 2 years and above for community-wide treatment and control of Lymphatic filariasis in six counties of the coastal region since 2002 (39). Similarly, observed significant negative correlations in western region counties, especially Bungoma, Kakamega, and Vihiga, may be attributed to supplementary treatment, and revamped water, sanitation and hygiene (WASH) interventions by the WASH Benefits Study which provided interventions to households in 702 villages between November 2012 and May 2014 (40). These examples of additional treatment by partner programs illustrate that the provision of school-based deworming coupled with community based treatment, as well as contemporary interventions like WASH, may lead to achievement of significant reductions in prevalence.
Statistically significant correlations between increased coverage, and also increases in prevalence were mostly observed during Y6 survey for both PSAC and SAC for undifferentiated STH and specifically for A. lumbricoides. The positive correlations observed during this particularly survey year can be mainly attributed to the fact that many areas had received treatment below 75% during the past immediate MDA round compared to the preceding MDAs. Also, prevalence across many schools were still high at above 20%. County level significant positive correlations were observed in few counties such as Migori, Homabay, and Kisumu. Most of these counties had histories of limited additional interventions from partner programs and generally relied solely on school-based deworming as a mainstay control measure. This points to the fact that school deworming alone is not sufficient to provide high treatment coverage necessary to maintain sustained reductions in prevalence over long time periods.
The absence of a more pronounced relationship between increasing/maintained coverage and prevalence decreases may be explained by the non-linear relationship between infection prevalence and treatment coverage as outlined in Figure 5. What we see from this figure is that treatment coverage likely needs to be maintained above a critical minimum level in order to achieve a sustained reduction in prevalence. We note that, minimum coverage level varies by survey time point as well as individual STH species. However, for the possible elimination of STH as a public health problem by treatment alone, minimum treatment coverage needs to be maintained above 85%. We appreciate that, our findings differ from the WHO recommended minimum coverage level of 75% (19). However, this is expected as infection levels in Kenya have substantially reduced since the inception of the NSBD program and therefore higher treatment coverage levels are necessary to “mob up” remaining prevalence.
Among PSAC, low coverage coupled with small sample sizes especially at county level, essentially resulted in a lack of statistical power to conduct correlation analysis at county-level and likely contributed to variability across results. It should further be noted that the prevalence surveys used in this analysis were not designed for county-level analyses, and are themselves insufficiently powered at the county level for strong conclusions to be drawn. As county level treatment coverage among PSAC was well-below 75% at most time points, and the proportion of PSAC at each time point represented treatment-naïve children who would have only just become old enough to start receiving treatments, it is not possible to conclude that a lack of reduction in prevalence is due to resurgence of infection between MDA rounds. However, these results do indicate that there are either considerable numbers of untreated PSAC and/or that there is high transmission occurring from the environment in which these children live.
The emergence of very few strong correlations at county levels could be possibly due to variability between levels of treatment coverage and infection prevalence across different counties year-on-year, accompanied by generally low numbers both for coverage and prevalence at county level, negating the opportunities to find correlations both within and across time points. Lack of statistical power at county level, notwithstanding, this analysis has enabled us to identify areas which could benefit from more focused activities like detailed qualitative research in counties like Homabay, Kisumu, Migori, and other counties which showed positive correlations, either overall or at specific time points, especially among SAC. Such research would enable a greater understanding of why prevalence continues to rise despite relatively high coverage levels.
Change Point Analysis
Drawing from our change point analysis, there was a significant change in undifferentiated STH prevalence, specifically hookworm, after one round of MDA (where the change point occurred at Y2) in both groups of children. However, hookworm prevalence in subsequent years (i.e., after Y2) did not vary sufficiently to warrant detection of any change. This finding on hookworm suggests the high efficacy of treatment using albendazole on both PSAC and SAC, which has been widely demonstrated in other studies (34–36).
Change points associated with A. lumbricoides were observed during Y2 (for PSAC) and Y3 (for SAC). Again this finding suggests that albendazole is highly efficacious against this particular infection (34–36), and that the NSBD program has been able to significantly reduce the parasites prevalence after only 2 to 3 rounds of MDA in both groups. It is worthwhile to note that change point in the SAC group took a little longer to be realized and this could be as a result of the high levels of re-infections that are often associated with A. lumbricoides (37). Going forward, the NSBD program should take measures to address the issue of A. lumbricoides re-infections.
Finally, we did not observe any change points associated with T. trichiura infection (i.e., no detectable significant changes in prevalence over the years). As described above, the use of albendazole as the main anthelminthic drug by the NSBD program would unlikely lead to any significant reduction in T. trichiura. For T. trichiura to be eliminated as a public health problem, a drug combination needs to be used (38).
Study Strengths and Limitations
The main strength of this study was the ability to gather 6-year data from a large scale deworming programme in Kenya. It is our view the results presented in this study will be important in promoting MDA throughout Kenya, especially the age-differentiated MDA.
However, this study was not without limitations: (I) The schools surveyed by the M&E program since 2012 were sampled and statistically powered to detect changes in infection prevalence at the national and regional levels only. Introduction of devolution in 2013 after the start of the program, yielded the county system essentially by merging and/or splitting the existing districts. Hence, at this stage, county level analysis becomes insufficiently powered to give firm conclusions at county level due to the resulting small sample sizes and the inconsistent number of schools. (II) There were relatively few PSAC treated as well as examined for STH infections at each school location, this is because this group of children were not the main target of the program and were not necessarily enrolled in the participating schools and the program did not offer treatment or even conduct sample collection at household level, where they reside, rather these were done at school level. Hence, PSAC included in this study were majority drawn from children attending ECD classes as well as those who happen to be present in school during either treatment or sample collection. (III) The program used the Kato-Katz technique for examination of STH eggs in line with the WHO guidelines for examination of these infections in high endemic settings (18), however, this technique has previously been shown to be less sensitive in low endemic areas (41), which is particularly salient during years 5 and 6 in which prevalence reduced substantially. Therefore, the prevalence estimates presented here may be an under-estimation of the true population prevalence. (IV) Finally, it is important to note that the NSBD program currently only follows schools longitudinally and not individual children.
Conclusions
In this article, we have provided detailed information on PSAC and SAC infection prevalence, treatment coverage, relative reductions in prevalence, and correlation analysis between treatment coverage and infection prevalence. Our findings showed an initially higher burden of STH infections among both groups of children which declined steadily over the survey years. Significant negative correlations in some counties indicated that prevalence reduced over time as treatment coverage increased or remained at a sufficiently high level as previously determined by WHO. The absence of many strong significant negative correlations might be attributed to several factors including low baseline infection prevalence and/or low treatment coverage preventing elucidation of correlations, or other factors, not measured in this analysis, such as an insufficient number of treatment rounds, reinfections, insufficient WASH access, and/or reduced drug efficacy among other possible factors. Finally, for the first time in Kenya, the overlay of treatment coverage and prevalence data indicated that there are minimum treatment coverage thresholds needed to achieve a negative relationship ensuring that prevalence will decline as coverage increases, this imply that administration of MDA may be most impactful if applied at county level and maintained above key thresholds.
Data Availability Statement
The original contributions generated for the study are included in the article/Supplementary Material, further inquiries can be directed to the corresponding author/s.
Ethics Statement
The studies involving human participants were reviewed and approved by Kenya Medical Research Institute (KEMRI)'s Scientific and Ethics Review Unit (SSC Number 2206). Written informed consent to participate in this study was provided by the participants' legal guardian/next of kin.
Consent to Participate
Ethical approval for the original M&E study protocol was obtained from the Kenya Medical Research Institute (KEMRI)'s Scientific and Ethics Review Unit (SSC Number 2206). At county-level, approval was provided by the respective county health and education authorities. At school, written informed consent to participate in this study was provided by the participants' legal guardian/next of kin. Additionally, individual assent was obtained from each child before participation in the study. Further, the datasets for this additional analysis were requested from and approved by the KEMRI's M&E program and Evidence Action. All data used were anonymised.
Author Contributions
COk participated in the study design, data curation and analysis, developed the initial draft manuscript. SJC, MM, and COw participated in the study design, data curation, and interpretation of the findings. NO and GM provided additional review of the study design and interpretation of the findings. CM provided overall scientific guidance during the study design, analysis, and writing of the manuscript. All authors participated in the interpretation of the findings, read and approved the final manuscript.
Funding
The financial support for this study was provided by the END Fund, GiveWell and Epic Foundation via Evidence Action. COk is supported by Evidence Action through ESACIPAC, KEMRI as a Statistician, and further supported by GlaxoSmithKline (GSK) Africa Non-Communicable Disease Open Lab through the DELTAS Africa Sub-Saharan African Consortium for Advanced Biostatistics Training (SSACAB), grant number D1702270-01 as a PhD fellow. The funders had no role in the study design, data collection and analysis, decision to publish or preparation of the manuscript.
Conflict of Interest
The authors declare that the research was conducted in the absence of any commercial or financial relationships that could be construed as a potential conflict of interest.
Acknowledgments
A sincere thank you to the M&E team and Evidence Action team for providing the datasets necessary for this analysis. A special thank you to Katherine Williams who was the Senior Program Manager at Evidence Action and facilitated the acquisition of the treatment datasets from Evidence Action. This paper is published with the permission of the Director General, KEMRI.
Supplementary Material
The Supplementary Material for this article can be found online at: https://www.frontiersin.org/articles/10.3389/fpubh.2021.645522/full#supplementary-material
Abbreviations
CIs, Confidence intervals; DEC, Diethylcarbamazine citrate; ECD, Early childhood development; MDA, Mass drug administration; M&E, Monitoring and evaluation; NSBD, National school based deworming; NTDs, Neglected tropical diseases; PSAC, Preschool aged children; RR, Relative reduction; SAC, School aged children; SEM, Structural equation model; STH, Soil-transmitted helminths; WASH, Water sanitation and hygiene; WCA, Women of childbearing age; WHO, World Health Organization; Y1, Year 1; Y3, Year 3; Y5, Year 5; Y6, Year 6.
References
1. WHO. Soil-Transmitted Helminth Infections Fact Sheet. World Health Organization (2020). Available online at: https://www.who.int/news-room/fact-sheets/detail/soil-transmitted-helminth-infections (accessed December 11, 2020).
2. WHO. Preventive Chemotherapy in Human Helminthiasis: Coordinated Use of Anthelminthic Drugs in Control Interventions: A Manual for Health Professionals and Programme Managers. (2006). Available online at: https://books.google.com/books?hl=en&lr=&id=5qJvG5Eek1cC&oi=fnd&pg=PR4&dq=crompton+DWT&ots=If7pMUwijL&sig=vVmRIsifsQ21piIhaBGAdI0DUoU (accessed July 18, 2017).
3. Savioli L. Accelerating Work to Overcome the Global Impact of Neglected Tropical Diseases: A Roadmap for Implementation. Geneva: World Health Organization (2012). p. 1–42.
4. WHO. Soil-Transmitted Helminthiases: Eliminating Soil-Transmitted Helmnthiases as a Public Health Problem in Children. Prog Rep. (2012). p. 1–90. Available online at: https://apps.who.int/iris/bitstream/handle/10665/44804/9789241503129_eng.pdf (accessed August 18, 2019).
5. WHO. Working to Overcome the Global Impact of Neglected Tropical Diseases: First WHO Report on Neglected Tropical Diseases. Geneva: World Health Organization (2010).
6. Crompton DWT, Nesheim MC. Nutritional impact of intestinal helminthiasis during the human life cycle. Annu Rev Nutr. (2002) 22:35–59. doi: 10.1146/annurev.nutr.22.120501.134539
7. WHO. Investing to Overcome the Global Impact of Neglected Tropical Diseases: Third WHO Report on Neglected diseases 2015. Geneva: World Health Organization (2015). vol. 3; p. 91.
8. WHO. London Declaration on Neglected Tropical Diseases. Available online at: https://www.who.int/neglected_diseases/London_Declaration_NTDs.pdf (accessed April 16, 2020).
9. WHO. Update on the Global Status of Implemenation of Preventive Chemotherapy. World Health Organization (2020). Available online at: http://www.who.int/neglected_diseases/preventive_chemotherapy/PC_Update.pdf?ua=1&ua=1 (Accessed April 15, 2020).
10. Freeman MC, Akogun O, Belizario V, Brooker SJ, Gyorkos TW, Imtiaz R, et al. Challenges and opportunities for control and elimination of soil-transmitted helminth infection beyond 2020. PLoS Negl Trop Dis. (2019) 13:e0007201. doi: 10.1371/journal.pntd.0007201
11. Pullan RL, Gething PW, Smith JL, Mwandawiro CS, Sturrock HJW, Gitonga CW, et al. Spatial modelling of soil-transmitted helminth infections in Kenya: a disease control planning tool. PLoS Negl Trop Dis. (2011) 5:e958. doi: 10.1371/journal.pntd.0000958
12. CIFF. Kenya National School-Based Year 1 (2012-2013) Results Deworming Programme. (2013). Available online at: https://ciff.org/documents/17/Kenya_National_SchoolBased_Deworming_Programme_Year1_evaluation.pdf (accessed June 29, 2021).
13. Deworm the World - Evidence Action. Available online at: https://www.evidenceaction.org/dewormtheworld-2/ (accessed April 16, 2020).
14. Mwandawiro CS, Nikolay B, Kihara JH, Ozier O, Mukoko DA, Mwanje MT, et al. Monitoring and evaluating the impact of national school-based deworming in Kenya: study design and baseline results. Parasit Vectors. (2013) 6:198. doi: 10.1186/1756-3305-6-198
15. Okoyo C, Nikolay B, Kihara J, Simiyu E, Garn JV, Freeman MC, et al. Monitoring the impact of a national school based deworming programme on soil-transmitted helminths in Kenya: the first three years, 2012 - 2014. Parasit Vectors. (2016) 9:408. doi: 10.1186/s13071-016-1679-y
16. Mwandawiro C, Okoyo C, Kihara J, Simiyu E, Kepha S, Campbell SJ, et al. Results of a national school-based deworming programme on soil-transmitted helminths infections and schistosomiasis in Kenya: 2012–2017. Parasit Vectors. (2019) 12:76. doi: 10.1186/s13071-019-3322-1
17. Okoyo C, Campbell SJ, Williams K, Simiyu E, Owaga C, Mwandawiro C. Prevalence, intensity and associated risk factors of soil-transmitted helminth and schistosome infections in Kenya: impact assessment after five rounds of mass drug administration in Kenya. PLoS Negl Trop Dis. (2020) 14:e0008604. doi: 10.1371/journal.pntd.0008604
18. Katz N, Chaves A., Pellegrino J. A simple device for quantitative stool thick smear technique in Schistosomiasis mansoni. Rev Soc Bras Med Trop. (1972) 14:397–400.
19. WHO. Helminth Control in School-Age Children. A Guide for Managers of Control Programmes. World Health Organization (2011). Available online at: http://apps.who.int/iris/bitstream/10665/44671/1/9789241548267_eng.pdf (accessed July 27, 2017).
20. Cheung MW-L, Chan W. Testing dependent correlation coefficients via structural equation modeling. Organ Res Methods. (2004) 7:206–23. doi: 10.1177/1094428104264024
21. Guarino AJ. A comparison of first and second generation multivariate analyses: canonical correlation analysis and structural equation modeling. Florida J Educ Res. (2004) 42:22–40.
22. Taylor WA. Change-Point Analysis: A Powerful New Tool For Detecting Changes. Analysis. Illinois, IL: Taylor Enterprises Inc (2006). p. 1–19.
23. Chen J, Gupta AK. Parametric Statistical Change Point Analysis: With Applications to Genetics, Medicine, and Finance. Massachusetts, MA: Birkhauser Boston (2014).
24. Killick R, Eckley IA. Changepoint: an R package for changepoint analysis. J Stat Softw. (2014) 58:1–19. doi: 10.18637/jss.v058.i03
25. R Core Team. R: A Language and Environment for Statistical Computing. R Found Stat Comput Vienna, Austria. (2019). Available online at: https://www.r-project.org/ (accessed October 21, 2020).
26. Wickham H. Ggplot2: Elegant Graphics for Data Analysis. New York, NY: Springer (2009). doi: 10.1007/978-0-387-98141-3
27. Savioli L, Albonico M, Daumerie D, Lo NC, Stothard JR, Asaolu S, et al. Review of the 2017 WHO Guideline: preventive chemotherapy to control soil-transmitted helminth infections in at-risk population groups. An opportunity lost in translation. PLoS Negl Trop Dis. (2018) 12:e0006296. doi: 10.1371/journal.pntd.0006296
28. Truscott JE, Turner HC, Anderson RM. What impact will the achievement of the current World Health Organisation targets for anthelmintic treatment coverage in children have on the intensity of soil transmitted helminth infections? Parasit Vectors. (2015) 8:551. doi: 10.1186/s13071-015-1135-4
29. Brooker S, Jardim-Botelho A, Quinnell RJ, Geiger SM, Caldas IR, Fleming F, et al. Age-related changes in hookworm infection, anaemia and iron deficiency in an area of high Necator americanus hookworm transmission in south-eastern Brazil. Trans R Soc Trop Med Hyg. (2007) 101:146–54. doi: 10.1016/j.trstmh.2006.05.012
30. Pullan RL, Kabatereine NB, Quinnell RJ, Brooker S. Spatial and genetic epidemiology of hookworm in a rural community in Uganda. PLoS Negl Trop Dis. (2010) 4:e713. doi: 10.1371/journal.pntd.0000713
31. Halliday KE, Oswald WE, McHaro C, Beaumont E, Gichuki PM, Kepha S, et al. Community-level epidemiology of soiltransmitted helminths in the context of school-based deworming: baseline results of a cluster randomised trial on the coast of Kenya. PLoS Negl Trop Dis. (2019) 13:e0007427. doi: 10.1371/journal.pntd.0007427
32. Anderson RM, Turner HC, Truscott JE, Déirdre Hollingsworth T, Brooker SJ. Should the goal for the treatment of soil transmitted helminth (STH) infections be changed from morbidity control in children to community-wide transmission elimination? PLoS Negl Trop Dis. (2015) 9:e0003897. doi: 10.1371/journal.pntd.0003897
33. Njenga SM, Mutungi FM, Wamae CN, Mwanje MT, Njiru KK, Bockarie MJ. Once a year school-based deworming with praziquantel and albendazole combination may not be adequate for control of urogenital schistosomiasis and hookworm infection in Matuga District, Kwale County, Kenya. Parasit Vectors. (2014) 7:74. doi: 10.1186/1756-3305-7-74
34. Vercruysse J, Behnke JM, Albonico M, Ame SM, Angebault C, Bethony JM, et al. Assessment of the anthelmintic efficacy of albendazole in school children in seven countries where soil-transmitted helminths are endemic. PLoS Negl Trop Dis. (2011) 5:e948. doi: 10.1371/journal.pntd.0000948
35. Keiser J, Utzinger J. Efficacy of current drugs against soil-transmitted helminth infections: systematic review and meta-analysis. J Am Med Assoc. (2008) 299:1937–48. doi: 10.1001/jama.299.16.1937
36. Bennett A, Guyatt H. Reducing intestinal nematode infection: efficacy of albendazole and mebendazole. Parasitol Today. (2000) 16:71–7. doi: 10.1016/S0169-4758(99)01544-6
37. Jia T-W, Melville S, Utzinger J, King CH, Zhou X-N. Soil-transmitted helminth reinfection after drug treatment: a systematic review and meta-analysis. PLoS Negl Trop Dis. (2012) 6:e1621. doi: 10.1371/journal.pntd.0001621
38. Turner HC, Truscott JE, Bettis AA, Hollingsworth TD, Brooker SJ, Anderson RM. Analysis of the population-level impact of co-administering ivermectin with albendazole or mebendazole for the control and elimination of Trichuris trichiura. Parasite Epidemiol Control. (2016) 1:177–87. doi: 10.1016/j.parepi.2016.02.004
39. Njenga SM, Kanyi HM, Mutungi FM, Okoyo C, Matendechero HS, Pullan RL, et al. Assessment of lymphatic filariasis prior to re-starting mass drug administration campaigns in coastal Kenya. Parasit Vectors. (2017) 10:99. doi: 10.1186/s13071-017-2044-5
40. Stewart CP, Kariger P, Fernald L, Pickering AJ, Arnold CD, Arnold BF, et al. Effects of water quality, sanitation, handwashing, and nutritional interventions on child development in rural Kenya (WASH Benefits Kenya): a cluster-randomised controlled trial. Lancet Child Adolesc Heal. (2018) 2:269–80. doi: 10.1016/S2352-4642(18)30025-7
41. Okoyo C, Simiyu E, Njenga SM, Mwandawiro C. Comparing the performance of circulating cathodic antigen and Kato-Katz techniques in evaluating Schistosoma mansoni infection in areas with low prevalence in selected counties of Kenya: a cross-sectional study. BMC Public Health. (2018) 18:478. doi: 10.1186/s12889-018-5414-9
Appendix
A1. The statistical correlations between infection prevalence and the previous year's treatment coverage were fitted using a structural equation model (SEM) of the following structure (Figure A1):
Keywords: correlation analysis, soil-transmitted helminths, treatment coverage, school-based deworming, prevalence, Kenya
Citation: Okoyo C, Campbell SJ, Minnery M, Owaga C, Onyango N, Medley G and Mwandawiro C (2021) Prevalence and Correlation Analysis of Soil-Transmitted Helminths Infections and Treatment Coverage for Preschool and School Aged Children in Kenya: Secondary Analysis of the National School Based Deworming Program Data. Front. Public Health 9:645522. doi: 10.3389/fpubh.2021.645522
Received: 23 December 2020; Accepted: 16 June 2021;
Published: 16 July 2021.
Edited by:
Hai-Feng Pan, Anhui Medical University, ChinaReviewed by:
Lianguo Fu, Bengbu Medical College, ChinaVeeranoot Nissapatorn, Walailak University, Thailand
Jean Tenena Coulibaly, Swiss Tropical and Public Health Institute (Swiss TPH), Switzerland
Copyright © 2021 Okoyo, Campbell, Minnery, Owaga, Onyango, Medley and Mwandawiro. This is an open-access article distributed under the terms of the Creative Commons Attribution License (CC BY). The use, distribution or reproduction in other forums is permitted, provided the original author(s) and the copyright owner(s) are credited and that the original publication in this journal is cited, in accordance with accepted academic practice. No use, distribution or reproduction is permitted which does not comply with these terms.
*Correspondence: Collins Okoyo, Y29tb25kaUBrZW1yaS5vcmc=; Y29sbGluc29tb25kaW9rb3lvQGdtYWlsLmNvbQ==