 Xiaowa Wang
 Hailun Pan1,2
 Xufei Wang
94% of researchers rate our articles as excellent or good
Learn more about the work of our research integrity team to safeguard the quality of each article we publish.
Find out more
ORIGINAL RESEARCH article
Front. Public Health, 03 August 2021
Sec. Radiation and Health
Volume 9 - 2021 | https://doi.org/10.3389/fpubh.2021.641915
This article is part of the Research TopicMedical Application and Radiobiology Research of Particle RadiationView all 16 articles
Objective: To investigate dosimetric deviations in scanning protons for Bragg-peak position shifts, which were caused by proton spiral tracks in an ideal uniform field of magnetic resonance (MRI) imaging-guided proton radiotherapy (MRI-IGPRT).
Methods: The FLUKA Monte-Carlo (MC) code was used to simulate the spiral tracks of protons penetrating water with initial energies of 70–270 MeV under the influence of field strength of 0.0–3.0 Tesla in commercial MRI systems. Two indexes, lateral shift (marked as WD) perpendicular to the field and a penetration-depth shift (marked as ΔDD) along the beam path, were employed for the Bragg-peak position of spiral proton track analysis. A comparison was performed between MC and classical analytical model to check the simulation results. The shape of the 2D/3D dose distribution of proton spots at the depth of Bragg-Peak was also investigated. The ratio of Gaussian-fit value between longitudinal and transverse major axes was used to indicate the asymmetric index. The skewness of asymmetry was evaluated at various dose levels by the radius ratio of circumscribed and inscribed circles by fitting a semi-ellipse circle of 2D distribution.
Results: The maximum of WD deflection is 2.82 cm while the maximum of shortening ΔDD is 0.44 cm for proton at 270 MeV/u under a magnetic field of 3.0 Tesla. The trend of WD and ΔDD from MC simulation was consistent with the analytical model, which means the reverse equation of the analytical model can be applied to determine the proper field strength of the magnet and the initial energy of the proton for the planned dose. The asymmetry of 2D/3D dose distribution under the influence of a magnetic field was increased with higher energy, and the skewness of asymmetry for one proton energy at various dose levels was also increased with a larger radius, i.e., a lower dose level.
Conclusions: The trend of the spiral proton track under a uniform magnetic field was obtained in this study using either MC simulation or the analytical model, which can provide an optimized and planned dose of the proton beam in the clinical application of MRI-IGPRT.
Proton radiotherapy, an advanced form of cancer treatment, can fulfill the aim of radiotherapy to achieve better dose conformality than photons due to the Bragg peak. It results in irradiating the target uniformly with the prescription dose, while sparing the adjacent healthy tissues and critical organs (1) nearby to the target. The treatment modality of proton radiotherapy reduces the integral dose over the body of patients due to a finite penetration of protons. However, proton radiotherapy is more susceptible to uncertainties of the geometrical variations, such as a misalignment of setup, the motion of the target, and also of inter-fractional anatomical changes, due to the limited knowledge of patient anatomy during the initial CT simulation during treatment planning (2, 3). Imaging-guided proton radiotherapy (IGPRT) is implemented to reduce susceptible uncertainties to compensate for any unexpected target changes, thus sparing the healthy tissues (4) with proper safety margins in the treatment planning protocols. Magnetic resonance imaging (MRI) systems provide good contrast of soft tissues between the tumor and organs at risk (OARs) (5–9); it is a prime candidate for IGPRT with several advantages over other imaging modalities. Compared to the computed tomography (CT) imaging, several studies demonstrated the advantages of MRI-based imaging-guided proton radiotherapy (IGRT) (5–13). The MRI-IGPRT using protons can reduce uncertainties in the proton therapy process that result in lower doses to the normal tissues.
However, the spiral track of the proton path from the Lorentz force in a magnetic field of MRI made a dose deviation on the delivered 2D/3D distribution by shifting the Bragg-peak position (14–19), which depends on the gantry angle leading to different incident direction and strength of the magnetic field in MRI. In this study, the characteristics of a tracked spiral proton path and induced 2D/3D dosimetry deviation under an ideal uniform magnetic field were investigated using the FLUKA Monte Carlo (MC) simulation with a built-in magnetic field module (20). The incident energy range was 70–270 MeV/u and perpendicular to the magnetic field of strength of 0.0–3.0 Tesla. The previous study employed an analytical model to evaluate the Bragg-peak position shift in the spiral tracks and performed a comparison with the MC simulation (21). The magnitude of asymmetry of maximum planar dose distributions was also investigated for each energy under the field strength of 3.0 Tesla under different dose levels.
This study was implemented for the clinical application of MRI-IGPRT. Accurate 2D/3D dose distribution of employed energies over different field strengths was generated first, and then the shift of Bragg-peak position in terms of the lateral shift (WD) perpendicular to the field and the penetration-depth shift (ΔDD) along the beam path was evaluated. The values of WD and ΔDD from MC simulation were also compared with that from an analytical model for proton energy over different field strengths. The asymmetric spot shape was investigated by the ratio of Gaussian-fit values between longitudinal and transverse major axes at the planar maximum dose distribution of each proton energy over 3.0 Tesla field strengths. Fitting a semi-ellipse circle of 2D distribution at each dose level, the skewness of asymmetry over various dose levels was also evaluated by the radius ratios of circumscribed and inscribed circles.
FLUKA (2011.2x) was implemented to simulate the interaction between active pencil-beam-scanning (PBS) proton and the magnetic field (20). Each simulated PBS proton beam entered a water phantom perpendicular to the uniform magnetic field as shown in Figure 1A. The red arrow indicates the entering PBS proton, while the green arrow shows the direction of the magnetic field. In Figure 1B, a schematic drawing for proton dose distribution, the straight path means without magnetic field and the spiral track means under the influence of a magnetic field in a cut plane over the directions of beam entrance and the magnetic field. The WD and ΔDD were used to evaluate the shift of Bragg-peak position in direction of transverse (i.e., perpendicular) and longitudinal (i.e., along) beam paths for the shifts. The “Angle def ” was the deflection of spiral track beam central axis. The insert of Figure 1B presents the characteristics for the 3D dose distributions of spiral proton tracks. Details of these parameters will be described later.
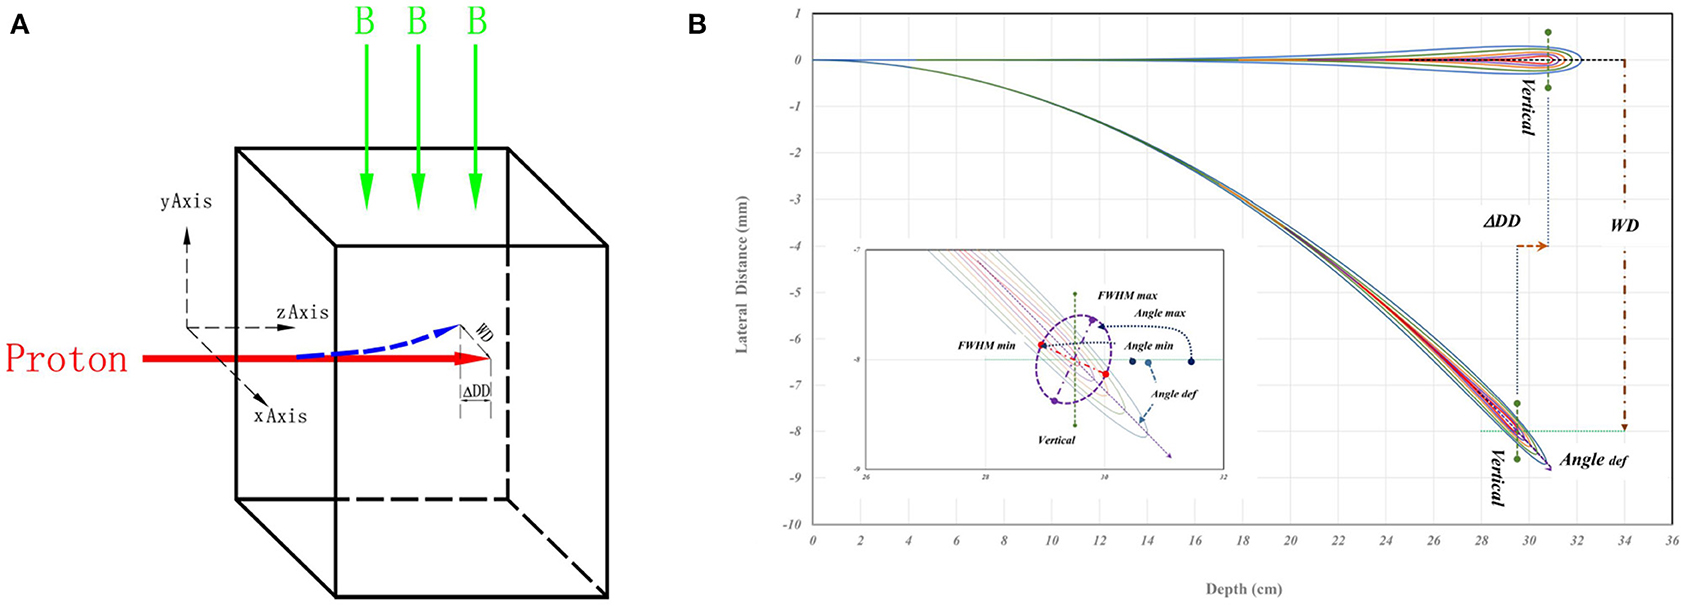
Figure 1. (A) A schematic drawing of simulation geometry with indicated directions of beam entrance and magnetic field. The proton beam vertically enters the water phantom from left to right, and the red arrow represents the beam. The green arrow is the direction of the magnetic field. (B) A schematic drawing for proton dose distributions as a straight path without magnetic field, and as a spiral track under the influence of magnetic field in a cut plane over the directions of beam entrance and the magnetic field. The WD and ΔDD were the shift of Bragg-peak position. The “Angle def ” is the deflection angle of spiral track beam central axis the. In the insert of (B), the maximum and minimum of the full width at half maximum (FWHM) and the major and minor axes of elliptical 2D distribution at the Bragg-peak location. The Angle max and Angle min are the angles of maximum and minimum full-width-half-maximum in the major and minor axes of doses passing the location of Bragg-peak. Details are in the text.
In MC simulations, protons were transported in a water phantom with a size of 20 × 20 × 35 cm3 (x, y, and z directions of the phantom geometry, and the distance in z direction is larger than the range of 270 MeV/u incident energy). Parameters of the hadron therapy to a 100 keV limit and cutoff range of transport 0.001458 mm were used in simulation for sufficient accuracy. The water phantom was binned to obtain 0.1 × 0.02 × 0.02 (z, x, and y directions of the phantom geometry) mm3 voxels. 3D dose distribution was simulated with 1 × 10¹⁰ particle histories in each spot with 5 mm sigma of 2D Gaussian lateral distribution at the entrance of the water phantom. The directional divergence of proton space was neglected in simulations because it was minimal in comparison with the lateral scattering spreading in water by the multiple Coulomb scattering (22). The statistical error of each simulation was <2% for local maximum value at the depth before the Bragg-peak. The statistical error of the results within 3 mm before and after the Bragg peak was controlled within 0.2%, while that of the low dose beyond 3 mm of Bragg peak was controlled within 4.0%. Simulations were performed with the proton energy of 70, 80, 90, 100, 110, 120, 130, 140, 150, 160, 170, 200, and 270 MeV/u under the magnetic field strength of 0, 0.5, 1.0, 1.5, 2.0, 2.5, and 3 Tesla, which covered the typical parameters used in proton radiotherapy. WD and ΔDD of spiral proton tracks were analyzed in each MC simulation.
Following the reference (21), the shift (WD or ΔDD) of Bragg-peak position can be calculated by the mathematical formula as shown in Equations (1)–(3). For a proton with kinetic energy E0, charge q = 1, and rest mass m entering perpendicularly to a magnetic field strength B, the shift of WDcan be calculated by either Equation (1) or (2), which correspond to non-relativistic and relativistic cases, respectively. For protons with energy of 70, 80, and 90 MeV/u, only Equation (1) was used to calculate the WD by considering the energy effect, while both Equations (1) and (2) were used to calculate the WD in an interval of 10 MeV for protons with energy 100–170 MeV.
Where p ≈ 1.75 and α ≈ 2.43×10⁻³ MeV−p cm in water for the fit parameter of proton stopping power in water.
The shift of ΔDD can be calculated by Equation (3).
The WD and ΔDD calculated with the upper equations at certain conditions were compared with corresponding values of MC simulations, and the reverse equations can be used to determine the required energy according to WD and ΔDD.
In addition to the shifts of Bragg-peak position, the 2D spot-shape become asymmetric under the influence of a magnetic field, and the asymmetry especially can be visually seen for the planar dose at the Bragg-peak. To evaluate the skewness of asymmetry of simulated planar 2D distribution, an analysis process using MATLAB (23) platform was used to investigate the referred macroscopic and microscopic aspects in this study. The analysis process includes: (1) Performing a Gaussian fit for obtaining the sigma of 1D distribution in the direction of transverse (x) and longitudinal (y) axes at the plane of the planar dose distributions; (2) Analyzing the ratio of obtained sigma in x/y axes with a field strength of 3.0 Tesla as a function of energy; and (3) Investigating the differences in the area of encompassed ellipse under the magnetic field concerning a standard circle without magnetic field, while the size of each standard circle in the plane depends on the dose level.
The processes of 1 or 2 analyze the data only in the x- or y-axis itself and refer to the macroscopic aspect. Because the minimum/maximum axis of ellipse cannot be on x/y axes, each ellipse can be fitted by minimalizing the area between an inscribed circle (IC) and a circumscribed circle (EC) where the IC is the maximum radius with the ellipse and the EC the minimum radius outside the ellipse. The process of 3 refers to the macroscopic aspect by involving the asymmetry at a dose level.
Although the deflection of spiral tracks causing the shifts of Bragg-peak position and the 2D dosimetric deviations in macroscopic and microscopic aspects described above, the major and minor axes of elliptical 2D distribution at the Bragg-peak location may not align with x/y axes related to the beam direction as shown in the insert of Figure 1B. The MATLAB code was used to analyze the FWHM of each line passing through the maximum dose point of the Bragg peak in each simulated 3D distribution. It is that the spatial positions of lines having maximum FWHMmax and minimum FWHMmim of each simulated 3D dose distribution were located. Based on the orientations of FWHM lines, the rotation angles of FWHMmax and FWHMmim lines to the beam incidence are the Anglemax and Anglemin as indicated in the insert of Figure 1B.
Each simulated depth dose was normalized to the maximum dose at the phantom surface. Figure 2A shows simulated depth doses for protons with an energy of 170 MeV/u under different field strengths. The insert of Figure 2A shows the shifts of ΔDD. Figure 2B shows the shifts of WD for various energies with different field strengths. Figure 2C shows the lateral profiles shifting under various field strengths. Figure 2D shows the beam deflection angles, calculated from WD and ΔDD, concerning the incident beam direction.
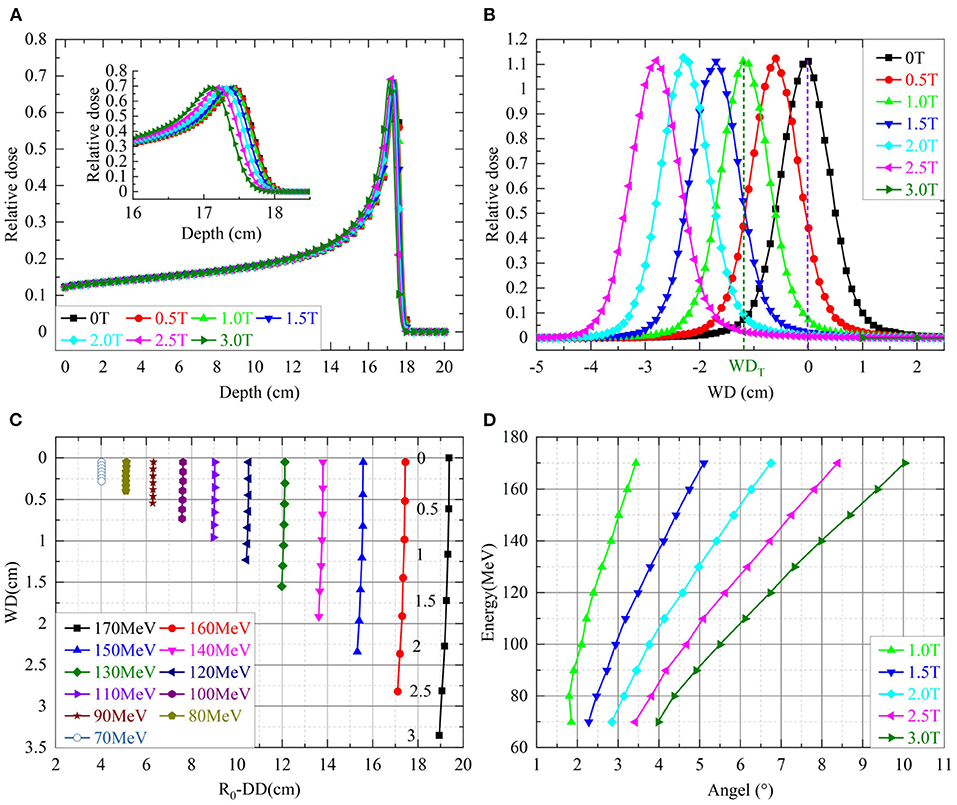
Figure 2. (A) Shows the simulated depth doses of protons with 170 MeV over different field strengths. The insert shows the details of depth doses near the Bragg-peak. (B) Shows the shifts of WD for various energies with different field strengths. The numbers next to the shifts of 170 MeV indicated corresponding field strengths. (C) Shows the lateral dose profiles of protons with 170 MeV over different field strengths in the axis of WD. (D) Shows the beam deflection angles for incidence beam direction.
Table 1 lists the percentage differences on WD from Equations of (1) or (2) to the simulations over proton energies of 100–170 MeV/u. Both smaller proton energy and a weaker magnetic field would result in a large percentage difference. The mean of percentage differences over listed energies for the Equations of (1) and (2) were 4.7 and 5.6%, respectively. However, the maximum absolute difference of WD between the analytical model and the MC simulation is around 0.5 mm.
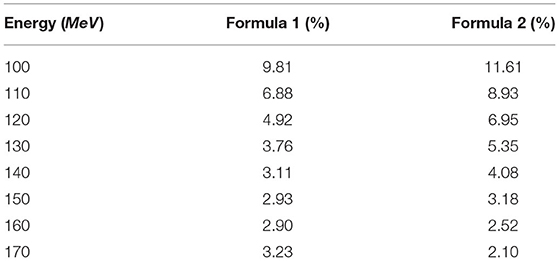
Table 1. The percentage differences of WDfor formulas 1 and 2 for simulations.
Table 2 shows the difference between the analytical model of Equation (3) and the MC simulation for various proton energies under different field strengths. The maximum difference is 0.1 mm.
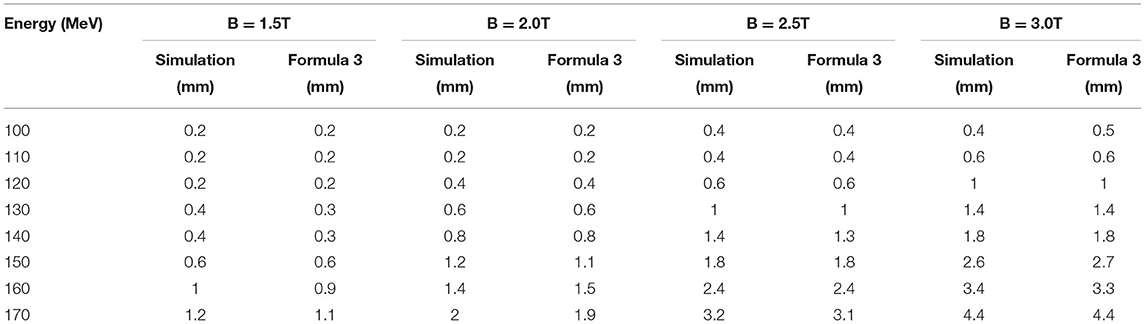
Table 2. Differences ofΔDD between the analytical model of the Equation (3) and the MC simulation.
Based on the position relationship between an OAR and the target, required ΔDD and WD can be determined. The Equations of (4) and (5) derived from the revision of Equations (1) and (3) can be used to determine the proton incident energy with a specific field strength to achieve an optimized delivered doses for MRI-IGPRT.
For example, to meet the required position of OARs for avoidance required a WD = 2.0 cm or ΔDD = 0.25 cm under a 3.0 Tesla of field strength; calculated incident energy E0 of the protons by formula 4 or 5 are 141 MeV/u or 148 MeV/u, respectively. The energy of protons was input to the MC simulation with a 3.0 Tesla of field strength. The MC simulated WD and ΔDD outcomes were 2 cm and 0.24 cm, respectively. Similar results validated that Equations (4) and (5) can be used for calculating the incident proton energy of required WD and ΔDD. In clinical practice, this approach by proper proton energy under a specified field strength could achieve the desired delivered doses of MRI-IGPRT.
Symmetric planar dose distributions at the depth of Bragg-peak without a magnetic field were observed in the top panels of Figure 3. However, asymmetric planar distribution for protons of 270 MeV/u appear under a field strength of 3.0 Tesla.
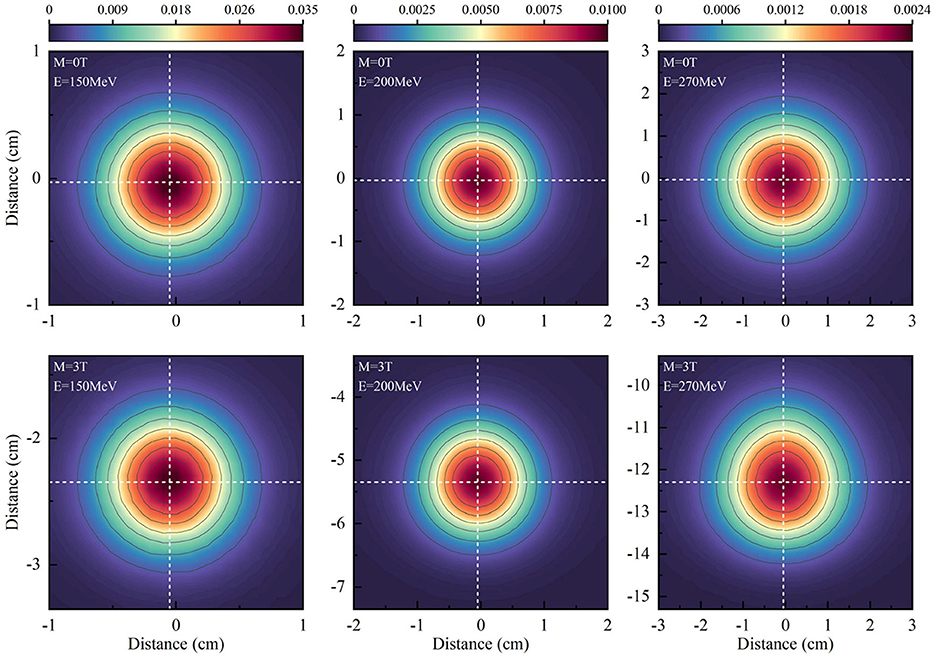
Figure 3. Shows the planar dose distributions at the Bragg-peak positions for protons without magnetic fields at the panels and under a field strength of 3.0 Tesla.
To analyze the characteristics of asymmetric planar distribution, the 1D distribution at the x-transverse and y- longitudinal axes from each panel of Figure 3 were extracted and presented in Figure 4. Each extracted 1D profile of the x- or y-axis was fit by Gaussian function. In the absence of a magnetic field, each 1D profile for different energies was symmetrical in comparison to each fit curve. The x-transverse profiles for various energies were still symmetrical even under a field strength of 3.0 tesla. However, y-longitudinal profiles were visually asymmetric at lower dose levels. These results indicated the unidirectional distortion of proton dose distributions under the magnetic fields.
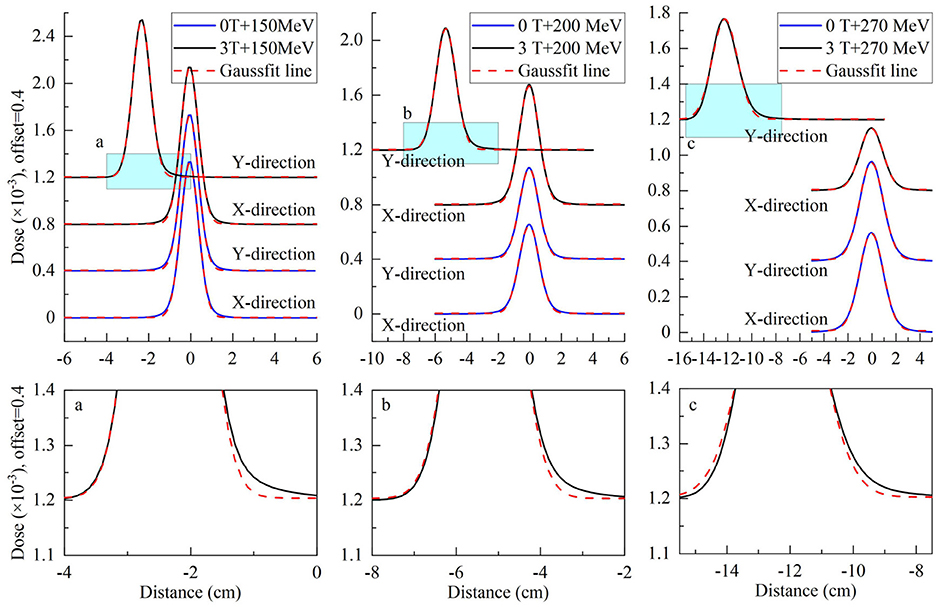
Figure 4. Top panels show extracted x-transverse and y-longitudinal 1D distributions in the solid blue curve with Gaussian fit curves in the dotted red curve for 2D dose distributions in Figure 3. Bottom panels show the detail of y-longitudinal distributions at lower dose levels.
Although the x-transverse profile is symmetric, the y-longitudinal profile is asymmetric under the magnetic fields. The changes of sigma widths are also different between x- and y-profiles under different field strengths. To present the ratio of sigma, widths on the Gaussian fits of x- and y-profiles were obtained and plotted in Figure 5 for various proton energies without magnetic field and under 3.0 Tesla. In the absence of a magnetic field, the axis ratios of longitudinal–transverse proton dose distributions were almost identical. Contrastively, in the presence of a magnetic field, the ratios increased with the enhancing energy, especially at energies > 150 MeV/u.
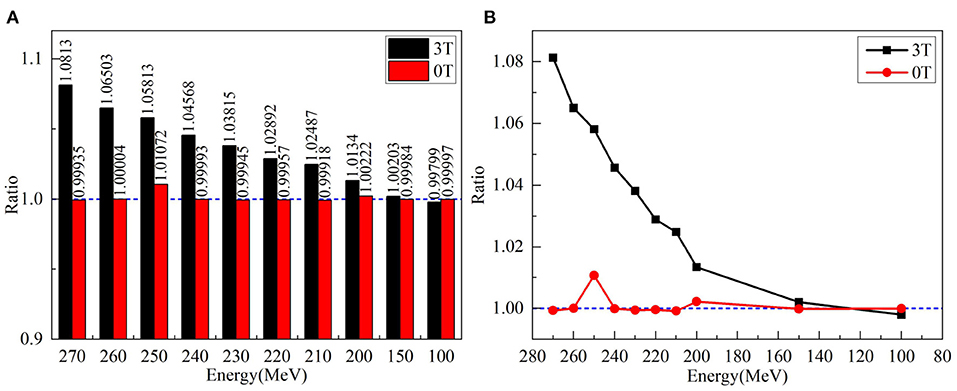
Figure 5. (A) Left panel shows the ratios of sigma widths on the Gaussian fits of x- and y-profiles for various proton energies without a magnetic field and under 3.0 Tesla. (B) The right panel showed the ratio of left panel by circles without magnetic field and by squares with a field strength of 3.0 Tesla.
Besides the ratios of sigma widths varying with the proton energy under different field strengths, the changes of sigma widths are different for the isodose curves at different dose levels as shown by the different size of isodose curves in Figure 6. Because the change of sigma width of each isodose curve is different between x and y axes, it results in an elliptical shape for each isodose curve under the influence of the magnetic field. By applying the fit process described above, the radii of IC/EC circles were obtained for each isodose curve to be plotted in Figure 7. The area differences of these circles exhibited a certain regularity in the presence of the magnetic field. The average radius differences for a field strength of 3.0 Tesla were twice those without a magnetic field.
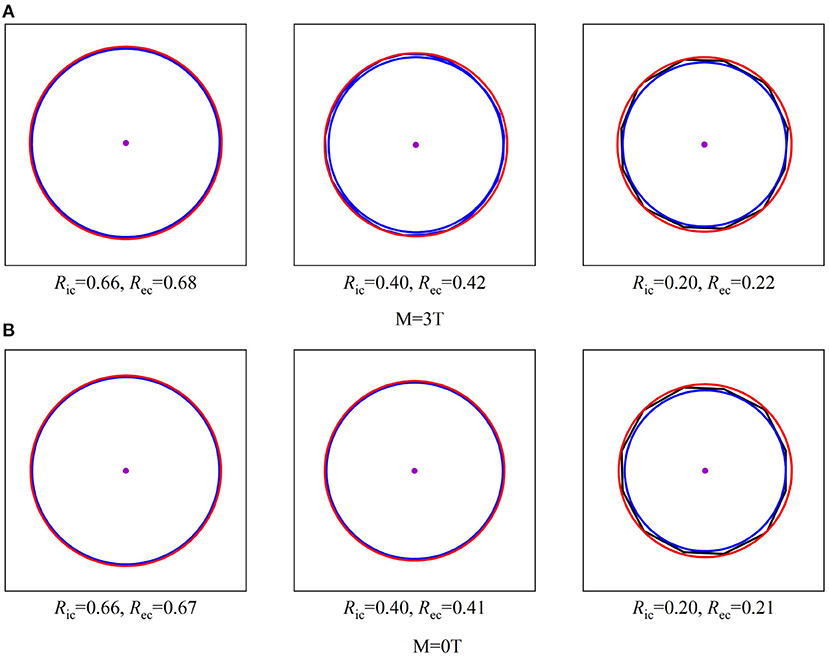
Figure 6. Shows three sizes of isodose curves for 150 MeV protons over three dose levels under a 3.0 Tesla field strength with (A) and without a magnetic field (B). The center point of each plot indicates the maximum dose at Bragg-peak position of each simulation. Each isodose curve was fit for a minimized area between the inscribed IC and EC circumscribed circles as described in the text to obtain the radii of IC and EC. When E = 150MeV.
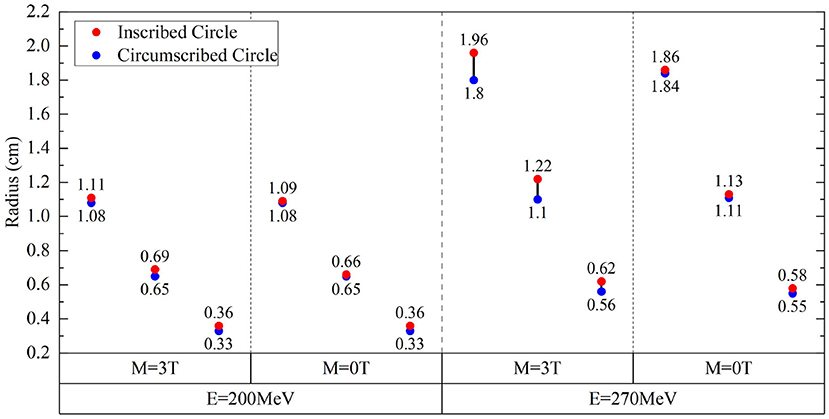
Figure 7. Radius differences of fitted IC/EC circle for isodose curves for protons of 200 and 270 MeV under the field strengths of 0.0 and 3.0 Tesla.
Figure 7 shows the radii for fit IC/EC circles of three isodose curves for protons with energies of 200 MeV/u and 270 MeV/u under the field strengths of 0.0 and 3.0 Tesla. The difference between IC and EC radii increases as the size of the isodose curve increases, i.e., lower dose level. The effect of a magnetic field for 200 and 270 MeV/u protons was three and five times stronger than 150 MeV/u protons, respectively. Figure 8 shows the trend of radius difference between the IC and EC circles for protons with energies of 150, 200, and 270 MeV/u as a function of radius without as magnetic field. Many standard radii were at the lower dose level. A general trend for larger differences with increased standard radius was seen for all three energies.
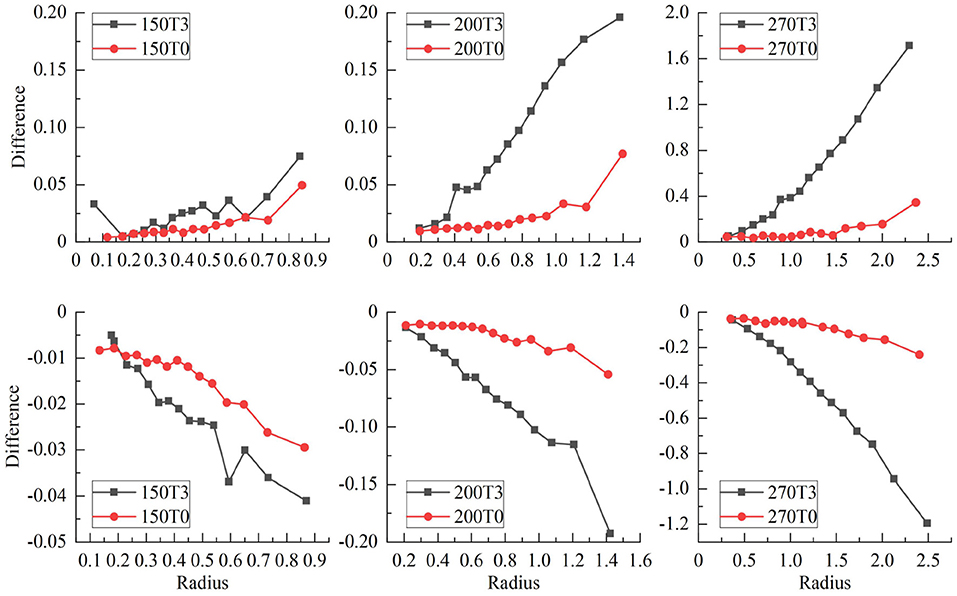
Figure 8. Shows the trend of radius difference between the IC and EC circles as a function of the radius in the standard circle for protons with energies of 150, 200, and 270 MeV.
As shown in the insert of Figure 1B, the FWHM of each line passing through the maximum dose point of the Bragg peak were analyzed. The lines passing the maximum and minimum of FWHM were rotated away from its initial orientation; it was initially aligned with the vertical axis as indicated in Figure 1B. Due to the re-orientation of major and minor axes of 3D dose distribution for protons passing a magnetic field, the plane formed by the major and minor axes is a certain angle with the beam incident direction as the elliptical circle indicated in the insert of Figure 1B. Extracted rotation angles of Anglemax and Anglemin are listed in Table 3 for protons with energies of 150, 200, and 270 MeV under a field strength of 3.0 Tesla. The values of FWHMmax and FWHMmim are also listed in Table 3 with the FWHM along the vertical axis. Notice that the maximum FWHM is not always along the vertical direction, but can be in a different direction.
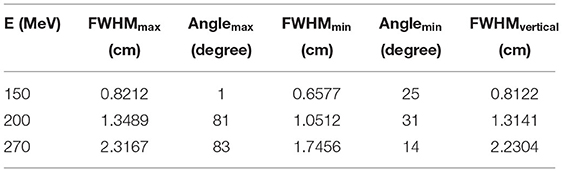
Table 3. Dose calculations on different angle profiles.
The MRI-IGRPT can reduce the uncertainties in the radiotherapy process and improve the patient's positioning accuracy. However, the magnetic field significantly alternates the dose distributions of protons passing the magnetic field as shown in our results. In this study, details of the spiral proton track and the asymmetric 2D/3D dose distribution were investigated. The magnetic field not only induces the shift of Bragg-peak position as the spiral proton track, but also varies the 2D/3D dose distributions (11, 12, 14, 15). Induced asymmetric variation of 2D/3D dose distributions were evaluated on the ratio of Gaussian-fit values in the 2D dose distributions. The skewness of asymmetry at different dose levels by the differences between the circumscribed and inscribed circles was also studied. Finally, the rotation angles to the beam incidence for major axes were investigated for maximum and minimum FWHW in the 3D dose distribution.
To validate an analytical model for predicting simulated ΔDD and WD shifts of Bragg-peak position, the mathematic formula derived by Wolf and Bortfeld (21) was used in this study. The validation and verification were successfully conducted using the analytical model. With a validated analytical model, the mathematic formula by reversing the formula was derived. Based on the derived mathematic formula, the anatomical position of the target can be calculated based on the required proton incident energy, which can thus avoid the irradiation of OARs, aiming to achieve the purpose of optimizing proton radiotherapy.
Magnetic fields perturb more on the 2D/3D dose destitutions when the energy or/and magnetic field increases. Some existing research on magnetic fields and proton radiotherapy only described the change of proton dose or made preliminary dose calculations (14, 24, 25). Dosimetry deviation in the 2D/3D distribution were performed on the macroscopic to microscopic aspects with parameters such as the angles of defection and the orientation of major/minor axes of the plane. With the validated analytical model and details of characteristics of dosimetric deviations, the dose perturbation due to the magnetic field can be optimized to deliver desired doses to the treated target.
The trend of the spiral proton track under a uniform magnetic field obtained in this study by using either MC simulation or the analytical model can provide optimized doses of the proton beam in the clinical application of MRI-IGPRT. Further developments of the analytical dose calculation algorithm are needed to model the asymmetric dose distribution of protons passing a realistic non-uniform magnetic field.
The original contributions presented in the study are included in the article/supplementary material, further inquiries can be directed to the corresponding author.
XuW and XiW proposed and designed the experiments. XiW and XuW carried out the experiments with the help of HP, QC, and WX. XiW drafted the manuscript and interpreted the data. XuW revised the manuscript. All authors contributed to the article and approved the submitted version.
This work was supported by National Natural Science Foundation of China (Nos. 11375047, 11005019, and 12075063).
The authors declare that the research was conducted in the absence of any commercial or financial relationships that could be construed as a potential conflict of interest.
All claims expressed in this article are solely those of the authors and do not necessarily represent those of their affiliated organizations, or those of the publisher, the editors and the reviewers. Any product that may be evaluated in this article, or claim that may be made by its manufacturer, is not guaranteed or endorsed by the publisher.
1. Baumann M, Krause M, Overgaard J, Debus J, Bentzen SM, Daartz J, et al. Radiation oncology in the era of precision medicine. Nat Rev Cancer. (2016) 16:234–9. doi: 10.1038/nrc.2016.18
2. Moteabbed M, Schuemann J, Paganetti H. Dosimetric feasibility of real-time MRI-guided proton therapy. Med Phys. (2014) 41:111713. doi: 10.1118/1.4897570
3. Houweling AC, Crama K, Visser J, Fukata K, Rasch CRN, Ohno T, et al. Comparing the dosimetric impact of interfractional anatomical changes in photon, proton and carbon ion radiotherapy for pancreatic cancer patients. Phys Med Biol. (2017) 62:3051–64. doi: 10.1088/1361-6560/aa6419
4. Lomax AJ, Bortfeld T, Goitein G, Debus J, Dykstra C, Tercier P-A, et al. A treatment planning inter-comparison of proton and intensity modulated photon radiotherapy. Radiother Oncol. (1999) 51:257–71. doi: 10.1016/S0167-8140(99)00036-5
5. Hartman J, Kontaxis C, Bol GH, Frank SJ, Lagendijk JJW, van Vulpen M, et al. Dosimetric feasibility of intensity modulated proton therapy in a transverse magnetic field of 1.5 T. Phys Med Biol. (2015) 60:5955–69. doi: 10.1088/0031-9155/60/15/5955
6. Paganelli C, Whelan B, Peroni M, Summers P, Fast M, van de Lindt T, et al. MRI-guidance for motion management in external beam radiotherapy: current status and future challenges. Phys Med Biol. (2018) 63:22TR03. doi: 10.1088/1361-6560/aaebcf
7. Brenner DJ, Hall EJ. Computed tomography—an increasing source of radiation exposure. New Engl J Med. (2007) 357:22. doi: 10.1056/NEJMra072149
8. Semelka RC, Armao DM, Elias Junior J, Huda W. Imaging strategies to reduce the risk of radiation in CT studies, including selective substitution with MRI. J Magn Reson Imaging. (2007) 25:900–9. doi: 10.1002/jmri.20895
9. De Schepper AM, De Beuckeleer L, Vandevenne J, Somville J. Magnetic resonance imaging of soft tissue tumors. Eur Radiol. (2000) 10:213–23. doi: 10.1007/s003300050037
10. Rank CM, Tremmel C, Hünemohr N, Nagel AM, Jäkel O, Greilich S. MRI-based treatment plan simulation and adaptation for ion radiotherapy using a classification-based approach. Radiat Oncol. (2013) 8:51. doi: 10.1186/1748-717X-8-51
11. Nguyen N, Nguyen M, Vock J, Lemanski C, Kerr C, Vinh-Hung V, et al. Potential applications of imaging and image-guided radiotherapy for brain metastases and glioblastoma to improve patient quality of life. Front Oncol. (2013) 3:284. doi: 10.3389/fonc.2013.00284
12. Menten MJ, Wetscherek A, Fast MF. MRI-guided lung SBRT: present and future developments. Phys Med. (2017) 44:139–49. doi: 10.1016/j.ejmp.2017.02.003
13. Henke L, Kashani R, Robinson C, Curcuru A, DeWees T, Bradley J, et al. Phase I trial of stereotactic MR-guided online adaptive radiation therapy (SMART) for the treatment of oligometastatic or unresectable primary malignancies of the abdomen. Radiother Oncol. (2018) 126:519–26. doi: 10.1016/j.radonc.2017.11.032
14. Raaymakers BW, Raaijmakers AJE, Lagendijk JJW. Feasibility of MRI guided proton therapy: magnetic field dose effects. Phys Med Biol. (2008) 53:5615. doi: 10.1088/0031-9155/53/20/003
15. Oborn BM, Dowdell S, Metcalfe PE, Crozier S, Mohan R, Keall PJ. Future of medical physics: real-time MRI-guided proton therapy. Med Phys. (2017) 44:e77–90. doi: 10.1002/mp.12371
16. Padilla-Cabal F, Alejandro Fragoso J, Franz Resch A, Georg D, Fuchs H. Benchmarking a GATE/Geant4 Monte Carlo model for proton beams in magnetic fields. Med Phys. (2020) 47:223–33. doi: 10.1002/mp.13883
17. Schellhammer SM, Hoffmann AL. Prediction and compensation of magnetic beam deflection in MR-integrated proton therapy: a method optimized regarding accuracy, versatility and speed. Phys Med Biol. (2017) 62:1548–64. doi: 10.1088/1361-6560/62/4/1548
18. Fuchs H, Moser P, Gröschl M, Georg D. Magnetic field effects on particle beams and their implications for dose calculation in MR-guided particle therapy. Med Phys. (2017) 44:1149–56. doi: 10.1002/mp.12105
19. Oborn BM, Dowdell S, Metcalfe PE, Crozier S, Mohan R, Keall PJ. Proton beam deflection in MRI fields: implications for MRI-guided proton therapy. Med Phys. (2015) 42:2113–24. doi: 10.1118/1.4916661
20. Ferrari A, Sala PR, Fasso A, Ranft J, Siegen U. FLUKA: A Multi-Particle Transport Code. CERN 2005-10, INFN/TC_05/11, SLAC-R-773 (2005).
21. Wolf R, Bortfeld T. An analytical solution to proton Bragg peak deflection in a magnetic field. Phys Med Biol. (2012) 57:N329–37. doi: 10.1088/0031-9155/57/17/N329
22. Grevillot L, Frisson T, Zahra N, Bertrand D, Stichelbaut F, Freud N, et al. Optimization of GEANT4 settings for Proton Pencil Beam Scanning simulations using GATE. Nucl Instrum Methods Phys Res B. (2010) 268:3295–305. doi: 10.1016/j.nimb.2010.07.011
24. Ganjeh ZA, Eslami-Kalantari M, Mowlavi AA. Dosimetry calculations of involved and noninvolved organs in proton therapy of liver cancer: a simulation study. Nucl Sci Tech. (2019) 30:1–7. doi: 10.1007/s41365-019-0698-8
Keywords: proton pencil beam, simulation mode, proton dose changes, magnetic fields intensity, FLUKA simulation
Citation: Wang X, Pan H, Cheng Q, Wang X and Xu W (2021) Dosimetric Deviations of Bragg-Peak Position Shifts in Uniform Magnetic Fields for Magnetic Resonance Imaging-Guiding Proton Radiotherapy: A Monte Carlo Study. Front. Public Health 9:641915. doi: 10.3389/fpubh.2021.641915
Received: 15 December 2020; Accepted: 02 June 2021;
Published: 03 August 2021.
Edited by:
Fei Ye, Institute of Modern Physics (CAS), ChinaReviewed by:
Liang Sun, Soochow University, ChinaCopyright © 2021 Wang, Pan, Cheng, Wang and Xu. This is an open-access article distributed under the terms of the Creative Commons Attribution License (CC BY). The use, distribution or reproduction in other forums is permitted, provided the original author(s) and the copyright owner(s) are credited and that the original publication in this journal is cited, in accordance with accepted academic practice. No use, distribution or reproduction is permitted which does not comply with these terms.
*Correspondence: Xufei Wang, d2FuZ3h1ZmVpQGZ1ZGFuLmVkdS5jbg==
Disclaimer: All claims expressed in this article are solely those of the authors and do not necessarily represent those of their affiliated organizations, or those of the publisher, the editors and the reviewers. Any product that may be evaluated in this article or claim that may be made by its manufacturer is not guaranteed or endorsed by the publisher.
Research integrity at Frontiers
Learn more about the work of our research integrity team to safeguard the quality of each article we publish.