 Melissa Scott
 Robert Sander2
 Jonathan Patz
- 1Duke Samuel DuBois Cook Center on Social Equity, Duke University, Durham, NC, United States
- 2Air Quality and Greenhouse Gases Program, International Institute for Applied Systems Analysis (IIASA), Laxenburg, Austria
- 3La Follette School of Public Affairs, University of Wisconsin-Madison, Madison, WI, United States
- 4Global Health Institute, University of Wisconsin-Madison, Madison, WI, United States
In this study, we estimate the health benefits of more stringent alternative energy goals and the costs of reducing coal-fired power plant pollution in China projected in 2030. One of our two overarching alternative energy goals was to estimate the health benefits of complete elimination of coal energy, supplemented by natural gas and renewables. The second was a policy scenario similar to the U.S. 2013 Climate Action Plan (CAP), which played a pivotal role leading up to the 2015 Paris Climate Agreement. We used the Greenhouse Gas and Air Pollution Interactions and Synergies (GAINS) model created by the International Institute for Applied Systems Analysis for our model simulations. We found that 17,137–24,220 premature deaths can be avoided if coal energy is completely replaced by alternative energy, and 8,693–9,281 premature deaths can be avoided if coal energy is replaced by alternatives in a CAP-like scenario. A CAP-like scenario using emission-controls in coal plants costs $11–18 per person. Reducing coal energy in China under a CAP-like scenario would free up $9.4 billion in the annual energy budget to spend on alternatives, whereas eliminating the cost of coal energy frees up $32 billion. This study's estimates show that more stringent alternative energy targets in China are worth the investment in terms of health.
Introduction
Climate change affects the health of populations across the globe as temperatures and sea levels rise, and weather becomes more extreme (1, 2). Because energy production remains the primary driver of greenhouse gas emissions (2), addressing the energy-use roots of global climate change ultimately affects human health. The most carbon-intensive energy source is coal. Burning coal emits about twice as much carbon dioxide (CO2) per unit of energy compared to the combustion of natural gas (3). In addition, burning coal generates emissions of fine particulate matter (PM2.5) or particles measuring <2.5 micrometers. PM2.5 travels deep into human airways causing cell damage to the lungs, which can lead to inflammation, cytotoxicity, cell death, as well as increases in cardiovascular disease, respiratory disease, lung cancer, asthma, and death (4, 5). PM2.5 also impacts brain functioning and mental health (6). A considerable number of published scientific literature shows a causal relationship between mortality and exposure to PM2.5 (5).
Therefore, reducing coal-fired power plant emissions to mitigate climate change can simultaneously decrease hazardous PM2.5. This represents a side benefit, or health “co-benefit,” of climate change policy measures (7). However, society is still reliant on fossil fuel energy. Three thousand two hundred and seventy-two coal-fired power plants exist worldwide with 1,199 more proposed (8). Of these 1,199 new coal-fired power plants, over 1/3rd of the capacity will come from China (8). Moreover, China accounts for 46% of coal consumption worldwide, followed by the United States (13%) and India (9%) (8). China also accounts for 20% of the global population (9) and has experienced a recent rise in its air pollution index (10). Thus, the large and rapidly growing Chinese population is exposed to an increasingly large amount of coal pollution with 13% of Chinese cities severely polluted, particularly during winter months when many places in China rely on coal as the main source for heating (10).
In this study, we estimate the health benefits and costs of reducing coal-fired power plant pollution to see whether more stringent alternative energy goals are worth the investment in China. This is important because it may not take much investment (or less investment than originally thought by policymakers) to reduce coal usage more aggressively in China in the coming years. For example, supplementing coal energy usage with alternatives and better controlling coal in the U.S. under the 2013 Climate Action Plan (CAP) would have prevented up to 6,000 annual deaths, 3,000 heart attacks, and 150,000 asthma attacks annually in the United States (11). The U.S. Climate Action Plan was issued in 2013 under President Obama and played a pivotal role in the international Paris Agreement on Climate Change in 2015, even though President Trump signed an executive order to rescind it in March, 2017. It was pivotal, in part, because the U.S. has never signed on to any international environmental agreement (such as the Paris Climate Agreement or the Montreal Protocol on Substances that Deplete the Ozone Layer), without first having domestic regulation on the pollutant or environmental hazard. CAP would have been the U.S.'s first domestic regulation on climate change, and was a signal to the rest of the world, particularly China and India, of the U.S.'s serious energy concerns and intentions.
In order to examine whether a more aggressive alternative energy transition currently planned in China might be worth the investment, we developed two overarching alternative energy goals: one scenario inspired by CAP wherein coal-fired power plant pollution is reduced by 32%, and elimination of coal energy and its pollution entirely. Elimination of coal energy involves completely replacing this energy source with alternative energy. Alternative energy consists of natural gas and renewables (solar thermal, solar photovoltaic, wind, nuclear, and geothermal). A CAP-like policy replaces coal energy with alternatives in China by about a third in the year 2030. In the U.S., CAP would have given states the flexibility to switch to alternative energy and/or increase existing pollution controls in modern coal plants by 2030, as long as a 32% reduction of coal pollution was achieved, and forced states to phase out the oldest and dirties plants (11, 12). Thus, we created variations of the CAP-like policy wherein alternative energy replaces coal and pollution controls are increased in modern coal plants to achieve a 32% reduction.
Materials and Methods
Our study uses the Greenhouse Gas and Air Pollution Interactions and Synergies (GAINS) model created by the International Institute for Applied Systems Analysis (IIASA) to estimate the health benefits and emission-control costs of our energy scenario goals across all 32 regions of China. GAINS estimates the dispersion of pollutants in the atmosphere from energy sources, the concentrations of such pollutants as they mix with other pollutants in the atmosphere, the impacts of these pollutants on human health, and the future costs of emission-control technologies within energy sources (13). The five energy scenarios we developed are as follows:
Scenario 1: 100% reduction of coal-fired power plant emissions wherein coal energy is completely replaced by renewable energy;
Scenario 2: 100% reduction of coal-fired power plant emissions wherein coal energy is completely replaced by natural gas;
Scenario 3: 32% reduction of coal-fired power plant emissions wherein 32% of coal energy is replaced by renewable energy
Scenario 4: 32% reduction of coal-fired power plant emissions wherein 32% of coal energy is replaced by natural gas
Scenario 5: 32% reduction of coal-fired power plant emissions using emission-control technologies within coal plants
To calculate the health benefits and emission-control costs of our alternative energy targets we change the petajoules (PJ) of energy produced by individual energy plants across all 32 regions in China within the model. The first step in changing the PJ of energy produced by renewable and natural gas plants is to calculate the kiloton change of PM2.5 pollution from coal plants. Knowing the kiloton change of PM2.5 from coal plants allows us to calculate the amount of coal required across China. Once the kiloton change of PM2.5 is calculated, the second step is to input each plant's decreased coal-derived PJ value. Step three is to compare the PJ values of the renewable or natural gas energy needed to replace the decreased coal power. When coal energy is replaced and primary PM2.5 is reduced, the GAINS model reduces NOX and SO2, as well as the greenhouse gases (GHG) CO2 and CH4 in order to correspond with the changed energy supply.
A detailed explanation of these steps are provided in the GAINS User Guide (available upon registering at the Model Interface) (14), which describes how to create a scenario using the model from multiple pollutant sources. This guide explains how a user can download the energy activity data, manipulate the activities, and upload the new activity data through the GAINS interface. The basic math for the model is: Emissions = Activities * Emission Factors. The main interaction with the model is done by the Excel Files upon upload.
GAINS uses the Unified European Monitoring and Evaluation Programme (EMEP), a Eulerian model, to calculate emission changes in the atmosphere involving more than 100 chemical reactions of 70 chemical pollutants produced (15, 16). After the outcomes are ascertained by EMEP, GAINS then estimates the premature mortality due to a pollutant change compared to baseline.
GAINS uses findings from the World Health Organization (WHO) review on the health impacts of air pollution (17, 18) and the results of the American Cancer Society cohort study (19) and its subsequent analysis (20) to quantify premature mortality attributable to long-term PM2.5 exposure (13).The relative risk function from Pope et al. is based on premature mortality due to cardiopulmonary disease and lung cancer from PM pollution in cohorts 30 years old and above. GAINS uses cohort- and country-specific mortality data obtained from life table statistics (13). For all cohorts in a country l the change in life years Ll is then calculated in GAINS as the sum of the change in life years for the cohorts living in the grid cells j of country l:
where
→ Delta L c,l – Change in life years lived for cohort c in country l.
→ Popc,l– Population in cohort c in country l.
→ Popj– Total population in grid cell j (at least of age wo = 30)
→ Popl– Total population in country l (at least of age wo = 30)
The GAINS energy activity data comes from the International Energy Agency statistical energy and process data, specifically the World Energy Outlook 2020 report (21), for projections until 2030. Every 5 years, China submits a new legislative plan. GAINS draws on the 13th Five Year Plan legislation, drafted between 2016 and 2020 for its Baseline Current Legislation scenario dataset. The baseline dataset is roughly compatible with CO2 emissions for a 6°C warming by 2,100.
Costs
The first step in the cost estimate is to calculate how much pollution each coal plant's emission-control technology is able to remove in 2030. Then we alter the percentage at which each emission-control is “on” to achieve the same pollutant reduction as the alternative energy CAP-like targets. Since it is impossible to control emissions from coal plants using control technologies by the same amount as switching to 100% alternative energy (Scenarios 1 and 2), we were only able to measure the emission control costs of a CAP-like target.
Coal power plant emission-control technologies include dedusters, electrostatic precipitators and fabric filters. Their costs are technology based and account for the structural differences of plants, their fuel use patterns, the amount and quality of the coal burned, and the control measures already applied (13). To estimate the costs for applying a technology in a given country, GAINS considers international pricing data for technologies and adjusts them to country-specific conditions, taking into account local labor costs, energy prices, and costs of by-products (22). All costs are in Euro 2005 (14).
GAINS estimates the costs of each emission control technology considering annualized investments (Ian), fixed (OMfix), and variable (OMvar) operating costs, and how they depend on technology m, country i and activity type k (23–30). GAINS assumes technological progress in the performance and cost data, based on literature estimates (13). A Unit cost of abatement (ca) of coal-fired air pollution, related to one unit of activity (A), add up to:
Results
Health Benefits
Each of our five scenarios and their health results are found in Table 1. Under Scenario 1 wherein coal-fired power plant pollution is eliminated and replaced by renewables, 24,220 premature deaths are avoided. Under Scenario 3 wherein coal-fired power plant pollution is reduced by 32% and renewables replace coal to meet energy demand, 9,281 premature deaths are avoided. Under Scenario 5 wherein coal-fired power plant pollution is reduced by 32% using control technologies, 4,906 premature deaths are avoided. These are low estimates, since they exclude Chinese people <30, which is projected to be 37% of the population in China in 2030 (31), and younger populations such as infants and young children experience some of the worst health impacts from air pollution (32–36). The largest changes in coal-fired power plant air pollution are seen throughout Eastern China, as shown in Figure 1.
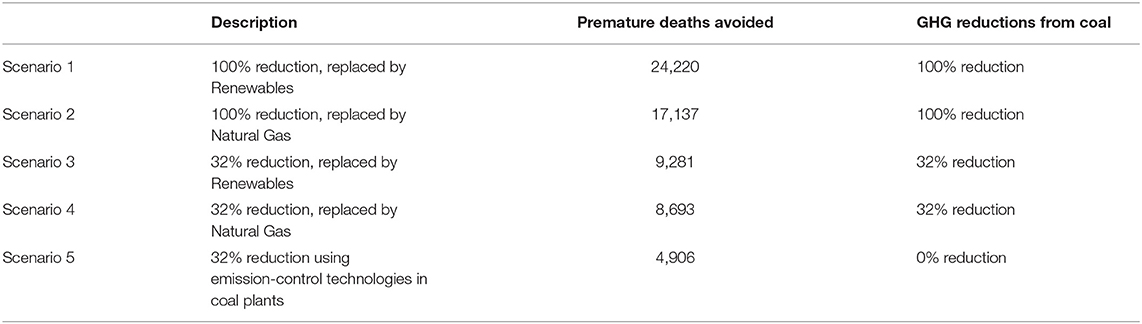
Table 1. Energy scenarios' reductions of PM2.5, NOx, and SO2, their corresponding health results compared to Business-as-usual, and greenhouse gas reductions.
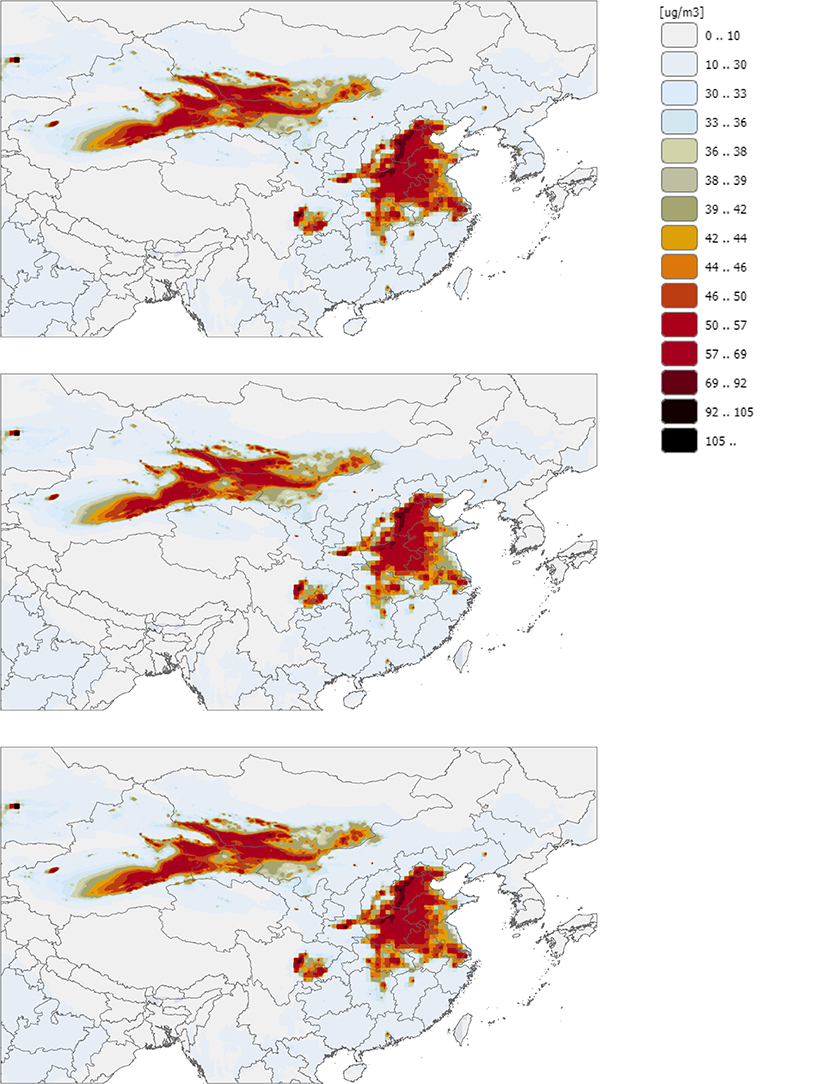
Figure 1. Concentrations of PM2.5 projected in China in 2030 under three energy scenarios. The top map shows the business-as-usual scenario (0% reduction of coal-fired power plant emissions). The middle map shows Scenario 1 wherein coal-fired power plant emissions are eliminated and renewable energy replaces coal. The bottom map shows Scenario 3 wherein coal-fired power plant emissions are reduced by 32% and renewable energy replaces coal.
Pollutant and Greenhouse Gas Emissions
In Scenarios 1–4, reductions in PM2.5, NOX, and SO2 correspond with a reduction in GHGs. However, reducing PM2.5, NOX, and SO2 using control technologies alone does not reduce GHG emissions, as demonstrated in Scenario 5. This difference is noteworthy when factoring in the health co-benefits of mitigating climate change. It is important to note that in Scenario 4, where coal is replaced by natural gas, methane emissions are reduced by 32% at the coal plant, but methane leakage from hydraulic fracturing procedures is not considered because the GAINS model does not include the full life cycle of fossil fuels.
Costs
As shown in Table 2, implementing more restrictive emission-controls within coal power plants for 365 days in 2030 saves 4,906 premature deaths in China under a CAP-like target and costs 13.5 billion Euros. In a population of 889 million people over the age of 30 in China, this translates to 15.85 Euros or $17.74 per person. In a total population of 1.4 billion people projected in 2030, this translates to 9.64 Euros or $11.33 per person.

Table 2. Energy scenarios' emissions reductions, premature deaths avoided, and costs compared to Business-as-usual (BAU).
While these costs are specific to emission-control technologies that control NOX, SO2, and PM2.5 and not to the price of alternative energy, when less coal is burned and less emission-control technologies are implemented. Under the alternative energy targets, wherein 8,693–9,281 premature deaths are avoided by replacing coal with renewables or natural gas under a CAP-like policy, eight million Euros are saved on operating costs. Similarly, when 17,137–24,220 premature deaths are saved by completely replacing coal with alternatives, 27 billion Euros are saved on what would have been spent on coal-fired power plant emission-control technologies and their upkeep. This frees up 8–27 billion Euros ($9.4–32 billion) in the 2030 annual energy budget to spend on alternative fuels.
Uncertainties
There are two major sources of uncertainty using the GAINS model. The first is the use of EMEP, the Eulerian model. In using EMEP, the atmospheric dispersion and therefore PM2.5, NOx, and SO2 emissions may be underestimated in GAINS because the methods used only measure the changes in precursor emissions and do not include the rather unknown role of secondary organic aerosols and natural sources (13).
Second, the relative risk of particulate matter from Pope et al. is based on premature mortality due to cardiopulmonary disease and lung cancer from PM pollution. However, it does not include premature mortality due ischemic heart disease, stroke, cerebral vascular disease, and lower respiratory infections in children which other studies have used in their disease-specific mortality and morbidity estimates due to air pollution (37–48). While, cause-specific death rates may incur lower errors compared to all-cause mortality studies on air pollution (49), not including more of the disease-specific mortality for PM may lead to an underestimate in the premature deaths due to coal-fired power plant pollution.
Discussion
The greatest health co-benefits in our study are evidenced in scenarios wherein coal energy is eliminated in 2030 and replaced by renewables. The greatest health benefits are in Eastern regions of China where coal is heavily used for energy and many people reside. From a policy perspective, it is important to take into consideration the values of people in regards to their health and physiological needs for cleaner air, as air pollution not only impacts cardiovascular health and respiratory health and even diabetes, but has been shown to impact mental health such as depression, anxiety and dementia as PM leads to oxidative stress to lower parts of the brain that effect brain functionality and mood.
Several studies have estimated the percentage of people in various regions of China willing to pay for cleaner air, as well as the amount they would be willing to contribute. Chu et al. found that 73% of people in Wuhan, China were willing to pay for air quality improvement (50). A study of 975 people in Shanghai found that 52% of the community and 70.2% of hospital populations were willing to pay between $68.50 and $80.70 to improve air quality, respectively (51). Sun et al. found that 90% of respondents in China are willing to pay for reducing air pollution, and that among those polled the average amount each individual was willing to pay was $56.18 (52). Lastly, Zhang et al. found that 78.5% of citizens in Nanchang, China expressed willingness to contribute money to improve air quality (53). This literature suggests that people have a relatively high willingness to pay for cleaner air in China. At $11–18 per person for a 32% reduction of air pollution that avoids 4,906 premature deaths, it seems reasonable from a policy perspective for China to transition to cleaner energy more aggressively.
There are major health costs with natural gas as an alternative to coal or as a bridge fuel to renewables that are not included in our health estimates. Some have referred to natural gas as a “bridge to nowhere” (54). For example, new evidence suggests hydraulic fracturing for natural gas impacts the birth weight of babies near fracking sites (55). Moreover, switching to natural gas reduces 588–7,083 less premature mortalities compared to renewables in Scenarios 1–4. However, natural gas consumption and production is projected to rise in China as it aggressively looks at ways to increase its volumes and has very ambitious shale gas targets (56, 57). China's technically recoverable shale gas reserves are almost 50% higher than those of the United States (58).
Natural gas production leaks methane which is 100-times more potent than CO2. Furthermore, standard bottom-up approaches to measure methane leakages can lead to gross underestimates (59, 60). Specifically, the U.S. Environmental Protection Agency's bottom-up approach of sampling methane emissions at selected utility company natural gas sites has estimated methane leakages at a 1.2% rate (61), whereas satellite data, tower samples, aircraft measurements, and other top-down studies have estimated leakages at much higher rates (62–64). For example, satellite data over Bakken and Eagle Ford formations in the U.S. have estimated methane leakages at a 6.2–10.2% rate. For there to be a net climate benefit of switching from coal-fired to gas-fired power plants, the methane leakage rate needs to be <3.2% (65). Thus, if leakages over 3.2% occur in China, natural gas is not a viable climate-friendly alternative energy.
It would be useful in a future analysis to obtain an estimate for the cost of renewable alternative energy. Estimates could be obtained by using International Energy Agency data and projections, interpreting China's 5-year legislation plans from 2016–2020, 2021–2025, and 2026–2030, and assessing future energy markets. Furthermore, it would be useful to measure the climate change health-related costs and benefits of our targets in a future analysis. For example, in 2030 the social cost of avoiding one ton of CO2 is estimated to be $50 (66). A 32% reduction of CO2 by switching to renewables avoids 2,079,250 Kt of CO2, which has a social cost of $104 million. West et al. found that the cost of cleaner energy worldwide is <$30/t CO2, whereas the benefit of cleaner energy is $200/t CO2, with two thirds of these benefits coming from China (67).
In conclusion, this study's estimates show that increasing alternative energy more aggressively than is currently planned in China is worth the investment in terms of health. Policymakers should consider getting off coal sooner and more aggressively, with considerable attention to a more rapid transition to renewables.
Data Availability Statement
Publicly available datasets were analyzed in this study. This data can be found at: https://gains.iiasa.ac.at/gains/ASN/index.login?logout=1&switch_version=v0.
Author Contributions
MS performed data manipulation before input into the model and is the primary author of the text and tables. RS performed model data manipulation and output of Figure 1. GN and JP reviewed the paper. JP made contributions to the health results sections and health literature in introduction and discussion. GN gave input on the GAINS model, energy content, and framing of the health results for health and policy audiences. All authors contributed to the article and approved the submitted version.
Conflict of Interest
The authors declare that the research was conducted in the absence of any commercial or financial relationships that could be construed as a potential conflict of interest.
References
1. Patz JA, Campbell-Lendrum D, Holloway T, Foley JA. Impact of regional climate change on human health. Nature. (2005) 438:310–7. doi: 10.1038/nature04188
2. Stocker TF, Qin D, Plattner K, Tignor M, Allen SK, Boschnung J, et al. The Physical Science Basis. Contribution of Working Group I to the Fifth Assessment Report of the Intergovernmental Panel on Climate Change. Cambridge and New York, NY: IPCC (2013). p. 1535.
3. U.S Energy Information Administration. How Much Carbon Dioxide Is Produced When Different Fuels Are Burned? (2020). Available online at: https://www.eia.gov/tools/faqs/faq.php?id=73&t=11 (accessed August 25, 2020).
4. WHO. World Health Statistics 2020: Monitoring Health for the Sustainable Development GOals. (2020). Available online at: https://apps.who.int/iris/handle/10665/332070 (accessed March 29, 2021).
5. U.S. Environmental Protection Agency. Integrated Science Assessment (ISA) For Particulate Matter. Report No.: 600/R-08/139F. Washington, DC (2009).
6. Manisalidis I, Stavropoulou E, Stavropoulos A, Bezirtzoglou E. Environmental and health impacts of air pollution: a review. Front Public Health. (2020) 8:14. doi: 10.3389/fpubh.2020.00014
7. Edenhofer O, Pichs-Madruga Y, Sokona E, Farahani S, Kadner K, Seyboth A, et al. Mitigation of Climate Change. Contribution of Working Group III to the Fifth Assessment Report of the Intergovernmental Panel on Climate Change. Cambridge and New York, NY: IPCC (2014).
8. Yang A, Cui Y. Global Coal Risk Assessment: Data Analysis and Market Research. World Resources Institute (2012). Available online at: https://files.wri.org/s3fs-public/pdf/global_coal_risk_assessment.pdf (accessed March 29, 2021).
9. United Nations Department of Economic and Social Affairs. World Population Prospects: The 2017 Revision. United Nations Department of Economic and Social Affairs (2017). Available online at: https://www.un.org/development/desa/publications/world-population-prospects-the-2017-revision.html (accessed March 29, 2021).
10. Liu L, Yang X, Liu H, Wang M, Welles S, Márquez S, et al. Spatial–temporal analysis of air pollution, climate change, and total mortality in 120 cities of China, 2012–2013. Front Public Health. (2016) 4:143. doi: 10.3389/fpubh.2016.00143
11. The White House. Climate Action Plan. President Obama's Climate Action Plan Progress Report: Cutting Carbon Pollution, Protecting American Communities, and Leading Internationally. (2014). Available online at: https://obamawhitehouse.archives.gov/sites/default/files/docs/cap_progress_report_update_062514_final.pdf (accessed March 29, 2021).
12. The White House. The White House Clean Power Plan: Climate Change and President Obama's Action Plan. (2015). Available online at: https://obamawhitehouse.archives.gov/sites/default/files/image/president27sclimateactionplan.pdf (accessed March 29, 2021).
13. Amann M, Bertok I, Borken-Kleefeld J, Cofala J, Heyes C, Höglund-Isaksson L, et al. Cost-effective control of air quality and greenhouse gases in Europe: modeling and policy applications. Environ Model Softw. (2011) 26:1489–501. doi: 10.1016/j.envsoft.2011.07.012
14. International Institute of Applied Systems Analysis. GAINS Advanced Mode Costs Interface. Laxenburg: International Institute of Applied Systems Analysis (2017). Available online at: http://gains.iiasa.ac.at/models/index.html (accessed May 1, 2020).
15. Simpson D, Fagerli H, Johnson J, Tsyro S, Wind P, Tuovinen T. Transboundary Acidification, Eutrophication and Ground-Level Ozone in Europe. Part 1. Unified EMEP Model Description. Report No.: 0806–4520. Norwegian Meteorological Institute (2003). Available online at: https://www.emep.int/publ/reports/2003/emep_report_1_part1_2003.pdf (accessed March 29, 2021).
16. Fagerli H, Aas W. Trends of nitrogen in air and precipitation: model results and observations at EMEP sites in Europe, 1980–2003. Environ Pollution. (2008) 154:448–61. doi: 10.1016/j.envpol.2008.01.024
17. World Health Organization. Health Aspects of Air Pollution with Particulate Matter, Ozone and Nitrogen Dioxide. World Health Organization (2003). Available online at: http://www.euro.who.int/__data/assets/pdf_file/0005/112199/E79097.pdf (accessed August 25, 2020).
18. World Health Organization. Health Relevance of Particulate Matter from Various Sources. Report No.: EU/07/5067587. Regional Office for Europe, Copenhagen: World Health Organization (2007). Available online at: https://www.euro.who.int/__data/assets/pdf_file/0007/78658/E90672.pdf (accessed March 29, 2021).
19. Pope CA III. Lung cancer, cardiopulmonary mortality, and long-term exposure to fine particulate air pollution. JAMA. (2002) 287:1132. doi: 10.1001/jama.287.9.1132
20. Pope C, Ezzati M, Bertok I, Chambers A, Cofala J, Dentener F. Fine-particulate air pollution and life expectancy in the United States. N Engl J Med. (2009) 11:805646. doi: 10.1056/NEJMsa0805646
21. International Energy Agency. World Energy Outlook. (2020). Available online at: https://www.iea.org/reports/world-energy-outlook-2020 (accessed March 29, 2021).
22. Wagner F, Amann M, Bertok I, Chambers A, Cofala J, Dentener F. Final Report on Policy Analysis With the GAINS-Asia Model. Laxenburg: International Institute of Applied Systems Analysis (2008).
23. Cofala J, Syri S. Nitrogen Oxides Emissions, Abatement Technologies and Related Costs for Europe in the RAINS Model Database. IR-98-88/October:68. Laxenburg: International Institute for Applied Systems Analysis (1998).
24. Cofala J, Syri S. Sulfur Emissions, Abatement Technologies and Related Costs for Europe in the RAINS Model Database. IR-98-035/June:55. Laxenburg: International Institute for Applied Systems Analysis (1998).
25. Cofala, Janusz, Purohit P, Rafaj P, Klimont Z. GHG Mitigation Potentials From Energy Use and Industrial Sources in Annex I Countries. Report No.: IR-09-040. International Institute of Applied Systems Analysis (2009). Available online at: http://pure.iiasa.ac.at/id/eprint/9113/1/IR-09-040.pdf (accessed September 28, 2020).
26. Borken-Kleefeld J, Cofala J, Rafaj P. GHG Mitigation Potentials and Costs in the Transport Sector of Annex I Countries Methodology. Laxenburg: International Institute for Applied Systems Analysis (2009). p. 40.
27. Klimont Z, Amann M, Cofala J. Estimating Costs for Controlling Emissions of Volatile Organic Compounds (VOC) from Stationary Sources in Europe. International Institute for Applied Systems Analysis (2000) IR-00-51:80.
28. Klimont Z, Brink C. Modelling of Emissions of Air Pollutants and Greenhouse Gases from Agricultural Sources in Europe. International Institute for Applied Systems Analysis (2004) IR-04-048:75.
29. Klimont Z, Cofala J, Bertok I, Amann M, Heyes C, Gyarfas F. Modelling Particulate Emissions in Europe A Framework to Estimate Reduction Potential and Control Costs. Report No.: IR-02-076. Laxenburg: International Institute for Applied Systems Analysis. Available online at: https://pure.iiasa.ac.at/id/eprint/6712/1/IR-02-076.pdf (accessed March 29, 2021).
30. Hoeglund-Isaksson L, Winiwarter W, Tohka A. Potentials and Costs for Mitigation of non-CO2 Greenhouse Gases in Annex I Countries. Report No.: IR-09-044. Laxenburg: International Institute for Applied Systems Analysis. Available online at: https://pure.iiasa.ac.at/id/eprint/9111/1/IR-09-044.pdf (accessed March 29, 2021).
31. World Bank. Population Estimates and Projections Data. World Bank (2020). Available online at: https://data.worldbank.org/data-catalog/population-projection-tables (accessed March 29, 2021).
32. WHO. Air Pollution and Child Health: Prescribing Clean Air. Report No.: WHO/CED/PHE/18.01. Geneva: World Health Organization (2018). Available online at: https://www.who.int/ceh/publications/air-pollution-child-health/en/ (accessed March 29, 2021).
33. Epstein PR, Buonocore JJ, Eckerle K, Hendryx M, Stout BM III, Heinberg R, et al. Full cost accounting for the life cycle of coal: full cost accounting for the life cycle of coal. Ann N Y Acad Sci. (2011) 1219:73–98. doi: 10.1111/j.1749-6632.2010.05890.x
34. Yang M, Bhatta RA, Chou S-Y, Hsieh C-I. The impact of prenatal exposure to power plant emissions on birth weight: evidence from a Pennsylvania power plant located upwind of New Jersey: the impact of prenatal exposure to power plant emissions on birth weight. J Pol Anal Manage. (2017) 36:557–83. doi: 10.1002/pam.21989
35. Ronchetti R, Zuurbier M, Jesenak M, Koppe J, Farah Ahmed U, Ceccatelli S, et al. Children's health and mercury exposure. Acta Paediatrica. (2006) 95:36–44. doi: 10.1080/08035250600886157
36. Li R, Wu H, Ding J, Fu W, Gan L, Li Y. Mercury pollution in vegetables, grains and soils from areas surrounding coal-fired power plants. Sci Rep. (2017) 7:46545. doi: 10.1038/srep46545
37. Hu J, Huang L, Chen M, Liao H, Zhang H, Wang S, et al. Premature mortality attributable to particulate matter in China: source contributions and responses to reductions. Environ Sci Technol. (2017) 51:9950–9. doi: 10.1021/acs.est.7b03193
38. Gao M, Beig G, Song S, Zhang H, Hu J, Ying Q, et al. The impact of power generation emissions on ambient PM2.5 pollution and human health in China and India. Environ Int. (2018) 121:250–9. doi: 10.1016/j.envint.2018.09.015
39. Lelieveld J, Evans JS, Fnais M, Giannadaki D, Pozzer A. The contribution of outdoor air pollution sources to premature mortality on a global scale. Nature. (2015) 525:367–71. doi: 10.1038/nature15371
40. Zhao X, Yu X, Wang Y, Fan C. Economic evaluation of health losses from air pollution in Beijing, China. Environ Sci Pollut Res. (2016) 23:11716–28. doi: 10.1007/s11356-016-6270-8
41. Venners SA, Wang B, Xu Z, Schlatter Y, Wang L, Xu X. Particulate matter, sulfur dioxide, and daily mortality in Chongqing, China. Environ Health Perspect. (2003) 111:562–7. doi: 10.1289/ehp.5664
42. Sun D, Fang J, Sun J. Health-related benefits of air quality improvement from coal control in China: evidence from the Jing-Jin-Ji region. Resourc Conservat Recycl. (2018) 129:416–23. doi: 10.1016/j.resconrec.2016.09.021
43. Chen S, Li Y, Yao Q. The health costs of the industrial leap forward in China: evidence from the sulfur dioxide emissions of coal-fired power stations. China Econ Rev. (2018) 49:68–83. doi: 10.1016/j.chieco.2018.01.004
44. Maji KJ, Dikshit AK, Arora M, Deshpande A. Estimating premature mortality attributable to PM2.5 exposure and benefit of air pollution control policies in China for 2020. Sci Total Environ. (2018) 612:683–93. doi: 10.1016/j.scitotenv.2017.08.254
45. Burnett RT, Pope CA, Ezzati M, Olives C, Lim SS, Mehta S, et al. An integrated risk function for estimating the global burden of disease attributable to ambient fine particulate matter exposure. Environ Health Perspect. (2014) 122:397–403. doi: 10.1289/ehp.122-A235
46. Li N, Chen W, Rafaj P, Kiesewetter G, Schöpp W, Wang H, et al. Air quality improvement co-benefits of low-carbon pathways toward well below the 2°C climate target in China. Environ Sci Technol. (2019) 53:5576–84. doi: 10.1021/acs.est.8b06948
47. Wang X, Mauzerall DL. Evaluating impacts of air pollution in China on public health: implications for future air pollution and energy policies. Atmos Environ. (2006) 40:1706–21. doi: 10.1016/j.atmosenv.2005.10.066
48. Zhang H, Zhang B, Bi J. More efforts, more benefits: air pollutant control of coal-fired power plants in China. Energy. (2015) 80:1–9. doi: 10.1016/j.energy.2014.11.029
49. Fang Y, Mauzerall DL, Liu J, Fiore AM, Horowitz LW. Impacts of 21st century climate change on global air pollution-related premature mortality. Climatic Change. (2013) 121:239–53. doi: 10.1007/s10584-013-0847-8
50. Chu Y, Liu Y, Lu Y, Yu L, Lu H, Guo Y, et al. Propensity to migrate and willingness to pay related to air pollution among different populations in Wuhan, China. Aerosol Air Qual Res. (2017) 17:752–60. doi: 10.4209/aaqr.2016.05.0178
51. Wang K, Wu J, Wang R, Yang Y, Chen R, Maddock JE, et al. Analysis of residents' willingness to pay to reduce air pollution to improve children's health in community and hospital settings in Shanghai, China. Sci Total Environ. (2015) 533:283–9. doi: 10.1016/j.scitotenv.2015.06.140
52. Sun C, Yuan X, Yao X. Social acceptance towards the air pollution in China: evidence from public's willingness to pay for smog mitigation. Energy Policy. (2016) 92:313–24. doi: 10.1016/j.enpol.2016.02.025
53. Zhang L, Yuan Z, Maddock JE, Zhang P, Jiang Z, Lee T, et al. Air quality and environmental protection concerns among residents in Nanchang, China. Air Qual Atmos Health. (2014) 7:441–8. doi: 10.1007/s11869-014-0255-x
54. Howarth RW. A bridge to nowhere: methane emissions and the greenhouse gas footprint of natural gas. Energy Sci Eng. (2014) 2:47–60. doi: 10.1002/ese3.35
55. Currie J, Greenstone M, Meckel K. Hydraulic fracturing and infant health: new evidence from Pennsylvania. Sci Adv. (2017) 3:e1603021. doi: 10.1126/sciadv.1603021
56. International Energy Agency. Gas 2017: Analysis and Forecasts to 2022 Executive Summary. International Energy Agency (2017). Available online at: https://webstore.iea.org/download/summary/183?fileName=English-Gas-2017-ES.pdf (accessed March 29, 2021).
57. International Energy Agency. World Energy Outlook 2017 Excerpt: Outlook for Natural Gas. Report No.: 9789264282308. International Energy Agency (2017). Available online at: https://webstore.iea.org/world-energy-outlook-2017-excerpt-outlook-for-natural-gas (accessed March 29, 2021).
58. U.S. Energy Information Administration. Technically Recoverable Shale Oil and Gas Resources: an Assessment of 137 Shale Formations in 41 Countries Outside the United States. U.S. Energy Information Administration (2013). Available online at: https://www.eia.gov/analysis/studies/worldshalegas/pdf/overview.pdf (accessed March 29, 2021).
59. Schneising O, Burrows JP, Dickerson RR, Buchwitz M, Reuter M, Bovensmann H. Remote sensing of fugitive methane emissions from oil and gas production in North American tight geologic formations: remote sensing of fugitive methane emissions from oil and gas production. Earth's Future. (2014) 2:548–58. doi: 10.1002/2014EF000265
60. Howarth R. Methane emissions and climatic warming risk from hydraulic fracturing and shale gas development: implications for policy. EECT. (2015) 45:S61539. doi: 10.2147/EECT.S61539
61. U.S. Environmental Protection Agency. Inventory of U.S. Greenhouse Gas Emissions and Sinks: 1990–2012. Report No.: 430-R-14–003. U.S. Environmental Protection Agency (2014). Available online at: https://19january2017snapshot.epa.gov/sites/production/files/2015-12/documents/us-ghg-inventory-2014-main-text.pdf (accessed March 29, 2021).
62. Brandt AR, Heath GA, Kort EA, O'Sullivan F, Petron G, Jordaan SM, et al. Methane leaks from North American Natural Gas Systems. Science. (2014) 343:733–5. doi: 10.1126/science.1247045
63. Karion A, Sweeney C, Pétron G, Frost G, Michael Hardesty R, Kofler J, et al. Methane emissions estimate from airborne measurements over a western United States natural gas field: CH4 emissions over a natural gas field. Geophys Res Lett. (2013) 40:4393–7. doi: 10.1002/grl.50811
64. Pétron G, Frost G, Miller BR, Hirsch AI, Montzka SA, Karion A, et al. Hydrocarbon emissions characterization in the Colorado Front Range: a pilot study: colorado front range emissions study. J Geophys Res. (2012) 117:2011JD016360. doi: 10.1029/2011JD016360
65. Alvarez RA, Pacala SW, Winebrake JJ, Chameides WL, Hamburg SP. Greater focus needed on methane leakage from natural gas infrastructure. Proc Natl Acad Sci USA. (2012) 109:6435–40. doi: 10.1073/pnas.1202407109
66. U.S. Environmental Protection Agency. Social Cost of Carbon. U.S. Environmental Protection Agency (2016). Available online at: https://19january2017snapshot.epa.gov/sites/production/files/2016-12/documents/social_cost_of_carbon_fact_sheet.pdf (accessed June 1, 2020).
Keywords: air pollution, coal-fired power plants, renewable energy, China, human health
Citation: Scott M, Sander R, Nemet G and Patz J (2021) Improving Human Health in China Through Alternative Energy. Front. Public Health 9:613517. doi: 10.3389/fpubh.2021.613517
Received: 02 October 2020; Accepted: 01 March 2021;
Published: 21 April 2021.
Edited by:
Yang Liu, Emory University, United StatesReviewed by:
Rui Wu, Nanjing Normal University, ChinaGulnihal Ozbay, Delaware State University, United States
Copyright © 2021 Scott, Sander, Nemet and Patz. This is an open-access article distributed under the terms of the Creative Commons Attribution License (CC BY). The use, distribution or reproduction in other forums is permitted, provided the original author(s) and the copyright owner(s) are credited and that the original publication in this journal is cited, in accordance with accepted academic practice. No use, distribution or reproduction is permitted which does not comply with these terms.
*Correspondence: Melissa Scott, bWVsaXNzYS5qLnNjb3R0QGR1a2UuZWR1