
95% of researchers rate our articles as excellent or good
Learn more about the work of our research integrity team to safeguard the quality of each article we publish.
Find out more
MINI REVIEW article
Front. Public Health , 11 March 2021
Sec. Aging and Public Health
Volume 9 - 2021 | https://doi.org/10.3389/fpubh.2021.578832
This article is part of the Research Topic Healthy Aging and the Community Environment View all 16 articles
 Preeti Zanwar1,2,3*
 Jinwoo Kim4
 Jaeyoon Kim5Michael Manser6
 Youngjib Ham5
 Theodora Chaspari7Changbum Ryan Ahn1,5
Background: The benefits of engaging in outdoor physical activity are numerous for older adults. However, previous work on outdoor monitoring of physical activities did not sufficiently identify how older adults characterize and respond to diverse elements of urban built environments, including structural characteristics, safety attributes, and aesthetics.
Objective: To synthesize emerging multidisciplinary trends on the use of connected technologies to assess environmental barriers and stressors among older adults and for persons with disability.
Methods: A multidisciplinary overview and literature synthesis.
Results: First, we review measurement and monitoring of outdoor physical activity in community environments and during transport using wearable sensing technologies, their contextualization and using smartphone-based applications. We describe physiological responses (e.g., gait patterns, electrodermal activity, brain activity, and heart rate), stressors and physical barriers during outdoor physical activity. Second, we review the use of visual data (e.g., Google street images, Street score) and machine learning algorithms to assess physical (e.g., walkability) and emotional stressors (e.g., stress) in community environments and their impact on human perception. Third, we synthesize the challenges and limitations of using real-time smartphone-based data on driving behavior, incompatibility with software data platforms, and the potential for such data to be confounded by environmental signals in older adults. Lastly, we summarize alternative modes of transport for older adults and for persons with disability.
Conclusion: Environmental design for connected technologies, interventions to promote independence and mobility, and to reduce barriers and stressors, likely requires smart connected age and disability-friendly communities and cities.
Nearly one-fourth percent of the United States (U.S.) population is an older adult; one-fifth have a disability (1). The population of the older adults in the U.S. is projected to increase to 94.7 million by 2060 (1). About 90% of the older population would prefer to age in their homes and communities instead of institutional settings (1). Outdoor physical activity has multitudinous advantages for older adults (2). Physical activity can help reduce the risk of mental health problems and physical disease, such as depression, obesity, cancer, and cardiovascular diseases (2). Maintenance of safe mobility is essential for successful aging in communities and a major challenge faced by older adults. Those with limitations cease driving and depend on their caregivers, informal supports and services, or other alternative modes of transport to stay connected and mobile. For older adults to stay mobile, it is essential their physical and service environment is stressor and barrier free. Therefore, monitoring of outdoor physical activities is an area of high priority and a need (3).
While benefits of engaging with environment are numerous, such built environments can impose numerous barriers and stressors for older adults and for persons with disabilities to age-in-place. Prior studies/reviews have been conducted various demographic groups, such as older adults (4, 5), premenopausal women (6), children (7), and obese adults (8) to examine the relationship between urban elements (e.g., transportation systems, neighborhood disorders, land use) and their behaviors (9). However, prior studies could not sufficiently identify how older adults respond to diverse elements of urban built environments, including structural characteristics, safety attributes, and aesthetics. No prior review has explored the variety of stressors and barriers that can hinder healthy aging in one's preferred environments. Our review was aimed to fill this gap. The rational was 2-fold: (i) to assess the use of physiological responses to identify how older adults react to their ascribed environments during outdoor physical activity using physiologic responses, and to identify the (ii) needs of communities to adapt to the needs of older adult's so they can age-in-place.
We know connected technologies have numerous benefits and potential to allow older adults and those with disabilities to facilitate safe mobility, reduce falls and allow for partaking in outdoor physical activity. Traditional technologies have become outdated and emerging technologies are rapidly evolving. The purpose of this mini-review was to synthesize and describe the use of three emerging connected technologies to mitigate barriers and stressors to environmental stimuli for older adults and those with disabilities from a multidisciplinary perspective (e.g., from population health and aging, to health systems and design, to life-course health dynamics and disparities, to computer science and multidisciplinary engineering, to construction, architecture and transportation science), with the motivation for older adults and those with disabilities of all ages to successfully age in their neighborhoods and in their community and in their city environments. We defined connected or smart technology as embedded technology with sensors, processors, camera, and location services that would allow connection and communication with its environment via internet of things and provide data that could be accessed and analyzed via a platform. Additionally, the review provides challenges of collection, processing and analysis of mobile, real-time connected data from smartphones in various populations, including older adults, and how such data can be aggregated and visualized.
We conducted a literature review with no date restriction on connected technologies for older adults and for those with disability. We focused on three key connected technologies to assess stressors and barriers in community environments: (1) wearable sensing technologies; (2) computer vision techniques; and (3) transport needs, technologies and options for alternative transport modes. We used the following keywords “wearable sensing,” “physiological signals,” “physical activity or disorders,” “urban built environment,” “environmental barriers or stressors or stimuli,” “human perception of images,” “street-level scene,” “convolutional neural networks,” “mobile transport technologies,” “older adult modes of transport.”
Our results are summarized below as three separate topics.
Outdoor physical activities can be described as sleep/wake or as active/sedentary behavior (10, 11). These activities can be quantified by intensity of physical activity (12) or activity energy expenditure (13) or activities of daily living such as walking, running, sitting, stepping (14), and by using various transportation modes such bus, bicycle, car, and subway (15). The ambulatory monitoring of these measures requires comfortable, inexpensive, and accurate equipment, such as wearable devices.
The various confounding factors presented in the captured real-life data further require the contextualization of the corresponding signals, which can be achieved through location tracking with Global Positioning System coordinates (16). With recent advancements in sensing technologies, products such as Actigraph unit (4), Actical (7), Sensewear (8), and GENEActiv (17) can be drawn upon in an integrated electronic device (14). The device contains an Inertial Measurement Unit (IMU), ambient light sensor, sound detector, skin temperature sensor, and heat flux (9–11, 13). Wearable devices are generally worn on one's wrist or chest over a prolonged period of time.
Additionally, the sensors can be integrated with a smartphone-based application such as the Daynamica (15) and Discovery Tool to provide transparent data with the subjective user input via survey (18). For example, the Daynamica has been used to deliver personalized and context-aware interventions to app users in several research projects such as investigating the association among travel options, built and natural environments, and mood states in transport environments (15).
The physiological responses of older adult pedestrians can be reflective of human experience toward a surrounding environment, providing us unique insights into the elements of the urban built environments (e.g., neighborhood disorders and environmental barriers) (19–23). Various types of physiological response data including gait patterns, electrodermal activity (EDA), heart rate and brain activity (22, 24–26) have been have been investigated from collected physiological signals in virtual environments (27–29) naturalistic ambulatory settings and daily life locations, such as neighborhoods, downtown, urban parks, and university campuses (18, 20, 22, 23, 30–35). See Table 1 for a full list of references (18–32, 36–55). The physiological response data have been examined to recognize stress during walking trips and/or stressors of the surrounding environment on personal characteristics such as age (32, 38), gender (20), and degree of disability (37). The researchers investigated how specific populations including older adults and those visually impaired respond to the elements of urban built environment during walking trips.
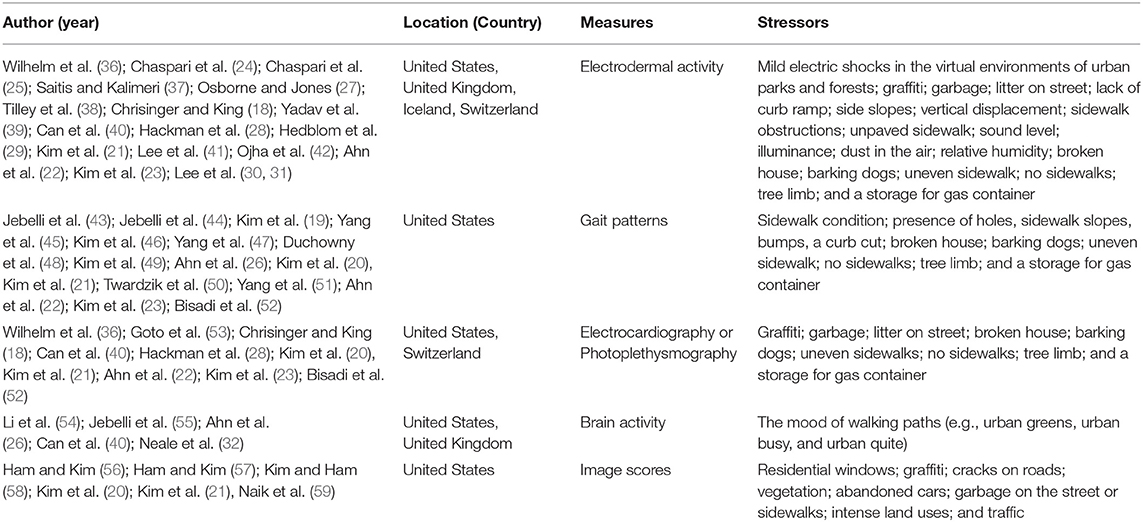
Table 1. Summary of stressors in community environments through wearable sensing technologies and computer vision techniques for adults and for those with disability.
In general, the gait pattern has been shown to correlate with physical barriers of urban built environments such as sidewalk defects, curbs, slopes, and holes (19–23, 43–52) (See Table 1). Signals, such as electrodermal activity (18, 21–25, 27–31, 36–42), electrocardiography or photoplethysmography (18, 20–23, 28, 36–40, 52, 53) and brain activity (26, 32, 40, 54, 55), have been separately used to understand psychological states toward stressors in relation to negative environmental stimuli (e.g., broken houses, barking dogs, and steep stairs) and the mood of walking paths such as urban busy and quiet areas (23, 30–32). Despite the premise and potential of ambulatory monitoring approaches to overcome the subjectivity related to traditional approaches (e.g., self-reporting and surveys), physiological data collected in real-life environments are confounded by various factors (e.g., weather conditions, physical movement, and the discomfort of wearing sensors) (20, 23–27). Additional testing and evaluation of such approaches is expected to provide a basis for developing a monitoring indicator of the elements of urban built environments to promote mobility for specific demographic groups (e.g., older adults, and those with disabilities).
To understand the source of physical and emotional distress, visual data such as street-level images are effective (20, 21, 53–55). A physical appearance of urban built environments via street-level images can be assessed based on human perception (59). Another tool, a visual perception survey, has been utilized to assess infrastructure defects or neighborhood disorders that can negatively affect behaviors in built environments. Such a survey tool can be leveraged for assessing stressors related to older adults' mobility and the associated physical and emotional distress through computer vision techniques. Although human perception of images is subjective (60, 61), leveraging a large amount of data obtained from a web-survey in online photo-sharing ensures the robustness of using visual data to assess human perception. An example is Photo.net started in 1997 by Philip Greenspun at MIT to study the aesthetics score of images based on peer ratings (62). This peer-rating system could be used to understand stressors in community environments and to analyze their impact on human perception. In this context, scene understanding algorithms building on the computer vision techniques have been examined. An example is the prediction of the perceived safety of a street-level scene, called “Streetscore” created as a training dataset using a machine learning model (59). Another example is the random selection and ranking of several Google Street-view images from New York, Boston, Linz, and Salzburg through a pairwise comparison (63).
In case studies, large amounts of data, on 4,109 multiple generic images were extracted for semantic scene classification and ranked through 208,738 pairwise comparisons operated by 7,782 participants (64). A trained using Support Vector Regression was used to create dataset of predicted perceived safety scores based on the Google Street-view and using a human- machine scoring framework (61, 65). The performance of the predictor was evaluated by comparing it to pairwise comparison. This research showed the potential to assess a human safety perception of the street- level scene using the computer vision techniques. However, challenges remained and included the predictor potentially failing when unusual visual elements such as atypical architecture were represented in images. Pairwise comparisons from the perspective of older adults can assess urban built environments that can cause physical and emotional distress. Additionally, vector algorithms and participatory sensing-based geospatial localization can evaluate objects in urban built environments (56, 58).
In order to scale up the computational methods to map the perceived safety to the city level and/or to the global scale, convolutional neural network models have been utilized, albeit with some challenges (57, 66). For example the dataset, called “Place Pulse 2.0, containing 110,988 images with 1.17 million pairwise comparisons, and scored by 81,630 online volunteers (59) answered six perceptual dimensions: safe, depressing, boring, lively, wealthy, and beautiful. This dataset was used to train two related convolutional neural networks: (1) Street score-CNN (SS-CNN) and (2) Ranking SS- CNN (RSS-CNN). The SS-CNN was designed for binary classification to predict which image will win against another in a pairwise comparison, but this network did not consider the total ranking over all the images in the dataset. The RSS-CNN included an additional ranking sub- network resulting in the minimization of loss on pairwise classification and total ranking over the dataset but had challenges on identifying exactly what objects in scenes create the human perception.
The early research on utility of transport technologies, focused on understanding driving patterns of teen drivers and how to use technology-based feedback. Such feedback included, identification of risky driving behavior (e.g., hard braking, severe turns), of mobility patterns (e.g., where and when teens drove them vehicles), and of (e.g., crashes) with the aim to eventually improve driving performance and safety (67–69). The continual evolution of low-cost, small size computing platforms has created significant opportunities to develop and deploy mobile transportation technologies and has allowed for a greater understanding of mobility patterns, and transportation needs of older adults and those with disabilities. There has been at least one demonstration effort to adapt this technology to improve older driver behaviors and safety. Manser developed smartphone-based software to collect driving behavior data in real-time and to provide behavioral and safety relevant cues that targeted motoric, cognitive, and perceptual challenges experienced by older drivers (70).
The results from the demonstration project suggests smartphone technologies can be suitably adapted to address several challenges for older drivers. However, there is a need to address individual differences to a greater degree.
Additionally, there have been significant advances in using large data pools to identify, understand, and modify driver behaviors. This data is most commonly collected by sensor sets in modern vehicles, transmitted to vehicle manufacturers, and then aggregated for use by the manufacturer or a third party (e.g., Otonomo, Wejo). The full utility of this data is being explored. Early uses include facilitating municipality and state agencies' ability to identify crash hot spots and deploy engineering-based countermeasures to modify vehicle operational parameters for optimized driver/vehicle interactions, and to assess the safety impacts of infrastructure-based infrastructure-based safety countermeasures.
The transport technologies pose two specific limitations and opportunities in their ability to address the user design needs, mobility patterns and transportation needs of older drivers and for persons with disabilities. First, mobile transportation technologies, such as smartphones require calibration to vehicles, can present data quality issues due to poorly secured mounting and can often run on specific smartphone platforms. Second, these physical considerations for secured mounting can limit the extent with which the technologies can be deployed and the scope to which they can benefit drivers.
In contrast, large data pools are collecting information from millions of vehicles across the U.S. every day. This is resulting in massive quantities of data without the need to consider any physical data limitations. Although, this may seem like a suitable solution; nevertheless, large data pools explicitly omit personally identifiable information (PII) or data that may lead to PII (e.g., location tracking near client homes). Additionally, large data pools do not provide questionnaires, surveys, and focus groups for a more complete understanding of the issues associated with older drivers and/or drivers with disabilities (71, 72). When considering the limitations for each approach for the aforementioned vulnerable populations it is evident no single solution is best for addressing the critical research questions to improve driver behavior and safety. There is reason for optimism. There are some preliminary, albeit undocumented, efforts to aggregate, mine and process multiple sources of connected (e.g., smartphone, vehicle, infrastructure, and environment). Such efforts include use of multi-sensor fusion techniques (73), aggregation of spatiotemporal data using machine learning algorithms, and use of artificial intelligence for block-chain enabled intelligent internet of things (loT) architecture to reach inference by minimizing and/or eliminating the limitations of individual data sources (74–76).
In older adults and/or in those with complex conditions [e.g., those with physical/cognitive disability, loss of driving privileges require alternative transportation options to reduce caregiver burden and to maintain independence and mobility (5, 71, 72)]. Community living younger and older adults and those with disabilities need access to transportation for timely medical and preventive care (71, 72). These vulnerable populations have transport needs to stay mobile in their communities for their well-being and for improved quality-of-life. Alternative options are needed for other transport modes beyond driving. These alternates transport modes are public ground transport (bus, subway, train), paratransit (vans/shuttles), fee-for-hire transportation (e.g., Lyft, Uber, E-hail, SilverRide, GoGoGrandParent), supplemental transportation programs (STPs), Medicaid non-emergency medical transportation, social transportation, and autonomous vehicles; see Table 2 (77–90).
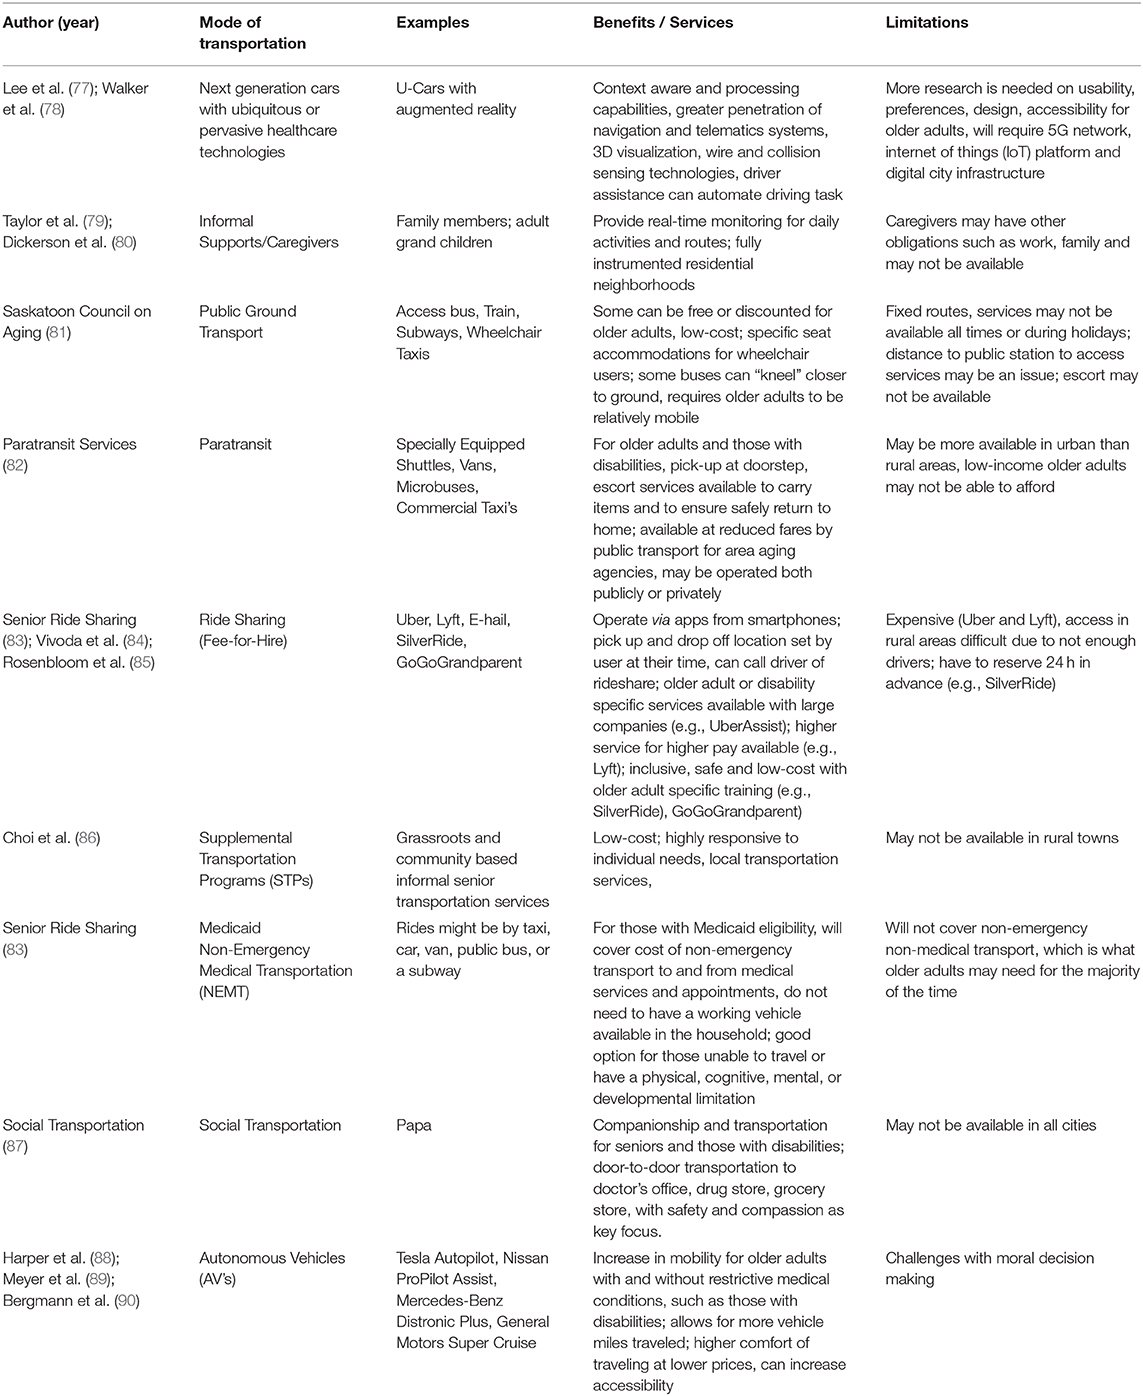
Table 2. Transport technologies, options and alternatives modes of service for older adults and for those with disability.
Our review synthesizing emerging trends on connected technologies, such as wearable sensors, computer vision techniques, and for transport technologies to mitigate barriers and stressors to environmental stimuli to assist safe mobility for age and disability-friendly communities. Given limited reviews exist on new generation technologies, this review is timely and novel, as it synthesizes findings from multidisciplinary perspectives.
We conducted a comprehensive review on stressors and identified numerous challenges and confounders involving connected technologies and for connected data. Challenges for user studies involving older adult population include high subjectivity of self-reports, challenges with wearable technologies, and confounding factors on the signals related to their health conditions. Additional testing and evaluation of such approaches is expected to provide a basis for developing an indicator to monitor elements of the urban built environment for specific demographic groups (e.g., younger and older adults and those with disabilities) with the goal to promote older adult's mobility. Future research on assessing stressors using vision data would involve exploring involve exploring the determinants of perceptual factors of distress in community environments. In addition, there is a need for building scene-centric databases with scene categories in the context of environmental stressors causing physical and emotional distress.
We acknowledge several limitations. Despite conducting a thorough review of literature, we may have missed other relevant findings. Additional limitations may be related to location (e.g., country) and populations (e.g., age group and gender). These can minimize the generalizability of our results in different social, cultural, population, and environmental contexts.
Environmental design for connected technologies and interventions to promote independence/mobility and to reduce barriers and stressors likely requires smart connected age and disability-friendly communities and cities (1, 5, 32, 71, 72, 91). Additionally, retaining older adults in a community who otherwise might leave to institutional settings can be an important economic policy and city development strategy.
PZ, JiK, JaK, MM, YH, TC, and CRA conception of mini-review, literature review, and for important intellectual content. PZ synthesized the first draft, it's revisions, and the final draft. CRA was responsible for securing funds. PZ, JiK, JaK, YH, and TC assisted with subsequent revisions. All authors contributed to the topics for this mini-review and approved the final version.
This work was supported by Texas A&M University President's Research Excellence, Interdisciplinary X-Grants (Round 2) to CRA (Team Lead), Chanam Lee, TC, YH, MM, and PZ.
The authors declare that the research was conducted in the absence of any commercial or financial relationships that could be construed as a potential conflict of interest.
The reviewer SZ declared a shared affiliation, though no other collaboration, with the authors to the handling Editor.
We thank Chanam Lee, Professor of Landscape Architecture and Urban Planning and founding director of Design Research for Active Living (DrAL) at Texas A&M University and Changbum Ryan Ahn, Associate Professor of the Department of Construction Science at Texas A&M University for suggestions on the topic focus and with the feedback on the preliminary version of the abstract. We are grateful to Margaret Foster, Professor and Systematic Review Coordinator at the Medical Sciences Library at Texas A&M University Libraries for helpful suggestions on the revision of the mini-review. The preliminary version of this paper was presented at the 2020 virtual Alzheimer's Association International Conference (AAIC).
1. US Department of Health, and Human Services. Administration for Community Living. Profile of Older Americans. (2018). Available online at: https://acl.gov/aging-and-disability-in-america/data-and-research/profile-older-americans (accessed January 30, 2021).
2. Manferdelli G, La Torre A, Codella R. Outdoor physical activity bears multiple benefits to health and society. J Sports Med Phys Fitness. (2019) 59:868–79. doi: 10.23736/S0022-4707.18.08771-6
3. Gao W, Emaminejad S, Nyein HYY, Challa S, Chen K, Peck A, et al. Fully integrated wearable sensor arrays for multiplexed in situ perspiration analysis. Nature. (2016) 529:509–14. doi: 10.1038/nature16521
4. Barreira TV, Brouillette RM, Foil HC, Keller JN, Tudor-Locke C. Comparison of older adults' steps per day using an NL-1000 pedometer and two GT3X+ accelerometer filters. J Aging Phys Activ. (2013) 21:402–16. doi: 10.1123/japa.21.4.402
5. Zanwar P, McGrew G, Heyn PC, Raji M. Assistive technology megatrends to support persons with Alzheimer's disease and related dementias age in habitat: challenges for usability, engineering, and public policy. In: Proceedings of the Workshop on Human-Habitat for Health (H3): Human-Habitat Multimodal Interaction for Promoting Health and Well-Being in the Internet of Things Era H3'18. New York, NY: ACM (2018). doi: 10.1145/3279963.3279971
6. Stiles VH, Griew PJ, Rowlands AV. Use of accelerometry to classify activity beneficial to bone in premenopausal women. Med Sci Sports Exerc. (2013) 669 45:2353–61. doi: 10.1249/MSS.0b013e31829ba765
7. Pfeiffer KA, Mciver KL, Dowda M, Almeida MJCA, Pate RR. Validation and 671 calibration of the actical accelerometer in preschool children. Med Sci Sports Exerc. (2006) 38:152–7. doi: 10.1249/01.mss.0000183219.44127.e7
8. Shuger SL, Barry VW, Sui X, McClain A, Hand GA, Wilcox S, et al. Electronic feedback in a diet- and physical activity-based lifestyle intervention for weight loss: a randomized controlled trial. Int J Behav Nutr Phys Activ. (2011) 8:41. doi: 10.1186/1479-5868-8-41
9. Schepps MA, Shiroma EJ, Kamada M, Harris TB, Lee I-M. Day length is 677 associated with physical activity and sedentary behavior among older women. Sci Rep. (2018) 8:6602. doi: 10.1038/s41598-018-25145-w
10. Baron KG, Reid KJ, Kim T, Van Horn L, Attarian H, Wolfe L, et al. 679 Circadian timing and alignment in healthy adults: associations with BMI, 680 body fat, caloric intake and physical activity. Int J Obes. (2017) 41:203–9. doi: 10.1038/ijo.2016.194
11. Gibbs BB, Aaby D, Siddique J, Reis JP, Sternfeld B, Whitaker K, et al. Bidirectional 10-year associations of accelerometer-measured sedentary behavior and activity categories with weight among middle-aged adults. Int J Obes. (2020) 44:559–67. doi: 10.1038/s41366-019-0443-8
12. Leppänen MH, Nyström CD, Henriksson P, Pomeroy J, Ruiz JR, Ortega FB, et al. Physical activity intensity, sedentary behavior, body composition and physical fitness in 4-year-old children: results from the ministop trial. Int J Obes. (2016) 40:1126–33. doi: 10.1038/ijo.2016.54
13. Delisle Nyström C, Pomeroy J, Henriksson P, Forsum E, Ortega FB, Maddison R, et al. Evaluation of the wrist-worn ActiGraph wGT3x-BT for estimating activity energy expenditure in preschool children. Eur J Clin Nutr. (2017) 71:1212–7. doi: 10.1038/ejcn.2017.114
14. Lowe SA, ÓLaighin G. Monitoring human health behavior in one's living environment: a technological review. Med Eng Phys. (2014) 36:147–68. doi: 10.1016/j.medengphy.2013.11.010
15. Glasgow TE, Le HTK, Scott Geller E, Fan Y, Hankey S. How transport modes, the built and natural environments, and activities influence mood: a GPS smartphone app study. J Environ Psychol. (2019) 66:101345. doi: 10.1016/j.jenvp.2019.101345
16. Gough C, Weber H, George S, Maeder A, Lewis L. Location monitoring of physical activity and participation in community dwelling older people: a scoping review. Disabil Rehabil. (2019) 43:270–83. doi: 10.1080/09638288.2019.1618928
17. Chan L, Ciol MA, Shumway-Cook A, Yorkston KM, Dudgeon BJ, Asch SM, et al. A Longitudinal evaluation of persons with disabilities: does a longitudinal definition help define who receives necessary care? Arch Phys Med Rehabil. (2008) 89:1023–30. doi: 10.1016/j.apmr.2007.10.045
18. Chrisinger BW, King AC. Stress experiences in neighborhood and social environments (SENSE): a pilot study to integrate the quantified self with citizen science to improve the built environment and health. Int J Health Geogr. (2018) 17:17. doi: 10.1186/s12942-018-0140-1
19. Kim H, Ahn CR, Yang K. A people-centric sensing approach to detecting sidewalk defects. Adv Eng Inform. (2016) 30:660–71. doi: 10.1016/j.aei.2016.09.001
20. Kim H, Ham Y, Kim H. Localizing local vulnerabilities in urban areas using crowdsourced visual data from participatory sensing. In: 2019 ASCE International Conference of Computing in Civil Engineering. Atlanta, GA (2019). doi: 10.1061/9780784482438.066
21. Kim J, Kim H, Ham Y. Mapping local vulnerabilities into a 3D city model through social sensing and the CAVE system toward digital twin city. In: 2019 ASCE International Conference of Computing in Civil Engineering. Atlanta, GA (2019). doi: 10.1061/9780784482445.058
22. Ahn C, Ham Y, Kim J, Kim J. A Digital twin city model for age-friendly communities: capturing environmental distress from multimodal sensory data. In: Proceedings of the 53rd Hawaii International Conference on System Sciences. Maui: Hawaii (2020). doi: 10.24251/HICSS.2020.206
23. Kim J, Yadav M, Chaspari T, Ahn CR. Saliency detection analysis of collective physiological responses of pedestrians to evaluate neighborhood-built environments. Adv Eng Inform. (2020) 43:101035. doi: 10.1016/j.aei.2020.101035
24. Chaspari T, Tsiartas A, Stein LI, Cermak SA, Narayanan SS. Sparse representation of electrodermal activity with knowledge-driven dictionaries. IEEE Trans Biomed Eng. (2015) 62:960–71. doi: 10.1109/TBME.2014.2376960
25. Chaspari T, Tsiartas A, Duker LIS, Cermak SA, Narayanan SS. EDA-gram: designing electrodermal activity fingerprints for visualization and feature extraction. In: 2016 38th Annual International Conference of the IEEE Engineering in Medicine and Biology Society (EMBC). Orlando, FL: IEEE (2016). p. 403–6. doi: 10.1109/EMBC.2016.7590725
26. Ahn CR, Lee S, Sun C, Jebelli H, Yang K, Choi B. Wearable sensing technology applications in construction safety and health. J Construct Eng Manage. (2019) 145:03119007. doi: 10.1061/(ASCE)CO.1943-7862.0001708
27. Osborne T, Jones PI. Biosensing and geography: a mixed methods approach. Appl Geogr. (2017) 87:160–9. doi: 10.1016/j.apgeog.2017.08.006
28. Hackman DA, Robert SA, Grübel J, Weibel RP, Anagnostou E, Hölscher C, et al. Neighborhood environments influence emotion and physiological reactivity. Sci Rep. (2019) 9:9498. doi: 10.1038/s41598-019-45876-8
29. Hedblom M, Gunnarsson B, Iravani B, Knez I, Schaefer M, Thorsson P, et al. Reduction of physiological stress by urban green space in a multisensory virtual experiment. Sci Rep. (2019) 9:10113. doi: 10.1038/s41598-019-46099-7
30. Lee G, Choi B, Jebelli H, Ahn CR, Lee S. Wearable biosensor and collective sensing–based approach for detecting older adults' environmental barriers. J Comput Civil Eng. (2020) 34:04020002. doi: 10.1061/(ASCE)CP.1943-5487.0000879
31. Lee G, Choi B, Ahn CR, Lee S. Wearable biosensor and hotspot analysis–based framework to detect stress hotspots for advancing elderly's mobility. J Manage Eng. (2020) 36:04020010. doi: 10.1061/(ASCE)ME.1943-5479.0000753
32. Neale C, Aspinall P, Roe J, Tilley S, Mavros P, Cinderby S, et al. The impact of walking in different urban environments on brain activity in older people. Cities Health. (2019) 4:94–106. doi: 10.1080/23748834.2019.1619893
33. Kim J, Yadav M, Ahn CR, Chaspari T. Saliency detection analysis of 885 pedestrians' physiological responses to assess adverse built environment features. In: ASCE International Conference on Computing in Civil Engineering. Reston, VA: American Society of Civil Engineers (2019). doi: 10.1061/9780784482445.012
34. Neal MB, DeLaTorre A. The Case for Age-Friendly Communities. Grantmakers in Aging. (2016). Available online at: https://www.giaging.org/documents/889160302_Case_for_AFC.pdf (accessed February 20, 2021).
35. Kim J, Ahn CR, Nam Y. The influence of built environment features on crowdsourced physiological responses of pedestrians in neighborhoods. Comput Environ Urban Syst. (2019) 75:161–9. doi: 10.1016/j.compenvurbsys.2019.02.003
36. Wilhelm FH, Pfaltz MC, Grossman P, Roth WT. Distinguishing emotional from physical activation in ambulatory psychophysiological monitoring. Biomed Sci Instrument. (2006) 42:458–63.
37. Saitis C., Kalimeri K. Identifying urban mobility challenges for the visually impaired with mobile monitoring of multimodal biosignals. In: Antona M, Stephanidis C, editors. Universal Access in Human-Computer Interaction. Users and Context Diversity. UAHCI 2016. Lecture Notes in Computer Science, vol. 9739. Cham: Springer (2016). p. 616–27. doi: 10.1007/978-3-319-40238-3
38. Tilley S, Neale C, Patuano A, Cinderby S. Older people's experiences of mobility and mood in an urban environment: a mixed methods approach using electroencephalography (EEG) and interviews. Int J Environ Res Public Health. (2017) 14:151. doi: 10.3390/ijerph14020151
39. Yadav M, Chaspari T, Kim J, Ahn CR. Capturing and quantifying emotional distress in the built environment. In: Proceedings of the Workshop on Human-Habitat for Health (H3): Human-Habitat Multimodal Interaction for Promoting Health and Well-Being in the Internet of Things Era H3'18. New York, NY: ACM (2018). doi: 10.1145/3279963.3279967
40. Can YS, Arnrich B, Ersoy C. Stress detection in daily life scenarios using smart phones and wearable sensors: a survey. J Biomed Informat. (2019) 92:103139.doi: 10.1016/j.jbi.2019.103139
41. Lee G, Choi B, Jebelli H, Ahn CR, Lee S. Reference signal-based method to remove respiration noise in electrodermal activity (EDA) collected from the field. In: Computing in Civil Engineering 2019: Data, Sensing, and Analytics. Reston, VA: American Society of Civil Engineers (2019). p. 17–25. doi: 10.1061/9780784482438.003
42. Ojha VK, Griego D, Kuliga S, Bielik M, Buš P, Schaeben C, et al. Machine learning approaches to understand the influence of urban environments on human's physiological response. Informat Sci. (2019) 474:154–69. doi: 10.1016/j.ins.2018.09.061
43. Jebelli H, Ahn CR, Stentz TL. Fall risk analysis of construction workers using inertial measurement units: validating the usefulness of the postural stability metrics in construction. Saf Sci. (2016) 84:161–70. doi: 10.1016/j.ssci.2015.12.012
44. Jebelli H, Changbum R, Stentz TL. Comprehensive fall-risk assessment of construction workers using inertial measurement units: validation of the gait-stability metric to assess the fall risk of iron workers. J Comput Civil Eng. (2016) 30:04015034. doi: 10.1061/(ASCE)CP.1943-5487.0000511
45. Yang K, Ahn CR, Vuran MC, Aria SS. Semi-supervised near-miss fall detection for ironworkers with a wearable inertial measurement unit. Automat Construct. (2016) 68:194–202. doi: 10.1016/j.autcon.2016.04.007
46. Kim H, Ahn CR, Yang K. Identifying safety hazards using collective bodily responses of workers. J Construct Eng Manage. (2017) 143:04016090. doi: 10.1061/(ASCE)CO.1943-7862.0001220
47. Yang K, Ahn CR, Vuran MC, Kim H. Collective sensing of workers' gait patterns to identify fall hazards in construction. Automat Construct. (2017) 82:166–78. doi: 10.1016/j.autcon.2017.04.010
48. Duchowny K, Clarke P, Gallagher NA, Adams R, Rosso AL, Alexander NB. Using mobile, wearable, technology to understand the role of built environment demand for outdoor mobility. Environ Behav. (2018) 51:671–88. doi: 10.1177/0013916517749256
49. Kim H, Ahn CR, Stentz TL, Jebelli H. Assessing the effects of slippery steel beam coatings to ironworkers' gait stability. Appl Ergonom. (2018) 68:72–9. doi: 10.1016/j.apergo.2017.11.003
50. Twardzik E, Duchowny K, Gallagher A, Alexander N, Strasburg D, Colabianchi N, et al. What features of the built environment matter most for mobility? Using wearable sensors to capture real-time outdoor environment demand on gait performance. Gait Post. (2019) 68:437–42. doi: 10.1016/j.gaitpost.2018.12.028
51. Yang K, Ahn CR, Kim H. Validating ambulatory gait assessment technique for hazard sensing in construction environments. Automat Construct. (2019) 98:302–9. doi: 10.1016/j.autcon.2018.09.017
52. Bisadi M, Kim H, Ahn CR, Nam Y. Effects of physical disorders in neighborhoods on pedestrians' physiological responses. Comput Civil Eng. (2017) 183–190. doi: 10.1061/9780784480847.023
53. Goto S, Park BJ, Tsunetsugu Y, Herrup K, Miyazaki Y. The effect of garden designs on mood and heart output in older adults residing in an assisted living facility. HERD. (2013) 6:27–42. doi: 10.1177/193758671300600204
54. Li X, Hijazi I, Koenig R, Lv Z, Zhong C, Schmitt G. Assessing essential qualities of urban space with emotional and visual data based on gis technique. ISPRS Int J Geo Informat. (2016) 5:218. doi: 10.3390/ijgi5110218
55. Jebelli H, Hwang S, Lee S. EEG signal-processing framework to obtain high- quality brain waves from an off-the-shelf wearable EEG device. J Comput Civil Eng. (2017) 32:04017070. doi: 10.1061/(ASCE)CP.1943-5487.0000719
56. Kim H, Ham Y. Evaluating Deterioration levels of utility poles using participatory sensing and fuzzy inference. In: ASCE Construction Research Congress. Tempe, AZ (2020). doi: 10.1061/9780784482865.087
57. Ham Y, Kim J. Participatory sensing and digital twin city: updating virtual city models for enhanced risk-informed decision-making. J Manag Eng. (2020) 36:04020005-1–12. doi: 10.1061/(ASCE)ME.1943-5479.0000748
58. Kim H, Ham Y. Participatory sensing-based geospatial localization of distant objects for disaster preparedness in urban built environments. Automat Construct. (2019) 107:102960. doi: 10.1016/j.autcon.2019.102960
59. Naik N, Philipoom J, Raskar R, Hidalgo C. Streetscore-predicting the perceived safety of one million streetscapes. In: IEEE Computer Society Conference on Computer Vision and Pattern Recognition Workshops. Washington, DC: IEEE Computer Society (2014). p. 793–9. doi: 10.1109/CVPRW.2014.121
60. Wang W, He Q. A survey on emotional semantic image retrieval. In: Proceedings - International Conference on Image Processing. Los Alamitos, CA: ICIP (2008) p. 117–20.
61. Yao Y, Liang Z, Yuan Z, Liu P, Bie Y, Zhang J, et al. A human- machine adversarial scoring framework for urban perception assessment using street-view images. Int J Geogr Inf Sci. (2019) 33:2363–84. doi: 10.1080/13658816.2019.1643024
62. Photo.net. Photo.net - Where Photographers Inspire Each Other. Available online at: https://www.photo.net/ (accessed January 30, 2021).
63. Salesses P, Schechtner K, Hidalgo CA. The collaborative image of the city: mapping the inequality of urban perception. PLoS ONE. (2013) 8:e68400. doi: 10.1371/journal.pone.0068400
64. Xiao J, Hays J, Ehinger KA, Oliva A, Torralba A. SUN database: large-scale scene recognition from abbey to zoo. In: Proceedings of the IEEE Computer Society Conference on Computer Vision and Pattern Recognition. San Francisco, CA (2010) p. 3485–92. doi: 10.1109/CVPR.2010.5539970
65. Schölkopf B, Smola AJ, Williamson RC, Bartlett PL. New support vector algorithms. Neural Computation. (2000) 12:1207–45. doi: 10.1162/089976600300015565
66. Dubey A, Naik N, Parikh D, Raskar R, Hidalgo CA. Deep learning the city : quantifying urban perception at a global scale. Lect Notes Comput Sci. (2016) 9905 LNCS:196–212. doi: 10.1007/978-3-319-46448-0_12
67. Creaser J, Edwards C, Manser M, Cooper J, Swanson B, Donath M. Teen Driver Support System (TDSS) Field Operational Test. Minneapolis, MN: University of Minnesota Center for Transportation Studies (2015).
68. Lerner N, Jenness J, Singer J, Klaur K, Lee SS, et al. An Exploration of Vehicle-Based Monitoring of Novice Teen Drivers. Washington, DC: National Highway Traffic Safety Administration. Technical paper number DOT HS 811 333 (2010).
69. Manser M, Edwards C, Lerner N, Jenness J, Huey R. Evaluation of a Prototype Safer Teen Car: Final Report. Washington, DC: National Highway Traffic Safety Administration. Technical paper number DOT HS 811 784 (2013).
70. Manser M. Development of a Smartphone-Based Older Driver Support System. Advancing Transportation Leadership and Safety (ATLAS Center). College Station, TX: Texas A&M Transportation Institute (2015).
71. Gimm G, Blodgett E, Zanwar P. Examining access to care for younger vs. older dual-eligible adults living in the community. Disabil Health J. (2016) 9:431–8. doi: 10.1016/j.dhjo.2015.12.004
72. Gimm G, Wood E, Zanwar P. Access to preventive services for working-age adults with physical limitations. Arch Phys Med Rehabil. (2017) 98:2442–8. doi: 10.1016/j.apmr.2017.05.017
73. ElFaouzi NE, Leung H, Kurian A. Data fusion in intelligent transportation systems: progress and challenges – a survey. Informat Fusion. (2011) 1:4–10. doi: 10.1016/j.inffus.2010.06.001
74. Weerasekera R, Sridharan M, Ranjitkar P. Implications of spatiotemporal data aggregation on short-term traffic prediction using machine learning algorithms. J Adv Transport. (2020) 2020:7057519. doi: 10.1155/2020/7057519
75. Miles JC, Walker AJ. The potential application of artificial intelligence in transport. IEE Proc Intell Transport Syst. (2006) 3:183–98. doi: 10.1049/ip-its:20060014
76. Singh SK, Rathore S, Park H. Block loT intelligence: a blockchain-enabled intelligent loT architecture with artificial intelligence. Fut Generat Comput Syst. (2020) 110:721–43. doi: 10.1016/j.future.2019.09.002
77. Lee JY, Rhee G. Context-aware 3D visualization and collaboration services for ubiquitous cars using augmented reality. Int J Adv Manufact Technol. (2008) 37:431–42. doi: 10.1007/s00170-007-0996-x
78. Walker GH, Stanton NA, Young MS. Where is computing driving cars? Int J Hum Comput Interact. (2009) 13:203–29. doi: 10.1207/S15327590IJHC1302_7
79. Taylor BD, Tripodes S. The effects of driving cessation on the elderly 856 with dementia and their caregivers. Accid Anal Prev. (2001) 33:519–28. doi: 10.1016/S0001-4575(00)00065-8
80. Dickerson AE, Molnar L, Bedard M, Eby DE, Classen S, Polgar J. Transportation and Aging: an updated research agenda for advancing safe mobility. J Appl Gerontology. (2019) 38:1643–60. doi: 10.1177/0733464817739154
81. Saskatoon Council on Aging. Age-Friendly Saskatoon Initiative Findings Report. Available online at: https://extranet.who.int/agefriendlyworld/wp-content/uploads/2018/05/Saskatoon-Age-friendly-Saskatoon-Initiative-Findings-Report-FULL_Dec.22-2011.pdf (accessed February 12, 2021).
82. Paratransit Services. Maintain Mobility & Independence. (2020). Available at: https://seniordriving.aaa.com/maintain-mobility-independence/other-ways-get-around/paratransit-services/ (accessed January 30, 2021).
83. Senior Ride Sharing. Uber, Lyft, SilverRide, GoGoGrandparent. (2020). Available at: https://www.seniorsmatter.com/ridesharing-transportation-for-seniors/2491978 (accessed January 30, 2021).
84. Vivoda JM, Harmon AC, Babulal GM, Zikmund-Fisher BJ. E-hail (Rideshare) knowledge, use, reliance, and future expectations among 867 older adults. Transp Res F Traffic Psychol Behav. (2018) 55:426–34. doi: 10.1016/j.trf.2018.03.020
85. Rosenbloom, S. Meeting transportation needs in an aging-friendly community. Am Soc Aging. (2009) 2:33–43. 870.
86. Choi NG, DiNitto DM. Depressive symptoms among older adults who do not drive: association with mobility resources and perceived transportation barriers. Gerontologist. (2016) 56:432–43. doi: 10.1093/geront/gnu116
87. Papa. Ride safely and effectively. Available online at: https://www.joinpapa.com/activities/transportation-for-seniors (accessed January 30, 2021).
88. Harper CD, Hendrickson CT, Mangones S, Samaras C. Estimating potential increases in travel with autonomous vehicles for the non-driving, elderly and people with travel-restrictive medical conditions. Transport Res C Emerge Technol. (2016) 72:1–9. doi: 10.1016/j.trc.2016.09.003
89. Meyer J, Becker H, Bosch BM, Axhausen W. Autonomous vehicles: the next jump in accessibilities? Res Transport Econom. (2017) 62:80–91. doi: 10.1016/j.retrec.2017.03.005
90. Bergmann LT, Schlicht L, Meixner C, Konig P, Gordon P, Boshammer S, et al. Autonomous vehicles require socio-political acceptance-an empirical and philosophical perspective on the problem of moral decision making. Front Behav Neurosci. (2018) 12:31. doi: 10.3389/fnbeh.2018.00031
Keywords: stressors, connected technologies, wearable sensors, computer vision, transport technologies, alternative transport modes, age-friendly communities, disability-friendly communities
Citation: Zanwar P, Kim J, Kim J, Manser M, Ham Y, Chaspari T and Ahn CR (2021) Use of Connected Technologies to Assess Barriers and Stressors for Age and Disability-Friendly Communities. Front. Public Health 9:578832. doi: 10.3389/fpubh.2021.578832
Received: 01 July 2020; Accepted: 20 January 2021;
Published: 11 March 2021.
Edited by:
Erja Portegijs, University of Jyväskylä, FinlandReviewed by:
Steven A. Cohen, University of Rhode Island, United StatesCopyright © 2021 Zanwar, Kim, Kim, Manser, Ham, Chaspari and Ahn. This is an open-access article distributed under the terms of the Creative Commons Attribution License (CC BY). The use, distribution or reproduction in other forums is permitted, provided the original author(s) and the copyright owner(s) are credited and that the original publication in this journal is cited, in accordance with accepted academic practice. No use, distribution or reproduction is permitted which does not comply with these terms.
*Correspondence: Preeti Zanwar, UHJlZXRpLlphbndhckBhbHVtbmkudXRoLmVkdQ==
Disclaimer: All claims expressed in this article are solely those of the authors and do not necessarily represent those of their affiliated organizations, or those of the publisher, the editors and the reviewers. Any product that may be evaluated in this article or claim that may be made by its manufacturer is not guaranteed or endorsed by the publisher.
Research integrity at Frontiers
Learn more about the work of our research integrity team to safeguard the quality of each article we publish.