- 1Brien Holden Vision Institute, Public Health, Sydney, NSW, Australia
- 2Vision CRC, Sydney, NSW, Australia
- 3School of Optometry and Vision Science, University of New South Wales, Kensington, NSW, Australia
- 4Indigenous Eye Health, Melbourne School of Population and Global Health, The University of Melbourne, Parkville, VIC, Australia
- 5Menzies School of Health Research, Charles Darwin University, Brisbane, QLD, Australia
Background: Routine eye and vision assessments are vital for the detection and subsequent management of vision loss, which is particularly important for Aboriginal and Torres Strait Islander people who face higher rates of vision loss than other Australians. In order to guide improvements, this paper will describe patterns, variations, and gaps in these eye and vision assessments for Aboriginal and Torres Strait Islander people.
Methods: Clinical audits from 124 primary healthcare centers (sample size 15,175) from five Australian states and territories were conducted during 2005–2012. Main outcome measure was adherence to current guidelines for delivery of eye and vision assessments to adults with diabetes, those without a diagnosed major chronic disease and children attending primary healthcare centers.
Results: Overall delivery of recommended eye and vision assessments varied widely between health centers. Of the adults with diabetes, 46% had a visual acuity assessment recorded within the previous 12 months (health center range 0–88%) and 33% had a retinal examination recorded (health center range 0–73%). Of the adults with no diagnosed major chronic disease, 31% had a visual acuity assessment recorded within the previous 2 years (health center range 0–86%) and 13% had received an examination for trichiasis (health center range 0–40%). In children, 49% had a record of a vision assessment (health center range 0–97%) and 25% had a record of an examination for trachoma within the previous 12 months (health center range 0–100%).
Conclusion: There was considerable range and variation in the recorded delivery of scheduled eye and vision assessments across health centers. Sharing the successful strategies of the better-performing health centers to support focused improvements in key areas of need may increase overall rates of eye examinations, which is important for the timely detection, referral, and treatment of eye conditions affecting Aboriginal and Torres Strait Islander people, especially for those with diabetes.
Introduction
Aboriginal and Torres Strait Islander Australians experience significantly higher rates of vision impairment than other Australians (1, 2). The largely avoidable, preventable, or treatable nature of the majority (94%) of these cases (2) indicates the need for improved early detection pathways, timely referral, and appropriate and accessible treatment. Additionally, as Aboriginal and Torres Strait Islander adults with diabetes, older than 40 years, form 72% of those requiring an eye examination in any year (3), understanding ways to further improve access and uptake of eye assessments for patients with diabetes is important, given their higher risk of preventable vision loss.
Eye health services for Aboriginal and Torres Strait Islander communities are typically provided by visiting practitioners; even more so in remote or very remote locations (4). However, there is still a shortage of optometric and ophthalmic services in many rural and remote areas (4, 5) and significantly lower rates of eye examinations (by optometrists or ophthalmologists) in areas with higher proportions of Aboriginal and Torres Strait Islander people (4, 6). Current policy recommendations for better Aboriginal and Torres Strait Islander eye care in the “Roadmap to Close the Gap for Vision” place emphasis on primary eye care as part of comprehensive primary health care to address barriers to eye care (7). Similarly, international eye care strategies highlight the key role of primary health care in preventing vision loss and blindness (8).
As primary healthcare (PHC) centers are the frontline of health service delivery, they can often be the first point of contact for Aboriginal and Torres Strait Islander adults with diabetes or vision/eye problems. Hence, PHC centers play a crucial role in eye care (9), especially for patients with diabetes (7). Basic eye and vision screening assessments are conducted during routine health assessments such as the Aboriginal and Torres Strait Islander Health Assessment (10). When linked with distinct eye care referral processes, regular screening can help to identify and refer eye problems earlier, preventing vision loss (11). Primary healthcare practitioners also play a case management role, supporting and coordinating patients’ timely access to comprehensive eye examinations and specialist eye care, particularly for patients with chronic conditions such as diabetes (12). This process can help improve efficiency of eye care service delivery systems by identifying and referring cases needing comprehensive eye care, targeting visiting eye care services to patients who most need them, and detecting vision problems at earlier stages (particularly important in the case of diabetic retinopathy) (13).
To gain insight into primary eye care coverage in Aboriginal and Torres Strait Islander PHC centers and to establish a baseline for comparison with future studies, we undertook an exploratory analysis of datasets from clinical file audits of PHC centers participating in the quality improvement action research project – the Audit and Best practice for Chronic Disease (ABCD) project (14). This study describes patterns, variations, and gaps in eye and vision assessments and associations with geographic location of health center, patient age, gender, and health center attendance. We discuss the implications of the findings with a focus on identifying approaches that will drive improvements in primary eye care services for Aboriginal and Torres Strait Islander communities.
Materials and Methods
Study Population and Data Collection
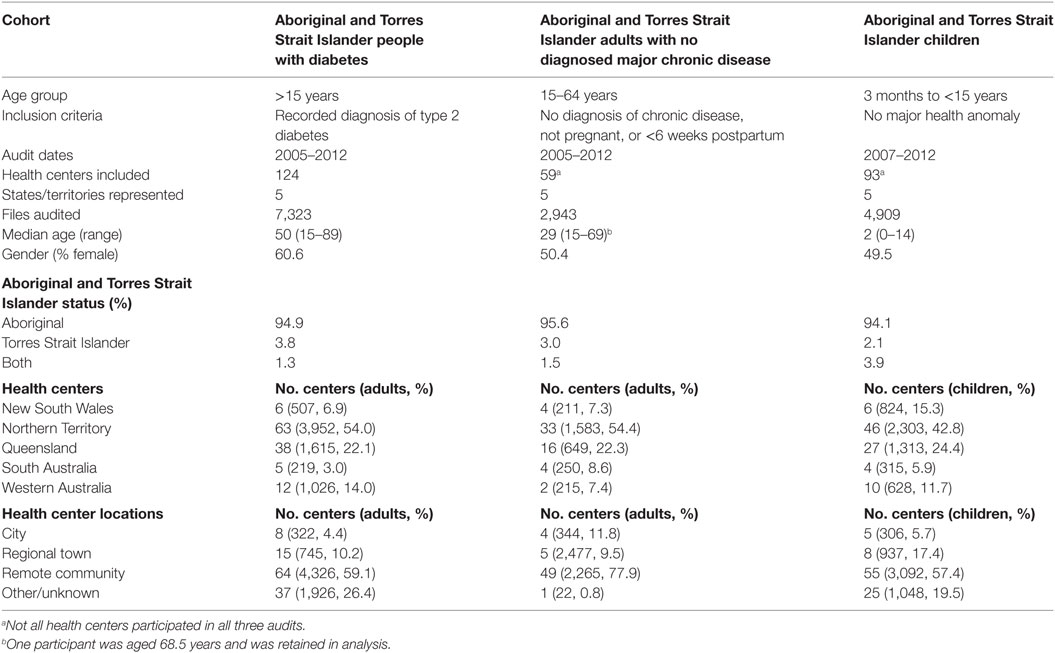
The data presented here were collected as part of a national quality improvement project – the ABCD project (15), between 2005 and 2012. One hundred and twenty-four Aboriginal and Torres Strait Islander PHC centers in five states/territories voluntarily performed annual audits of client medical records and provided de-identified audit data to the ABCD National Research Partnership to investigate variations in quality of care. The audits were conducted by trained members of the project team in conjunction with local PHC center staff using three standardized audit tools and protocols developed by the Menzies School of Health Research. These tools assess: (1) delivery of services to clients with Type 2 diabetes, (2) delivery of preventative health care, and (3) delivery of child health care. For each of these client cohort datasets, the delivery of eye and vision services according to existing best practice guidelines (Table 1) was assessed.
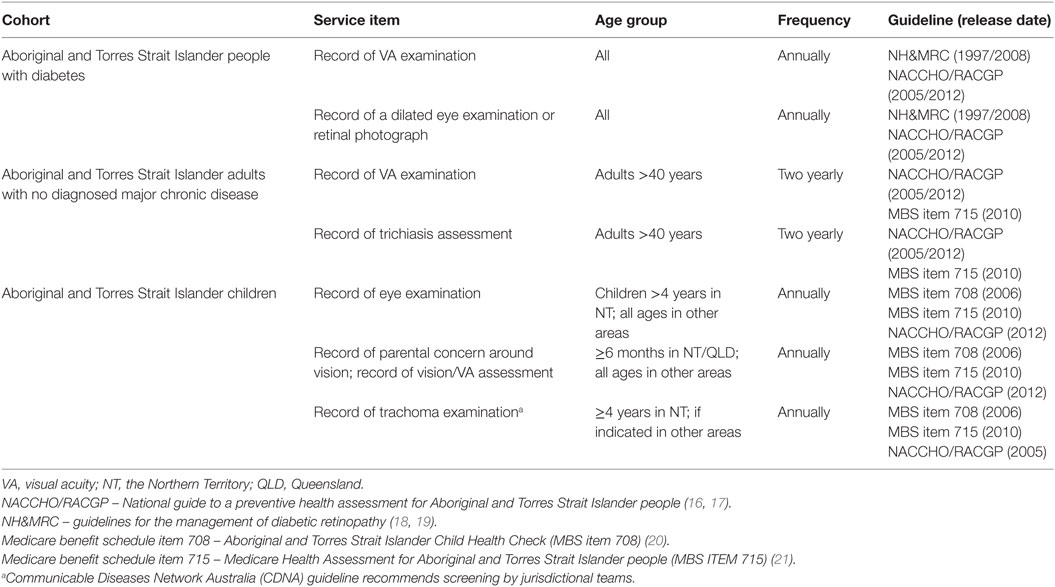
Table 1. Recommended eye and vision assessments for Aboriginal and Torres Strait Islander Australians.
For the three client cohorts, the records of Aboriginal and Torres Strait Islander clients who met the following criteria were eligible for audit: (1) Aboriginal and Torres Strait Islander patients with a definite diagnosis of Type 2 diabetes aged 15 years and over, (2) Aboriginal and Torres Strait Islander adults with no diagnosed major chronic disease attending the PHC center, in the prior 24 months from the date of the audit, for an annual well-person’s check, acute care, or a preventative service, and aged between 15 and 64 years, and (3) Aboriginal and Torres Strait Islander children aged 15 years and under. For each of these client cohorts, clients were required to be residents of the community for at least 6 months of 12 months prior to the audit (or in the case of an infant, half the infant’s life) in order to be eligible. A random sample of 30 clinical records for each cohort was audited from participating centers (Table 2), where there were fewer than 30 eligible records identified, all eligible records were included. Eye and vision services were assessed as “delivered” if there was a record of the service being delivered within specific periods in line with best practice eye care guidelines.
Statistical Analysis
Treating individual clients as the unit of analysis, our data had inherent multilevel, dependency structure as eye and vision care data collected at the individual level were clustered within health centers. Multistage logistic regression models were used to examine associations of specific factors (location, age, gender, and attendance), with delivery of eye and vision care services (Tables 3–5). The outcomes included eye examination, vision assessment, and examination for trichiasis and trachoma. The year of audit was added as a factor in the model to account for the variation over time. Association with outcomes was described using odds ratio and 95% confidence intervals. Variations in eye or vision assessments between health centers were described using violin plots. Level of statistical significance was set at 5%. Analysis was performed using STATA and SPSS (Version 22.0., IBM Corp., Armonk, NY, USA).
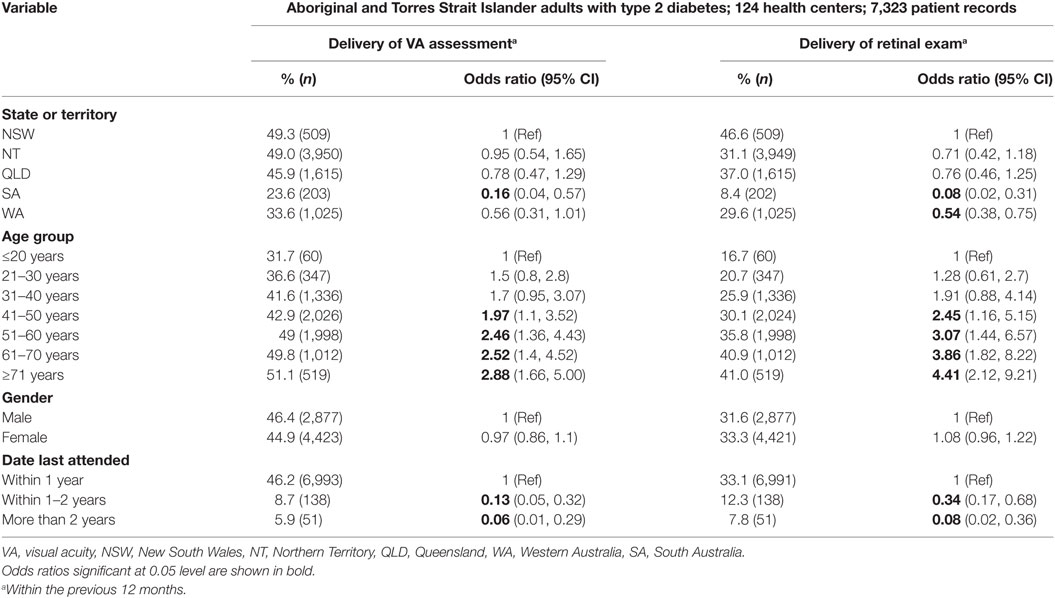
Table 3. Adjusted multilevel logistic regression analysis of patient characteristics and documented delivery of vision and eye health services for Aboriginal and Torres Strait Islander adults with diabetes in participating health centers between June 2005 and August 2012.
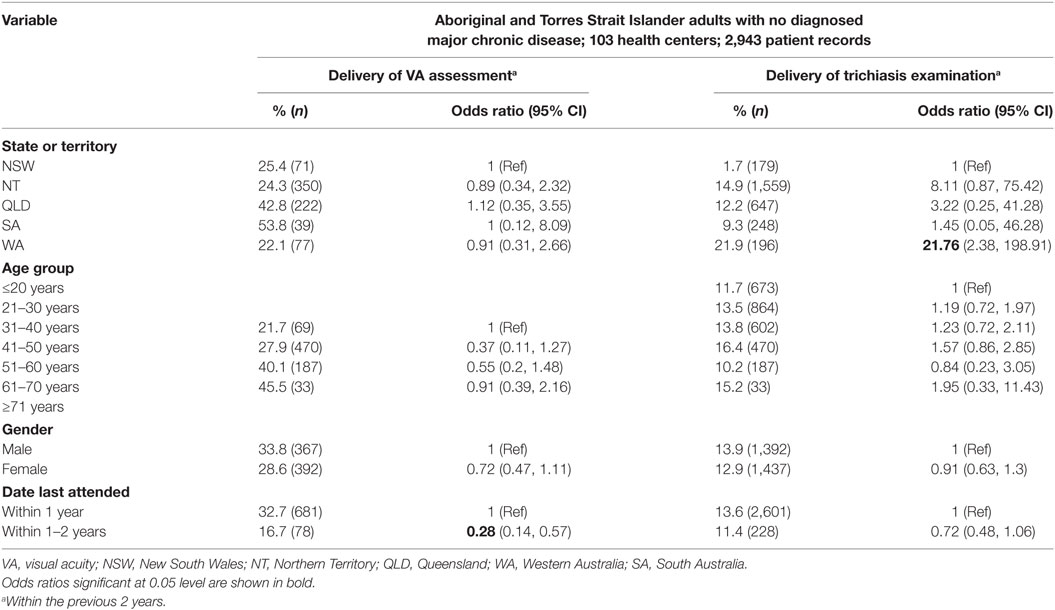
Table 4. Adjusted multilevel logistic regression analysis of patient characteristics and documented delivery of vision and eye health services for Aboriginal and Torres Strait Islander adults in participating health centers between June 2005 and August 2012.
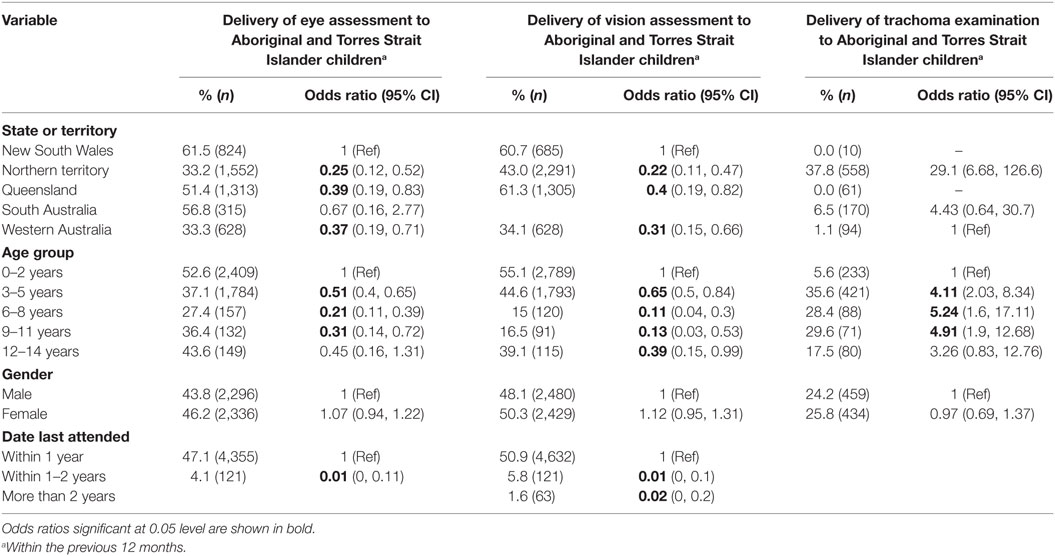
Table 5. Adjusted multilevel logistic regression analysis of patient characteristics and documented delivery of vision and eye health services for Aboriginal and Torres Strait Islander children in participating health centers between June 2005 and August 2012.
Ethics approval was obtained from research ethics committees in each jurisdiction [Human Research Ethics Committee of the Northern Territory Department of Health and Menzies School of Health Research (HREC-EC00153); Central Australian Human Research Ethics Committee (HREC-12-53)]; New South Wales Greater Western Area Health Service Human Research Committee (HREC/11/GWAHS/23); Queensland Human Research Ethics Committee Darling Downs Health Services District (HREC/11/QTDD/47); South Australian Aboriginal Health Research Ethics Committee (04-10-319); Curtin University Human Research Ethics Committee (HR140/2008); Western Australian Country Health Services Research Ethics Committee (2011/27); Western Australia Aboriginal Health Information and Ethics Committee (111-8/05); University of Western Australia Human Research Ethics Committee (RA/4/1/5051).
Results
The records of 15,175 Aboriginal and Torres Strait Islander clients were audited from 124 participating health centers across various locations (comprising city, regional, and remote jurisdictions) from five Australian states and territories (Table 2). Among the records of adults with diabetes, 46% (3,320/7,320) had a VA assessment recorded and 33% (2,381/7,300) had records of receiving a retinal examination within the previous 12 months. Of the records of the adults with no diagnosed major chronic disease, 31% had a VA assessment recorded within the last 2 years (236/759), while only 13% (380/2,829) of the audited records had received an examination for trichiasis. From the records of children, 49% (2,415/4,909) had a vision assessment recorded within the past 12 months (guidelines recommend an annual assessment for children aged ≥4 years in NT or ≥3 months in all other areas), 45% (2,085/4,632) had a record of an eye examination and 25% (223/893) had a record of an examination for trachoma (guidelines recommend an annual examination for children aged ≥4 years old in the NT, or if indicated in other states and territories).
There was significant variability in documented delivery of these assessments by state/territory and location (Tables 3–5). Participating PHC centers in New South Wales (NSW), the Northern Territory (NT), and Queensland (QLD) had relatively high recorded VA assessments and retinal examinations for adults with diabetes, while Western Australian (WA) health centers recorded higher rates of trichiasis examinations to adults with no diagnosed major chronic disease. Similarly, variation was observed in delivery between states among the audited child records, with participating PHC centers in NSW and South Australia (SA) delivering the most eye assessments and those in the NT recording the most trachoma examinations for children.
There was considerable variation in delivery of scheduled services to Aboriginal and Torres Strait Islander clients across health centers (Figure 1). The range between health centers for delivery of VA assessments to adults with type 2 diabetes was from 0 to 88%, while the delivery of retinal examinations ranged from 0 to 73%. For adults with no diagnosed major chronic disease, the range of documented delivery of visual acuity assessments was between 0 and 86%, with the range of trichiasis examinations delivered between 0 and 40%. Some centers provided vision and eye assessments to 100% of eligible children – the delivery of trachoma and eye examinations to eligible children ranged from 0 to 100%, while the delivery of the vision assessment ranged from 0 to 97%.
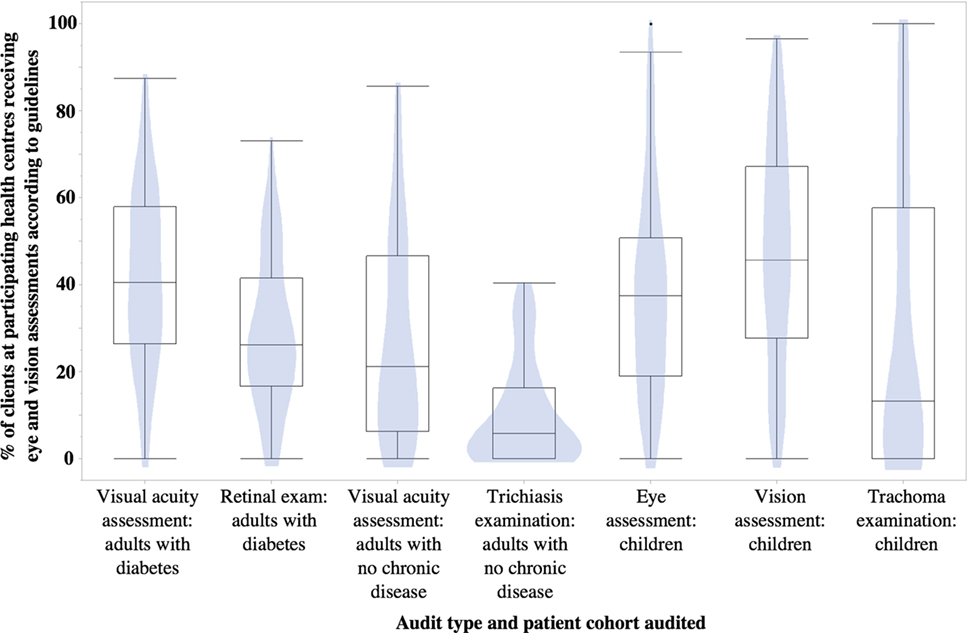
Figure 1. Variation in percentage delivery of eye and vision assessments to Aboriginal and Torres Strait Islander patients across participating primary health centers. Polygons represent the proportion of primary healthcare services delivering services at that percentage rate; box limits indicate the 25th and 75th percentiles; and whiskers extend 1.5 times the interquartile range from the 25th to 75th percentiles.
Documented delivery of VA and retinal examinations increased with age for adults with diabetes, but not for documented delivery of VA and trichiasis assessments to adults with no major chronic disease (Table 4). There was no variability between genders for adults (Tables 3 and 4) or children (Table 5). Documented eye assessments were significantly more likely for patients who had visited the health center within the previous 12 months.
Discussion
Our investigation revealed significant variation in the documented delivery of eye and vision assessments to Aboriginal and Torres Strait Islander clients attending PHC centers. While some centers provided excellent levels of assessments, others provided low levels. This variation in performance presents an opportunity for improvement in the documented delivery of these assessments by examining the factors that underlie variation in delivering services, as has previously been conducted in Aboriginal and Torres Strait Islander communities for preventative and diabetes care (22, 23). The successful strategies of the better-performing health centers could then be shared with the under-performing, to inform and support focused improvements in key areas of need.
On average, clients with diabetes were more likely to have a VA assessment recorded (46%) than adults with no diagnosed major chronic disease (31%). This may reflect the stricter adherence to routine screening and regular monitoring for patients with diabetes encouraged by chronic disease management plans. It may also reflect practitioners’ knowledge of the risk of increased vision loss for patients with diabetes or patients’ reports of issues with their vision. Additionally, patients with greater engagement in their health care may be more likely to engage with eye care services.
In this study, only 33% of Aboriginal and Torres Strait Islander adults with diabetes had a documented retinal examination within the previous 12 months. This is consistent with a previous audit of patient files in the NT, which reported that 34% had a documented fundus examination in the prior 12 months (24). The National Indigenous Eye Health Survey conducted in 2008 also reported low frequencies (20%) of eye examinations for patients with diabetes (self-reported) (2). Understanding ways to further improve access and uptake of eye assessments for patients with diabetes is important, given their higher risk of preventable vision loss. As retinal examinations largely rely on services being provided by visiting or off-site eye practitioners, utilizing retinal photo-screening integrated with primary care, image grading, and reporting systems may increase rates of examinations. This strategy has been shown to improve screening outcomes for other Australians with diabetes (25, 26). As we were unable to determine which centers used retinal imaging in this dataset, we could not investigate whether retinal imaging influences examinations rates. This may be useful in future audits.
Australia is the only high-income country in the world where trachoma is endemic – trachoma currently occurs in remote and very remote Aboriginal communities in the NT, SA, and WA (27), with pockets of trachoma in Far West NSW and Far North QLD (2). Although trachoma examinations were recorded more frequently for NT children, 60% of children from the NT did not have a trachoma examination recorded, despite guidelines stating that all children aged 4 years or older should be examined for trachoma annually. In the other participating states, less than 10% of children in areas where trachoma was indicated had a recorded trachoma examination. The National Trachoma Surveillance and Reporting Unit (NTSRU) jurisdiction covers communities designated as being at-risk or potentially at-risk of trachoma and has reported trachoma screening rates ranging from of 63 to 92% (27). Our results are significantly less than this, and this would seem to reflect the failure to record in the clinical records the trachoma examinations conducted by the jurisdictional trachoma screening programs. Improved coordination between external trachoma screening services and PHC centers will enable PHC centers to continue to make a significant contribution toward closing the gap for vision in Australia (9).
Several limitations should be acknowledged when interpreting these data. First, the data only indicate recorded services provided. Given that some aspects of eye care may be accessed in other off-site settings (e.g., optometry and ophthalmology services), it is probable that the rates of retinal examinations may be higher than recorded in PHC records. Second, as these data are only from the Aboriginal and Torres Strait Islander health centers that agree to have their audit data included in the aggregate for the ABCD project, findings are not necessarily representative of all health centers across Australia. Third, the relatively small numbers, self-selection, and uneven distribution of participating health centers in some states/territories means that the data cannot be regarded as broadly representative for these jurisdictions and hence any comparison between state and territory data should only be considered as representative of the cluster of health services participating from each jurisdiction. The inclusion of the state/territory variables in the multivariate models was primarily to enhance model fit and adjust for state/territory level confounders. Finally, as the timeframe in which the adult audit data was collected (2005–2012) precedes the date (2013) from when adult vision and eye assessments became mandatory within Aboriginal and Torres Strait Islander health assessments (MBS715) (28), it is possible that reporting has since improved. A useful area for future analysis would be to determine whether mandatory inclusion of vision tests in adult health assessments has had a significant impact on rates of recorded eye assessments – these results provide an important baseline from which future improvements could be demonstrated. Furthermore, given that the ABCD program and associated audits exist for the purpose of supporting continuous quality improvement (CQI), another useful area for future study may be to track changes in recorded rates of eye and vision assessments over time.
This study has identified opportunities for PHC centers to increase the documented delivery of eye and vision assessments to Aboriginal and Torres Strait Islander clients. Establishing or strengthening systems for external eye practitioners to report back to PHC practitioners’ results from retinal examinations or retinal photograph for people with diabetes may lead to notable improvements and represents a potential “quick win” to increase the rates of recorded retinal examinations. More importantly, it would also offer better patient care and coordination by informing PHC practitioners’ of eye care history for the patients they oversee. Similarly, strengthening coordination with external trachoma screening programs may also allow PHC practitioners to better monitor trachoma endemicity in their community.
Conclusion
Routine eye and vision assessments for Aboriginal and Torres Strait Islander adults and children attending PHC centers are currently not being recorded at the recommended levels with considerable variation between health centers. These results can represent a baseline, from which improvements in primary eye and vision assessments for Aboriginal and Torres Strait Islander Australians could be made and monitored.
These results also highlight the value of performing clinical audits to identify aspects of eye care and health centers that are being conducted relatively well, or need improvement. The successful strategies of the better-performing health centers could then be shared with the under-performing, to inform and support focused improvements in key areas of need.
Author Contributions
AB interpreted the data and drafted the manuscript. AM contributed to interpretation of the data, drafting, and critically revised the manuscript. TN analyzed and the data and contributed to interpretation. AB, HT, and RB critically reviewed and commented on the project design and on the manuscript. All authors read and approved the final manuscript.
Conflict of Interest Statement
The authors declare that the research was conducted in the absence of any commercial or financial relationships that could be construed as a potential conflict of interest.
Acknowledgments
This project was only possible with the contributions and partnership with the ABCD National Partnership Project team. We thank Veronica Matthews for her expertise in data analysis and reviewing the manuscript.
Funding
The ABCD National Research Partnership Project is supported by funding from the National Health and Medical Research Council (ID No.545267) and the Lowitja Institute, and by in-kind and financial support from a range of Aboriginal Community Controlled and Government agencies. This study was funded by the Brien Holden Vision Institute and the Australian Government’s CRC scheme through the Vision CRC.
References
1. Taylor HR, Xie J, Fox S, Dunn RA, Arnold AL, Keeffe JE. The prevalence and causes of vision loss in Indigenous Australians: the National Indigenous Eye Health Survey. Med J Aust (2010) 192(6):312–8.
2. Taylor HR, Keeffe J, Arnold AL, Dunn R, Fox S, Goujon N, et al. National Indigenous Eye Health Survey, Minum Barreng (Tracking Eyes). Melbourne: Melbourne School of Population Health (2009).
3. Tapp RJ, Boudville AI, Abouzeid M, Anjou MD, Taylor HR. Impact of diabetes on eye care service needs: the National Indigenous Eye Health Survey. Clin Exp Ophthalmol (2015) 43(6):540–3. doi:10.1111/ceo.12499
4. Taylor HR, Stanford E. Provision of Indigneous Eye Health Services. Melbourne: Indigenous Eye Health Unit, Melbourne School of Population Health, The University of Melbourne (2010).
5. Kiely PM, Chakman J. Optometric practice in Australian Standard Geographical Classification – remoteness areas in Australia, 2010. Clin Exp Optom (2011) 94(5):468–77. doi:10.1111/j.1444-0938.2011.00590.x
6. Kelaher M, Ferdinand A, Taylor H. Access to eye health services among indigenous Australians: an area level analysis. BMC Ophthalmol (2012) 12(1):51. doi:10.1186/1471-2415-12-51
7. Taylor H, Anjou M, Boudville A, McNeil R. The Roadmap to Close the Gap for Vision. Melbourne, VIC: Melbourne School of Population Health, The University of Melbourne: Indigenous Eye Health Unit (2012).
8. World Health Organization. Strategies for the Prevention of Blindness in National Programmes: A Primary Health Care Approach. Geneva: World Health Organization (1997).
9. Boudville AI, Anjou MD, Taylor HR. Improving eye care for indigenous Australians in primary health care settings. Aust J Rural Health (2013) 21(2):121–7. doi:10.1111/ajr.12014
10. Australian Government Department of Health. Medicare Health Assessments for Aboriginal and Torres Strait Islander People (MBS Item 715). Woden, ACT: Department of Health (2013).
11. Wang F, Ford D, Tielsch JM, Quigley HA, Whelton PK. Undetected eye disease in a primary care clinic population. Arch Intern Med (1994) 154(16):1821–8. doi:10.1001/archinte.154.16.1821
12. Rowe S, MacLean CH, Shekelle PG. Preventing visual loss from chronic eye disease in primary care: scientific review. JAMA (2004) 291(12):1487–95. doi:10.1001/jama.291.12.1487
13. Anjou MD, Boudville AI, Taylor HR. Local co-ordination and case management can enhance indigenous eye care – a qualitative study. BMC Health Serv Res (2013) 13:255. doi:10.1186/1472-6963-13-255
14. Bailie RS, Si D, O’Donoghue L, Dowden M. Indigenous health: effective and sustainable health services through continuous quality improvement. Med J Aust (2007) 186(10):525–7.
15. Bailie R, Si D, Connors C, Weeramanthri T, Clark L, Dowden M, et al. Study protocol: Audit and Best Practice for Chronic Disease Extension (ABCDE) project. BMC Health Serv Res (2008) 8:184. doi:10.1186/1472-6963-8-184
16. National Aboriginal Community Controlled Health Organisation (NACCHO), The Royal Australian College of General Practitioners. National Guide to a Preventive Health Assessment for Aboriginal and Torres Strait Islander people. South Melbourne: The RACGP (2005).
17. National Aboriginal Community Controlled Health Organisation (NACCHO), The Royal Australian College of General Practitioners (RACGP). National Guide to a Preventative Health Assessment for Aboriginal and Torres Strait Islander People. South Melbourne: The RACGP (2012).
18. National Health and Medical Research Council. Management of diabetic retinopathy. Clinical Practice Guidelines. Canberra: Commonwealth Department of Health and Family Services (1997). p. 50–1.
19. National Health and Medical Research Council. Guidelines for the Management of Diabetic Retinopathy. Barton, ACT: Australian Diabetes Society for the Department of Health and Ageing (2008).
20. Australian Government Department of Health and Ageing. Aboriginal and Torres Strait Islander Child Health Check (MBS Item 708). Medicare Benefits Schedule Book. (2006). p. 42–5. Available from: http://www.health.gov.au/mbsonline (accessed 3rd October 2016).
21. Australian Government Department of Health and Ageing. Medicare health assessments for aboriginal and Torres Strait Islander people (MBS Item 715). Medicare Benefits Schedule Book. (2010). p. 48–51. Available from: http://www.health.gov.au/mbsonline (accessed 3rd October 2016).
22. Si D, Bailie R, Dowden M, Kennedy C, Cox R, O’Donoghue L, et al. Assessing quality of diabetes care and its variation in Aboriginal community health centres in Australia. Diabetes Metab Res Rev (2010) 26(6):464–73. doi:10.1002/dmrr.1062
23. Bailie RS, Si D, Connors CM, Kwedza R, O’Donoghue L, Kennedy C, et al. Variation in quality of preventive care for well adults in Indigenous community health centres in Australia. BMC Health Serv Res (2011) 11:139. doi:10.1186/1472-6963-11-139
24. Si D, Bailie R, Connors C, Dowden M, Stewart A, Robinson G, et al. Assessing health centre systems for guiding improvement in diabetes care. BMC Health Serv Res (2005) 5(1):56. doi:10.1186/1472-6963-5-56
25. Crossland L, Askew D, Ware R, Cranstoun P, Mitchell P, Bryett A, et al. Diabetic retinopathy screening and monitoring of early stage disease in australian general practice: tackling preventable blindness within a chronic care model. J Diabetes Res (2016) 2016:8405395. doi:10.1155/2016/8405395
26. Askew D, Schluter PJ, Spurling G, Maher CM, Cranstoun P, Kennedy C, et al. Diabetic retinopathy screening in general practice: a pilot study. Aust Fam Physician (2009) 38(8):650–6.
27. The Kirby Institute, UNSW Australia. Australian Trachoma Surveillance Report. Sydney, NSW (2014).
Keywords: Aboriginal and Torres Strait Islander people, primary healthcare centers, delivery of health care, eye care, diabetes, quality of health care, quality indicators
Citation: Burnett AM, Morse A, Naduvilath T, Boudville A, Taylor HR and Bailie R (2016) Delivery of Eye and Vision Services in Aboriginal and Torres Strait Islander Primary Healthcare Centers. Front. Public Health 4:276. doi: 10.3389/fpubh.2016.00276
Received: 05 August 2016; Accepted: 05 December 2016;
Published: 19 December 2016
Edited by:
Diane Cooper, University of the Western Cape, South AfricaReviewed by:
Anu Mary Oommen, Christian Medical College, IndiaGinny Marisa Sargent, Australian National University, Australia
Copyright: © 2016 Burnett, Morse, Naduvilath, Boudville, Taylor and Bailie. This is an open-access article distributed under the terms of the Creative Commons Attribution License (CC BY). The use, distribution or reproduction in other forums is permitted, provided the original author(s) or licensor are credited and that the original publication in this journal is cited, in accordance with accepted academic practice. No use, distribution or reproduction is permitted which does not comply with these terms.
*Correspondence: Anthea M. Burnett, YS5idXJuZXR0QGJyaWVuaG9sZGVudmlzaW9uLm9yZw==
 Anthea M. Burnett
 Anna Morse
 Thomas Naduvilath1,2
 Ross Bailie