 Molly M. Jacobs
 Anne V. Kirby
 Jessica M. Kramer
 Nicole M. Marlow
94% of researchers rate our articles as excellent or good
Learn more about the work of our research integrity team to safeguard the quality of each article we publish.
Find out more
ORIGINAL RESEARCH article
Front. Psychiatry, 24 February 2025
Sec. Public Mental Health
Volume 16 - 2025 | https://doi.org/10.3389/fpsyt.2025.1511966
Objectives: To investigate individual, interpersonal, health system, and community factors associated with suicidal ideation (SI) and attempts (SA).
Methods: Utilizing nationally representative data from the National Longitudinal Study of Adolescent to Adult Health (7th-12th graders in 1994-95 followed >20 years until 2016-18, N=18,375), least absolute shrinkage selector operator (LASSO) regression determined multilevel predictors of SA and SI. Models comprised full and diagnosis subgroups (ADD/ADHD, depression, PTSD, anxiety, learning disabilities [LD]).
Results: Approximately 2.48% and 8.97% reported SA and SI, respectively. Over 25% had depression, and 20.98% anxiety, 6.42% PTSD, 4.55% ADD/ADHD, and 2.50% LD. LASSO regression identified 20 and 21 factors associated with SA and SI. Individual-level factors associated with SI and SA included educational attainment, substance use, ADD/ADHD, depression, anxiety, and PTSD. Interpersonal-level factors included social support, household size, and parental education, while health system-level factors comprised health care receipt, health insurance, and counseling. The strongest associations were among individual-level factors followed by interpersonal and health system factors.
Conclusions: The distinct factors associated with SI and SA across diagnostic subgroups highlight the importance of targeted, subgroup-specific suicide prevention interventions. These findings emphasize the value of precise, data-driven approaches for suicide prevention among diverse populations and individuals with disabilities across the life-course.
Suicide is a major public health concern in the U.S., accounting for nearly 50,000 deaths in 2022 (14.3/100,000), the highest rate since 1941 (1). Suicidal thoughts and behaviors (STB), including suicidal ideation (SI) and suicide attempts (SA), affected >3M youth and >13M adults in 2022 (2). Despite significant progress, U.S. suicide rates continue to rise and disparities in STB exist (3). For example, evidence shows that individuals with disabilities such as attention deficit disorder/attention deficit hyperactivity disorder (ADD/ADHD), depression, anxiety, post-traumatic stress disorder (PTSD), and learning disabilities (LD) have higher risk (4–8). To address these issues, the 2024 National Strategy for Suicide Prevention (National Strategy) calls for coordinated and comprehensive public health approaches to suicide prevention, reflecting a multilevel perspective (3).
Successful implementation of comprehensive prevention approaches will require innovative data and research (3), such as multilevel, socioecological examinations of mutable risk factors most closely associated with STB (3, 9). Socioecological theories indicate multilevel factors that influence suicide risk, including individual (e.g., age, sex, race/ethnicity, LGBTQIA+ identity, mental illness, social isolation), interpersonal/relationship (e.g., loss of relationship(s), high conflict or violent relationships, social exclusion), community (e.g., community violence, lack of access to health care or other services), and societal/policy factors (e.g., access to lethal means of suicide, U.S. region, economic downturn, mental health funding) (3, 9).
A multilevel, socioecological framework (9) is critical for developing community resources and health policies that target social determinants of health (SDOH)—the non-medical factors that influence health outcomes including the conditions in which people are born, grow, live, work, and age—in populations disproportionately affected by STB (3), including people with disabilities, across the life-course. Socioecological frameworks synthesize the relationships and interactions between social and ecological factors by conceptualizing how multiple, interconnected levels of context influence individual behaviors and outcomes. These frameworks typically organize influences into nested layers, such as individual, interpersonal, community, organizational, and societal or policy levels. They emphasize the dynamic interplay between people and their environments, recognizing that individual choices and health outcomes are shaped by broader social determinants, such as cultural norms, socioeconomic status, and community infrastructure, as well as ecological conditions, such as climate, natural resources, and geographic factors. By integrating these layers, socioecological frameworks provide a comprehensive approach to understanding complex phenomena and designing interventions that address systemic interactions across multiple levels of influence.
SDOH, including economic instability, education, neighborhood environment, healthcare access, social support, and discrimination, significantly influence the risk of SA and SI. Economic insecurity, such as poverty and unemployment, heightens stress and limits access to resources, increasing suicide risk (10). Limited educational attainment is associated with poorer mental health outcomes due to reduced opportunities and lower health literacy (11). Unsafe living conditions and exposure to violence in deprived neighborhoods further exacerbate vulnerability (12). Disparities in access to mental health services, often driven by geographic or financial barriers, leave many individuals without adequate care (13). Social isolation and lack of support are key risk factors, as strong social connections are protective against STB (14). Additionally, discrimination and stigma faced by marginalized populations, including racial and ethnic minorities and LGBTQ+ individuals, amplify mental health disparities and suicide risks, as highlighted by minority stress theory (15). Addressing these interconnected determinants is essential for effective suicide prevention strategies.
While studies have identified several multilevel factors associated with SI and SA in various racial, geographic, and social cohorts (9), few studies have examined socioecological characteristics associated with STB in nationally representative samples. To expand our understanding of multilevel factors and inform development of resources and policies that address SDOH within suicide prevention efforts, this study used the National Longitudinal Study of Adolescent to Adult Health (Add Health) to identify distinct sets of socioecological characteristics associated with SA and SI among youth and young adults and whether differential patterns would emerge between subgroups of individuals with known high risk conditions assessed in Add Health, including ADD/ADHD, depression, anxiety, PTSD, and LD (4–8).
Data were utilized from Add Health—a nationally representative, longitudinal survey of adolescents (grades 7–12) during the 1994–1995 school year in the U.S. Add Health includes longitudinal data on respondents’ social, economic, psychological and physical well-being with contextual data, providing unique opportunities to study how health, social environments, and behaviors are linked over time. The cohort was followed into young adulthood with five in-home interviews during 1995 (Wave I, N=20,745), 1996 (Wave II, N=17,738), 2001–02 (Wave III, N=15,197), 2008–09 (Wave IV, N=15,701), and 2016–18 (Wave V, N=12,300) when respondents were 12-17, 13–18, 18–26, 24–32, and 33-43 years old, respectively. For additional information on Add Health, see http://www.cpc.unc.edu/projects/addhealth/design. Data was acquired through the Add Health Restricted-Use Data Contract #19101801. The study was reviewed and approved by the University of Florida institutional review board (#IRB202102130).
In each Wave, respondents were asked if they had seriously thought about committing suicide in the past 12 months (SI). Those who responded affirmatively were then asked how many times they attempted suicide (SA) as a follow-up question. However, due to inconsistency in the answer choices presented in each wave, we could not consistently enumerate the number of attempts between waves. Therefore, SA responses were coded as zero (no attempts) or one (at least one attempt).
Candidate variables included potential predictors of or explanatory factors related to suicide, but excluded variables that were themselves outcomes of SI or SA [such as non-suicidal self-injury (NSSI) or other self-harm behaviors that may occur after a suicide attempt], or otherwise predetermined since their inclusion would bias the focal association (16). Therefore, to capture multilevel socioecological factors (3, 9), sets of theoretically relevant individual, interpersonal, health system, and community characteristics were selected. Table 1 presents the survey wave of collection for each item indicating the applicable time frame for all factors.
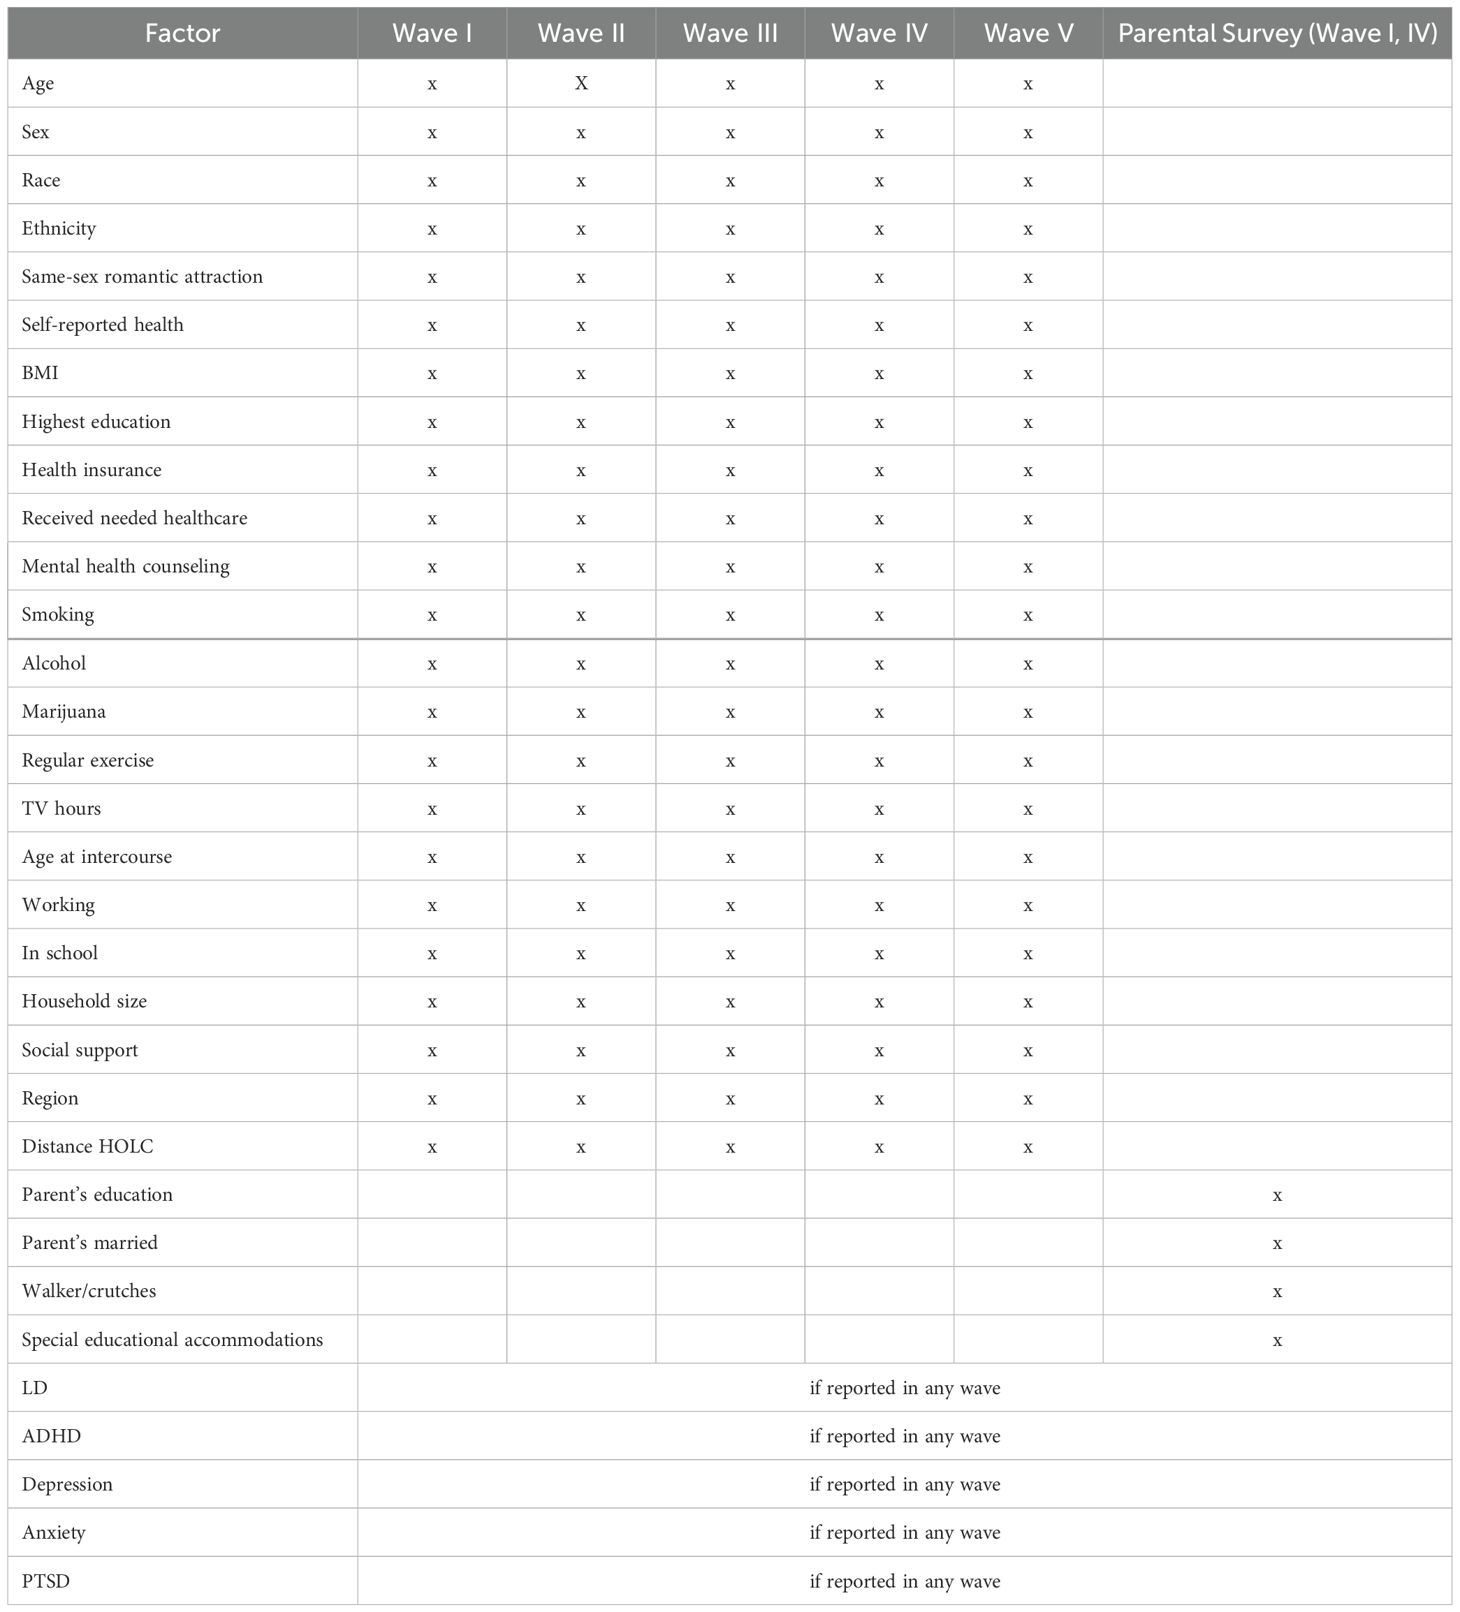
Table 1. Factors by wave.
Individual factors included demographic (age, sex, race, ethnicity, highest educational attainment, same sex romantic attraction), health/disability (self-reported health status, body mass index [BMI], using an assistive device such as a walker or crutches, and self- or parent-reported diagnosis of LD, ADD/ADHD, depression, anxiety, and PTSD), and behavioral (smoking, alcohol consumption, marijuana use, regular exercise, hours of television viewing, employment [≥10 hours/week], school-enrollment [at least part-time when surveyed], sexual activity, age of first sexual intercourse) characteristics.
Household/family characteristics included number of household residents, youth’s perceived social support, parent’s highest educational attainment, household income level, and parent’s marital status.
Service systems factors included having health insurance, having received needed health services, having received/receiving special educational accommodations in school, and having received mental health counseling within the past 12 months.
Only two societal factor indicators were available, related to locality: region of residence (Northeast, Midwest, South, West) and distance from a historically “redlined” neighborhood. “Redlining” was a systemic practice implemented by the federal government and financial institutions in the mid-20th century wherein neighborhoods were color-coded on maps by the Home Owners’ Loan Corporation (HOLC) to indicate their perceived investment risk. Areas predominantly inhabited by Black, immigrant, and low-income residents were typically outlined in red and classified as “hazardous” for investment. Since the legacy of redlining continues to influence contemporary issues, including housing segregation, educational disparities, healthcare access, and environmental injustices, these neighborhoods are more likely to experience concentrated poverty and adverse health outcomes (17, 18). Distance from these “red” neighborhoods was categorized as <4.99 miles and ≥5 miles.
Initially, we used chi-square tests with 95% confidence intervals to assess associations between study characteristics and SI and SA. We removed variables with >50% missing values from the analysis (19). Missing values of <50% were imputed using multivariate imputation by chained equations (MICE) method (20). Due to potential multicollinearity, neither multivariable regression nor conventional methods of variable selection were suitable because longitudinal observations on the same individual tend to be intercorrelated (21).
Regularization is designed to generalize models with highly complex relationships by adding a penalty to model parameters, so the model generalizes the data instead of overfitting. Least Absolute Shrinkage Selector Operator (LASSO) is a regularization technique that minimizes overfitting by applying a penalty term (λ) to the log-likelihood function, setting coefficients that contributed most to the error to zero. LASSO (22) has been used in a variety of settings with similar sets of variables for outcomes with complex underlying factors (23–25). Hence this technique is useful for analyzing large datasets with demographic, housing statistic, and economic variable indicators.
The general LASSO penalized regression assumes that error terms are independent and have equal variance across observations, which is not the case in longitudinal data. Therefore, we applied the Longitudinal Graphical LASSO (26) which first maximizes the penalized likelihood function to generate a sparse network, representing the precision matrix, then computes the maximum likelihood estimates of the precision matrix and correlation parameters for the given network structure.
Longitudinal graphical LASSO identifies and estimates time-varying relationships between variables in longitudinal data, incorporating sparsity to make complex dependency structures interpretable. It uses graphical models to represent variables as nodes and conditional dependencies as edges. The results reveal how these relationships evolve over time, highlighting dynamic interactions and changes in network structures. This method is particularly useful for understanding dynamic systems, such as evolving social or biological networks, by uncovering when and how specific factors interact over time. However, it does not establish causality and is sensitive to parameter selection, emphasizing the need for careful interpretation and validation of the results.
Figure 1 confirms that the LASSO method was appropriate compared to other techniques. We fit the LASSO regression models using the “lglasso” package (27) in R software (28), applied separately for SI and SA. We selected a random training set (70%) to train the modes and random hold-out test set (30%) to assess its performance. The training set was used to build the model, and the test set examined the performances of the models. To ensure model results were not influenced by multicollinearity, variance inflation factors (VIF) were inspected. All VIFs were below five, suggesting a low correlation with other factors.
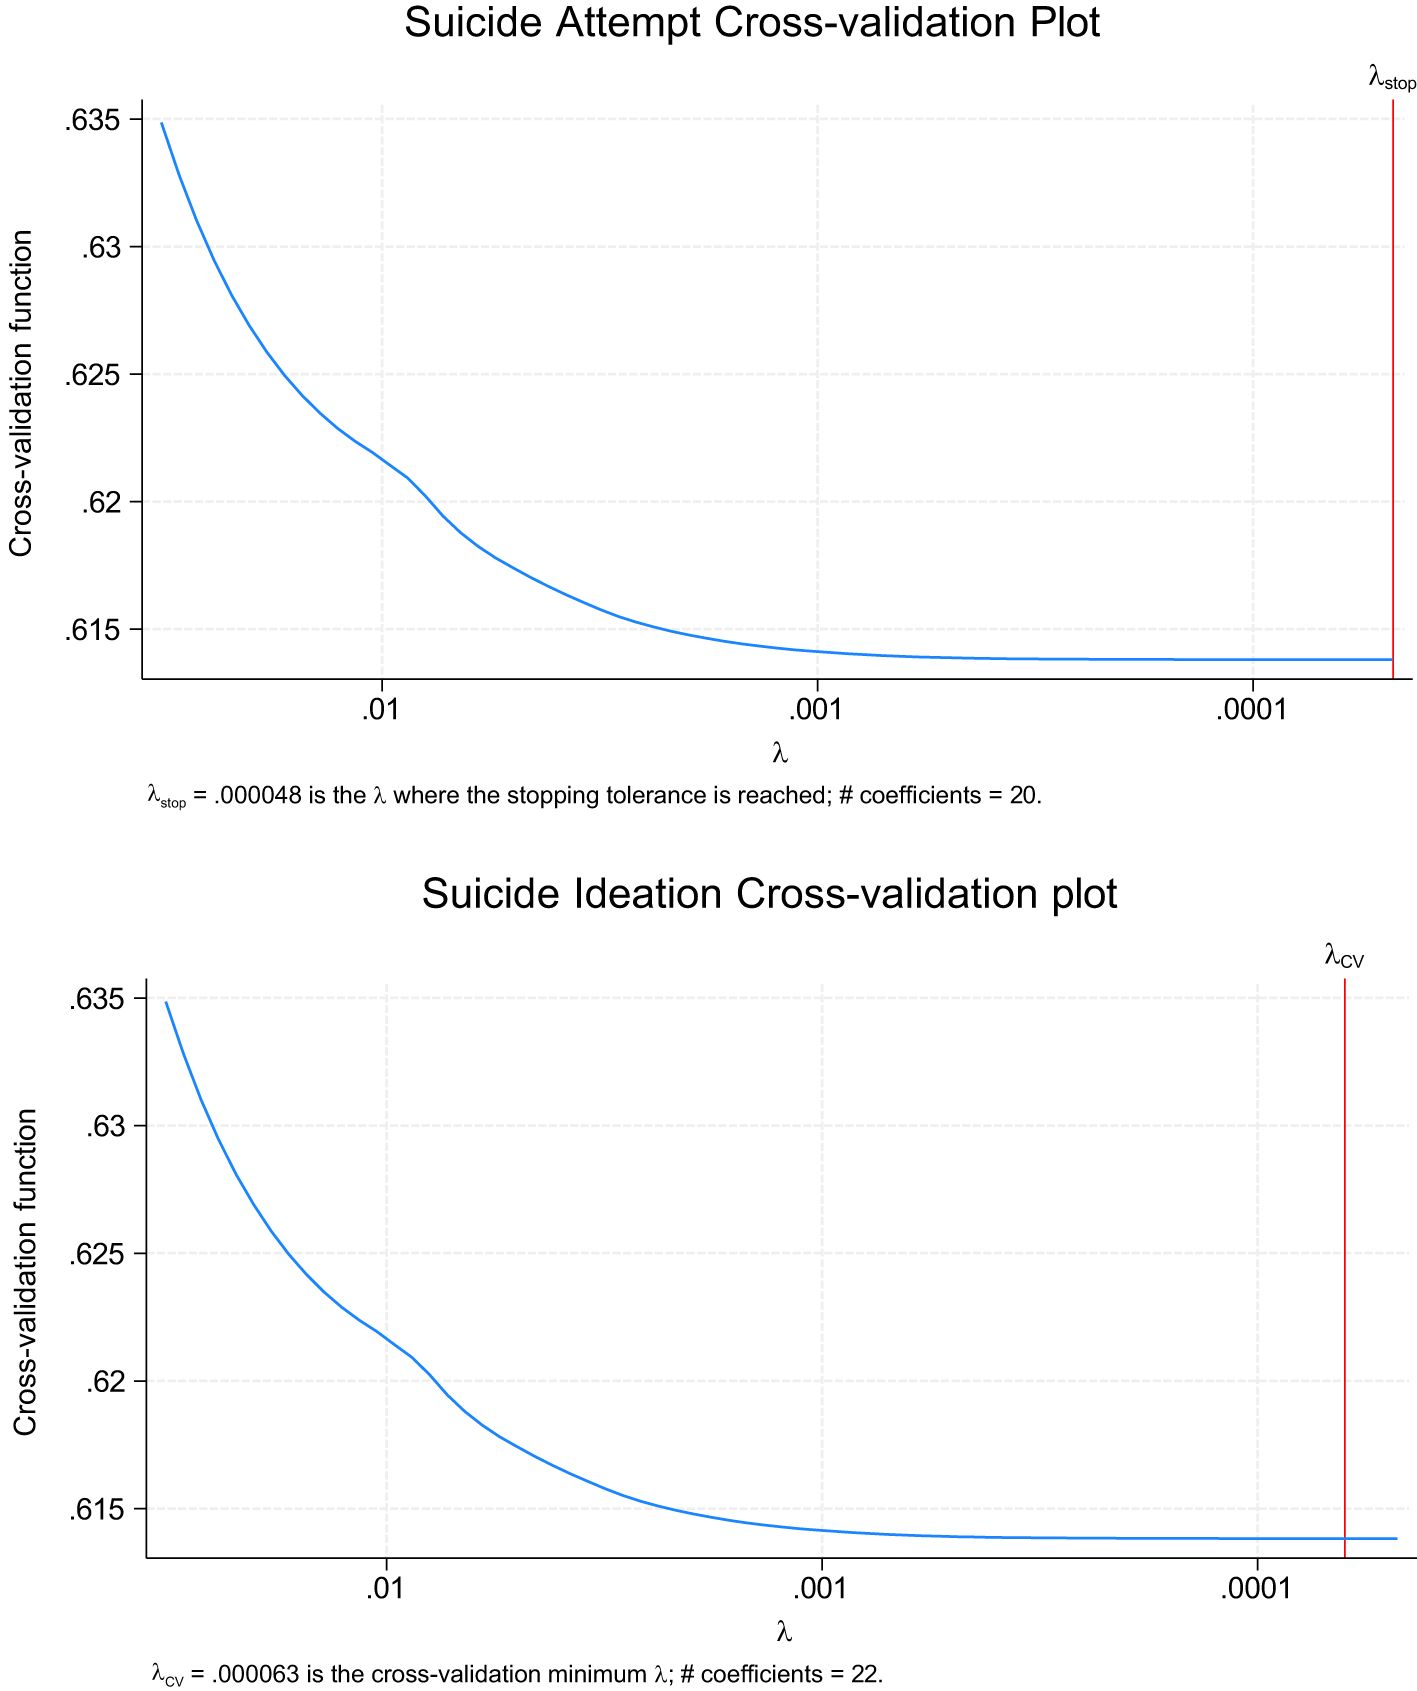
Figure 1. Suicide ideation and attempt cross-validation plots for the full sample.
We used 10 × 10-fold cross validation on the training set for our model development to avoid overfitting and to increase generalizability of the machine learning (ML) model. Ten-fold cross-validation was used to select the largest λ within one standard error of the minimum binomial deviance. Performance of the ten models were averaged to create a single performance estimate for that model, and this procedure was repeated 10 times.
To interpret results from the LASSO regression model, the magnitude of the coefficients was used to determine the strength of association between each feature and target variable. Features with larger magnitude coefficients were considered stronger or more important. We also considered the direction of the coefficient when we evaluated the association between each feature and target variable (29). A positive coefficient indicates a positive association, while a negative coefficient indicates a negative association. Features with coefficients close to zero could be considered as having little or no association. To evaluate model performance, model prediction was tested using the testing dataset. Confusion matrix, F1 score, Area Under the Curve (AUC), accuracy, precision, and recall were calculated. AUC provides a standard metric to compare the performance of different models, including those fitted using lasso regression, other types of regularization (like ridge or elastic net), or even non-linear models. By comparing AUC values, you can assess whether lasso regression effectively balances feature selection and predictive performance. The AUC evaluates whether the selected features and the fitted model provide strong predictive accuracy for the classification problem.
To further understand factors associated with STB, we conducted subgroup analyses for specific diagnosis groups. Some studies (4–7) have suggested that individuals with ADD/ADHD, depression, PTSD, and LD have a higher risk of STB than individuals without these diagnoses due to differential experiences in their homes, communities, and society. However, other studies present contradictory findings. To address these inconsistencies, LASSO regression was analyzed among each diagnosis subgroup to evaluate for observed differences.
Across Waves I through V, respectively, the data contained 806 (3.89%), 507 (3.44%), 235 (1.55%), 221 (1.41%), and 117 (1.47%) respondents with at least one SA and 2,748 (13.25%), 1,570 (10.65%), 891 (5.87%), 1,041 (6.63%), and 784 (6.52%) respondents who reported SI. There were 20,743 (Table 2) unique individuals in our sample; 49.47% were males and 50.52% were females. Over 25% had been diagnosed with depression, while 20.98%, 6.42%, 4.55%, and 10.96% reported an anxiety disorder, PTSD, ADD/ADHD, and LD, respectively. On average, respondents were 15.65 (SD=1.75), 16.24 (SD=1.64), 21.98 (SD=1.78), 28.52 (SD=1.77), and 37.56 (SD=1.89) years old in Waves I, II, III, IV, and V. Most were White (61.45%), while 23.17% and 16.99% reported being Black and Hispanic, respectively. While 4.18% had not completed high school or received a GED, 55.09% had completed at least high school or post-high school training (e.g., associate/vocational degree), and 40.72% had a 4-year college degree or higher.
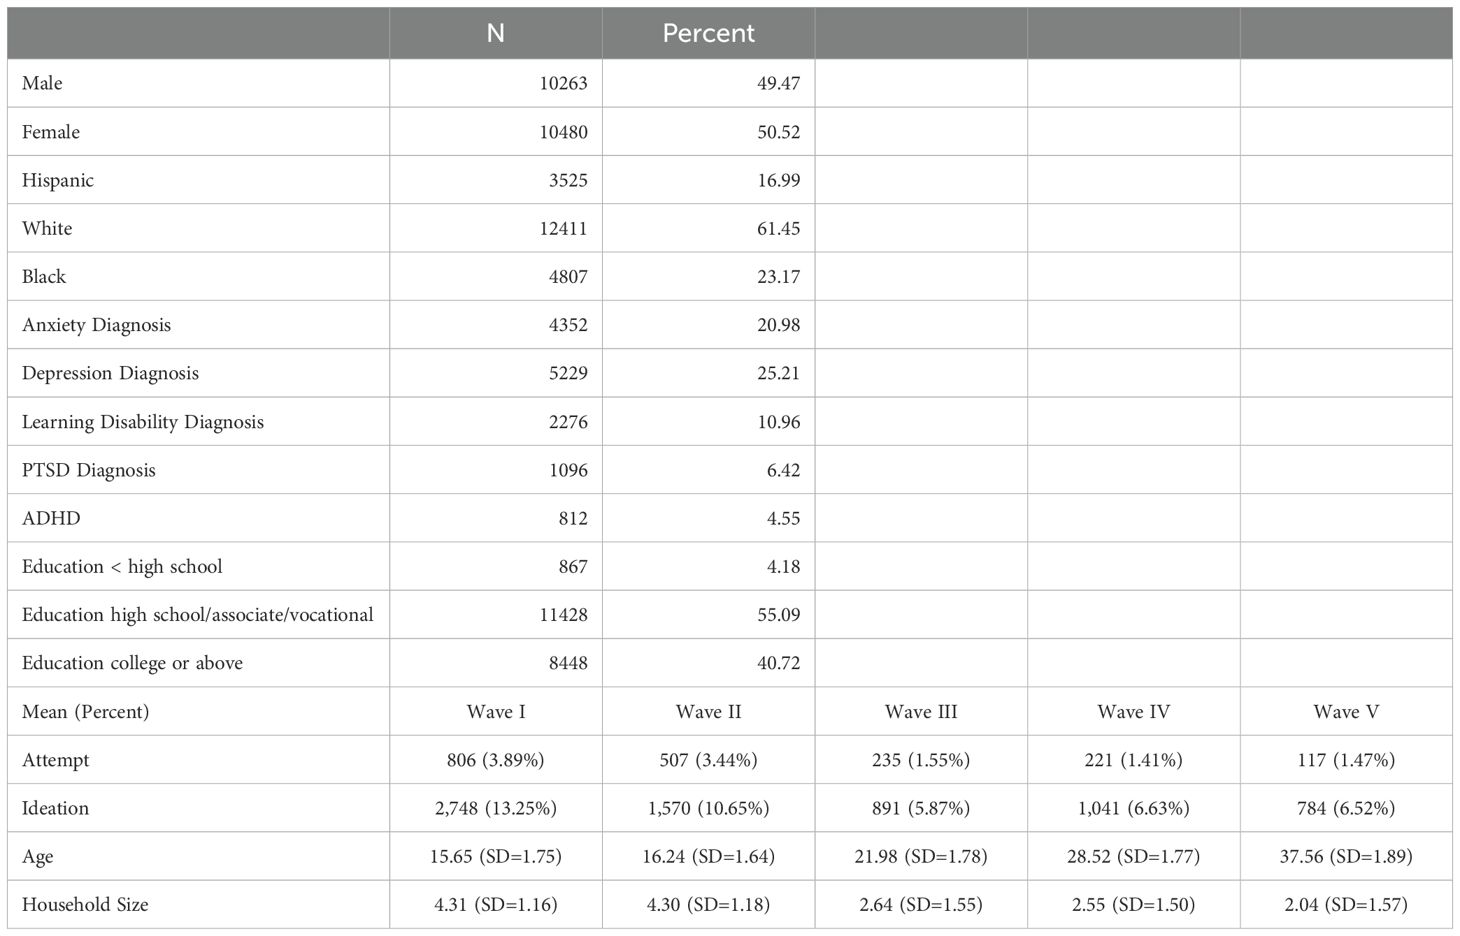
Table 2. Sample descriptive characteristics: add health respondents.
The LASSO models were applied to the full sample and five diagnostic subgroups—ADD/ADHD, PTSD, Anxiety, Depression, and LD—to identify multilevel factors significantly associated with SI and SA. All LASSO models followed a similar specification. Table 2 provides the model fit diagnostics, model accuracy, and LASSO coefficients for the full sample and subgroup SI and SA regressions. As previously indicated, the LASSO coefficients indicate the strength of associations with larger coefficients considered more important factors. Therefore, factors in Table 3 are ordered by their magnitude. Below the list of features, the total number of identified factors at each level were calculated. Figure 1 shows the cross-validation convergence for SI and SA for the full sample model. Model-specific results are discussed below.
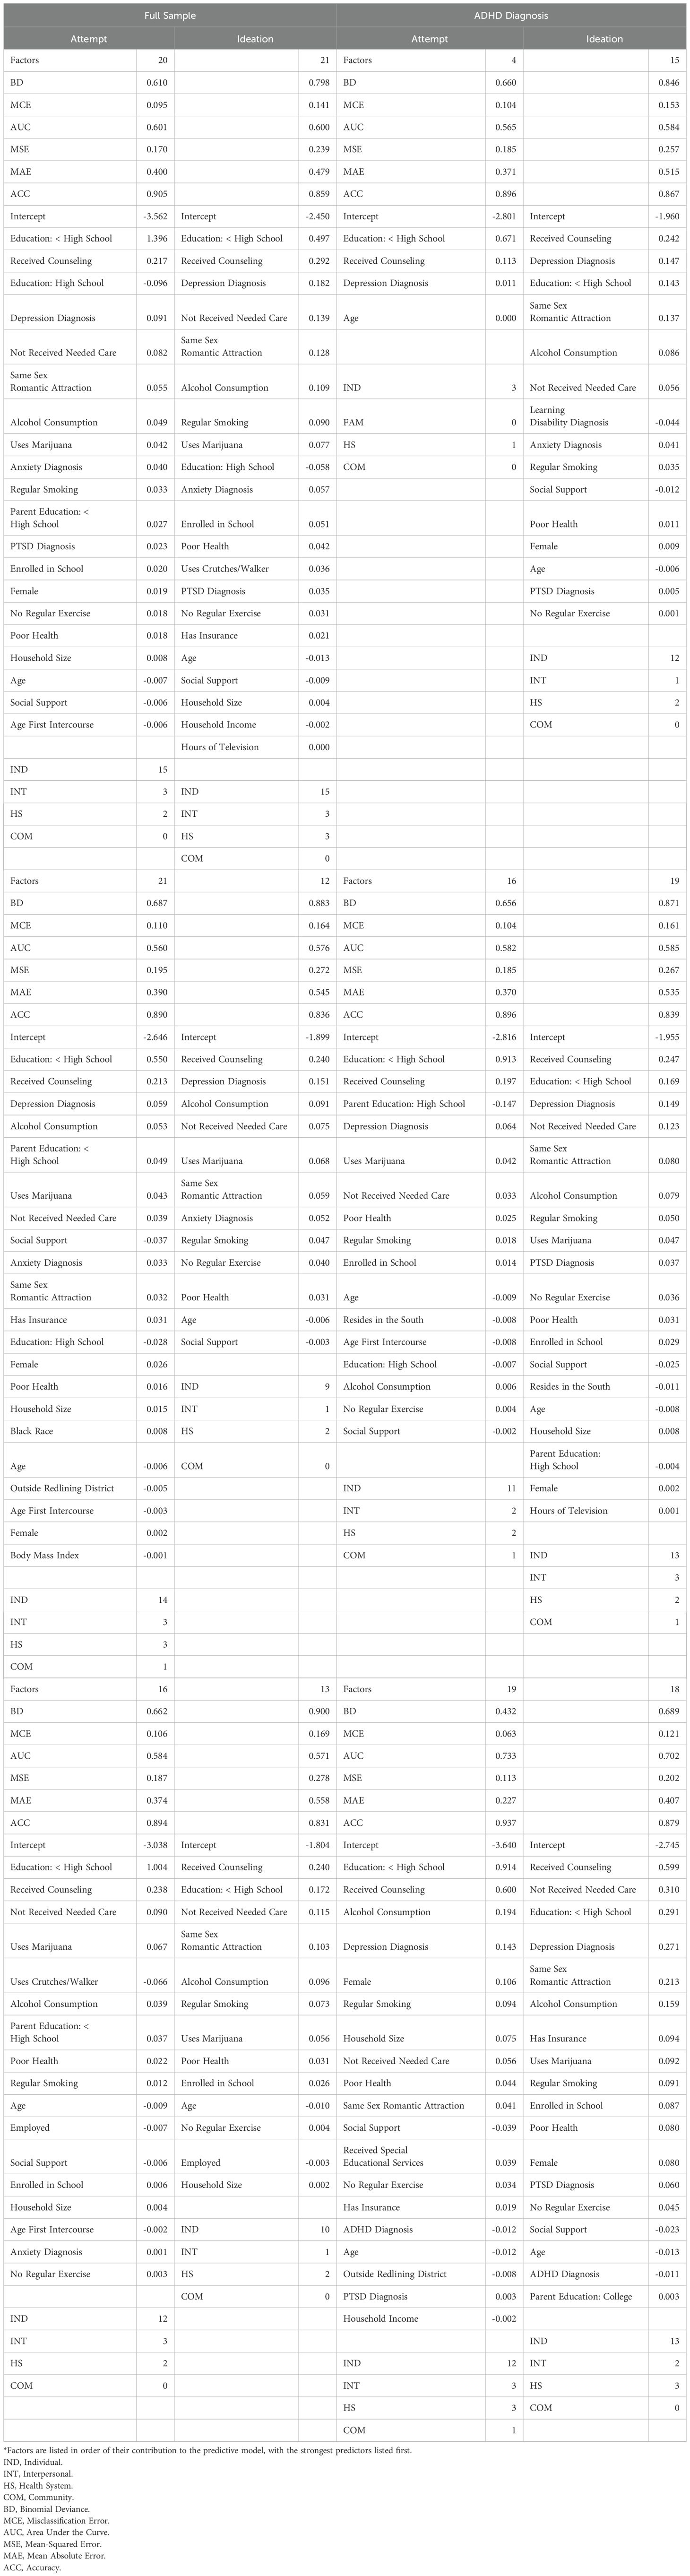
Table 3. LASSO regression results.
In the full sample, the LASSO model identified 20 factors (15 individual, 3 interpersonal, 2 health system, 0 community) significantly associated with SA and 21 factors (15 individual, 3 interpersonal, 3 health system, 0 community) for SI. The SA model achieved a Binomial Deviance of 0.610 and a Misclassification Error of 9.5%, with an AUC of 0.601. For SI, the Binomial Deviance was 0.798, the Misclassification Error was 14.1%, and the AUC was 0.600. The five most important factors were individual and health system characteristics, including primarily educational attainment, diagnoses, and health system (receipt of counseling, not receiving needed medical care features.
In the ADD/ADHD subgroups, the LASSO model identified 4 factors (3 individual, 0 interpersonal, 1 health system, 0 community) of SA and 15 factors (12 individual, 1 interpersonal, 2 health system, 0 community) of SI. The Binomial Deviance for SA was 0.660, with a Misclassification Error of 10.4% and an AUC of 0.565. For SI, the Binomial Deviance was 0.846, the Misclassification Error was 15.3%, and the AUC was 0.584. The most important factors associated with both SA and SI included depression, receipt of counseling, and educational attainment.
Among individuals with PTSD, the model identified 21 factors for SA (14 individual, 3 interpersonal, 3 health system, 1 community) and 15 factors for SI (9 individual, 1 interpersonal, 2 health system, 0 community). The performance metrics were slightly better for SA, with a Binomial Deviance of 0.570, Misclassification Error of 10.3%, and AUC of 0.614. The SI model had a Binomial Deviance of 0.787, Misclassification Error of 14.1%, and AUC of 0.589. Those most important factors included both individual and community-level characters. While both receipt of counseling and educational attainment were highly associated among other subgroups, marijuana use, and alcohol consumption had the strongest association among those with PTSD.
In the anxiety subgroup, 20 factors (11 individual, 2 interpersonal, 2 health system, 1 community) were associated with SA and 20 for SI (13 individual, 3 interpersonal, 2 health system, 1 community). The SA model’s performance showed a Binomial Deviance of 0.612, Misclassification Error of 9.4%, and AUC of 0.599. The SI model had a Binomial Deviance of 0.756, Misclassification Error of 13.8%, and AUC of 0.592. The most predictive factors included individual and community characteristics. Health-related behaviors including marijuana use, cigarette smoking, and alcohol consumption were highly associated. Moreover, not receiving necessary healthcare and/or rating one’s health as poor was highly associated with STB.
For individuals with Depression, 16 factors (12 individual, 3 interpersonal, 2 health system, 0 community) were identified for SA and 13 (10 individual, 1 interpersonal, 2 health system, 0 community) for SI. The SA model’s performance metrics included a Binomial Deviance of 0.662, Misclassification Error of 10.6%, and AUC of 0.589. For SI, the Binomial Deviance was 0.900, Misclassification Error was 16.9%, and AUC was 0.577. Smoking, alcohol consumption, marijuana use, and educational attainment were, again, the strongest individual level factors associated with both SI and SA, while receipt of counseling and medical care were the strong health system factors.
For individuals with LD, 19 factors were identified for SA (12 individual, 3 interpersonal, 3 health system, 1 community) and 18 for SI (13 individual, 2 interpersonal, 3 health system, 0 community). The SA model yielded a Binomial Deviance of 0.432, Misclassification Error of 6.3%, and AUC of 0.689, indicating better performance compared to other subgroups. The SI model had a Binomial Deviance of 0.689, Misclassification Error of 12.1%, and AUC of 0.655. Depression, smoking, and receipt of health care/counseling were the most important factors for both SA and SI, but female sex and household size were much predictive of SA than SI among those with LD.
The LASSO regression models demonstrated varying performance across subgroups, with the LD subgroup showing the highest accuracy with SA. While the models demonstrated only modest predictive accuracy, with an AUC of less than.60 across most subgroups, they performed notably better within the LD subgroup. This suggests that while these models can provide some insight into population-level risk and associated factors potentially requiring intervention, their ability to identify specific individuals at elevated risk is limited, aligning with previous research (30, 31). However, models with modest AUC values can still offer value by identifying broader populations at elevated risk. These models may inform the design of public health programs or policy initiatives by highlighting areas or demographic groups where intervention may be needed. While caution is warranted when using such models at the individual level, they should be used in conjunction with other tools and assessments to ensure more reliable decision-making. The improved performance in the LD subgroup suggests that predictive models may benefit from a more tailored approach when applied to distinct populations. This finding underscores the importance of refining tools and interventions to meet the unique needs of specific subgroups, an approach that can ultimately increase both accuracy and impact.
These results highlight the complex interplay of factors influencing suicide risk and the need for interventions tailored to specific at-risk populations. Across the full sample and subgroups, significant factors for SA and SI included both individual-level (e.g., prior mental health diagnoses, substance use) and interpersonal factors (e.g., family relationships, exposure to violence). Generally, demographic characteristics such as age, sex, and race/ethnicity were not highly associated with STB in any of the models, while substance-related behavior and mental health diagnosis remained persistently impactful. Same sex curiosity and social support were non-negligible contributors to STB among most groups. Health system and community-level factors were less consistently identified across subgroups. The variation in selected factors across subgroups underscores the importance of considering the heterogeneity within populations when assessing risk factors for SI and SA.
The 2024 National Strategy emphasizes the need for upstream and comprehensive suicide prevention efforts. To pursue new prevention strategies, research is needed to understand factors associated with STB inclusive of multiple socioecological levels that target SDOH. The Add Health data offered a unique opportunity to examine associations with STB among adolescents followed through mid-life considering multiple individual, interpersonal, health system, and community-level factors. The identified individual-level associations for mental health diagnoses are consistent with prior literature, indicating that individuals who report experiencing SI and/or SA also report high rates of mental health diagnoses including depression and anxiety (3, 9). Notably, those with ADHD or LD and depression were at greater risk for SI/SA, suggesting greater vulnerability for those who are neurodiverse and who may need more support for executive functions such as cognitive flexibility and inhibitory control that could contribute to increased risk for STB. The individual, behavioral factors associated with increased risk, such as excessive television viewing, alcohol intake, smoking, and substance use may be related to experiential avoidance (32). Engaging in these types of avoidance behaviors may distract from experiencing uncomfortable emotions, while also potentially hindering development of self-regulation skills and healthy coping strategies (e.g., regular exercise (33), which was protective in the current study) (34). As elaborated below, individuals experiencing STB frequently reported not receiving needed care; thus, these behaviors may serve as a substitute.
Consistent with prior literature (35, 36), social support was a significant interpersonal-level protective SDOH. A 2022 meta-analysis of social support interventions (37) found pooled evidence that face-to-face social support interventions reduced suicide death, but not reduction in SA. Therefore, despite consistent evidence for the importance of social support, development of effective interventions may still be warranted that address STB type. Increased household size and/or decreased household income were associated SDOH in some models, which may reflect that parents with more children and less financial resources have fewer opportunities to support each individual family member.
Regarding health system related SDOH factors, we consistently found that individuals who received counseling were significantly more likely to report STB, across all models. This likely reflects that individuals who are at-risk for suicidality and/or who are experiencing STB were able to receive at least some type of counseling. However, we cannot determine the type, quality, or duration of counseling nor if it helped to reduce or alleviate their SI or risk for future SA. Notably, “not receiving needed care” was significantly associated across most of the tested models, indicating that additional health services were indicated and unavailable. Interestingly, having insurance—when significant—was not protective, and was in fact associated with increased risk of STB in some models. Merely having insurance may not meet individuals’ needs, either by not covering the specific services they need or because access to the health services needed is not guaranteed even with coverage.
Existing evidence demonstrates that community-level SDOH factors such as geographical socio-economic deprivation are associated with STB (38–41). Living within a redlining district was significantly associated with SA among the PTSD and LD subgroups, suggesting historical geographical discrimination may have a more notable impact on suicide risk for individuals facing other challenges such as LD and history of trauma.
Additional SDOH factors identified as significant at the individual-level may, in fact, be influenced by socioecological factors including policy, cultural beliefs, and access to other service systems (beyond healthcare) that provide support. For example, lower levels of education, lower household income, and sexual minority status were associated with STB in many of the models. A fifteen-year study in the U.S. identified significantly higher rates of suicide death for individuals without a college degree (42), pointing to socioeconomic disparities in suicide risk and echoed in our findings. Further, evidence demonstrates that anti-LGBT legislation negatively impacts mental health and elevates suicide risk among LGBT individuals (43). Additional research could investigate causal links to determine mechanisms through which these individual-level factors may be affected by societal-level influences.
A similar set of factors were identified as significant for SA (15 individual, 3 interpersonal, 2 health system) as well as SI (15 individual, 3 interpersonal, 3 health system). However, there have been emerging findings indicating that distinct sets of risk factors (e.g., individual, psychiatric, psychological) are associated with SI compared to SA (44). Given the differences in clinical severity and prevalence between SI and SA, it is also notable that the LASSO coefficients showed substantial differences in factors considered more important for each outcome, which may indicate distinct priority targets for prevention of SA versus SI.
Although this study provides valuable information on factors associated with STB, the following limitations must be considered. First, only between two and four percent reported SA and seven to 13% reported SI. Small sample sizes have been a consistent concern among ML studies and consequently their generalization (45). Second, all information is self-reported and cannot be validated or verified. Prior research concerning variation in self-reported STB in Add Health showed some variation by race and ethnicity (46). Additionally, studies show that certain health-related behaviors and conditions can suffer from underreporting, delayed reporting, and incomplete reporting (47). Further, survey data can also suffer from recency bias, response bias, recall bias, and favorability bias. Third, not all potential factors associated with STB were available in Add Health. For example, the survey did not contain information on firearm ownership, parental STB, levels of perceived community safety, or mental health policies. Fourth, Add Health employed a complex design and sampling framework that could not be incorporated into the LASSO regression. Fifth, Add Health allowed for examination of multi-level factors associated with STB from adolescence through mid-adulthood, rather than only one time point. Sixth, while LASSO performs both variable selection and regularization to enhance the prediction accuracy and interpretability of the model produced, it has several limitations including variable selection instability, difficulty handling multicollinearity, and limited variable selection in high dimensional data. Seventh, this study presents only a crude measure of SI and does not account for the frequency or severity of suicidal thoughts compared to brief validated psychometric tools. The 12-month timeframe for capturing SI and SA misaligns with the shorter timeframes typically used in formal diagnostic criteria, such as the 2 to 4-week windows for conditions like depression. Longer timeframes increase the risk of recall bias, as individuals may inaccurately remember events from further back in time. Additionally, a 12-month period may obscure temporal trends and fail to capture acute periods of crisis or current suicide risk, which are critical for timely intervention. This inconsistency can also complicate comparisons with studies or assessments using shorter, standardized timeframes, potentially limiting the precision and applicability of findings. Finally, the number of respondents varied in each wave which may have contributed to demographic variation and observation of STB. Additionally, the identified predictors should not be interpreted as causal factors. Further research is needed to establish causal pathways and underlying mechanisms.
Using a large, nationally representative panel survey, this study applied LASSO regression to identify factors associated with SI and SA among youth and young adults. Results showed that behaviors including alcohol consumption, marijuana use, smoking, no regular exercise, and hours of television viewing were significantly associated with SI and SA for both the full sample as well as most diagnosis subgroups. Increased social support, household size, household income, and parental marital status were significantly related to a lower likelihood of SI and SA. Diagnosis subgroups showed distinct patterns of individual, interpersonal, health system, and community factor associations. These findings can be utilized to identify individuals and subgroups with high-risk of STB and assist public health officials in designing interventions to reduce STB among young adults, particularly those with high-risk diagnoses. Additional research focusing on diagnostic subgroups is needed to identify how co-occurring ADHD, PTSD, depression, anxiety, and LD interact with factors at multiple levels to impact STB.
The data analyzed in this study is subject to the following licenses/restrictions: Data was acquired through the Add Health Restricted-Use Data Contract #19101801. Requests to access these datasets should be directed to http://www.cpc.unc.edu/projects/addhealth/design.
The studies involving humans were approved by University of Florida Institutional Review Board. The studies were conducted in accordance with the local legislation and institutional requirements. Add Health participants provided written informed consent for participation in all aspects of Add Health in accordance with the University of North Carolina School of Public Health Institutional Review Board guidelines that are based on the Code of Federal Regulations on the Protection of Human Subjects 45CFR46: https://www.hhs.gov/ohrp/humansubjects/guidance/45cfr46.html.
MJ: Conceptualization, Data curation, Formal analysis, Funding acquisition, Investigation, Methodology, Resources, Software, Validation, Writing – original draft. AK: Conceptualization, Funding acquisition, Investigation, Writing – original draft. JK: Conceptualization, Funding acquisition, Investigation, Writing – review & editing. NM: Conceptualization, Funding acquisition, Investigation, Writing – original draft.
The author(s) declare financial support was received for the research, authorship, and/or publication of this article. This project was supported by the National Institute of Mental Health of Health under Award Numbers K23MH123934 and R01MH137007.
We thank the Academic Autism Spectrum Partnership in Research and Education’s Suicide Prevention Project (AASPIRE SPP) team members (Bobbi Duncan-Ishcomer, Andee Joyce, Rachel Kripke-Ludwig, Whitney Lee, Kayla Rodriguez, Zack Siddeek, and Francesco Vales) for meeting to discuss preliminary interpretations of study findings.
The authors declare that the research was conducted in the absence of any commercial or financial relationships that could be construed as a potential conflict of interest.
The author(s) declare that no Generative AI was used in the creation of this manuscript.
All claims expressed in this article are solely those of the authors and do not necessarily represent those of their affiliated organizations, or those of the publisher, the editors and the reviewers. Any product that may be evaluated in this article, or claim that may be made by its manufacturer, is not guaranteed or endorsed by the publisher.
The content is solely the responsibility of the authors and does not necessarily represent the official views of the National Institutes of Health.
1. Curtin SC, Garnett MF, Ahmad FB. Provisional estimates of suicide by demographic characteristics: United States, 2022. Vital Stat Rapid Release. (2023) 24. doi: 10.15620/cdc:133702
2. Substance Abuse and Mental Health Services Administration. Key substance use and mental health indicators in the United States: Results from the 2022 National Survey on Drug Use and Health. Washington, D.C., U.S.A.: Center for Behavioral Health Statistics, Substance Abuse and Mental Health Services Administration (2023).
3. U.S. Department of Health and Human Services. National Strategy for Suicide Prevention. Washington, D.C., U.S.A. (2024).
4. Beauchaine TP, Ben-David I, Bos M. ADHD, financial distress, and suicide in adulthood: A population study. Sci Adv. (2020) 6:eaba1551. doi: 10.1126/sciadv.aba1551
5. Hawton K, Casanas ICC, Haw C, Saunders K. Risk factors for suicide in individuals with depression: a systematic review. J Affect Disord. (2013) 147:17–28. doi: 10.1016/j.jad.2013.01.004
6. Wachter CA, Bouck EC. Suicide and students with high-incidence disabilities: What special educators need to know. Teach Exceptional Children. (2008) 41:66–72. doi: 10.1177/004005990804100108
7. Nagraj D, Omar HA. Disability and suicide: A review. Int J Child Health Hum Dev. (2017) 10:345–54.
8. Chesney E, Goodwin GM, Fazel S. Risks of all-cause and suicide mortality in mental disorders: a meta-review. World Psychiatry. (2014) 13:153–60. doi: 10.1002/wps.20128
9. Cramer RJ, Kapusta ND. A social-ecological framework of theory, assessment, and prevention of suicide. Front Psychol. (2017) 8:1756. doi: 10.3389/fpsyg.2017.01756
10. Stack S. Contributing factors to suicide: Political, social, cultural and economic. Prev Med. (2021) 152:106498. doi: 10.1016/j.ypmed.2021.106498
11. Berkman ND, Sheridan SL, Donahue KE, Halpern DJ, Crotty K. Low health literacy and health outcomes: an updated systematic review. Ann Intern Med. (2011) 155:97–107. doi: 10.7326/0003-4819-155-2-201107190-00005
12. Mechanic D, Tanner J. Vulnerable people, groups, and populations: societal view. Health Aff (Millwood). (2007) 26:1220–30. doi: 10.1377/hlthaff.26.5.1220
13. Douthit N, Kiv S, Dwolatzky T, Biswas S. Exposing some important barriers to health care access in the rural USA. Public Health. (2015) 129:611–20. doi: 10.1016/j.puhe.2015.04.001
14. Motillon-Toudic C, Walter M, Seguin M, Carrier JD, Berrouiguet S, Lemey C. Social isolation and suicide risk: Literature review and perspectives. Eur Psychiatry. (2022) 65:e65. doi: 10.1192/j.eurpsy.2022.2320
15. Tebbe EA, Moradi B. Suicide risk in trans populations: An application of minority stress theory. J Couns Psychol. (2016) 63:520–33. doi: 10.1037/cou0000152
16. Elwert F. Graphical Causal Models. In: Morgan S, editor. Handbook of Causal Analysis for Social Research. Springer, Dordrecht (2013).
17. Lynch EE, Malcoe LH, Laurent SE, Richardson J, Mitchell BC, Meier HCS. The legacy of structural racism: Associations between historic redlining, current mortgage lending, and health. SSM Popul Health. (2021) 14:100793. doi: 10.1016/j.ssmph.2021.100793
18. Swope CB, Hernandez D, Cushing LJ. The relationship of historical redlining with present-day neighborhood environmental and health outcomes: A scoping review and conceptual model. J Urban Health. (2022) 99:959–83. doi: 10.1007/s11524-022-00665-z
19. Lee JH, Huber JC Jr. Evaluation of multiple imputation with large proportions of missing data: how much is too much? Iran J Public Health. (2021) 50:1372–80. doi: 10.18502/ijph.v50i7.6626
20. van Buuren S, Groothuis-Oudshoorn K. mice: multivariate imputation by chained equations in R. J Stat Software. (2011) 45:1–67. doi: 10.18637/jss.v045.i03
21. Irvin JA, Kondrich AA, Ko M, Rajpurkar P, Haghgoo B, Landon BE, et al. Incorporating machine learning and social determinants of health indicators into prospective risk adjustment for health plan payments. BMC Public Health. (2020) 20:608. doi: 10.1186/s12889-020-08735-0
22. Tibshirani R. Regression shrinkage and selection via the lasso. J R Stat Society: Ser B (Methodological). (1996) 58:267–88. doi: 10.1111/j.2517-6161.1996.tb02080.x
23. Park SK, Mukherjee B, Xia X, Sparrow D, Weisskopf MG, Nie H, et al. Bone lead level prediction models and their application to examine the relationship of lead exposure and hypertension in the Third National Health and Nutrition Examination Survey. J Occup Environ Med. (2009) 51:1422–36. doi: 10.1097/JOM.0b013e3181bf6c8d
24. Ortega Hinojosa AM, Davies MM, Jarjour S, Burnett RT, Mann JK, Hughes E, et al. Developing small-area predictions for smoking and obesity prevalence in the United States for use in Environmental Public Health Tracking. Environ Res. (2014) 134:435–52. doi: 10.1016/j.envres.2014.07.029
25. Simeonov KP, Himmelstein DS. Lung cancer incidence decreases with elevation: evidence for oxygen as an inhaled carcinogen. PeerJ. (2015) 3:e705. doi: 10.7717/peerj.705
26. Zhou J, Gui J, Viles WD, Chen H, Madan JC, Coker MO, et al. Identifying Microbial Interaction Networks Based on Irregularly Spaced Longitudinal 16S rRNA sequence data. bioRxiv. (2021) 2021.11.26.470159. doi: 10.1101/2021.11.26.470159
27. Zhou J, Gui J, Viles W, Hoen A. Iglasso: longitudinal graphical lasso. (2022). doi: 10.32614/CRAN.packages
28. R Core Team. R: A language and environment for statistical computing. Vienna, Austria: R Foundation for Statistical Computing (2024).
29. Wiemken TL, Kelley RR. Machine learning in epidemiology and health outcomes research. Annu Rev Public Health. (2020) 41:21–36. doi: 10.1146/annurev-publhealth-040119-094437
30. Berman AL, Silverman MM. Near term suicide risk assessment: A commentary on the clinical relevance of protective factors. Arch Suicide Res. (2020) 24:S370–S80. doi: 10.1080/13811118.2019.1612804
31. Franklin JC, Ribeiro JD, Fox KR, Bentley KH, Kleiman EM, Huang X, et al. Risk factors for suicidal thoughts and behaviors: A meta-analysis of 50 years of research. Psychol Bull. (2017) 143:187–232. doi: 10.1037/bul0000084
32. Angelakis I, Gooding P. Experiential avoidance in non-suicidal self-injury and suicide experiences: A systematic review and meta-analysis. Suicide Life Threat Behav. (2021) 51:978–92. doi: 10.1111/sltb.12784
33. Vancampfort D, Hallgren M, Firth J, Rosenbaum S, Schuch FB, Mugisha J, et al. Physical activity and suicidal ideation: A systematic review and meta-analysis. J Affect Disord. (2018) 225:438–48. doi: 10.1016/j.jad.2017.08.070
34. Rizk MM, Herzog S, Dugad S, Stanley B. Suicide risk and addiction: the impact of alcohol and opioid use disorders. Curr Addict Rep. (2021) 8:194–207. doi: 10.1007/s40429-021-00361-z
35. Scardera S, Perret LC, Ouellet-Morin I, Gariepy G, Juster RP, Boivin M, et al. Association of social support during adolescence with depression, anxiety, and suicidal ideation in young adults. JAMA Netw Open. (2020) 3:e2027491. doi: 10.1001/jamanetworkopen.2020.27491
36. Winfree LT, Jiang SH. Youthful suicide and social support: exploring the social dynamics of suicide-related behavior and attitudes within a national sample of US adolescents. Youth Violence Juv J. (2010) 8:19–37. doi: 10.1177/1541204009338252
37. Hou X, Wang J, Guo J, Zhang X, Liu J, Qi L, et al. Methods and efficacy of social support interventions in preventing suicide: a systematic review and meta-analysis. Evid Based Ment Health. (2022) 25:29–35. doi: 10.1136/ebmental-2021-300318
38. Steelesmith DL, Fontanella CA, Campo JV, Bridge JA, Warren KL, Root ED. Contextual factors associated with county-level suicide rates in the United States, 1999 to 2016. JAMA Netw Open. (2019) 2:e1910936. doi: 10.1001/jamanetworkopen.2019.10936
39. Wang J, Brown MM, Ivey-Stephenson AZ, Xu L, Stone DM. Rural-urban comparisons in the rates of self-harm, U.S., 2018. Am J Prev Med. (2022) 63:117–20. doi: 10.1016/j.amepre.2021.12.018
40. Wang G, Wu L. Social determinants on suicidal thoughts among young adults. Int J Environ Res Public Health. (2021) 18:8788. doi: 10.3390/ijerph18168788
41. Xi W, Banerjee S, Olfson M, Alexopoulos GS, Xiao Y, Pathak J. Effects of social deprivation on risk factors for suicidal ideation and suicide attempts in commercially insured US youth and adults. Sci Rep. (2023) 13:4151. doi: 10.1038/s41598-023-31387-0
42. Phillips JA, Hempstead K. Differences in U. S Suicide Rates by Educ Attainment 2000-2014 Am J Prev Med. (2017) 53:e123–e30. doi: 10.1016/j.amepre.2017.04.010
43. The Tevor Project. 2023 U.S. national survey on the mental health of LGBTQ young people. West Hollywood, CA, U.S.A: The Trevor Project (2023). Available at: https://www.thetrevorproject.org/survey-2023/assets/static/05_TREVOR05_2023survey.pdf
44. May AM, Klonsky ED. What distinguishes suicide attempters from suicide ideators? A meta-analysis of potential factors. Clin Psychology: Sci Practice. (2016) 23:5–20. doi: 10.1111/cpsp.12136
45. Zhi S, Hu X, Ding Y, Chen H, Li X, Tao Y, et al. An exploration on the machine-learning-based stroke prediction model. Front Neurol. (2024) 15:1372431. doi: 10.3389/fneur.2024.1372431
46. Erausquin JT, McCoy TP, Bartlett R, Park E. Trajectories of suicide ideation and attempts from early adolescence to mid-adulthood: associations with race/ethnicity. J Youth Adolesc. (2019) 48:1796–805. doi: 10.1007/s10964-019-01074-3
Keywords: suicide attempt, suicidal ideation, adolescents and young adults, socioecological framework, machine learning, longitudinal data
Citation: Jacobs MM, Kirby AV, Kramer JM and Marlow NM (2025) A machine learning analysis of suicidal ideation and suicide attempt among U.S. youth and young adults from multilevel, longitudinal survey data. Front. Psychiatry 16:1511966. doi: 10.3389/fpsyt.2025.1511966
Received: 15 October 2024; Accepted: 28 January 2025;
Published: 24 February 2025.
Edited by:
Alexander Michael Ponizovsky, Ministry of Health, IsraelReviewed by:
Ki Eun Shin, Long Island University Post, United StatesCopyright © 2025 Jacobs, Kirby, Kramer and Marlow. This is an open-access article distributed under the terms of the Creative Commons Attribution License (CC BY). The use, distribution or reproduction in other forums is permitted, provided the original author(s) and the copyright owner(s) are credited and that the original publication in this journal is cited, in accordance with accepted academic practice. No use, distribution or reproduction is permitted which does not comply with these terms.
*Correspondence: Nicole M. Marlow, bWFybG93bm1AdWZsLmVkdQ==
Disclaimer: All claims expressed in this article are solely those of the authors and do not necessarily represent those of their affiliated organizations, or those of the publisher, the editors and the reviewers. Any product that may be evaluated in this article or claim that may be made by its manufacturer is not guaranteed or endorsed by the publisher.
Research integrity at Frontiers
Learn more about the work of our research integrity team to safeguard the quality of each article we publish.