 Saeedeh Komijani
 Dipak Ghosal
 Manpreet K. Singh2
 Julie B. Schweitzer
- 1Department of Computer Science, University of California, Davis, Davis, CA, United States
- 2Department of Psychiatry and Behavioral Sciences, University of California, Davis, Davis, CA, United States
- 3MIND Institute, University of California, Davis, Davis, CA, United States
Background: Attention Deficit Hyperactivity Disorder (ADHD) is a common neurodevelopmental disorder in children and adolescents characterized by persistent patterns of hyperactivity, impulsivity, and inattentiveness. ADHD persists for many into adulthood. While irritability is not a diagnostic symptom of ADHD, temper outbursts and irritable moods are common in individuals with ADHD. However, research on the association between irritability and ADHD symptoms in adolescents and young adults remains limited.
Method: Prior research has used linear regression models to examine longitudinal relations between ADHD and irritability symptoms. This method may be impacted by the potential presence of highly colinear variables. We utilized a hierarchical clustering technique to mitigate these collinearity issues and implemented a non-parametric machine learning (ML) model to predict the significance of symptom relations over time. Our data included adolescents (N=148, 54% ADHD) and young adults (N=124, 42% ADHD) diagnosed with ADHD and neurotypical (NT) individuals, evaluated in a longitudinal study.
Results: Results from the linear regression analysis indicate a significant association between irritability at time-point 1 (T1) and hyperactive-impulsive symptoms at time-point 2 (T2) in adolescent females (β=0.26, p-value < 0.001), and inattentiveness at T1 with irritability at T2 in young adult females (β=0.49, p-value < 0.05). Using a non-parametric-based approach, employing the Random Forest (RF) method, we found that among both adolescents and young adults, irritability in adolescent females significantly contributes to predicting impulsive symptoms in subsequent years, achieving a performance rate of 86%.
Conclusion: Our results corroborate and extend prior findings, allowing for an in-depth examination of longitudinal relations between irritability and ADHD symptoms, namely hyperactivity, impulsivity, and inattentiveness, and the unique association between irritability and ADHD symptoms in females.
1 Introduction
Attention Deficit Hyperactivity Disorder (ADHD) is a common neurodevelopmental disorder, with hyperactivity, impulsivity, and inattentiveness as key diagnostic symptoms (1–3). ADHD presentation type may vary across individuals and evolve over time (1–4).
ADHD is highly prevalent with worldwide rates of approximately 7.2% in children and 3.4% in adults. The National Survey of Children’s Health (NSCH) in the United States reports 9.8% of children and 4.4% of adults reporting a lifetime diagnosis of ADHD between 2016 and 2019. Thus, the current prevalence of ADHD in adults is estimated to be 4.4%. Among these, ADHD is more common in boys than in girls (5, 6) though the gap narrows in adulthood with women almost as likely as men to meet the diagnostic threshold (7).
1.1 Irritability and ADHD symptoms
Irritability is defined as an extreme negative emotional reaction to stimuli. Irritability is associated with deficits in emotional regulation and can be expressed with anger, aggression, and violence (8). Both genetic and environmental factors contribute to the etiology of irritability and its persistence or improvement over the life course (9–11). Irritability is associated with adverse social and occupational outcomes (12–14) and can predict risky behaviors such as substance use disorder, criminality, and suicidality (15–18).
Early childhood irritability predicts later functional impairments, depression and anxiety, and oppositional defiant disorder (ODD) (19, 20). Higher childhood irritability scores positively predict internalizing and externalizing problems, in later childhood and adolescence (14, 21, 22). In adolescents, irritability is associated with higher anxiety and depression, internalizing and externalizing disorders, and is later comorbid with borderline personality disorder in adulthood (23, 24).
Irritability is not a diagnostic symptom of ADHD by itself, but phasic (temper outbursts) and tonic (irritable moods) behaviors are common in individuals with ADHD (25–27). Irritability often manifests as a symptom of emotional dysregulation (ED), a condition commonly observed in both children and adults with ADHD (28–30). Mukherjee et al. (31) studied the relation between the degree of irritability and resting state functional connectivity within two groups of neurotypical (NT) and ADHD and found atypical connectivity in reward processing, cognitive control, and emotional processing regions within the ADHD group.
Despite the importance of identifying the link underlying processes between irritability and ADHD dimensions, few studies have evaluated irritability as a predictor of ADHD symptoms from childhood to adolescence (32, 33). Earlier work by our group (34) demonstrated that irritability predicted higher hyperactive/impulsive ADHD symptoms a year later in adolescents. Notably, this correlation was predominantly driven by adolescent females rather than males.
Here, we expanded upon our previous work by testing whether irritability predicts future ADHD symptoms within a larger data set of adolescents and adding a cohort of young adults to examine if the findings were valid for broader age ranges. In addition, we used a non-parametric-based machine learning technique to build a prediction model and studied the interpretability between these factors.
1.2 A novel framework
1.2.1 Hierarchical clustering
We explored new methods to analyze our data due to the nature of the assessment measures used in diagnosing ADHD symptoms. The assessment tools used to diagnose ADHD include items on rating scales that may highly overlap in meaning and function. For example, self-regulation can refer to both the regulation of attention (inattention) and the regulation of decision-making (impulsivity). An inattentive symptom like “difficulty sustaining attention” may lead to impulsive behaviors such as “blurting out answers” (35). Inattention can also be a driving factor in hyperactivity-impulsivity symptoms in adolescents (36). Collinearity can be a concern when analyzing the data from these assessment tools, as highly correlated items may not provide sufficient unique information and can lead to inaccurate parameter estimations and misinterpretations (37). This can pose even more challenges when dealing with small sample sizes where the instances may not allow the inclusion of all predictor variables in the analysis. Hierarchical clustering is an effective approach when dealing with collinear variables within these types of datasets (38, 39). Hierarchical clustering is one of the feature engineering techniques that groups similar data points into clusters, forming a tree-like structure. This approach can be particularly helpful in psychiatric research where there are problems with a high number of variables and a low number of instances. Through clustering and visualization of the data points, meaningful insights can be obtained about relations between variables and further forming hypotheses (40).
1.2.2 Machine learning (ML)
ML as a tool can assist researchers in identifying patterns and correlations between symptoms and further predict functional outcomes or longitudinal changes regarding the significance of individual symptoms. Various studies on ADHD have utilized ML models employing linear regression, linear support vector machine (SVM), and decision tree algorithms (41–43). Linear regression models and SVMs are parametric methods and make key assumptions about the data distribution. Although these models perform well with a slight violation against these assumptions, building an ML model that does not assume a specific data distribution may enhance the assessment of relations within non-linear and non-normally distributed data. Moreover, other than prediction, the explanation of causal relationships is an important aspect of psychiatric research where decision tree algorithms provide a stronger framework (44). Random forest (RF), an extension of decision tree algorithm approaches, is suitable for problems where predictor variables are large in count, highly collinear, and similar in their measurement scale. RF approaches have been used as a validation and prediction technique for both cross-sectional and longitudinal data analysis and provide a framework for the explanation of the model using features’ importance for the effect of variables on the fit of the model (45). In previous ADHD studies, RF approaches have shown promising results for the classification of ADHD-NT participants using clinical measures, identification of relations between ADHD symptoms and other disorders, and distinction of disorders that have similar symptoms to ADHD (46–48). In this study, we apply this comprehensive approach, combining clustering and ML to reveal relations and identify patterns within our dataset.
2 Methods
2.1 Participants
We used data collected from an ongoing project, Mapping Impulsivity’s Neurodevelopmental Trajectory (MINT - R01MH091068) [see references for details on diagnostic procedures (31, 34, 49–51)], which employs multi-modal neuroimaging and clinical measures to study the neurodevelopmental trajectories of impulsivity in adolescents and young adults. All participants were diagnosed by licensed psychologists with extensive experience diagnosing ADHD (JFD or JBS), using the Diagnostic and Statistical Manual of Mental Disorders 5th Edition (1). All participants were evaluated and diagnosed for ADHD or as NT using ADHD rating scales with parents completing the Conners’ Parent Rating Scale – 3 on their children (51) with supplementary information from the Teacher (Conners-3 Teacher Rating Scale—CTRS-3) for adolescent participants. Young adults rated their ADHD symptoms using the Conners’ Adult ADHD Rating Scale (CAARS) – Self version and an Observer (e.g., parent/spouse/friend). Parents (or if a parent was not available, another older relative) were asked to rate the young adults’ childhood behavior using the Barkley Adult ADHD Rating Scale–IV (Other Report) (52) to further establish the presence or absence of ADHD childhood symptoms. Diagnosis (or absence) was further established with adolescent participants and their parents completing full clinical interviews with the Diagnostic Interview Schedule for Child and Adolescents (DISC) (53) for earlier participants in the study and then the MINI International Neuropsychiatric Interview (MINI)—Kid (54) for later participants. Clinical interviews for the young adult participants used the DISC-Young Adult version or a MINI interview (55) along with the Diagnostic Interview for ADHD in Adults (DIVA) (56) so that each young adult was given a clinical interview based on the DSM, including items on the ADHD scale as the earlier version of the MINI for adults did not include an ADHD scale.
Participants were between the ages of 12 and 30 years. Participants, both ADHD and neurotypical (NT), were required to have an intellectual functioning score of 80 or higher. This was assessed using the Wechsler Intelligence Scale for Children (WISC) and the Wechsler Adult Intelligence Scale (WAIS). For participants recruited during COVID-19 pandemic restrictions (n=16), intellectual functioning was evaluated by our Ph.D. level psychologists based on educational performance reported by parents or by adult participants themselves. Criteria included no reported need for special educational services related to intellectual challenges. Participants were excluded if they had an academic learning disability, indicated by scores below 80 in reading or math assessments on the Wechsler Individual Achievement Test (WIAT). During pandemic restrictions, the assessment of academic learning disabilities was based on parent or self-report regarding the need for special educational services at school. For ADHD diagnostic criteria, the DSM-5 criteria were used to categorize participants as either NT or having ADHD Combined Presentation. A category of “subthreshold ADHD” was defined for individuals displaying fewer than nine, but more than three, symptoms of ADHD.
The study excluded participants with IQ < 80, with a lifetime history of autism spectrum disorders, any other severe mental diagnosis (depression, post-traumatic stress disorder, psychosis), specific chronic medical illness, academic learning disorders, specific or focal neurological disorder, history of substance dependence or abuse disorder currently or within past five years, contraindications for neuroimaging. Participants with ODD, a disorder that may be present in early childhood, were permitted to be in the study, however, only five participants in the study were diagnosed with ODD. The study excluded individuals with diagnosable depressive disorders as a main aim of the broader study was to follow the trajectory of the emergence of depression in later adolescence and young adulthood in relation to heightened impulsivity manifested by individuals with ADHD. Participants using non-ADHD psychotropic medications within the past year were excluded. Participants prescribed stimulant medications or atomoxetine for ADHD were permitted to enroll in the study. A licensed psychologist (JFD or JBS) reviewed all the diagnostic information to determine the final ADHD (or NT) diagnosis based on all the diagnostic information.
Informed written parental consent and child assent were obtained from all participants or consent from the adult participants themselves by trained research staff during their first encounter, before completing the psychological evaluation. Participants were compensated for their time in completing measures and rating scales at each wave. A university Institutional Review Board approved the study.
The study included a total of 272 participants, comprising 142 males and 130 females, aged 12 to 30 years. Table 1 provides a summary of the participants’ demographics, categorized into two subgroups: adolescents (ages 12–17) and young adults (ages 18–30).
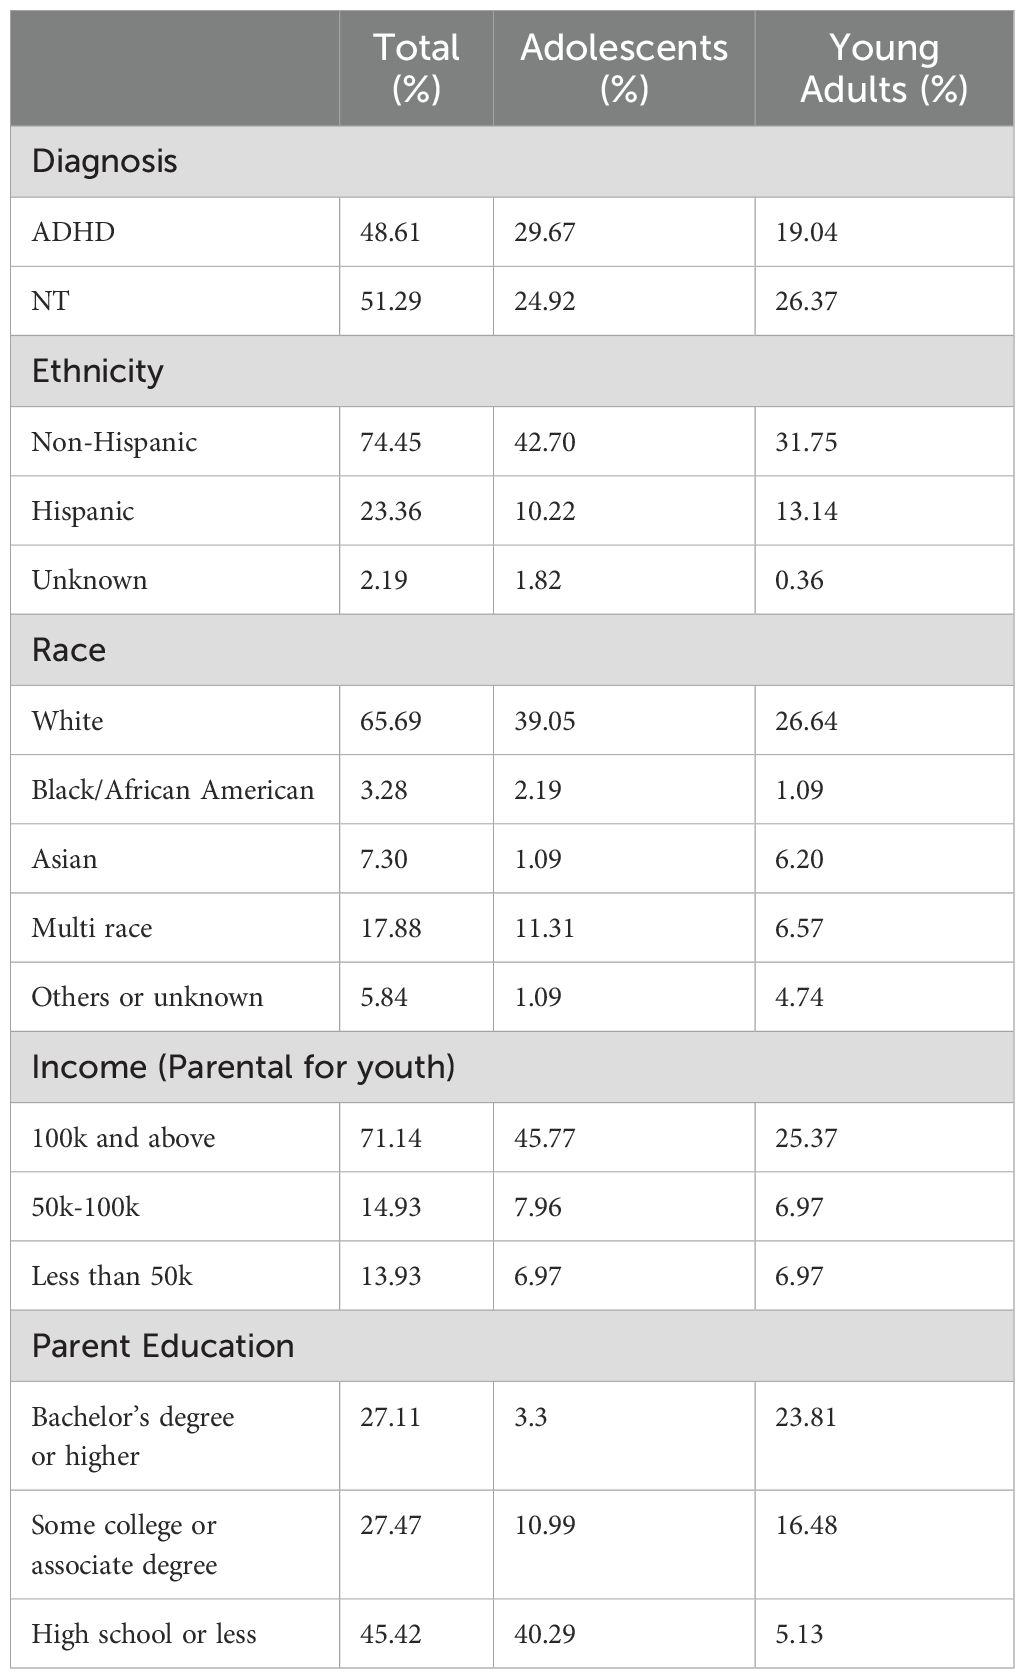
Table 1. Demographic Information: characteristics of adolescent and young adult groups.
2.2 Measures
ADHD rating scale items were derived from the highest scores obtained from Conners’ Parent and Self-Report Scales, as well as from CAARS Self-Report and Observer (e.g., parent, spouse, friend, sibling) Rating Scales, across two distinct age groups: adolescents (ages 12–17) and young adults (ages 18–30). These data were collected as part of a longitudinal study in which clinical measures were assessed at multiple time points.
In this study, Timepoint 2 (T2) occurred approximately one to six years after Timepoint 1 (T1), with follow-up intervals averaging 1.41 years (SD = 0.24) for adolescents and 3.85 years (SD = 2.04) for young adults. At T1, the adolescent group included 94 males and 54 females, which decreased to 51 males and 33 females at T2. In the young adult group, there were 48 males and 76 females at T1, which dropped to 15 males and 31 females at T2.
We used the DSM-oriented ADHD constructs, including hyperactivity/impulsivity and inattentiveness, as derived from Conners’ rating scales for adolescents and young adults (57). Irritability items were from the Conners’ and CAARS selected based on their similarity in content with the commonly used irritability scale, the Affective Reactivity Index (ARI) (58) and included ‘1. loses temper, 2. is angry and resentful, 3. is easily annoyed, 4. has temper outbursts, 5. becomes irritable when anxious’ for adolescents and ‘1. is easily frustrated, 2. has a short fuse/hot temper, 3. is irritable, 4. throws tantrums’ for young adults.
The raw score for each symptom was calculated by summing all items within the respective subscale, with individual item scores ranging from 0 (not true at all) to 3 (very true). The total scores for the hyperactive/impulsive and inattentive scales could reach a maximum of 27. For irritability, the total score on the Conners’ scale could be as high as 15, while the CAARS irritability score had a maximum of 12 due to one fewer item compared to the Conners’ scale used for adolescents. Table 2 provides the descriptive statistics for all participants.
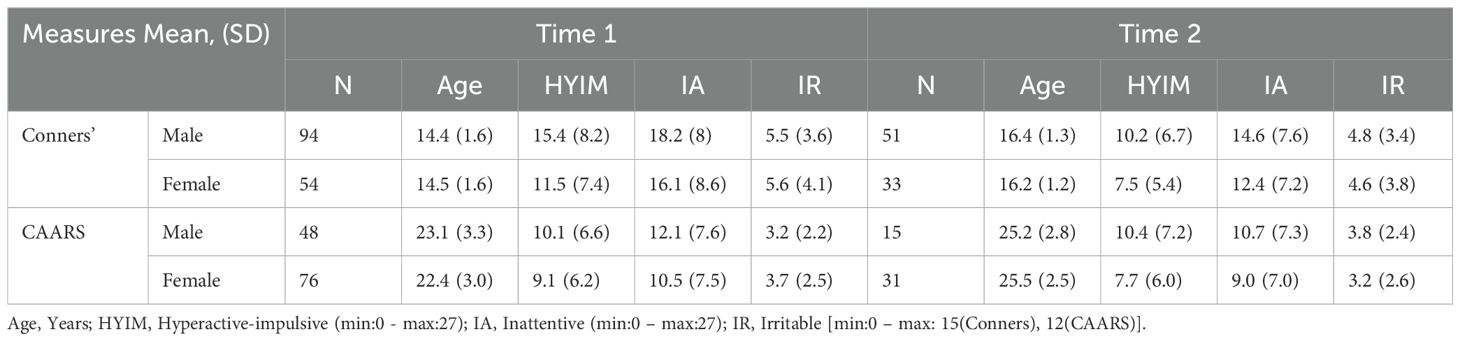
Table 2. Descriptive statistics.
In both adolescents and young adults, the non-returners were predominantly male; however, the sex ratio remained consistent across both time points. Among adolescents, non-returners exhibited significantly higher inattentive scores at T1. While hyperactivity/impulsivity and irritability scores decreased in adolescents over time, changes in hyperactive/impulsive, inattentive, and irritable symptoms were not significant among young adults.
At T1, no significant differences were observed between sexes for irritability and inattentiveness (p-value > 0.05). However, males displayed significantly higher hyperactivity/impulsivity scores compared to females. By T2, there were no significant differences between sexes across any of the measured constructs.
We utilized an adaptation of the Peterson Puberty Development Scale (59) to assess pubertal stage. Our analysis revealed no significant differences in irritability measures between individuals in the pubertal stage and those who were not.
2.3 Analytic approach
Our analysis builds upon a previously published study by our group (34), which demonstrated that irritability predicts hyperactive/impulsive symptoms in adolescent females. Here, we expand upon this analysis by utilizing a larger sample size and further investigating the data at the behavioral level through hierarchical clustering and an ML approach.
To begin, we conducted a multivariate regression analysis of the irritability subscale and ADHD constructs consistent with extant methods, encompassing hyperactivity, impulsivity, and inattentiveness symptom ratings, among both adolescents and young adults. Following this analysis, we utilized ML to explore the behavior-level relations, particularly focusing on groups where irritability serves as a predictor variable of ADHD symptoms. We addressed the issue of collinearity between variables and constructed an ML prediction model based on the results of the multivariate regression analysis.
2.3.1 Multi-variate regression analysis
Multi-variate regression analysis is a statistical approach that extends the concept of simple linear regression and examines the relation between two or more independent variables and a dependent variable. This technique estimates the coefficients for the independent variables in such a way that the model best fits the observed data.
In the initial step of our analysis, we performed an extensive multivariate regression assessment to investigate the relation between ADHD constructs and irritability. This analysis started with a thorough evaluation of the prerequisites for applying a multivariate regression model to our dataset. These prerequisites included the examination of linearity, homoscedasticity, and the normality of data distribution. Initially, we constructed a multivariate regression model using inattentive, hyperactive/impulsive subscale scores, and the irritability subscale across the entire participant group (N=272) spanning from T1 to T2. We assessed the residual plots for each symptom to ensure the normality of data distribution. We examined different scaling mechanisms and chose min-max scaling to make the distribution closer to normal.
Moreover, we separated the analysis into two groups, adolescents, and young adults. In each group age at T1 was considered as a covariate and potential sex-based differences were examined. Given that the follow-up interval between T1 and T2 ranged from approximately one to six years, we evaluated whether to include time elapsed as a covariate in our analyses as well. The follow-up occurred approximately 1.41 years (SD = 0.24) after T1 for adolescents and 3.85 years (SD = 2.04) for young adults. When age at T1 and the time interval between T1 and T2 were incorporated as covariates, the associations were not significant and reduced the overall model fit. As a result, these factors were excluded from the final analyses.
For our analytical framework, we employed the Sequential Equation Modeling (SEM) methodology executed using R’s Lavaan Package (60). Lavaan provides the advantage of using Full Information Maximum Likelihood (FIML) estimation to handle missing data (61). FIML allows the contribution of all available information to enhance parameters’ estimation while minimizing the potential for bias.
To improve the precision of our model’s parameter estimation and approximate a distribution that aligns more closely with normal distribution, we applied bootstrapping with 500 draws. This technique enhances the robustness of our findings and the overall validity of our analytical outcomes.
2.3.2 Machine learning approach
Based on the results from multivariate regression analysis, we performed a behavior-level analysis using an ML classifier for the groups where irritability was a predictor variable of ADHD symptoms in later years. Figure 1 summarizes the algorithm for preparing the data and building the prediction model. We performed hierarchical clustering and from each cluster, we selected one representative variable. These variables together were inputted into our ML model. The input features to our model included 9 items of hyperactivity/impulsivity, 9 items of inattentiveness, and 5 (adolescents) or 4 (young adults) items of irritability at T1. These features were used as predictor variables for ADHD symptoms that revealed a significant change at T2 (based on results of multivariate regression analysis). For both inattentive and hyperactive/impulsive symptoms t-scores above 60 were labeled as 1, significant, and t-scores below 60 were labeled as 0, not significant.
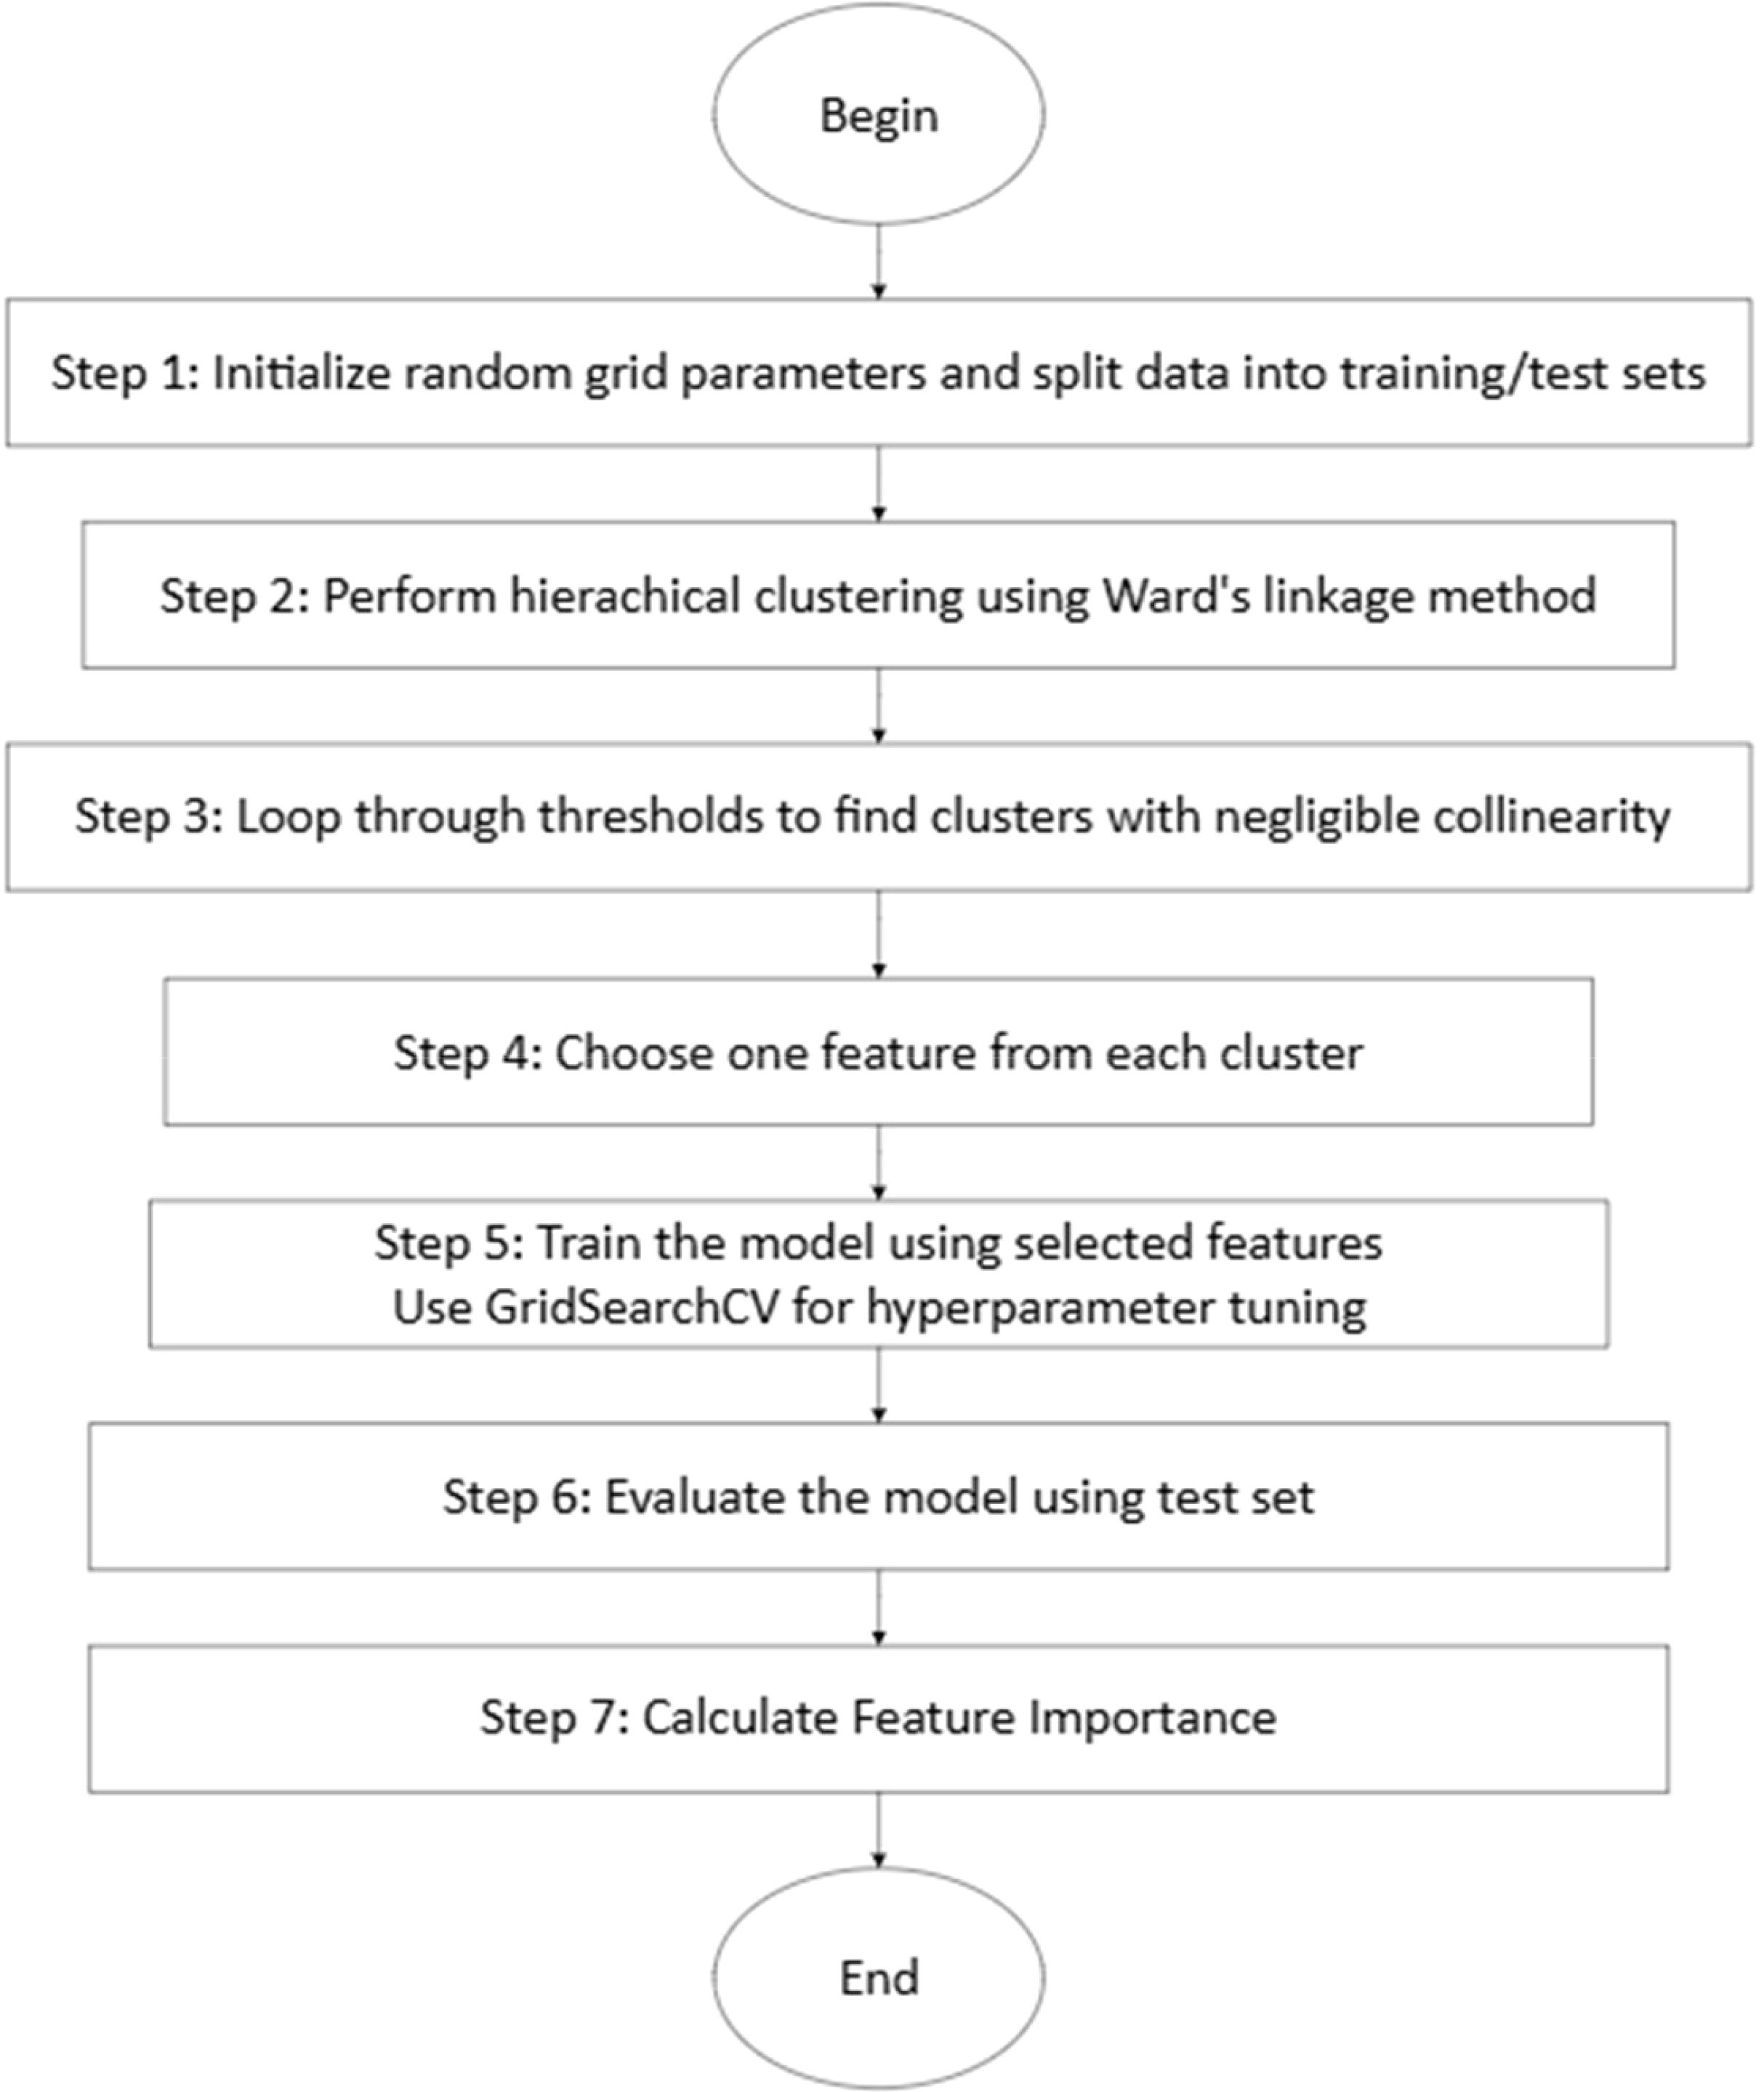
Figure 1. Feature clustering and model selection algorithm.
To enhance the interpretability of our model and validate the results of the regression analysis, we applied our sample data to an RF classifier. RF is a supervised machine learning algorithm that is based on an ensemble learning technique called bagging (62). RF models are built using many decision trees trained by a bootstrapped dataset randomly sampled from the original data. Decision trees by themselves are easy to implement and robust to interpret and random forests have the advantage of aggregating the results of various trees to output the prediction value and gain a significant improvement in accuracy performance (63). RF is a non-parametric model that does not rely on assumptions about data distribution. It offers the advantage of identifying non-linear relations between features, setting it apart from linear regression and other machine learning models such as the Support Vector Machine (SVM). Further, using cross-validation techniques, RF can mitigate the overfitting problem for small samples that have many variables. We used Scikit-learn library in Python to implement our ML model (64).
2.3.3 Multicollinearity and hierarchical clustering
To address the issue of multicollinearity among features, we used a hierarchical clustering approach based on Ward’s linkage method. Ward’s linkage method determines the distance between two clusters and is computed based on minimizing the increase in Error Sum of Squares (ESS) after merging two clusters into a single cluster. The ESS for a set of observations of a single variable X is calculated as:
Where |.| represents the absolute value, and are observations of variable X, is the number of observations for variable X, and is a constant. The distance between two clusters (X and Y) is defined as:
where XY is the combined cluster merged from two clusters X and Y, and ESS is the Error Sum of Squares as described above.
In hierarchical clustering, we define a “linkage threshold” as a criterion to determine the level of granularity. Each threshold decides at what level of distance (similarity) to stop merging clusters. Clusters that are closer than the threshold are combined, while clusters that are farther apart are not merged. The choice of threshold determines the number of clusters, the higher the threshold the lower the number of clusters. Clusters are characterized by non-significant correlations between them. We initially set the “linkage threshold” to 0, effectively considering each feature as a distinct cluster. Subsequently, we increased this threshold incrementally till there was no strong correlation between the features. We selected one feature from each of the final clusters thus obtained and used as inputs to the RF classifier.
2.3.4 Model optimization and evaluation
To enhance the model’s performance, we employed GridSearchCV within scikit-learn, creating a grid of hyperparameters to identify the best parameters for the model. These hyperparameters included:
● Number of estimators: represents a set of trees trained on a subset of samples and input features.
● Maximum feature: rules the selection of features for decision-making at each node in a tree.
● Maximum depth: controls the complexity of individual trees by specifying the maximum depth of each tree.
● Minimum number of leaves: sets the minimum number of samples required in a leaf, influencing the granularity of the tree.
● Minimum number of samples’ split: regulates the partitioning of data within each leaf node.
To prevent overfitting, we applied Stratified K-Fold Cross-Validation (65) with 5 folds, ensuring that each fold maintained the same proportion of classes as the original dataset. For model evaluation, we calculated the mean and standard deviation of precision, recall, and F1 scores across iterations of the cross-validation folds and the testing dataset. Additionally, to explain the model, we used feature importance estimates, which indicate the contribution of each feature to the model’s performance.
3 Results
3.1 Multivariate linear regression
The initial multivariate regression model, designated as the baseline model, included pathways linking constructs at T1 to their corresponding constructs at T2. In this model, hyperactivity/impulsivity, inattention, and irritability at T1 served as independent variables, while the same constructs at T2 were treated as dependent variables. The baseline model was refined iteratively by adding or removing paths to optimize model fit, assessed using the Akaike Information Criterion (AIC), Bayesian Information Criterion (BIC), Root Mean Square Error of Approximation (RMSEA), Comparative Fit Index (CFI), and Tucker-Lewis Index (TLI).
In the baseline model for adolescents, significant paths were observed from each construct at T1 to its corresponding construct at T2, resulting in AIC = -423.583, BIC = -360.642, RMSEA = 0.134, CFI = 0.966, TLI = 0.915.
Subsequently, paths from “irritable” at T1 to “hyperactive-impulsive” and “inattentive” at T2 were introduced (AIC = -429.385, BIC = -360.449, RMSEA = 0.117, CFI = 0.983, and TLI = 0.935). Since the path from “irritable” to “inattentive” was not significant, it was eliminated. This resulted in a slight decrease in model fit (AIC = -429.032, BIC = -363.094, RMSEA = 0.113, CFI = 0.980, and TLI = 0.939) but made the model simpler and therefore it was removed.
Further adjustments were made by introducing paths from “hyperactive-impulsive” and “inattentive” at T1 to “irritable” at T2. However, these paths were removed as they were not significant and decreased the model fit (AIC = -427.024, BIC = -355.151, RMSEA = 0.146, CFI = 0.980, and TLI=0.899).
For young adults, we followed the same procedure. For the baseline model, we introduced paths from each construct at T1 to the corresponding construct at T2 resulting in AIC = -338.180, BIC = -278.954, RMSEA = 0.135, CFI = 0.963, and TLI = 0.907.
Then we introduced the paths from “irritable” at T1 to “hyperactive-impulsive” and “inattentive” at T2 which resulted in a decrease in model fit (AIC = -335.573, BIC = -270.706, RMSEA = 0.169, CFI = 0.961, and TLI = 0.854) thus the paths were removed.
Next, we introduced paths from “hyperactive/impulsive” and “inattentive” at T1 to “irritable” at T2. (AIC = -343.321, BIC = -278.455, RMSEA = 0.114, CFI = 0.982, and TLI=0.934). The path from “hyperactive/impulsive” to “irritable” was not significant and removing it resulted in an improvement in model fit (AIC = -345.007, BIC = -282.960, RMSEA = 0.096, CFI = 0.984, and TLI = 0.953). In this final model the path from irritable to irritable was not significant and removing it made a slight change in model fit, therefore we eliminated the path to make the model simpler (AIC = -343.244, BIC = -284.018, RMSEA = 0.107, CFI = 0.977, and TLI = 0.942).
Figure 2 shows an overview of the final model and its performance metrics for both adolescents and young adults. We can see that in adolescents, irritability at T1 is associated with hyperactivity/impulsivity at T2 (β = 0.18, p-value < 0.001), and in young adults, inattentiveness is associated with irritability in later years (β = 0.49, p-value < 0.05).
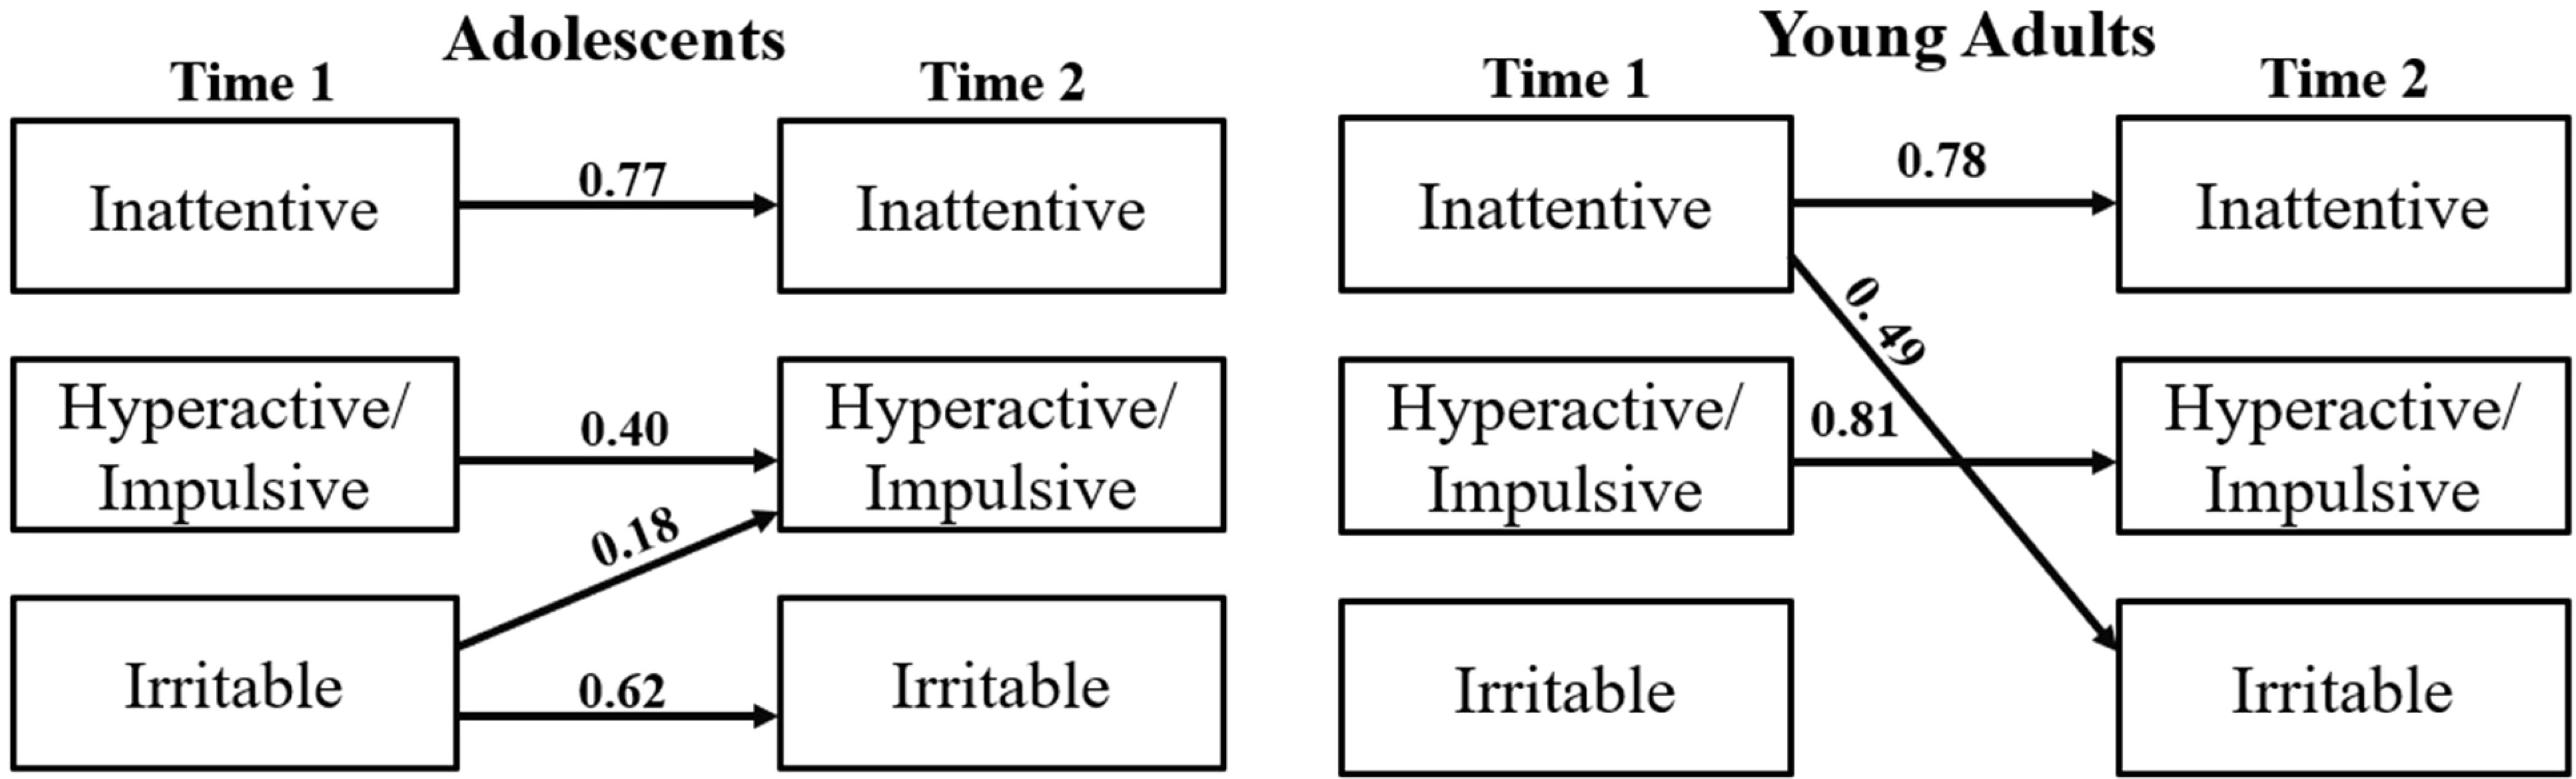
Figure 2. Multivariate regression analysis. adolescents (AIC = -429.032, RMSEA = 0.113), young adults (AIC = -343.244, RMSEA = 0.107).
Further, we extended the analysis to study potential sex differences. We observed that in adolescent females, irritability predicted higher hyperactive-impulsive scores in later years (β = 0.26, p-value < 0.001), whereas in male adolescents no significant correlation emerged.
In young adult females, inattentiveness was a predictor variable for irritability (β = 0.49, p-value < 0.05). During subgroup analysis for young adults, we observed that the multivariate regression model for males exhibited instability. This instability may be attributed to differences in the distribution of covariates among males compared to females, potentially affecting model convergence and robustness.
The results, shown in Figure 3, confirm our previous findings (34) regarding the stability of the link between irritability and hyperactive/impulsive symptoms in adolescent females and underscore the importance of considering sex differences in the study of irritability and its impact on ADHD-related symptoms.
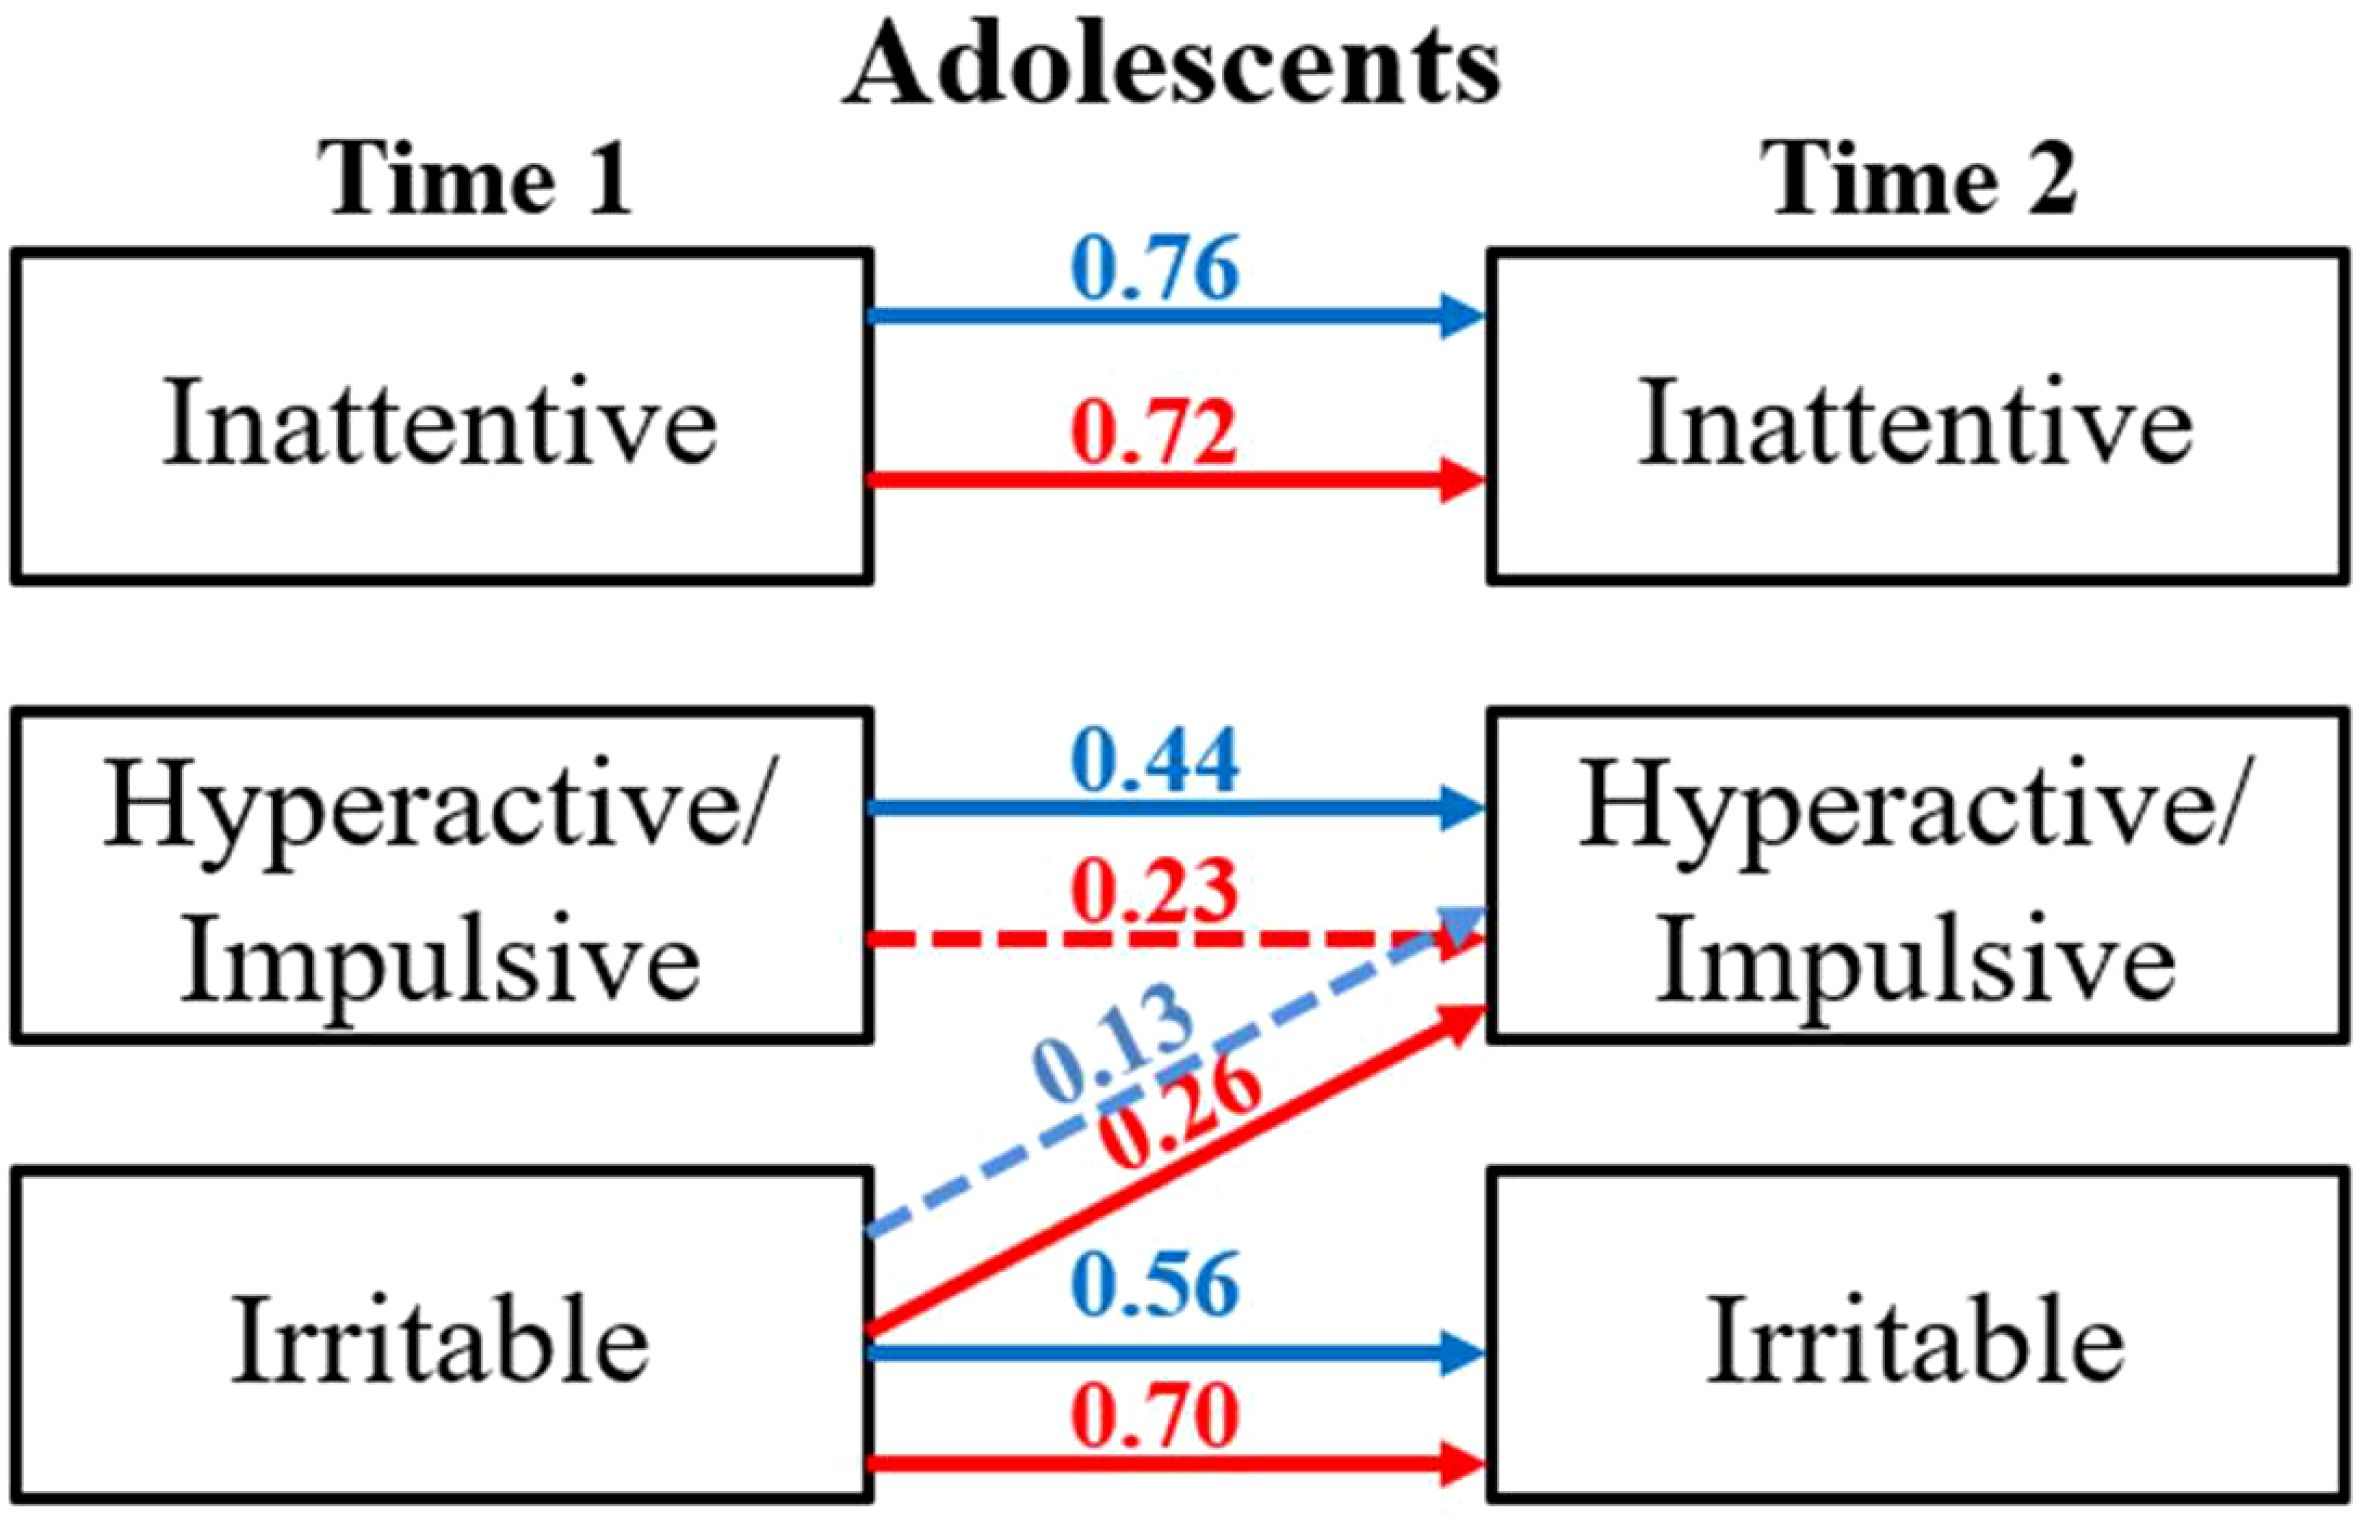
Figure 3. Multivariate regression analysis: group analysis. red female, blue male. Significant paths (p-value < 0.05) are solid red/blue lines and non-significant paths (p-value > 0.05) are depicted using dashed red/blue lines.
3.2 Machine learning analysis
The ML analysis was exclusively conducted on adolescent females, as this subgroup was where irritability predicted hyperactivity/impulsivity within our dataset. We utilized behavioral items to construct ADHD symptoms and the irritability subscale at T1, and investigated the predictability of hyperactive/impulsive symptoms at T2. Before inputting these features into the model, hierarchical clustering was applied to all variables, comprising nine items for hyperactivity/impulsivity, nine items for inattentiveness, and five items for irritability at T1. Using features selected by the clustering algorithm, we trained a non-parametric model employing RF analysis to evaluate the significance of predictability in hyperactive/impulsive scores at T2.
3.2.1 Multicollinearity and hierarchical clustering
Figure 4 shows the dendrogram resulting from applying our clustering algorithm based on Ward’s linkage method to the dataset, illustrating how features are organized into clusters at various levels of similarity.
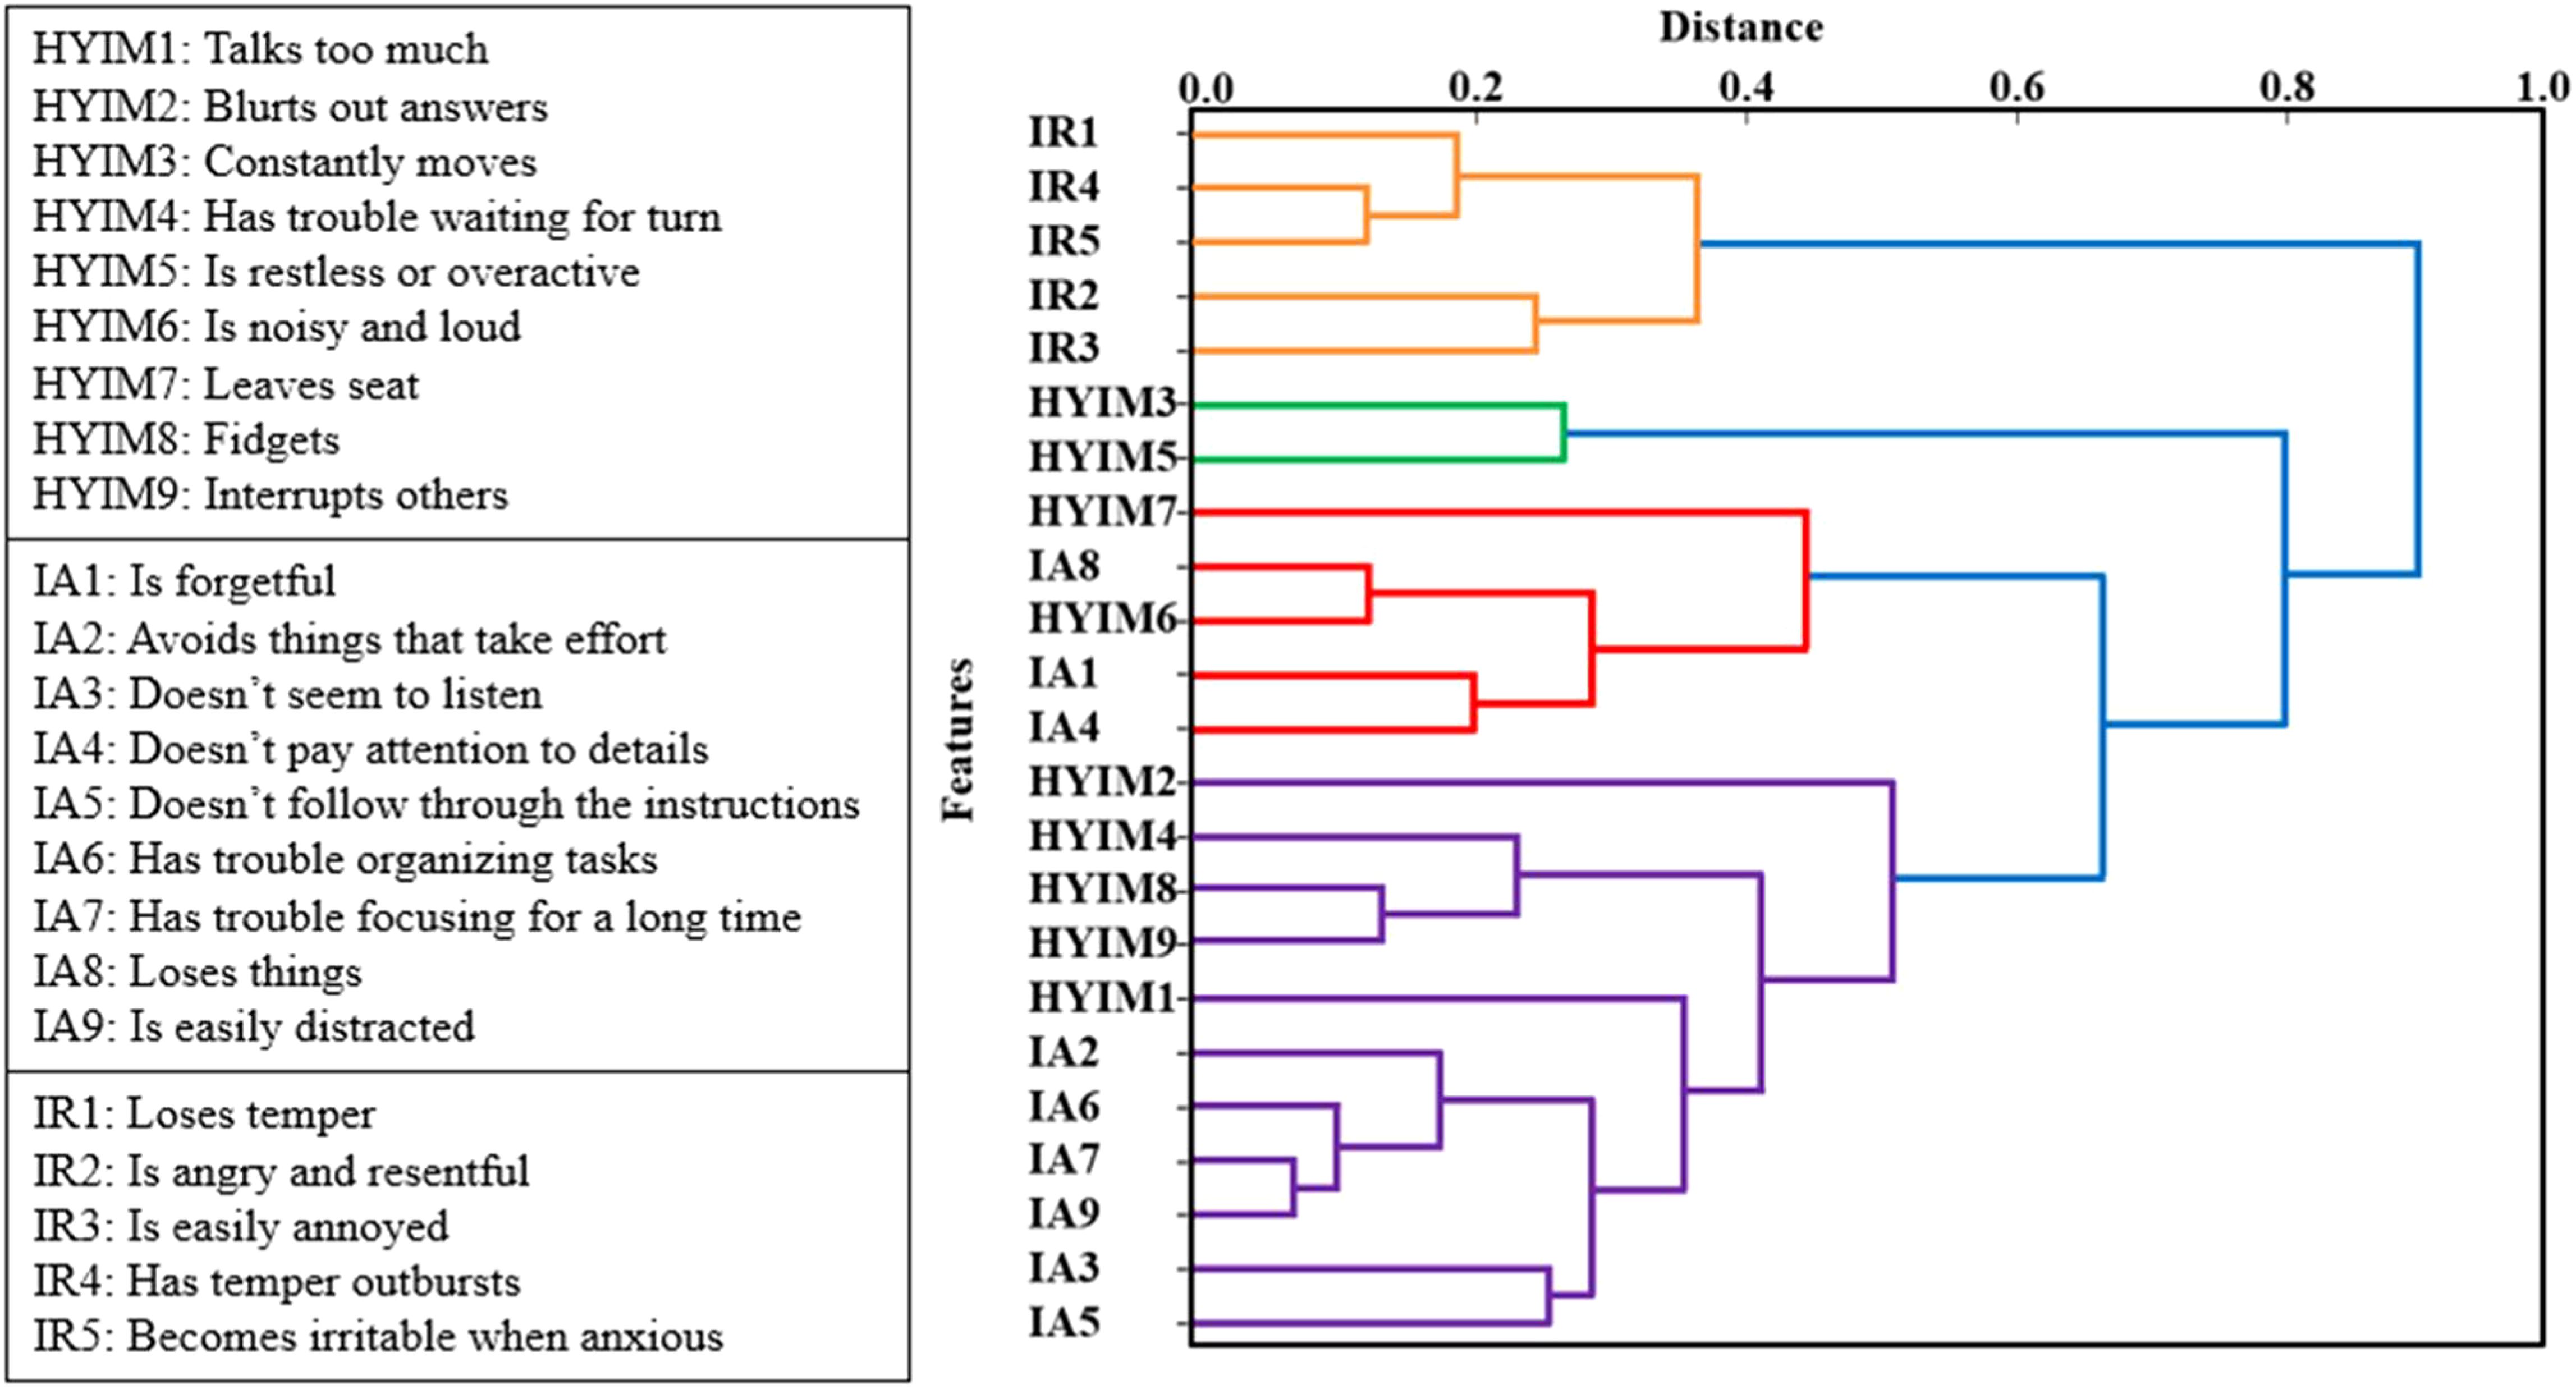
Figure 4. The dendrogram of features includes ADHD constructs and irritability subscale scores at the behavior level in adolescent females. The x-axis represents the similarity between clusters while the y-axis represents the features. Each U-shaped structure in the tree denotes a cluster, with two branches fusing at a specific level of similarity. The length of the U-shape indicates the distance between them. With the threshold set to 0, each variable is treated as an individual cluster.
In this dendrogram, the y-axis represents the data points or features, while the x-axis represents the dissimilarity (distance). As we ascend the tree (from left to right), branches merge, leading to an increase in the distance. Each U-shaped structure in the tree represents a cluster, with two branches fusing at a specific level of similarity. The length of the U-shape indicates the distance between them as considered as a threshold for clustering.
With the threshold set to 0, each variable is treated as an individual cluster. Increasing the threshold in 0.1 increments from 0 to 1, we had more variables emerge in each cluster resulting in a smaller number of clusters and less correlation among them.
To eliminate the impact of highly correlated variables and their influence on the results, the threshold was increased to 0.7. At this threshold, the clusters included the following items from the rating scale: [hyim1, hyim2, hyim4, hyim6, hyim7, hyim8, hyim9, ia1, ia2, ia3, ia4, ia5, ia6, ia7, ia8, ia9], [hyim3, hyim5], and [ir1, ir2, ir3, ir4, ir5]. As shown in Figure 5, the correlation among the clusters chosen at threshold 0.7 was negligible. This clustering technique effectively addressed multicollinearity, allowing for more robust modeling and accurate estimation of features’ importance. From threshold 0 to 1, the restructuring of clusters led to improved accuracy scores. At threshold 0.7 we had the highest performance vs thresholds lower or higher.
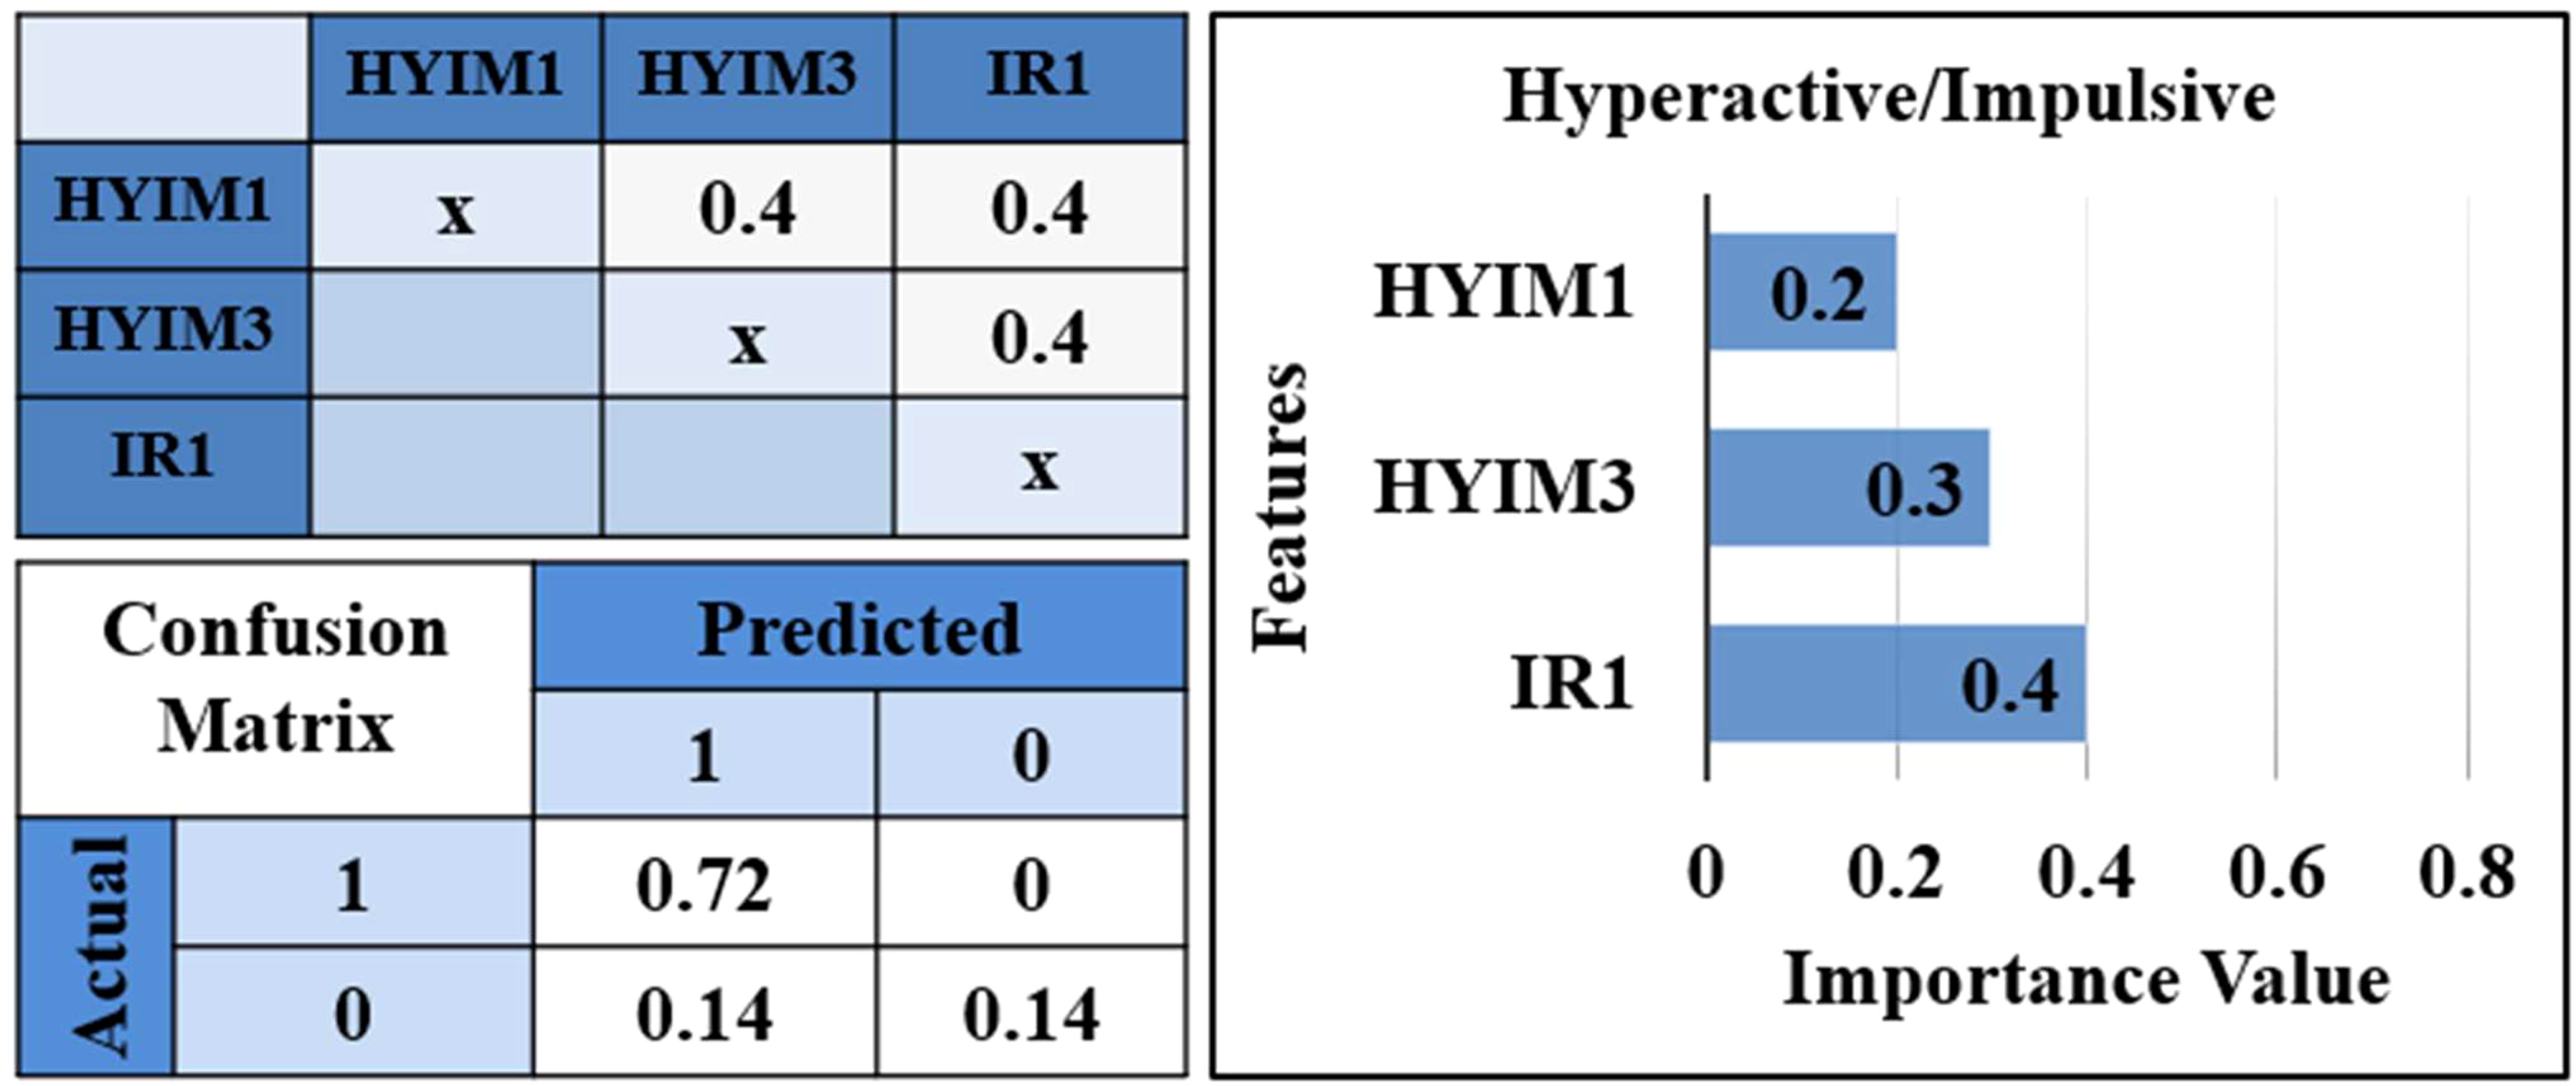
Figure 5. Correlation matrix, confusion matrix, and features’ importance. Correlation matrix for selected features from each cluster while the clustering threshold is set to 0.7. Confusion matrix for the test set for predicted values. *IR1: “loses temper”, HYIM1: “talks too much”, HYIM3: “constantly moves”.
In each model, we replaced the selected features with alternative variables within the same cluster. In each iteration, the performance showed slight fluctuations and the importance of the features remained relatively consistent. Ultimately, features yielding higher performance from each cluster were chosen to integrate into the final model.
3.2.2 Model configuration and hyperparameters
The RF classifier was configured using GridSearchCV and these hyperparameters were eventually chosen to balance model complexity and performance, aiming to prevent overfitting: number of estimators: 10, maximum depth: 3, minimum samples of each split: 2, minimum samples of each leaf: 1, maximum number of features: ‘sqrt’, and bootstrap: True.
3.2.3 Model performance metrics
The performance of the RF classifier on the test set is summarized by the following metrics:
● Accuracy (86%): The model correctly predicted 86% of the instances.
● Precision (100%): All positive predictions made by the model were correct, indicating no false positives.
● Recall (50%): The model identified 50% of the actual positive instances.
● F1 Score (66.7%): This is the harmonic mean of precision and recall, providing a single metric that balances the trade-off between the two.
3.2.4 Confusion matrix
The confusion matrix provides a detailed breakdown of the model’s classification performance:
● True Negatives (TN): 72% of the negative instances were correctly classified.
● False Positives (FP): 0% of the negative instances were incorrectly classified as positive.
● False Negatives (FN): 14% of the positive instances were incorrectly classified as negative.
● True Positives (TP): 14% of the positive instances were correctly classified.
This reveals that the model is highly precise in identifying positive instances (no false positives).
3.2.5 Feature importances
Figure 5 shows irritability item 1, “loses temper” selected from the cluster including all irritability items, has the highest importance 0.4 in predicting hyperactive/impulsive symptom significance at T2. The third hyperactive/impulsive item, “constantly moves” is the second significant feature with a value of 0.3, selected from the cluster including the third and fifth hyperactive/impulsive symptoms. The first hyperactive/impulsive item, “talks too much” selected from the cluster including all inattentive items and hyperactive/impulsive items except the third and fifth is the third highest feature with a value of 0.2.
3.2.6 Prediction model for impulsive symptom
Further, we separated the scores for impulsivity and hyperactivity symptoms and used features selected based on hierarchical clustering to train two different classifiers. As Figure 6 shows, the results showed irritability had a high ranking in the prediction of impulsive symptoms (accuracy: 86%, precision: 100%, recall: 50%, f1: 66.7%) and the performance of the prediction model for the hyperactive model was significantly lower.
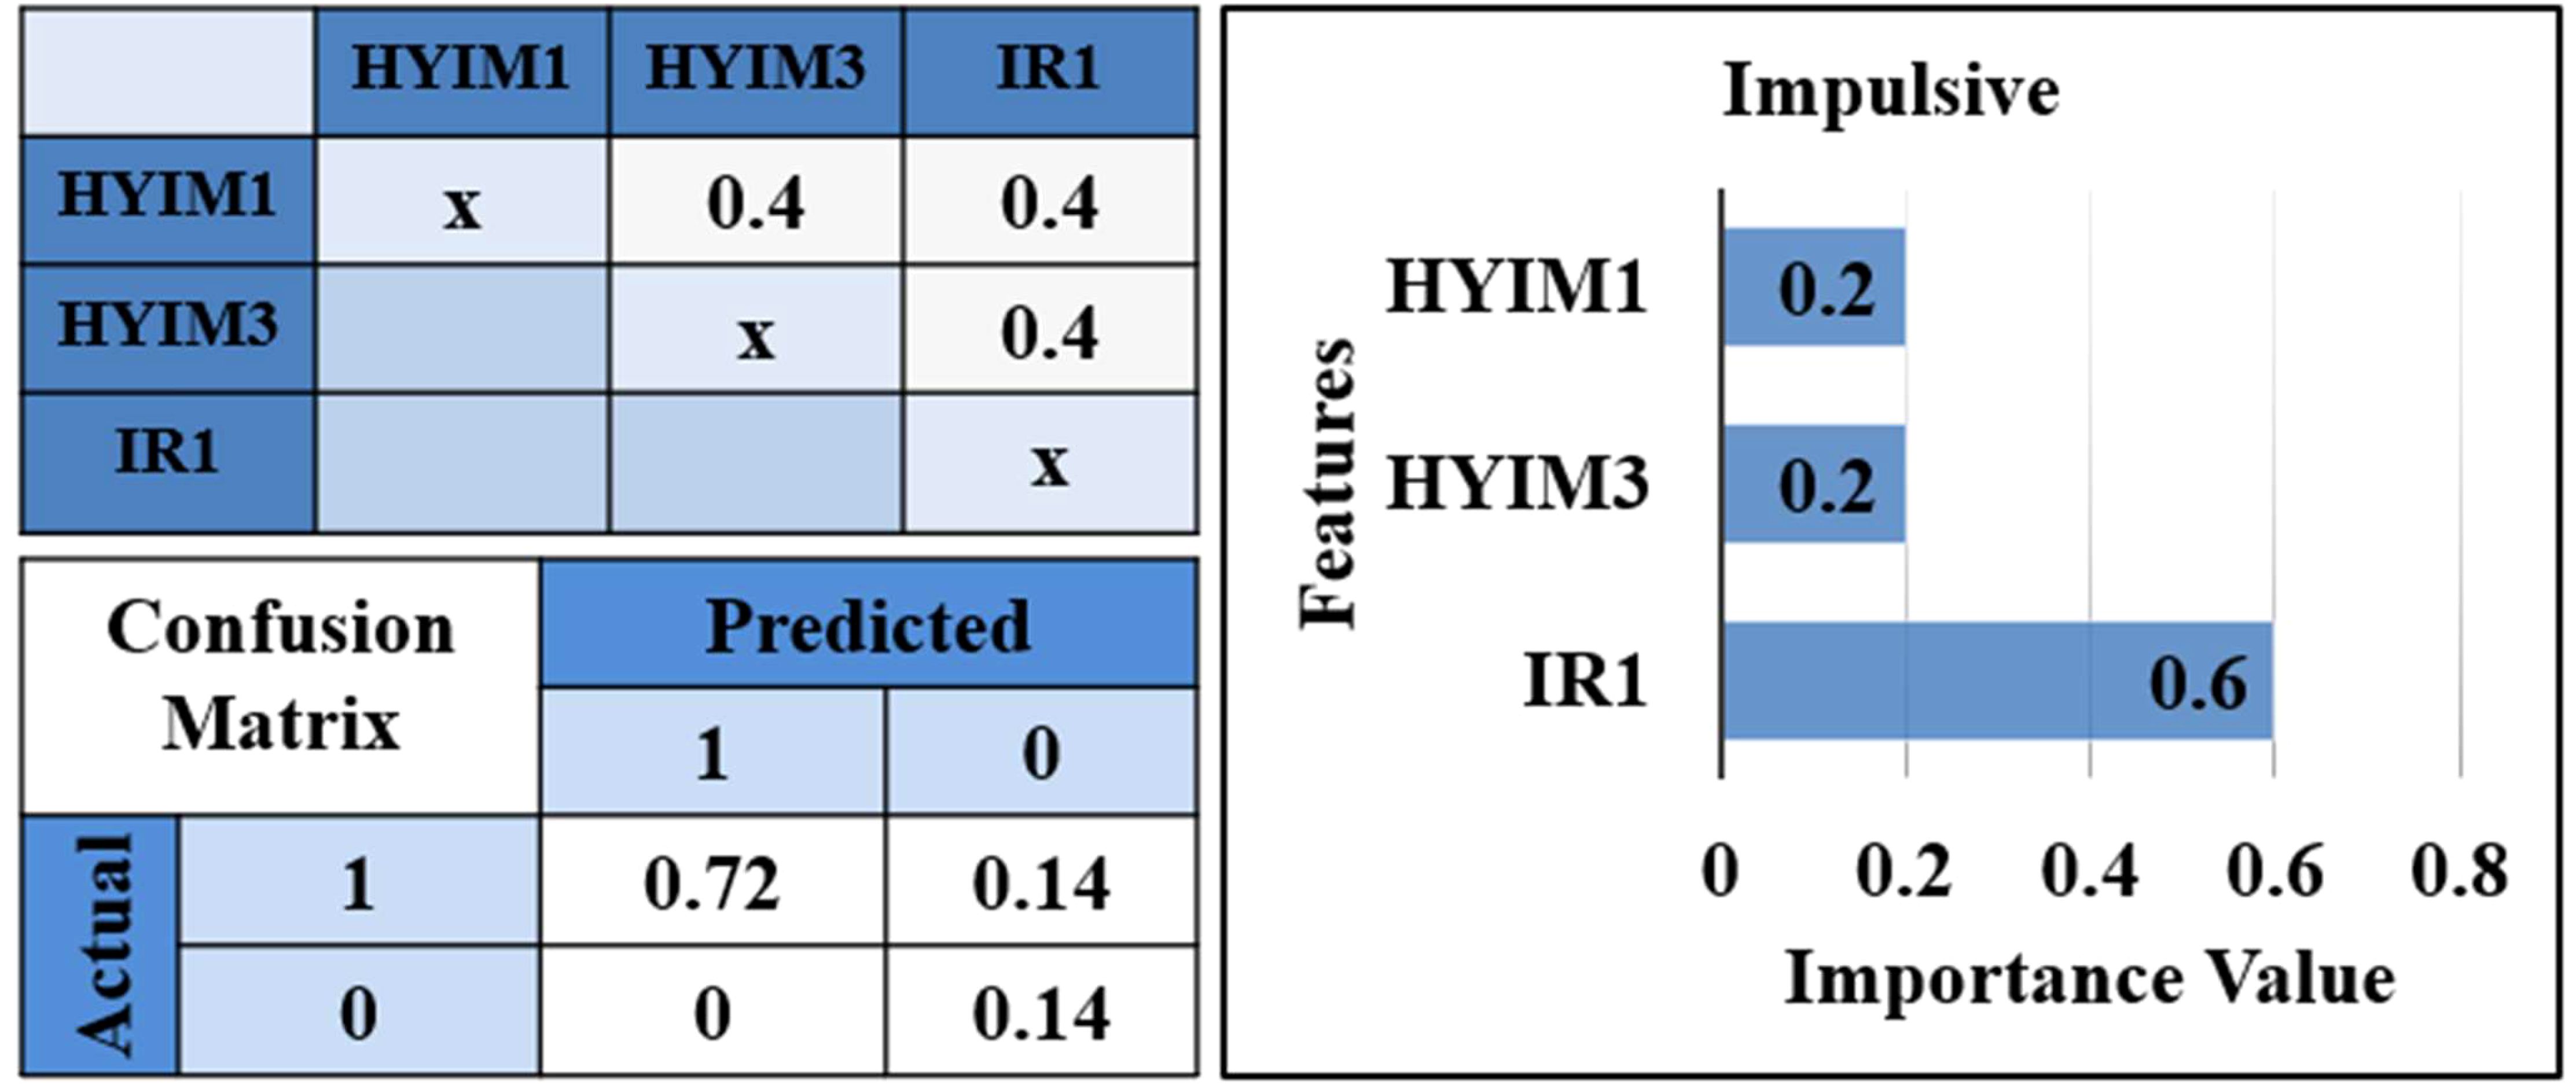
Figure 6. Correlation matrix, confusion matrix, and features’ importance for impulsive prediction model. *IR1: “loses temper”, HYIM1: “talks too much”, HYIM3: “constantly moves”.
4 Discussion
Irritability is not a diagnostic symptom of ADHD, but individuals diagnosed with ADHD often display intense, negative emotional reactions to minor setbacks and challenges (66–68). This study extended our previous work which investigated the relation between irritability and ADHD symptoms in adolescents using the Conners’ Parent Rating Scale-3 (34). We augmented our dataset by including Conners’ self-rating scale for adolescents and expanded the study for young adults using the CAARS self and observer rating scales. In the longitudinal study, we explored sex-based differences and the role of irritability in predicting ADHD symptoms. Using multivariate regression analysis, we identified a significant link between irritability at T1 and hyperactive-impulsive symptoms at T2 within adolescent females.
We introduced a novel approach; a machine-learning model coupled with a hierarchical clustering technique. This approach helped us illuminate the relationships between items within each subscale. We performed a fine-grained analysis by including all compounding behaviors of each symptom and applied Ward’s linkage method and RF to cluster the variables, remove collinearities, and predict symptom significance at a later time. The performance of our model was significantly high, and it showed irritability items have a relatively higher importance in predicting hyperactive/impulsive symptoms for adolescent females compared to adolescent males and young adults. This approach was particularly crucial, given the constraints of our relatively small sample size.
4.1 Irritability-impulsivity link and sex differences
Analyzing the results of two distinct models for impulsivity and hyperactivity, we observed that in adolescent females, irritability has a higher rank in identifying impulsive symptoms than hyperactive symptoms. This irritability-impulsivity link may be due to underlying challenges with emotional regulation, related to brain structure and function and perhaps with dopaminergic regulation of activity during this critical sensitive period of brain development (69, 70). Indeed, irritable moods and frustration may contribute to heightened impulsive reactions (71). Also, the significant association between irritability and impulsiveness among females may arise from the challenges, uniquely experienced by females with ADHD, where the presence of irritability could increase difficulty in regulating their emotions, resulting in more impulsive behaviors (72). It may also be that if they are experiencing irritability related to the omission of expected rewards, they may seek out rewards in the future, including ones that are more immediately available, thus acting impulsively, to ameliorate a deficit in a reward state as those with higher irritability may have an increased sensitivity to both omission and receipt of rewards (73). A mediation analysis in future research could clarify this correlation. Fluctuations in hormonal functioning during these periods may also be relevant (74). Future studies should investigate potential links between daily and monthly hormonal fluctuations and irritable, hyperactive/impulsive, and inattentive symptoms in adolescents with ADHD. This area of inquiry is beyond the scope of our project, as our data collection focused on overall pubertal development rather than specific hormonal patterns. Future analyses could also explore whether the higher ratings on emotional constructs, such as irritability, may reflect bias toward, females than males in relation to societal expectations (75). In addition, future work should integrate behavioral and functional neuroimaging data to investigate emotional and cognitive regulation. This approach may produce less bias than rating scale measures, providing objective data to complement studies that rely on potentially biased rating scales. The association between irritability and hyperactivity/impulsivity symptoms in females, but not males, suggests higher stability in irritability ratings for females. Stability may be a conserved phenomenon in females due to the way dysregulated mood progresses in females versus males, or due to differences in the etiology of attention in females versus males. It is also likely that there are genetic origins of brain regional sex differentiation that are related to externalizing vs internalizing symptoms (76).
4.2 Irritability-inattentiveness association in young adults
In adulthood, we found inattention predicted a subsequent higher likelihood of irritability. Inattention could be associated with lower peer acceptance and victimization and can predict irritability (77). Individuals who struggle with maintaining attention might find it harder to connect with their peers and may be more vulnerable to being targeted or mistreated by others. These negative social experiences, such as rejection or bullying, can then lead to heightened irritability as a reaction to the stress and frustration caused by these interpersonal challenges. Also, this connection might be attributed to the known association of inattention to functional impairments. Tasks requiring prolonged focus can be emotionally draining, especially in groups where there are already higher levels of inattention, such as in our study, contributing to higher irritability (78). The implication is that individuals who struggle with maintaining attention for extended periods may experience increased feelings of irritability as a result of the added emotional strain brought about by these tasks.
4.3 Machine learning approach
We extended our previous work (34) and validated our results using multivariate regression. However, it is important to acknowledge that linear regression, being a parametric model, assumes linearity in relationships, the absence of multicollinearity, and a normal distribution of data. Here we use a non-parametric approach that unlike linear regression does not make any assumption about data distribution showing that irritability items have higher importance in predicting hyperactive-impulsive symptoms in adolescent females.
Machine learning approaches can be top-down hypothesis-driven bottom or data-driven. The latter can be unstructured and exploratory, and prone to false positives, overfitting, and fitting to noise. Larger samples help avoid this issue. However, hypothesis-driven approaches – such as our present study - are powered by expert domain knowledge, in the form of published clinical findings, thus narrowing the problem search domain and feature space.
Machine learning approaches benefit from larger sample sizes and future studies should attempt to include larger samples. Our dataset initially comprised of 54 instances, which was further reduced to 33 due to missing data from participants at T2. We conducted a statistical test on all variables at T1 between two groups: those with second-time data and those without. Our observation revealed no significant difference between the groups concerning the variables selected as input to the model (IR1, HYIM1, and HYIM3), indicating that these variables share the same distribution.
Our modest sample size was able to harness the strengths of an extremely well-characterized community-recruited longitudinal sample of adolescents with and without ADHD, with deep behavioral phenotyping and multimodal imaging. This sample has been carefully recruited to include participants with the Combined Presentation Type of ADHD and without comorbid disorders such as autism, learning disabilities, or severe mental conditions at Time 1 (e.g., psychosis, depression, or substance use disorders) to limit confounding variables. We also excluded youth during T1 with comorbid disorders because a primary goal of the overall project from which these data were taken was to assess the emergence of later psychiatric diagnoses, such as depression, anxiety, posttraumatic stress disorder (PTSD), and substance use disorders in relation to earlier impulsivity symptoms and ADHD diagnoses. However, the exclusion of volunteers with comorbid disorders such as depression may have limited the generalizability to youth who have both diagnosable depression and ADHD. Our ADHD group did have higher overall depressive symptoms than the NT group (34), though not to the degree that the symptoms met criteria for a diagnosis of depression.
In our approach, we offered a solution in the form of feature engineering, aimed to simplify the model and enhance performance. In a model with a large number of highly collinear features, we utilized a hierarchical clustering approach, represented visually through a dendrogram, to identify clusters of variables and similarities among them. By aggregating highly correlated features into the same cluster and selecting one representative feature from each cluster, we ensured that the feature importance of the new model remained unaffected by collinearity.
Having collinear features and clustering them results in less intuition about the interpretability of the model. However, hierarchical clustering had the advantage of providing a detailed view of relations between features at different levels of granularity to enhance model performance (79). Remarkably, hierarchical clustering showed that all irritability items were found in one cluster, validating its high internal consistency as a construct. In addition, all inattentive and hyperactive/impulsive items, except hyim3 (i.e., constantly move) and hyim5 (i.e., restless and overactive), form another cluster suggesting that most adolescent females exhibit either a combined presentation of ADHD symptoms or no symptoms at all. This observation aligns with the corresponding statistics for this group, where 12 out of 33 participants show a combined presentation of symptoms, 18 show no symptoms, and three displayed a few symptoms but were not diagnosed with ADHD. These findings underscore the applicability of this approach in gaining deeper insight into data distribution and remind us of the transdiagnostic nature of irritability.
The chosen hyperparameters reflect a trade-off between complexity and performance. The max_depth of 3 and n_estimators of 10 suggest a relatively simple model, which helps in preventing overfitting given the small dataset size. The high precision but low recall indicates that the model is conservative in making positive predictions. This results in fewer false positives but at the cost of a higher number of false negatives. The balanced F1 score reflects the need to improve recall without significantly sacrificing precision. The confusion matrix underscores the model’s strength in correctly identifying negative instances and the distribution of feature importances suggests that all features contribute meaningfully to the model’s predictions, with Feature 3 (hyim3) being the most influential.
In summary, our proposed framework can be an important foundation within the data analysis process, particularly when preparing data for an ML model. This approach deepened our understanding of the data, discovered the collinearity between features, and made informed decisions about feature selection for our prediction model. Moving forward, our approach can be expanded to analyze larger datasets, employing irritability as either a predictor or outcome variable across various dimensions of ADHD and functional outcomes and further enhancing precision diagnostics and treatment decisions.
Data availability statement
The datasets used in this study are available from the National Data Archive and from Dr. Schweitzer.
Ethics statement
The studies involving humans were approved by UC Davis Institutional Review Board. The studies were conducted in accordance with the local legislation and institutional requirements. Written informed consent for participation in this study was provided by the participants’ legal guardians/next of kin.
Author contributions
SK: Conceptualization, Data curation, Formal Analysis, Methodology, Software, Validation, Visualization, Writing – original draft, Writing – review & editing. DG: Conceptualization, Data curation, Formal Analysis, Funding acquisition, Investigation, Methodology, Project administration, Resources, Software, Supervision, Validation, Visualization, Writing – original draft, Writing – review & editing. MS: Conceptualization, Supervision, Writing – review & editing. JBS: Conceptualization, Data curation, Formal Analysis, Funding acquisition, Investigation, Methodology, Project administration, Resources, Software, Supervision, Validation, Visualization, Writing – original draft, Writing – review & editing. PM: Conceptualization, Data curation, Formal Analysis, Funding acquisition, Investigation, Methodology, Project administration, Resources, Software, Supervision, Validation, Visualization, Writing – original draft, Writing – review & editing.
Funding
The author(s) declare financial support was received for the research, authorship, and/or publication of this article. This work was supported by the National Institutes of Health grants R01 MH091068 (Schweitzer), U54 HD079125 (Abbeduto), and the Translational Health Data Science Fellowship program (UC Davis Department of Public Health Science and DataLab).
Acknowledgments
We would like to acknowledge the kind support of our research participants, coordinators and colleagues including F.S. Abkenar, J. Borden, L. Boyle, M. B.E. Bradshaw, C. Calub, E. Calfee, L. Cavallo, L. Chen, W. Elms, I. Farnsworth, C. Fassbender, V. Filkov, A.M. Iosif, S. McClure, J. Nguyen, C. Oguchi, J. Ramos, A. Mitchell-Krishnan, S. Riley, E. Leibenluft, and J.F. Dixon. The authors used ChatGPT v2 to refine the language, check grammar, and suggestion for concluding sentences.
Conflict of interest
The authors declare that the research was conducted in the absence of any commercial or financial relationships that could be construed as a potential conflict of interest.
Publisher’s note
All claims expressed in this article are solely those of the authors and do not necessarily represent those of their affiliated organizations, or those of the publisher, the editors and the reviewers. Any product that may be evaluated in this article, or claim that may be made by its manufacturer, is not guaranteed or endorsed by the publisher.
References
1. American Psychiatric Association. Diagnostic and Statistical Manual of Mental Disorders. s.l. Arlington: American Psychiatric Publishing (2013).
2. Sibley MH, Arnold LE, Swanson JM, Hechtman LT, Kennedy TM, Owens E, et al. Variable patterns of remission from ADHD in the multimodal treatment study of ADHD. Am J Psychiatry. (2022) 179:142–51. doi: 10.1176/appi.ajp.2021.21010032
3. Biederman J, Mick E, Faraone SV. Age-dependent decline of symptoms of attention deficit hyperactivity disorder: impact of remission definition and symptom type. Am J Psychiatry. (2000) 157:816–8. doi: 10.1176/appi.ajp.157.5.816
4. American Psychiatric Association. Diagnostic and Statistical Manual of Mental Disorders, 5th Ed, Text Revision. Washington, DC, : Arlington: American Psychiatric Publishing (2022).
5. CHADD. Available online at: https://Chadd.org/about-adhd/general-prevalence/ (Accessed July 19, 2024).
6. Kessler RC, Adler L, Barkley R, Biederman J, Conners CK, Demler O, et al. The prevalence and correlates of adult ADHD in the United States: results from the National Comorbidity Survey Replication. Am J Psychiatry. (2006) 163. doi: 10.1176/ajp.2006.163.4.716
7. Hinshaw SP, Nguyen PT, O’Grady SM, Rosenthal EA. Annual Research Review: Attention-deficit/hyperactivity disorder in girls and women: underrepresentation, longitudinal processes, and key directions. J Child Psychol Psychiatry. (2022) 63:484–96. doi: 10.1111/jcpp.13480
8. Brotman M, Kircanski K, Leibenluft E. Irritability in children and adolescents. Annu Rev Clin Psychol. (2017) 13:317–41. doi: 10.1146/annurev-clinpsy-032816-044941
9. Wiggins JL, Mitchell C, Stringaris A, Leibenluft E. Developmental trajectories of irritability and bidirectional associations with maternal depression. J Am Acad Child Adolesc Psychiatry. (2014) 53:1191–205. doi: 10.1016/j.jaac.2014.08.005
10. Roberson-Nay R, Leibenluft E, Brotman MA, Myers J, Larsson H, Lichtenstein P, et al. Longitudinal stability of genetic and environmental influences on irritability: From childhood to young adulthood. Am J Psychiatry. (2015) 172:657–64. doi: 10.1176/appi.ajp.2015.14040509
11. Ravi S, Havewala M, Kircanski K, Brotman MA, Schneider L, Degnan K, et al. Parenting and childhood irritability: Negative emotion socialization and parental control moderate the development of irritability. Dev Psychopathol. (2022) 35:1–10. doi: 10.1017/S0954579421001346
12. Gjervan B, Torgersen T, Nordahl HM, Rasmussen K. Functional impairment and occupational outcome in adults with ADHD. J Attention Disord. (2012) 16:544–52. doi: 10.1177/1087054711413074
13. Halmøy A, Fasmer OB, Gillberg C, Haavik J. Occupational outcome in adult ADHD: impact of symptom profile, comorbid psychiatric problems, and treatment: a cross-sectional study of 414 clinically diagnosed adult ADHD patients. J Attention Disord. (2009) 13:175–87. doi: 10.1177/1087054708329777
14. So FK, Chavira D, Lee SS. ADHD and ODD dimensions: Time varying prediction of internalizing problems from childhood to adolescence. J Attention Disord. (2022) 26:932–41. doi: 10.1177/10870547211050947
15. Philipsen A. Differential diagnosis and comorbidity of attention-deficit/hyperactivity disorder (ADHD) and borderline personality disorder (BPD) in adults. Eur Arch Psychiatry Clin Neurosci. (2006) 256:i42–6. doi: 10.1007/s00406-006-1006-2
16. Cumyn L, French L, Hechtman L. Comorbidity in adults with attention-deficit hyperactivity disorder. Can J Psychiatry. (2009) 54:673–83. doi: 10.1177/070674370905401004
17. Galera C, Orri M, Vergunst F, Melchior M, van der Waerden J, Bouvard MP, et al. Developmental profiles of childhood attention-deficit/hyperactivity disorder and irritability: association with adolescent mental health, functional impairment, and suicidal outcomes. J Child Psychol Psychiatry. (2021) 62:232–43. doi: 10.1111/jcpp.13270
18. Di Lorenzo R, Balducci J, Poppi C, Arcolin E, Cutino A, Ferri P, et al. Children and adolescents with ADHD followed up to adulthood: A systematic review of long-term outcomes. Acta Neuropsychiatrica. (2021) 33:283–98. doi: 10.1017/neu.2021.23
19. Dougherty LR, Smith VC, Bufferd SJ, Stringaris A, Leibenluft E, Carlson GA, et al. Preschool irritability: longitudinal associations with psychiatric disorders at age 6 and parental psychopathology. J Am Acad Child Adolesc Psychiatry. (2013) 52:1304–13. doi: 10.1016/j.jaac.2013.09.007
20. Vogel AC, Jackson JJ, Barch DM, Tillman R, Luby JL. Excitability and irritability in preschoolers predicts later psychopathology: The importance of positive and negative emotion dysregulation. Dev Psychopathol. (2019) 31:1067–83. doi: 10.1017/S0954579419000609
21. Stringaris A, Cohen P, Pine DS, Leibenluft E. Adult outcomes of youth irritability: a 20-year prospective community-based study. Am J Psychiatry. (2009) 166:1048–54. doi: 10.1176/appi.ajp.2009.08121849
22. Barclay ME, Silvers JA, Lee SS. Childhood irritability: Predictive validity and mediators of adolescent psychopathology. Res Child Adolesc Psychopathol. (2022) 50:1165–77. doi: 10.1007/s10802-022-00908-2
23. Hawes MT, Carlson GA, Finsaas MC, Olino TM, Seely JR, Klein DN. Dimensions of irritability in adolescents: longitudinal associations with psychopathology in adulthood. psychol Med. (2020) 50:2759–67. doi: 10.1017/S0033291719002903
24. Humphreys KL, Schouboe SN, Kircanski K, Leibenluft E, Stringaris A, Gotlib IH. Irritability, externalizing, and internalizing psychopathology in adolescence: Cross-sectional and longitudinal associations and moderation by sex. J Clin Child Adolesc Psychol. (2019) 48:781–9. doi: 10.1080/15374416.2018.1460847
25. Vidal-Ribas P, Brotman MA, Valdivieso I, Leibenluft E, Stringaris A. The status of irritability in psychiatry: a conceptual and quantitative review. J Am Acad Child \& Adolesc Psychiatry. (2016) 55:556–70. doi: 10.1016/j.jaac.2016.04.014
26. Pylypow J, Quinn D, Duncan D, Balbuena L. A measure of emotional regulation and irritability in children and adolescents: The clinical evaluation of emotional regulation-9. J Attention Disord. (2020) 24:2002–11. doi: 10.1177/1087054717737162
27. Carlson GA, Althoff RR, Singh MK. Future directions: the phenomenology of irritable mood and outbursts: hang together or hang separately. J Clin Child Adolesc Psychol. (2024) 53:1–10. doi: 10.1080/15374416.2024.2332999
28. Bodalski EA, Flory K, Meinzer MC. Scoping review of factors associated with emotional dysregulation in adults with ADHD. J Attention Disord. (2023) 27:1540–58. doi: 10.1177/10870547231187148
29. Beheshti A, Chavanon ML, Christiansen H. Emotion dysregulation in adults with attention deficit hyperactivity disorder: a meta-analysis. BMC Psychiatry. (2020). doi: 10.1186/s12888-020-2442-7
30. Soler-Gutiérrez AM, Pérez-González JC, Mayas J. Evidence of emotion dysregulation as a core symptom of adult ADHD: A systematic review. PloS One. (2023) 17:e0280131. doi: 10.1371/journal.pone.0280131
31. Mukherjee P, Vilgis V, Rhoads S, Chahal R, Fassbender C, Leibenluft E, et al. Associations of irritability with functional connectivity of amygdala and nucleus accumbens in adolescents and young adults with ADHD. J Attention Disord. (2022) 26:1040–50. doi: 10.1177/10870547211057074
32. Leibenluft E, Cohen P, Gorrindo T, Brook JS, Pine DS. Chronic versus episodic irritability in youth: acommunity-based, longitudinal study of clinical and diagnostic associations. J Child Adolesc Psychopharmacol. (2006) 16:456–66. doi: 10.1089/cap.2006.16.456
33. Sullivan EL, Holton KF, Nousen EK, Barling AN, Sullivan CA, Propper CB, et al. Early identification of ADHD risk via infant temperament and emotion regulation: A pilot study. J Child Psychol Psychiatry. (2015) 56:949–57. doi: 10.1111/jcpp.2015.56.issue-9
34. Kahle S, Mukherjee P, Dixon JF, Leibenluft E, Hinshaw SP, Schweitzer JB. Irritability predicts hyperactive/impulsive symptoms across adolescence for females. Res Child Adolesc Psychopathol. (2021) 49:185–96. doi: 10.1007/s10802-020-00723-7
35. Nigg J. Attention and impulsivity. Dev Psychopathol. (2016), 1–56. doi: 10.1002/9781119125556.devpsy314
36. Sokolova E, Groot P, Claassen T, van Hulzen KJ, Glennon JC, Franke B, et al. Statistical evidence suggests that inattention drives hyperactivity/impulsivity in attention deficit-hyperactivity disorder. PloS One. (2016) 11:e0165120. doi: 10.1371/journal.pone.0165120
37. Streukens S, Leroi-Werelds S. Multicollinearity: an overview and introduction of ridge PLS-SEM estimation. In: H., Hair JF, Noonan R, Latan, editors. Partial Least Squares Path Modeling. Basic Concepts, Methodological Issues and Applications. Springer (2023). p. 183–207.
38. Andretta JR, Woodland MH, Ramirez AM, Barnes ME. ADHD symptom frequency and ADHD symptom count clustering in African-American adolescents with juvenile court contact. J Forensic Psychiatry Psychol. (2013) 24:570–93. doi: 10.1080/14789949.2013.823218
39. Zhang S, Yang T, Wu Z, Wang Y, Lui SSY, Yang B, et al. Identifying subgroups of attention-deficit/hyperactivity disorder from the psychopathological and neuropsychological profiles. J Neuropsychol. (2023). doi: 10.1111/jnp.12334
40. Zhang Z, Murtagh F, Van Pucke S, Lin S, Lan P. Hierarchical cluster analysis in clinical research with heterogeneous study population: highlighting its visualization with R. Ann Trans Med. (2017) 5. doi: 10.21037/atm.2017.02.05
41. Anuradha J, Tisha, Ramachandran V, Arulalan KV, Tripathy BK. Diagnosis of ADHD using SVM algorithm. Proc Third Annu ACM Bangalore Conf. (2010). doi: 10.1145/1754288
42. Anuradha J, Jayasri N, Arulalan K. Classification rules for attention deficit hyperactive disorder using decision tree. J Anurardha al Int J Comput Sci Commun Networks. (2014) 2:295–303.
43. Christiansen H, Chavanon ML, Hirsch O, Schmidt MH, Meyer C, Muller A, et al. Use of machine learning to classify adult ADHD and other conditions based on the Conners’ Adult ADHD Rating Scales. Sci Rep. (2020) 10:1–10. doi: 10.1038/s41598-020-75868-y
44. Orru G, Monaro M, Conversano C, Gemignani A, Sartori G. Machine learning in psychometrics and psychological research. Front Psychol. (2020) 10:2970. doi: 10.3389/fpsyg.2019.02970
45. Goh PK, Elkins AR, Bansal PS, Eng AG, Martel MM. Data-driven methods for predicting ADHD diagnosis and related impairment: the potential of a machine learning approach. Res Child Adolesc Psychopathol. (2023) 51:1–13. doi: 10.1007/s10802-023-01022-7
46. Baggio S, Hasler R, Giacomini V, El-Masri H, Weibel S, Perroud N, et al. Does the continuous performance test predict ADHD symptoms severity and ADHD presentation in adults? J Attention Disord. (2020) 24:840–8. doi: 10.1177/1087054718822060
47. Goh PK, Martel MM, Jones PJ, Bansal PS, Eng AG, Elkins AR, et al. Clarifying relations between ADHD and functional impairment in adulthood: Utilization of network and machine learning approaches. Assessment. (2023) 30:316–31. doi: 10.1177/10731911211050921
48. Parashar A, Kalra N, Singh J, Goyal RK. Machine learning based framework for classification of children with ADHD and healthy controls. Intelligent Automation And Soft Computing. (2021) 28:669–82. doi: 10.32604/iasc.2021.017478
49. Mukherjee P, Hartanto T, Iosif AM, Dixon JF, Hinshaw SP, Pakyurek M, et al. Neural basis of working memory in ADHD: Load versus complexity. NeuroImage: Clin. (2021). doi: 10.1016/j.nicl.2021.102662
50. Elliott BL, D’Ardenne K, Mukherjee P, Schweitzer JB, McClure SM. Limbic and executive meso-and nigrostriatal tracts predict impulsivity differences in attention-deficit/hyperactivity disorder. Biol Psychiatry: Cogn Neurosci Neuroimaging. (2022) 7:145–423. doi: 10.1016/j.bpsc.2021.05.002
51. Elahi H, Iosif AM, Mukherjee P, Hinshaw SP, Schweitzer JB. Using hot and cool measures to phenotype and predict functional outcomes across dimensions of ADHD and typical development in adolescents. Res Child Adolesc Psychopathol. (2023) 52:1–5. doi: 10.1007/s10802-023-01149-7
53. Shaffer D, Fisher P, Lucas CP, Dulcan MK, Schwab-Stone ME. NIMH Diagnostic Interview Schedule for Children Version IV (NIMH DISC-IV): Description, differences from previous versions, and reliability of some common diagnoses. J Am Acad Child Adolesc Psychiatry. (2000) 39:28–38. doi: 10.1097/00004583-200001000-00014
54. Sheehan DV, Sheehan KH, Shytle RD, Janavs J, Bannon Y, Rogers JE, et al. Reliability and validity of the mini international neuropsychiatric interview for children and adolescents (MINI-KID). J Clin Psychiatry. (2010) 71:17393. doi: 10.4088/JCP.09m05305whi
55. Sheehan DV, Lecrubier Y, Sheehan KH, Amorim P, Janavs J, Weiller E, et al. The Mini-International Neuropsychiatric Interview (MINI): the development and validation of a structured diagnostic psychiatric interview for DSM-IV and ICD-10. J Clin Psychiatry. (1998) 59:22–33.
56. Ramos-Quiroga JA, Nasillo V, Richarte V, Corrales M, Palma F, Ibáñez P, et al. Criteria and concurrent validity of DIVA 2.0: a semi-structured diagnostic interview for adult ADHD. J Attention Disord. (2019) 23:1126–35. doi: 10.1177/1087054716646451
58. Stringaris A, Goodman R, Ferdinando S, Razdan V, Muhrer E, Leibenluft E, et al. The Affective Reactivity Index: a concise irritability scale for clinical and research settings. J Child Psychol Psychiatry. (2012) 53:1109–17. doi: 10.1111/j.1469-7610.2012.02561.x
59. Petersen AC, Crockett L, Richards M, Boxer A. Pubertal development scale (PDS). (1988). doi: 10.1037/t06349-000
60. Rosseel Y. Lavaan: An R package for structural equation modeling. J Stat Software. (2012) 48:1–36. doi: 10.18637/jss.v048.i02
61. Lee T, Shi D. A comparison of full information maximum likelihood and multiple imputation in structural equation modeling with missing data. psychol Methods. (2021) 26:466. doi: 10.1037/met0000381
62. Altman N, Krzywinski M. Ensemble methods: bagging and random forests. Nat Methods. (2017) 14:933–5. doi: 10.1038/nmeth.4438
63. Ali J, Khan R, Ahmad N, Maqsood I. Random forests and decision trees. Int J Comput Sci Issues (IJCSI). (2012) 9:272.
64. Pedregosa F, Varoquaux G, Gramfort A, Michel V, Thirion B, Grisel O, et al. Scikit-learn: machine learning in python. J Mach Learn Res. (2011) 12:2825–30.
65. Cross-validation. Seraj A, Mohammadi-Khanaposhtani M, Daneshfar R, Naseri M, Esmaeili M, Baghban A, et al. In Handbook of Hydroinformatics. Elsevier (2023) p. 89–105.
66. Karalunas SL, Gustafsson HC, Fair D, Musser ED, Nigg JT. Do we need an irritable subtype of ADHD? Replication and extension of a promising temperament profile approach to ADHD subtyping. Psychol Assess. (2019) 31:236. doi: 10.1037/pas0000664
67. Karalunas SL, Fair D, Musser ED, Aykes K, Iyer SP, Nigg JT. Subtyping attention-deficit/hyperactivity disorder using temperament dimensions: toward biologically based nosologic criteria. JAMA Psychiatry. (2014) 71:1015–24. doi: 10.1001/jamapsychiatry.2014.763
68. Johns-Mead R, Vijayakumar N, Mulraney M, Melvin G, Youssef G, Sciberras E, et al. Categorical and dimensional approaches to the developmental relationship between ADHD and irritability. J Child Psychol Psychiatry. (2023) 64:1422–31. doi: 10.1111/jcpp.13818
69. Gröndal M, Ask K, Winblad S. The distinction between irritability and anger and their associations with impulsivity and subjective wellbeing. Sci Rep. (2023) 13:10398. doi: 10.1038/s41598-023-37557-4
70. Stanford MS, Greve KW, Dickens TJ Jr. Irritability and impulsiveness: Relationship to self-reported impulsive aggression. Pers Individ Dif. (1995) 19:757–60. doi: 10.1016/0191-8869(95)00144-U
71. Junghänel M, Thoene AK, Ginsberg C, Goertz-Dorten A, Frenk F, Muecke K, et al. Irritability and emotional impulsivity as core feature of ADHD and ODD in children. J Psychopathol Behav Assess. (2022) 44:679–97. doi: 10.1007/s10862-022-09974-8
72. Bunford N, Evans WE, Langberg JM. Emotion dysregulation is associated with social impairment among young adolescents with ADHD. J Attention Disord. (2018) 22:66–82. doi: 10.1177/1087054714527793
73. Brotman MA, Kircanski K, Stringaris A, Pine DS, Leibenluft E. Irritability in youths: A translational model. Am J Psychiatry. (2017) 174:520–32. doi: 10.1176/appi.ajp.2016.16070839
74. Antoniou E, Rigas N, Orovou E, Papatrechas A, Sarella A. ADHD symptoms in females of childhood, adolescent, reproductive and menopause period. Materia Socio-medica. (2021) 33:114. doi: 10.5455/msm.2021.33.114-118
75. Rutter M, Caspi A, Moffitt TE. Using sex differences in psychopathology to study causal mechanisms: unifying issues and research strategies. J Child Psychol Psychiatry. (2003) 44:1092–115. doi: 10.1111/jcpp.2003.44.issue-8
76. Phillips OR, Onopa AK, Hsu V, Ollila HM, Hillary RP, Hallmayer J, et al. Beyond a binary classification of sex: An examination of brain sex differentiation, psychopathology, and genotype. J Am Acad Child Adolesc Psychiatry. (2019) 58:787–98. doi: 10.1016/j.jaac.2018.09.425
77. Bellaert N, Morreale K, Tseng WL. Peer functioning difficulties may exacerbate symptoms of attention-deficit/hyperactivity disorder and irritability over time: a temporal network analysis. J Child Psychol Psychiatry. (2023). doi: 10.1111/jcpp.13911
78. Vance A, Winther J. Irritability, depressed mood, inattention and spatial working memory in children and adolescents with major depressive disorder with/without persistent depressive disorder. Child Psychiatry Hum Dev. (2021) 52:800–7. doi: 10.1007/s10578-020-01061-x
Keywords: ADHD, irritability, adolescents, young adults, symptom prediction, hierarchical clustering, machine learning, random forest
Citation: Komijani S, Ghosal D, Singh MK, Schweitzer JB and Mukherjee P (2025) A novel framework to predict ADHD symptoms using irritability in adolescents and young adults with and without ADHD. Front. Psychiatry 15:1467486. doi: 10.3389/fpsyt.2024.1467486
Received: 20 July 2024; Accepted: 27 December 2024;
Published: 12 February 2025.
Edited by:
Eduardo Fernández-Jiménez, Hospital Infantil La Paz, SpainReviewed by:
Dawn Jensen, Georgia State University, United StatesRosanna Breaux, Virginia Tech, United States
Copyright © 2025 Komijani, Ghosal, Singh, Schweitzer and Mukherjee. This is an open-access article distributed under the terms of the Creative Commons Attribution License (CC BY). The use, distribution or reproduction in other forums is permitted, provided the original author(s) and the copyright owner(s) are credited and that the original publication in this journal is cited, in accordance with accepted academic practice. No use, distribution or reproduction is permitted which does not comply with these terms.
*Correspondence: Saeedeh Komijani, c2tvbWlqYW5pQHVjZGF2aXMuZWR1