
95% of researchers rate our articles as excellent or good
Learn more about the work of our research integrity team to safeguard the quality of each article we publish.
Find out more
BRIEF RESEARCH REPORT article
Front. Psychiatry , 07 January 2025
Sec. Schizophrenia
Volume 15 - 2024 | https://doi.org/10.3389/fpsyt.2024.1456435
 Umit Haluk Yesilkaya1,2†Xi Chen1,3†Lauren Watford1
 Emma McCoy1Meltem Sen1Ilgin Genc1Fei Du1,3Dost Ongur1,3
 Cagri Yuksel1,3*
Background: Psychotic disorders are characterized by white matter (WM) abnormalities; however, their relationship with the various aspects of illness presentation remains unclear. Sleep disturbances are common in psychosis, and emerging evidence suggests that sleep plays a critical role in WM physiology. Therefore, it is plausible that sleep disturbances are associated with impaired WM integrity in these disorders. To test this hypothesis, we examined the association of self-reported sleep disturbances with WM transverse (T2) relaxation times in a cross-diagnostic sample of patients with psychosis.
Methods: A total of 28 patients with psychosis (11 schizophrenia spectrum disorders and 17 bipolar disorder with psychotic features) were included. Metabolite (N-acetyl aspartate, choline, and creatine) and water T2 relaxation times were measured in the anterior corona radiata at 4T. Sleep was evaluated using the Pittsburgh Sleep Quality Index (PSQI).
Results: PSQI total score showed a moderate to strong positive correlation with water T2 (r = 0.64, p< 0.001). Linear regressions showed that this association was independent of the overall severity of depressive, manic, or psychotic symptoms. In our exploratory analysis, sleep disturbance was correlated with free water percentage, suggesting that increased extracellular water may be a mechanism underlying the association of disturbed sleep and prolonged water T2 relaxation.
Conclusion: Our results highlight the connection between poor sleep and WM abnormalities in psychotic disorders. Future research using objective sleep measures and neuroimaging techniques suitable to probe free water is needed to further our insight into this relationship.
An expanding body of literature indicates disrupted white matter (WM) microstructure in schizophrenia (SZ) (1), including in medication-free first-episode (FE) patients (2) and unaffected relatives (3). Bipolar disorder (BD), which also frequently presents with psychosis (4), exhibits similar WM abnormalities (5, 6). The majority of evidence for WM pathology is derived from diffusion tensor imaging (DTI) studies, and the most commonly reported measure, fractional anisotropy (FA), does not provide information about the specific biological components affected (7). Nonetheless, additional lines of evidence, including other DTI measures, novel imaging techniques, and post-mortem and genetic studies, suggest alterations in several aspects of WM microstructure, including axon, myelin, and extracellular water (1, 8–10). However, the link between WM abnormalities and illness presentation in psychotic disorders is not clear, as attempts to identify symptom correlates have largely been unfruitful.
Recent evidence suggests that sleep disturbances are associated with disrupted WM microstructure. In healthy individuals, poor sleep was associated with altered FA and other diffusivity measures in the whole brain and specific WM tracts (11–19), and sleep deprivation was associated with widespread alterations in WM microstructure (20, 21). In addition, in primary insomnia disorder, FA was reduced in the internal capsule (22, 23), thalamus–pars triangularis tracts (24), and several regions, including the internal capsule, corona radiata, longitudinal fasciculus, and corpus callosum (25).
Sleep disturbances are highly prevalent in psychotic disorders and are present even when patients are clinically stable or in the euthymic state (26, 27). However, despite the accumulating evidence indicating a role for sleep in WM physiology, little is known about the link between sleep disturbances and the WM disruptions observed in these disorders. To the best of our knowledge, there are no studies in SZ that examined this relationship. In a recent study in individuals at ultrahigh risk for psychosis, poor sleep was associated with lower FA in the corpus callosum, and both increased and decreased FA in the ventral brain regions (28). In BD, lower objective and self-reported sleep duration correlated with reduced FA and increased radial diffusivity (RD) in multiple WM tracts (Benedetti et al., 2017). In contrast, in another study, poor sleep (reduced sleep duration and more sleep inertia) was associated with higher FA in several WM tracts (Verkooijen et al., 2017).
Transverse relaxation time (T2) refers to the duration required for the decay of magnetization in the transverse plane. It reflects the spin–spin interactions and is affected by the homogeneity of the molecular environment and molecular motion. It is longer when nuclei are in free motion and in an environment where interaction with other types of magnetic nuclei is relatively limited, such as in cerebrospinal fluid (29). T2 can be measured for water and intracellular metabolites such as N-acetyl aspartate (NAA), choline (Cho), and creatine (Cr). Water T2 can provide information on WM macromolecule structure and fluid homeostasis, while the metabolite relaxation times reflect the intra-axonal milieu. In a previous study, we observed increased water T2 as well as a reduced NAA T2 in chronic SZ compared to controls (30), suggesting an impoverishment of WM macromolecule structures and abnormal intra-axonal milieu and volume. Prolonged WM water T2 in SZ has also been reported in previous studies (31–33). We also observed that NAA T2 is significantly reduced in the chronic psychosis compared to FE subjects, suggesting that apparent NAA concentration reductions reported in psychotic disorders may indeed reflect shortened T2 and not lower NAA tissue concentration (34). More recently, in a longitudinal study in FE psychosis, we observed a significant reduction of NAA in the second year of the follow-up compared to baseline, while the water T2 showed a trend of increase (35).
Given this background, we hypothesized that sleep disturbances would be associated with altered WM T2 in psychosis. To test this hypothesis, we examined the link between self-reported sleep quality and WM water and metabolite T2 in a cross-diagnostic sample of patients with psychotic disorders [SZ spectrum disorders (SSD) and BD with psychotic features (BDP)]. Sleep supports neuronal integrity and neuroplasticity, as well as myelin physiology and brain fluid homeostasis. Therefore, we hypothesized that poor sleep quality would be associated with alterations in both metabolite and water T2.
This is a secondary analysis of data obtained in two studies performed at McLean Hospital, which acquired T2 data with identical protocols on the same magnetic resonance imaging (MRI) scanner. One of these studies was a longitudinal neuroimaging study in FE psychosis. The other study was a multimodal neuroimaging, genetic, and metabolic study in SZ and BD. Patients were recruited from the inpatient and outpatient services at McLean Hospital. Participants with any uncontrolled medical disorders, intellectual disability, neurological sequela, history of head trauma with loss of consciousness, and contraindication to MRI were excluded. The studies were approved by McLean Hospital and Mass General Brigham institutional review boards, and all participants provided written informed consent. The study procedures adhered to the principles outlined in the Declaration of Helsinki. A total of 28 patients (17 BDP and 11 SSD) provided information about sleep quality within 1 month of their scan (average interval 11.4 ± 10.6 days) and were included in this study. The SSD group consisted of nine individuals with schizoaffective disorder (SZA) and two individuals with psychotic disorders, not otherwise specified (Psy-NOS). The sample consisted of predominantly early-course patients, with 80.8% of the patients within the first 3 years of illness onset. Demographic and clinical information in this sample is displayed in Table 1.
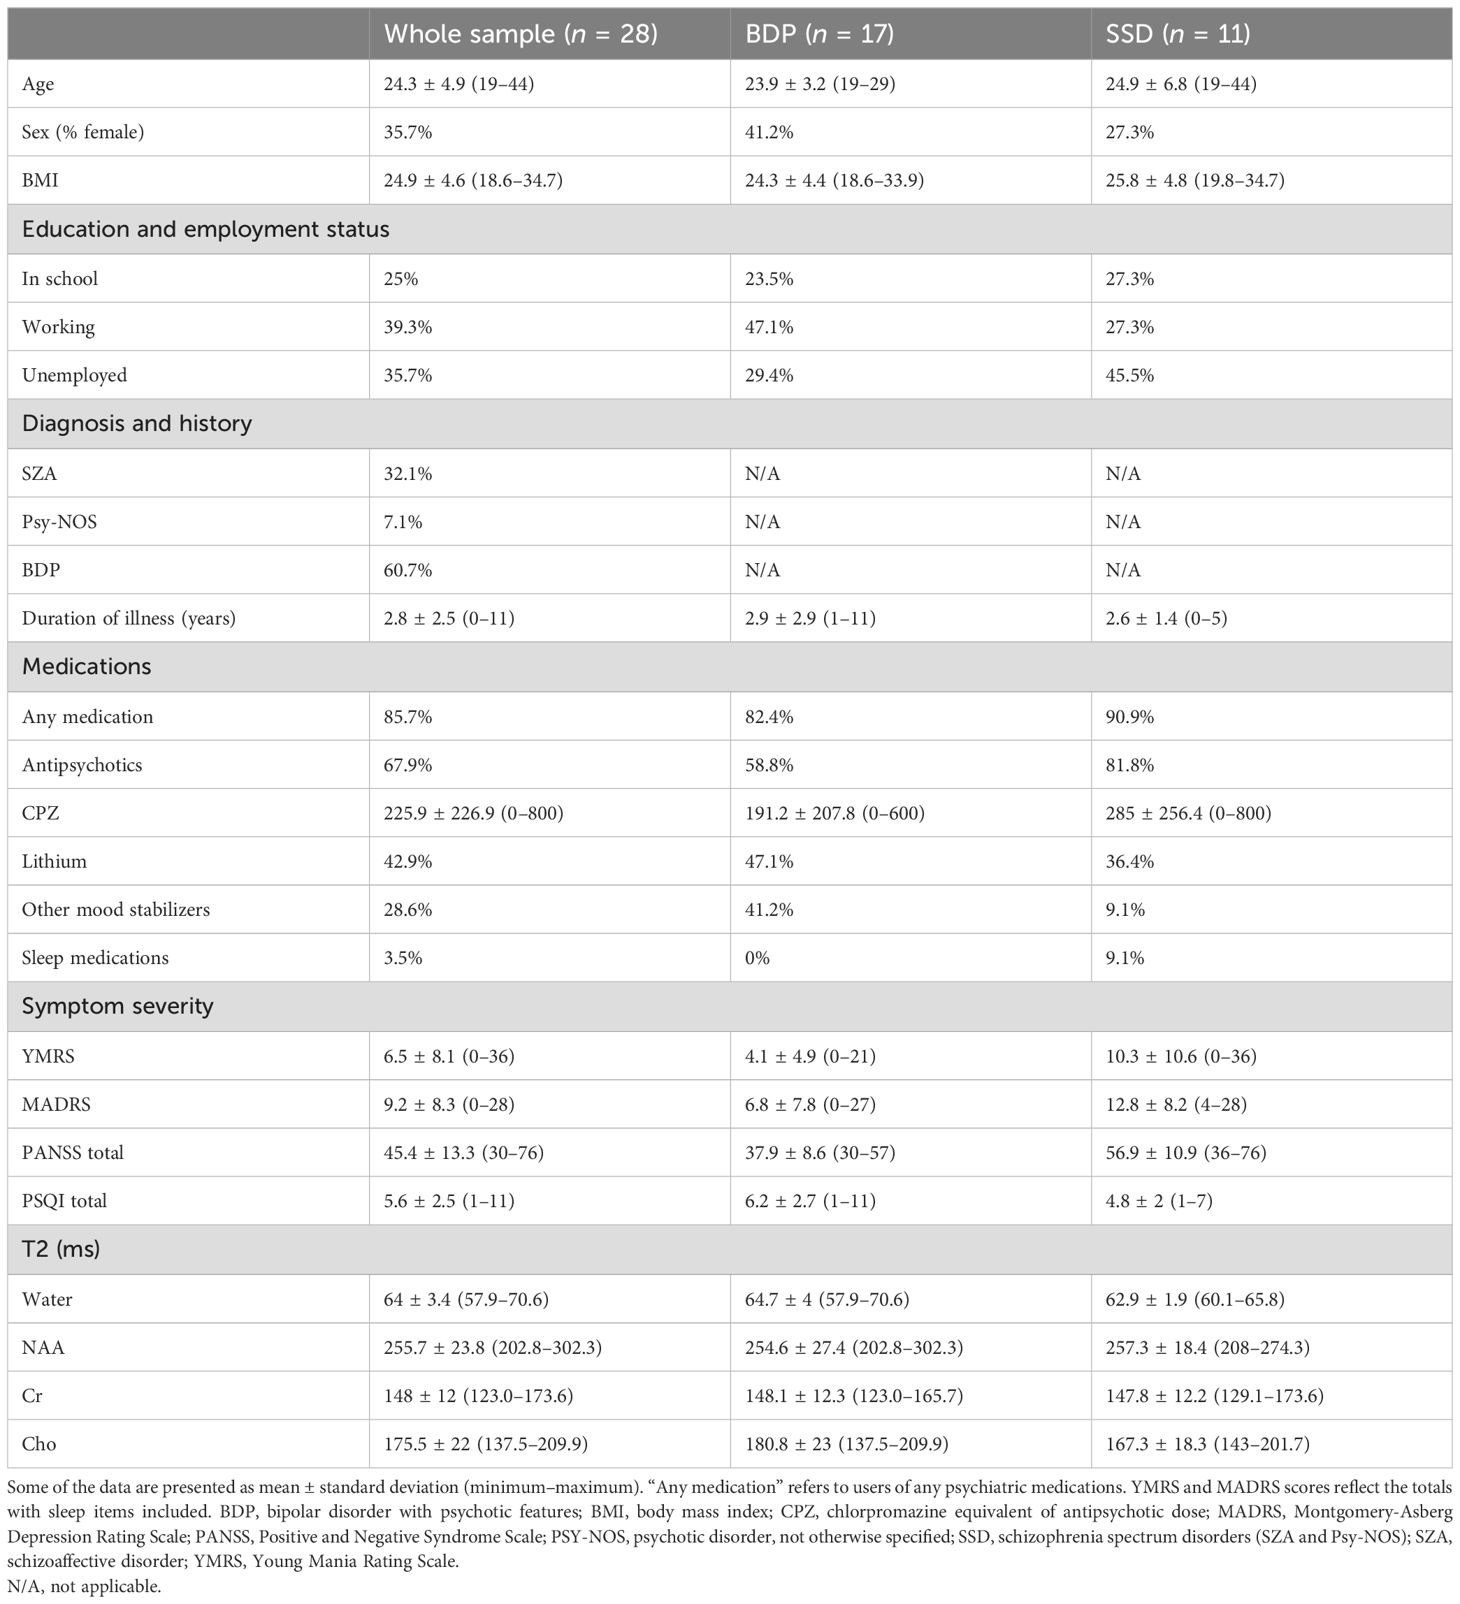
Table 1. Clinical and demographic variables and T2 measures in the sample.
Sleep was assessed using the Pittsburgh Sleep Quality Index (PSQI) (36), a self-report questionnaire that probes the sleep quality and disturbances over a 1-month period. The composite score, PSQI total score, was used in all analyses. A higher PSQI total score reflected poorer sleep. Diagnoses were ascertained using the Structured Clinical Interview for DSM-IV (SCID). In addition to PSQI, the severity of psychotic, manic, and depressive symptoms was assessed using the Positive and Negative Syndrome Scale (PANSS), the Young Mania Rating Scale (YMRS), and the Montgomery-Asberg Depression Rating Scale (MADRS). Antipsychotic load was calculated as the total chlorpromazine equivalent dose (CPZ) (37).
T2 relaxation time measurements were conducted on a 4T Varian full-body MR scanner (Unity/Inova; Varian NMR Instruments, CA, USA) using a 16-rung, single-tuned, volumetric birdcage coil. Global shimming was performed, followed by the acquisition of high-contrast T1-weighted sagittal images, which served to position the axial images and MRS voxels. A 1 × 3 × 3 cm3 single MRS voxel (Figure 1) was then placed on the corona radiata, centered at the level of the genu of the corpus callosum but lateral to it (i.e., it does not include any callosal fibers). Anterior corona radiata was chosen because previous studies reported altered T2 relaxation in the prefrontal cortex (PFC) in SZ (Williamson et al., 1992), and this particular region allowed the placement of a large enough WM voxel—underlying the PFC—that ensured a high signal-to-noise ratio. The voxel was placed in pure WM with adjacent gray matter in the anterior and lateral directions used as anchors to ensure that the location was consistent across scans. SPM12 was used for tissue segmentation on the T1. The MRS voxel tissue percentages were calculated using AFNI, and the voxel was consistently positioned in WM mostly (88% ± 4% of WM percentage). Localized shimming was performed to ensure water linewidths< 15 Hz.
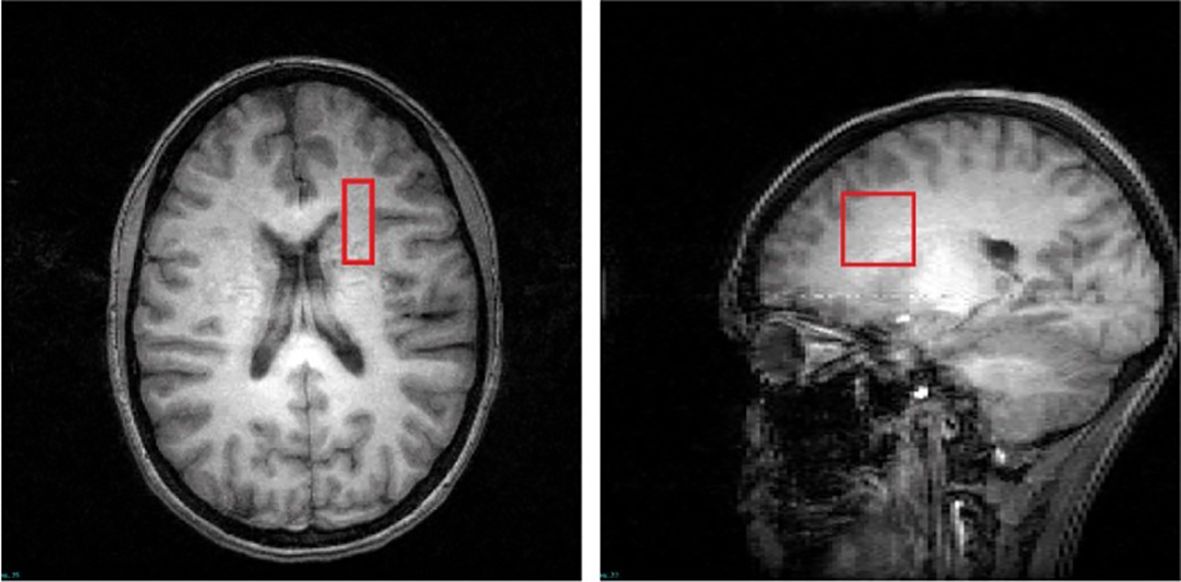
Figure 1. T1-weighted images in the transverse and sagittal planes depict the voxel placement.
Water and metabolite (NAA, Cr, and Cho) T2 spectra were obtained using a PRESS sequence modified with four varying TEs (30, 90, 120, and 200 ms) and TR = 3,000 ms; 48 repetitions for metabolite and 8 repetitions for water T2 relaxation time measurements. A 3-ms sinc pulse with a bandwidth of 2,000 Hz was used for excitation; two 6-ms Varian optc4 (Optimized Control Pulse for 4 zero sinc pulse) pulses with a bandwidth of 1,050 Hz were used for refocusing.
We measured magnetizations M(t) of water and each metabolite with t = 30, 90, 120, and 200 ms and fitted their T2s using the mono-exponential fitting function:
We further performed a bi-exponential fitting for water T2 relaxometry to investigate the water compartments, as we found that the mono-exponential fitting may not fully account for water T2 decay (Supplementary Figure S1). The bi-exponential fitting function is:
where T2_fast (<80 ms) reflects intra- and extracellular water relaxation, while T2_slow (>120 ms) can be considered as free water relaxation. The free water percentage (FW%) can also be calculated: FW% = Mslow/(Mslow+Mfast).
Statistical analyses were performed using IBM SPSS Statistics Version 26. Pearson or Spearman’s rank correlation were used to examine the correlations between sleep disturbance and T2 relaxation, depending on the distribution (normal vs. non-normal) and the type of (continuous vs. ordinal) data.
Linear regressions were used to test the associations of PSQI total score with neuroimaging measures of interest adjusted for demographic and clinical variables. Partial regression plots and a plot of studentized residuals against the predicted values indicated that assumptions of linear relationship were met. A histogram and a P–P plot of standardized residuals showed a normal distribution. Variance inflation factors (VIFs) indicated that no confounding multicollinearity was present.
All analyses were two-tailed. The significance level for hypothesis testing (α) was set at 0.05. For exploratory analyses, the Benjamini–Hochberg procedure was used to correct for multiple comparisons with the threshold for false discovery rate (FDR) at 0.05, and adjusted p-values are presented.
In the whole patient sample, the average PSQI total score was 5.64, above the cutoff value of 5, which indicates “poor sleep” (36). PSQI total score was positively correlated with water T2 (r = 0.64, p = 10-4 × 2; Figure 2). There were no other significant correlations with the PSQI total score and any of the metabolite T2 values in the whole sample (all p > 0.5). Among the PSQI component scores (36), water T2 was significantly correlated with sleep disturbance and latency (Spearman’s rho = 0.63, p< 0.001 and Spearman’s rho = 0.41, p = 0.029, respectively).
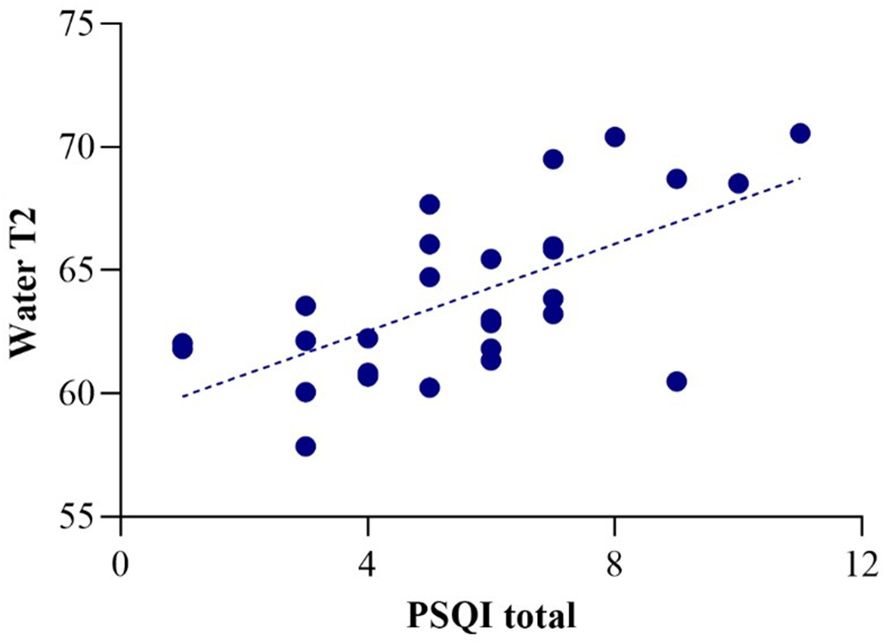
Figure 2. Correlation of water T2 with PSQI total score (r = 0.64).
There were no differences in any sociodemographic (age and sex) and clinical (BMI, duration of illness, antipsychotic dose, and symptom scale scores) variables between SSD and BDP, except higher PANSS total and YMRS scores in SSD [t(26) = 5.14, p< 0.001 and t(26) = 2.09, p = 0.047, respectively]. PSQI total and component scores, as well as water and metabolite T2 values, were also not different between these groups (all p > 0.05). SSD and BDP displayed almost identical correlations between PSQI total and water T2 (r = 0.63, p = 0.046 and r = 0.63, p = 0.013).
We explored whether the association of sleep disturbance with water T2 was specific to this symptom dimension or simply a by-product of increased severity of manic, depressive, or psychotic symptoms. For this purpose, separate linear regressions were carried out with water T2 as the dependent variable, and with YMRS, MADRS, or PANSS total scores included as predictors in addition to the PSQI total score. Sleep item scores were subtracted from YMRS and MADRS total scores to isolate the contribution of sleep disturbance by PSQI total score. Age and sex were also included as additional covariates in all analyses. These analyses showed that sleep disturbance (PSQI total score) remained a significant predictor of water T2 in the whole sample, independent of manic, depressive, or psychotic symptom severity (β = 0.62, p = 0.004, β = 0.62, p = 0.005, and β = 0.62, p = 0.008, respectively).
We also explored whether the association of sleep disturbance with water T2 was independent of duration of illness and antipsychotic dose. Separate linear regressions with water T2 as the dependent variable included duration of illness or CPZ as predictors in addition to PSQI total score. Age and sex were included as additional covariates. These analyses also showed that PSQI total remained a significant predictor of water T2 in the whole sample, independent of duration of illness and antipsychotic dose (β = 0.38, p = 0.043 and β = 0.63, p = 0.005, respectively).
In further exploratory analysis, we found that the mono-exponential fitting quality was inversely correlated with PSQI total score (spearman’s rho = −0.52, p = 0.009). The association between mono-exponential fitting quality and PSQI score implies that additional compartments of water may affect the mono-exponential fitting quality and thus could be a biomarker of WM integrity related to sleep quality. Therefore, we performed analyses with bi-exponential fitting for T2 decay, and found that PSQI total score was positively correlated with FW% (spearman’s rho = 0.42, p = 0.032) (Supplementary Figure S2) but not with T2_fast (r = 0.08, p = 0.666), suggesting that increased free water may be a potential mechanism underlying the association of poor sleep with prolonged water T2.
In this study, we examined the association of sleep quality with prefrontal WM water and metabolite T2 in patients with BDP and SSD. Supporting our hypothesis, we found that self-reported poor sleep was associated with prolonged water T2. This association was independent of the severity of other manic, depressive, or psychotic symptoms and other clinical factors including duration of illness and antipsychotic medication dose.
Water T2 reflects the interaction of water with nonaqueous molecules in its microenvironment and is prolonged in conditions where the frequency of these interactions is reduced due to the relative expansion of the water component (38). Prolonged WM water T2 has been reported in SZ (30, 33, 39), with suggestions that such findings may arise from disruptions in myelin integrity, reduced axon size, or increased interstitial fluid. If altered water T2 in SZ indeed originates from myelin abnormalities, the correlation of poor sleep with longer water T2 in our sample would be consistent with the expanding literature, which indicates that sleep influences oligodendrocyte function, expression of numerous genes related to membrane metabolism and myelination, and sleep deprivation leads to myelin disruption (reviewed in 40). Furthermore, sleep is crucial for neuronal homeostasis and neuroplasticity (41–43), with poor sleep linked to reduced gray matter in the PFC (44–49), a region where the anterior corona radiata fibers project to. In addition, abnormal sleep and experimental sleep deprivation lead to impairments in executive functions, which are mediated by the PFC (45, 48–50) and are associated with the corona radiata microstructure (51, 52). Consequently, it is plausible that sleep disruption-related neuronal alterations in the PFC are accompanied by reduced axon size in the corona radiata, thereby manifesting as a relative expansion of the water component. However, the lack of correlation between sleep disturbance and metabolite T2 in our sample argues against this possibility, as a decrease in axon size would be expected to prolong the T2 relaxation for intracellular metabolites.
The positive correlation of FW% with PSQI total score suggests that increased FW due to poor sleep is another potential mechanism, which would be consistent with a recent study (19), although our cross-sectional study cannot provide information about any causal relationship. An increase in FW has been documented in the early course SZ patients (53–58) and in individuals at clinical high risk for psychosis (59), and has been shown to be inversely correlated with the duration of illness (58). Our sample consisted predominantly of early-course patients, which also supports this possibility. Other than free water imaging based on DTI (60, 61), multi-exponential T2 relaxometry has been a potentially useful technique for characterizing the tissue water compartments (62, 63). The compartment with the shortest T2 (10–20 ms) is usually regarded as myelin water (64, 65), and it can hardly be detected with the current T2 spectroscopy protocol as our shortest TE is 30 ms. The main water compartment observed by the current study is T2 = 40–80 ms, which is mainly contributed by intra- and extracellular water (66). The T2 values we obtained from the mono-exponential fitting mostly reflected the T2 decay of this compartment. Another water compartment observed by the bi-exponential fitting is with T2 > 120 ms and is usually regarded as free water (66, 67). It has a much lower fraction compared to intra- and extracellular water, while it brings long tails to the T2 decay curves (68) and deviations from the mono-exponential fitting. It should be noted that the T2s of this compartment (T2_slow) in the current study are<400 ms and thus are not contributed by CSF, which has a very long T2 from 800 to 3,000 ms and minimal tissue percentages of the MRS voxel in the current study (0.1% ± 0.1%). Neuroinflammation has been proposed as a potential mechanism that leads to increased FW in SZ (58), and consistent with this hypothesis, previous investigations showed that increased peripheral levels of pro-inflammatory cytokines in SZ are associated with the expansion of the FW compartment (69–71). Notably, there is substantial evidence indicating that sleep disturbance and duration are linked to systemic inflammation (72, 73). Finally, recent evidence suggests that brain fluid dynamics are tightly linked to sleep–wake states, with increased cerebrospinal fluid (CSF) influx and significant augmentation of interstitial fluid observed during sleep (74). Although this burgeoning area of research has not been explored in SZ or BD, it is conceivable that abnormal CSF or glymphatic system dynamics due to poor sleep contribute to the observed increase in FW. Given the cross-sectional design of our study, we cannot speculate on the causal directionality of these potential mechanisms.
Our study had several limitations. First, given the constraints on experiment time, we have acquired signals of only four different TEs to measure T2. With limited data points, the exploratory bi-exponential analysis could be subject to inaccuracy and is not able to address the contribution from the ultra-short T2 components such as myelin. On the other hand, we acquired the full FID signal of each TE from a well-shimmed MRS voxel instead of just a few signal points using fast multi-echo imaging to achieve better signal reliability. The Carr–Purcell–Meiboom–Gill (CPMG) method used in multi-echo imaging is also sensitive to inhomogeneous B1 (RF) and B0 (static) fields (65, 67). Despite the limited number of TEs, our bi-exponential fitting showed significant improvement compared to mono-exponential fitting (Supplementary Figure S1). Nonetheless, given this limitation, the correlation of poor sleep with FW% should be treated as a preliminary finding offering potential guidance for future investigations exploring this relationship using suitable neuroimaging techniques. Second, because of the relatively small sample size and to avoid inflating the error rate, we could not take into account other potential factors that could affect WM T2, such as body mass index. However, in previous studies (30, 35), we did not find any association of WM water T2 with demographic or clinical factors except for sex, which is already controlled for in the regressions. Third, we did not have any objective sleep data. Therefore, we could not explore the convergence with the self-reported sleep disturbances. Finally, while all the participants were psychotic, our sample consisted mostly of patients with affective symptoms (SZA and BD). Therefore, future studies should investigate if similar associations are present in “non-affective” psychosis.
In this study, our aim was to investigate the association between sleep disturbances and WM characteristics in individuals with psychotic disorders. To this end, we deliberately adopted a cross-diagnostic approach rather than restricting our analyses to a single diagnosis, given the substantial overlap in clinical presentations, neurobiology, and genetic backgrounds between SSD and BD (75, 76). This methodology aligns with previous research by our group (34, 35, 77–83) and others (53, 84–87), and it enhances the generalizability of our findings across psychotic disorders. Importantly, there is currently no evidence suggesting distinct patterns in the association between sleep disturbances and WM biology among these disorders. Indeed, despite small sample sizes, we observed an identical correlation between PSQI total scores and water T2 relaxation rates in both diagnostic groups (Pearson’s r = 0.63; see Results). Given the limited research on this topic, our study provides a starting point for future investigations with larger samples that can explore potential differences among specific diagnoses. Sleep disturbances in psychotic disorders can be illness-related as well as due to educational and occupational demands. The association between sleep disturbances and prolonged T2 relaxation times may not be exclusive to psychotic disorders but can also be observed in other conditions characterized by WM abnormalities. Undiagnosed sleep apnea may have contributed to the association we observed between sleep disruption and water T2 relaxation times (88). Studies employing polysomnography can probe the contribution of this factor.
In conclusion, our findings suggest that poor sleep quality is associated with WM abnormalities in patients with psychotic disorders. Increased free water, possibly due to neuroinflammation, is a possible mechanism underlying this association. Future studies should include additional objective sleep measures and specialized neuroimaging techniques that probe the free water component in the WM.
Study protocols used to generate the data restrict sharing them with outside parties. Requests to access the datasets should be directed to YXl1a3NlbEBtZ2Iub3Jn.
The studies involving humans were approved by McLean Hospital Institutional Review Board and Mass General Brigham Institutional Review Board. The studies were conducted in accordance with the local legislation and institutional requirements. The participants provided their written informed consent to participate in this study.
UY: Writing – original draft, Formal analysis. XC: Data curation, Formal analysis, Methodology, Writing – original draft, Investigation, Project administration, Visualization. LW: Project administration, Writing – review & editing, Data curation. EM: Project administration, Writing – review & editing, Data curation. MS: Data curation, Formal analysis, Writing – review & editing. IG: Project administration, Writing – review & editing, Data curation. FD: Data curation, Formal analysis, Methodology, Writing – review & editing. DO: Methodology, Resources, Supervision, Writing – review & editing. CY: Conceptualization, Data curation, Formal analysis, Investigation, Methodology, Supervision, Writing – original draft.
The author(s) declare financial support was received for the research, authorship, and/or publication of this article. This project was supported by the National Institute of Mental Health K23MH119322 to CY.
The authors declare that the research was conducted in the absence of any commercial or financial relationships that could be construed as a potential conflict of interest.
All claims expressed in this article are solely those of the authors and do not necessarily represent those of their affiliated organizations, or those of the publisher, the editors and the reviewers. Any product that may be evaluated in this article, or claim that may be made by its manufacturer, is not guaranteed or endorsed by the publisher.
The Supplementary Material for this article can be found online at: https://www.frontiersin.org/articles/10.3389/fpsyt.2024.1456435/full#supplementary-material
1. Kubicki M, Shenton ME. Diffusion tensor imaging findings and their implications in schizophrenia. Curr Opin Psychiatry. (2014) 27:179–84. doi: 10.1097/YCO.0000000000000053
2. Henze R, Brunner R, Thiemann U, Parzer P, Klein J, Resch F, et al. White matter alterations in the corpus callosum of adolescents with first-admission schizophrenia. Neurosci Lett. (2012) 513:178–82. doi: 10.1016/j.neulet.2012.02.032
3. Xu M, Zhang W, Hochwalt P, Yang C, Liu N, Qu J, et al. Structural connectivity associated with familial risk for mental illness: A meta-analysis of diffusion tensor imaging studies in relatives of patients with severe mental disorders. Hum Brain Mapp. (2022) 43:2936–50. doi: 10.1002/hbm.25827
4. Aminoff SR, Onyeka IN, Odegaard M, Simonsen C, Lagerberg TV, Andreassen OA, et al. Lifetime and point prevalence of psychotic symptoms in adults with bipolar disorders: A systematic review and meta-analysis. Psychol Med. (2022) 52:2413–25. doi: 10.1017/S003329172200201X
5. Ching CRK, Hibar DP, Gurholt TP, Nunes A, Thomopoulos SI, Abe C, et al. What we learn about bipolar disorder from large-scale neuroimaging: findings and future directions from the enigma bipolar disorder working group. Hum Brain Mapp. (2022) 43:56–82. doi: 10.1002/hbm.25098
6. Lu LH, Zhou XJ, Keedy SK, Reilly JL, Sweeney JA. White matter microstructure in untreated first episode bipolar disorder with psychosis: comparison with schizophrenia. Bipolar Disord. (2011) 13:604–13. doi: 10.1111/j.1399-5618.2011.00958.x
7. Assaf Y, Pasternak O. Diffusion tensor imaging (Dti)-based white matter mapping in brain research: A review. J Mol Neurosci. (2008) 34:51–61. doi: 10.1007/s12031-007-0029-0
8. Carreira Figueiredo I, Borgan F, Pasternak O, Turkheimer FE, Howes OD. White-matter free-water diffusion mri in schizophrenia: A systematic review and meta-analysis. Neuropsychopharmacology. (2022) 47:1413–20. doi: 10.1038/s41386-022-01272-x
9. Valdes-Tovar M, Rodriguez-Ramirez AM, Rodriguez-Cardenas L, Sotelo-Ramirez CE, Camarena B, Sanabrais-Jimenez MA, et al. Insights into myelin dysfunction in schizophrenia and bipolar disorder. World J Psychiatry. (2022) 12:264–85. doi: 10.5498/wjp.v12.i2.264
10. Ji E, Lejuste F, Sarrazin S, Houenou J. From the microscope to the magnet: disconnection in schizophrenia and bipolar disorder. Neurosci Biobehav Rev. (2019) 98:47–57. doi: 10.1016/j.neubiorev.2019.01.005
11. Jamieson D, Broadhouse KM, McLoughlin LT, Schwenn P, Parker MJ, Lagopoulos J, et al. Investigating the association between sleep quality and diffusion-derived structural integrity of white matter in early adolescence. J Adolesc. (2020) 83:12–21. doi: 10.1016/j.adolescence.2020.06.008
12. Sexton CE, Zsoldos E, Filippini N, Griffanti L, Winkler A, Mahmood A, et al. Associations between self-reported sleep quality and white matter in community-dwelling older adults: A prospective cohort study. Hum Brain Mapp. (2017) 38:5465–73. doi: 10.1002/hbm.23739
13. Grumbach P, Opel N, Martin S, Meinert S, Leehr EJ, Redlich R, et al. Sleep duration is associated with white matter microstructure and cognitive performance in healthy adults. Hum Brain Mapp. (2020) 41:4397–405. doi: 10.1002/hbm.25132
14. Khalsa S, Hale JR, Goldstone A, Wilson RS, Mayhew SD, Bagary M, et al. Habitual sleep durations and subjective sleep quality predict white matter differences in the human brain. Neurobiol Sleep Circadian Rhythms. (2017) 3:17–25. doi: 10.1016/j.nbscr.2017.03.001
15. Takeuchi H, Taki Y, Nouchi R, Yokoyama R, Kotozaki Y, Nakagawa S, et al. Shorter sleep duration and better sleep quality are associated with greater tissue density in the brain. Sci Rep. (2018) 8:5833. doi: 10.1038/s41598-018-24226-0
16. Yaffe K, Nasrallah I, Hoang TD, Lauderdale DS, Knutson KL, Carnethon MR, et al. Sleep duration and white matter quality in middle-aged adults. Sleep. (2016) 39:1743–7. doi: 10.5665/sleep.6104
17. Kocevska D, Tiemeier H, Lysen TS, de Groot M, Muetzel RL, Van Someren EJW, et al. The prospective association of objectively measured sleep and cerebral white matter microstructure in middle-aged and older persons. Sleep. (2019) 42. doi: 10.1093/sleep/zsz140
18. Kocevska D, Cremers LGM, Lysen TS, Luik AI, Ikram MA, Vernooij MW, et al. Sleep complaints and cerebral white matter: A prospective bidirectional study. J Psychiatr Res. (2019) 112:77–82. doi: 10.1016/j.jpsychires.2019.02.002
19. Tsiknia AA, Parada H Jr., Banks SJ, Reas ET. Sleep quality and sleep duration predict brain microstructure among community-dwelling older adults. Neurobiol Aging. (2023) 125:90–7. doi: 10.1016/j.neurobiolaging.2023.02.001
20. Voldsbekk I, Groote I, Zak N, Roelfs D, Geier O, Due-Tonnessen P, et al. Sleep and sleep deprivation differentially alter white matter microstructure: A mixed model design utilising advanced diffusion modelling. Neuroimage. (2021) 226:117540. doi: 10.1016/j.neuroimage.2020.117540
21. Elvsashagen T, Norbom LB, Pedersen PO, Quraishi SH, Bjornerud A, Malt UF, et al. Widespread changes in white matter microstructure after a day of waking and sleep deprivation. PloS One. (2015) 10:e0127351. doi: 10.1371/journal.pone.0127351
22. Spiegelhalder K, Regen W, Prem M, Baglioni C, Nissen C, Feige B, et al. Reduced anterior internal capsule white matter integrity in primary insomnia. Hum Brain Mapp. (2014) 35:3431–8. doi: 10.1002/hbm.22412
23. Bresser T, Foster-Dingley JC, Wassing R, Leerssen J, Ramautar JR, Stoffers D, et al. Consistent altered internal capsule white matter microstructure in insomnia disorder. Sleep. (2020) 43. doi: 10.1093/sleep/zsaa031
24. Kang JMK, Joo SWJ, Son YDS, Kim HK, Ko KPK, Lee JSL, et al. Low white-matter integrity between the left thalamus and inferior frontal gyrus in patients with insomnia disorder. J Psychiatry Neurosci. (2018) 43:366–74. doi: 10.1503/jpn.170195
25. Li S, Tian J, Bauer A, Huang R, Wen H, Li M, et al. Reduced integrity of right lateralized white matter in patients with primary insomnia: A diffusion-tensor imaging study. Radiology. (2016) 280:520–8. doi: 10.1148/radiol.2016152038
26. Benson KL. Sleep in schizophrenia: pathology and treatment. Sleep Med Clin. (2015) 10:49–55. doi: 10.1016/j.jsmc.2014.11.001
27. Harvey AG, Talbot LS, Gershon A. Sleep disturbance in bipolar disorder across the lifespan. Clin Psychol (New York). (2009) 16:256–77. doi: 10.1111/j.1468-2850.2009.01164.x
28. Rasmussen JO, Nordholm D, Glenthoj LB, Jensen MA, Garde AH, Ragahava JM, et al. White matter microstructure and sleep-wake disturbances in individuals at ultra-high risk of psychosis. Front Hum Neurosci. (2022) 16:1029149. doi: 10.3389/fnhum.2022.1029149
29. de Graaf RA. In Vivo Nmr Spectroscopy: Principles and Techniques. John Wiley & Sons, Ltd (2007).
30. Du F, Cooper A, Cohen BM, Renshaw PF, Ongur D. Water and metabolite transverse T2 relaxation time abnormalities in the white matter in schizophrenia. Schizophr Res. (2012) 137:241–5. doi: 10.1016/j.schres.2012.01.026
31. Aydin K, Ucok A, Guler J. Altered Metabolic Integrity of Corpus Callosum among Individuals at Ultra High Risk of Schizophrenia and First-Episode Patients. Biol Psychiatry. (2008) 64:750–7. doi: 10.1016/j.biopsych.2008.04.007
32. Supprian T, Hofmann E, Warmuth-Metz M, Franzek E, Becker T. Mri T2 relaxation times of brain regions in schizophrenic patients and control subjects. Psychiatry Res. (1997) 75:173–82. doi: 10.1016/s0925-4927(97)00052-8
33. Williamson P, Pelz D, Merskey H, Morrison S, Karlik S, Drost D, et al. Frontal, temporal, and striatal proton relaxation times in schizophrenic patients and normal comparison subjects. Am J Psychiatry. (1992) 149:549–51. doi: 10.1176/ajp.149.4.549
34. Kuan E, Chen X, Du F, Ongur D. N-acetylaspartate concentration in psychotic disorders: T2-relaxation effects. Schizophr Res. (2021) 232:42–4. doi: 10.1016/j.schres.2021.04.012
35. Chen X, Fan X, Song X, Gardner M, Du F, Ongur D. White matter metabolite relaxation and diffusion abnormalities in first-episode psychosis: A longitudinal study. Schizophr Bull. (2022) 48:712–20. doi: 10.1093/schbul/sbab149
36. Buysse DJ, Reynolds CF 3rd, Monk TH, Berman SR, Kupfer DJ. The pittsburgh sleep quality index: A new instrument for psychiatric practice and research. Psychiatry Res. (1989) 28:193–213. doi: 10.1016/0165-1781(89)90047-4
37. Woods SW. Chlorpromazine equivalent doses for the newer atypical antipsychotics. J Clin Psychiatry. (2003) 64:663–7. doi: 10.4088/jcp.v64n0607
38. MacKay A, Laule C, Vavasour I, Bjarnason T, Kolind S, Madler B. Insights into brain microstructure from the T2 distribution. Magn Reson Imaging. (2006) 24:515–25. doi: 10.1016/j.mri.2005.12.037
39. Pfefferbaum A, Sullivan EV, Hedehus M, Moseley M, Lim KO. Brain gray and white matter transverse relaxation time in schizophrenia. Psychiatry Res. (1999) 91:93–100. doi: 10.1016/s0925-4927(99)00023-2
40. de Vivo L, Bellesi M. The role of sleep and wakefulness in myelin plasticity. Glia. (2019) 67:2142–52. doi: 10.1002/glia.23667
41. Tononi G, Cirelli C. Sleep and synaptic down-selection. Eur J Neurosci. (2020) 51:413–21. doi: 10.1111/ejn.14335
42. Vyazovskiy VV, Faraguna U. Sleep and synaptic homeostasis. Curr Top Behav Neurosci. (2015) 25:91–121. doi: 10.1007/7854_2014_301
43. Aalling NN, Nedergaard M, DiNuzzo M. Cerebral metabolic changes during sleep. Curr Neurol Neurosci Rep. (2018) 18:57. doi: 10.1007/s11910-018-0868-9
44. Altena E, Vrenken H, van der Werf YD, van den Heuvel OA, Van Someren EJ. Reduced orbitofrontal and parietal gray matter in chronic insomnia: A voxel-based morphometric study. Biol Psychiatry. (2010) 67:182–5. doi: 10.1016/j.biopsych.2009.08.003
45. Cabrera-Mino C, Roy B, Woo MA, Freeby MJ, Kumar R, Choi SE. Poor sleep quality linked to decreased brain gray matter density in adults with type 2 diabetes. Sleep Vigil. (2021) 5:289–97. doi: 10.1007/s41782-021-00170-4
46. Falgas N, Illan-Gala I, Allen IE, Mumford P, Essanaa YM, Le MM, et al. Specific cortical and subcortical grey matter regions are associated with insomnia severity. PloS One. (2021) 16:e0252076. doi: 10.1371/journal.pone.0252076
47. Grau-Rivera O, Operto G, Falcon C, Sanchez-Benavides G, Cacciaglia R, Brugulat-Serrat A, et al. Association between insomnia and cognitive performance, gray matter volume, and white matter microstructure in cognitively unimpaired adults. Alzheimers Res Ther. (2020) 12:4. doi: 10.1186/s13195-019-0547-3
48. Sexton CE, Storsve AB, Walhovd KB, Johansen-Berg H, Fjell AM. Poor sleep quality is associated with increased cortical atrophy in community-dwelling adults. Neurology. (2014) 83:967–73. doi: 10.1212/WNL.0000000000000774
49. Spira AP, Gonzalez CE, Venkatraman VK, Wu MN, Pacheco J, Simonsick EM, et al. Sleep duration and subsequent cortical thinning in cognitively normal older adults. Sleep. (2016) 39:1121–8. doi: 10.5665/sleep.5768
50. Tucker AM, Stern Y, Basner RC, Rakitin BC. The prefrontal model revisited: double dissociations between young sleep deprived and elderly subjects on cognitive components of performance. Sleep. (2011) 34:1039–50. doi: 10.5665/SLEEP.1158
51. Niogi S, Mukherjee P, Ghajar J, McCandliss BD. Individual differences in distinct components of attention are linked to anatomical variations in distinct white matter tracts. Front Neuroanat. (2010) 4:2.2010. doi: 10.3389/neuro.05.002.2010
52. Niogi SN, Mukherjee P, Ghajar J, Johnson CE, Kolster R, Lee H, et al. Structural dissociation of attentional control and memory in adults with and without mild traumatic brain injury. Brain. (2008) 131:3209–21. doi: 10.1093/brain/awn247
53. Guo JY, Lesh TA, Niendam TA, Ragland JD, Tully LM, Carter CS. Brain free water alterations in first-episode psychosis: A longitudinal analysis of diagnosis, course of illness, and medication effects. Psychol Med. (2021) 51:1001–10. doi: 10.1017/S0033291719003969
54. Berge D, Mane A, Lesh TA, Bioque M, Barcones F, Gonzalez-Pinto AM, et al. Elevated extracellular free-water in a multicentric first-episode psychosis sample, decrease during the first 2 years of illness. Schizophr Bull. (2020) 46:846–56. doi: 10.1093/schbul/sbz132
55. Seitz-Holland J, Nagele FL, Kubicki M, Pasternak O, Cho KIK, Hough M, et al. Shared and distinct white matter abnormalities in adolescent-onset schizophrenia and adolescent-onset psychotic bipolar disorder. Psychol Med. (2023) 53:4707–19. doi: 10.1017/S003329172200160X
56. Pasternak O, Westin CF, Bouix S, Seidman LJ, Goldstein JM, Woo TU, et al. Excessive extracellular volume reveals a neurodegenerative pattern in schizophrenia onset. J Neurosci. (2012) 32:17365–72. doi: 10.1523/JNEUROSCI.2904-12.2012
57. Lyall AE, Pasternak O, Robinson DG, Newell D, Trampush JW, Gallego JA, et al. Greater extracellular free-water in first-episode psychosis predicts better neurocognitive functioning. Mol Psychiatry. (2018) 23:701–7. doi: 10.1038/mp.2017.43
58. Cetin-Karayumak S, Lyall AE, Di Biase MA, Seitz-Holland J, Zhang F, Kelly S, et al. Characterization of the extracellular free water signal in schizophrenia using multi-site diffusion mri harmonization. Mol Psychiatry. (2023) 28:2030–8. doi: 10.1038/s41380-023-02068-1
59. Nagele FL, Pasternak O, Bitzan LV, Mussmann M, Rauh J, Kubicki M, et al. Cellular and Extracellular White Matter Alterations Indicate Conversion to Psychosis among Individuals at Clinical High-Risk for Psychosis. World J Biol Psychiatry. (2021) 22:214–27. doi: 10.1080/15622975.2020.1775890
60. Pasternak O, Sochen N, Gur Y, Intrator N, Assaf Y. Free water elimination and mapping from diffusion mri. Magnetic Resonance Med: Off J Soc Magnetic Resonance Med/Society Magnetic Resonance Med. (2009) 62:717–30. doi: 10.1002/mrm.22055
61. Westin CF, Knutsson H, Pasternak O, Szczepankiewicz F, Ozarslan E, van Westen D, et al. Q-space trajectory imaging for multidimensional diffusion mri of the human brain. Neuroimage. (2016) 135:345–62. doi: 10.1016/j.neuroimage.2016.02.039
62. Cole WC, LeBlanc AD, Jhingran SG. The origin of biexponential T2 relaxation in muscle water. Magnetic Resonance Med: Off J Soc Magnetic Resonance Med/Society Magnetic Resonance Med. (1993) 29:19–24. doi: 10.1002/mrm.1910290106
63. Armspach JP, Gounot D, Rumbach L, Chambron J. In vivo determination of multiexponential T2 relaxation in the brain of patients with multiple sclerosis. Magn Reson Imaging. (1991) 9:107–13. doi: 10.1016/0730-725x(91)90104-t
64. Oh J, Han ET, Pelletier D, Nelson SJ. Measurement of in vivo multi-component T2 relaxation times for brain tissue using multi-slice T2 prep at 1.5 and 3 T. Magn Reson Imaging. (2006) 24:33–43. doi: 10.1016/j.mri.2005.10.016
65. Does MD. Inferring brain tissue composition and microstructure via mr relaxometry. Neuroimage. (2018) 182:136–48. doi: 10.1016/j.neuroimage.2017.12.087
66. Canales-Rodriguez EJ, Alonso-Lana S, Verdolini N, Sarro S, Feria I, Montoro I, et al. Age- and gender-related differences in brain tissue microstructure revealed by multi-component T(2) relaxometry. Neurobiol Aging. (2021) 106:68–79. doi: 10.1016/j.neurobiolaging.2021.06.002
67. Alexander AL, Hurley SA, Samsonov AA, Adluru N, Hosseinbor AP, Mossahebi P, et al. Characterization of cerebral white matter properties using quantitative magnetic resonance imaging stains. Brain Connect. (2011) 1:423–46. doi: 10.1089/brain.2011.0071
68. Helms G, Piringer A. Magnetization transfer of water T(2) relaxation components in human brain: implications for T(2)-based segmentation of spectroscopic volumes. Magn Reson Imaging. (2001) 19:803–11. doi: 10.1016/s0730-725x(01)00396-4
69. Di Biase MA, Zalesky A, Cetin-Karayumak S, Rathi Y, Lv J, Boerrigter D, et al. Large-scale evidence for an association between peripheral inflammation and white matter free water in schizophrenia and healthy individuals. Schizophr Bull. (2021) 47:542–51. doi: 10.1093/schbul/sbaa134
70. Langhein M, Seitz-Holland J, Lyall AE, Pasternak O, Chunga N, Cetin-Karayumak S, et al. Association between Peripheral Inflammation and Free-Water Imaging in Major Depressive Disorder before and after Ketamine Treatment - a Pilot Study. J Affect Disord. (2022) 314:78–85. doi: 10.1016/j.jad.2022.06.043
71. Wu D, Wu Q, Li F, Wang Y, Zeng J, Tang B, et al. Free water alterations in different inflammatory subgroups in schizophrenia. Brain Behav Immun. (2024) 115:557–64. doi: 10.1016/j.bbi.2023.11.006
72. Irwin MR, Olmstead R, Carroll JE. Sleep disturbance, sleep duration, and inflammation: A systematic review and meta-analysis of cohort studies and experimental sleep deprivation. Biol Psychiatry. (2016) 80:40–52. doi: 10.1016/j.biopsych.2015.05.014
73. Irwin MR, Straub RH, Smith MT. Heat of the night: sleep disturbance activates inflammatory mechanisms and induces pain in rheumatoid arthritis. Nat Rev Rheumatol. (2023) 19:545–59. doi: 10.1038/s41584-023-00997-3
74. Chong PLH, Garic D, Shen MD, Lundgaard I, Schwichtenberg AJ. Sleep, cerebrospinal fluid, and the glymphatic system: A systematic review. Sleep Med Rev. (2022) 61:101572. doi: 10.1016/j.smrv.2021.101572
75. Fischer BA, Carpenter WT Jr. Will the kraepelinian dichotomy survive dsm-V? Neuropsychopharmacology. (2009) 34:2081–7. doi: 10.1038/npp.2009.32
76. Pearlson GD. Etiologic, phenomenologic, and endophenotypic overlap of schizophrenia and bipolar disorder. Annu Rev Clin Psychol. (2015) 11:251–81. doi: 10.1146/annurev-clinpsy-032814-112915
77. Yuksel C, Yilmaz S, Nesbit A, Carkaxhiu G, Ravichandran C, Salvatore P, et al. Demographic and clinical characteristics associated with a history of bizarre delusions in a cross-diagnostic sample of individuals with psychotic disorders. Asian J Psychiatr. (2018) 31:82–5. doi: 10.1016/j.ajp.2018.02.011
78. Shinn AK, Pfaff D, Young S, Lewandowski KE, Cohen BM, Ongur D. Auditory hallucinations in a cross-diagnostic sample of psychotic disorder patients: A descriptive, cross-sectional study. Compr Psychiatry. (2012) 53:718–26. doi: 10.1016/j.comppsych.2011.11.003
79. Stone LMD, Millman ZB, Ongur D, Shinn AK. The intersection between childhood trauma, the covid-19 pandemic, and trauma-related and psychotic symptoms in people with psychotic disorders. Schizophr Bull Open. (2021) 2:sgab050. doi: 10.1093/schizbullopen/sgab050
80. Yuksel C, Chen X, Chouinard VA, Nickerson LD, Gardner M, Cohen T, et al. Abnormal brain bioenergetics in first-episode psychosis. Schizophr Bull Open. (2021) 2:sgaa073. doi: 10.1093/schizbullopen/sgaa073
81. Murphy M, Ongur D. Thought disorder is correlated with atypical spoken binomial orderings. Schizophr (Heidelb). (2022) 8:25. doi: 10.1038/s41537-022-00238-8
82. Yuksel M, Murphy M, Rippe J, Leicht G, Ongur D. Decreased mismatch negativity and elevated frontal-lateral connectivity in first-episode psychosis. J Psychiatr Res. (2021) 144:37–44. doi: 10.1016/j.jpsychires.2021.09.034
83. Monaghan CK, Brickman S, Huynh P, Ongur D, Hall MH. A longitudinal study of event related potentials and correlations with psychosocial functioning and clinical features in first episode psychosis patients. Int J Psychophysiol. (2019) 145:48–56. doi: 10.1016/j.ijpsycho.2019.05.007
84. Chopra S, Levi PT, Holmes A, Orchard ER, Segal A, Francey SM, et al. Brainwide anatomical connectivity and prediction of longitudinal outcomes in antipsychotic-naive first-episode psychosis. Biol Psychiatry. (2024). doi: 10.1016/j.biopsych.2024.07.016
85. Maximo JO, Briend F, Armstrong WP, Kraguljac NV, Lahti AC. Higher-order functional brain networks and anterior cingulate glutamate + Glutamine (Glx) in antipsychotic-naive first episode psychosis patients. Transl Psychiatry. (2024) 14:183. doi: 10.1038/s41398-024-02854-7
86. Masias Bruns M, Ramirez-Mahaluf JP, Valli I, Ortuno M, Ilzarbe D, de la Serna E, et al. Altered temporal dynamics of resting-state functional magnetic resonance imaging in adolescent-onset first-episode psychosis. Schizophr Bull. (2024) 50:418–26. doi: 10.1093/schbul/sbad107
87. Salisbury DF, Seebold D, Longenecker JM, Coffman BA, Yeh FC. White matter tracts differentially associated with auditory hallucinations in first-episode psychosis: A correlational tractography diffusion spectrum imaging study. Schizophr Res. (2024) 265:4–13. doi: 10.1016/j.schres.2023.06.001
Keywords: sleep, white matter, T2 relaxation, schizophrenia, bipolar disorder, psychosis
Citation: Yesilkaya UH, Chen X, Watford L, McCoy E, Sen M, Genc I, Du F, Ongur D and Yuksel C (2025) Poor self-reported sleep is associated with prolonged white matter T2 relaxation in psychotic disorders. Front. Psychiatry 15:1456435. doi: 10.3389/fpsyt.2024.1456435
Received: 28 June 2024; Accepted: 09 December 2024;
Published: 07 January 2025.
Edited by:
Armando D’Agostino, University of Milan, ItalyReviewed by:
Ellen E. Lee, University of California, San Diego, United StatesCopyright © 2025 Yesilkaya, Chen, Watford, McCoy, Sen, Genc, Du, Ongur and Yuksel. This is an open-access article distributed under the terms of the Creative Commons Attribution License (CC BY). The use, distribution or reproduction in other forums is permitted, provided the original author(s) and the copyright owner(s) are credited and that the original publication in this journal is cited, in accordance with accepted academic practice. No use, distribution or reproduction is permitted which does not comply with these terms.
*Correspondence: Cagri Yuksel, YXl1a3NlbEBtZ2Iub3Jn
†These authors have contributed equally to this work and share first authorship
Disclaimer: All claims expressed in this article are solely those of the authors and do not necessarily represent those of their affiliated organizations, or those of the publisher, the editors and the reviewers. Any product that may be evaluated in this article or claim that may be made by its manufacturer is not guaranteed or endorsed by the publisher.
Research integrity at Frontiers
Learn more about the work of our research integrity team to safeguard the quality of each article we publish.