 Allison L. Moreau
 Isabella Hansen
 Ryan Bogdan
94% of researchers rate our articles as excellent or good
Learn more about the work of our research integrity team to safeguard the quality of each article we publish.
Find out more
REVIEW article
Front. Psychiatry, 13 February 2025
Sec. Neuroimaging
Volume 15 - 2024 | https://doi.org/10.3389/fpsyt.2024.1432253
This article is part of the Research TopicRecent Advances on the Multimodal Search for Markers of Treatment Response in Affective Disorders: From Bench to Bedside? Volume IIView all 4 articles
Identifying individual difference factors associated with treatment response and putative mechanisms of therapeutic change may improve treatment for Obsessive Compulsive Disorder (OCD). Our systematic review of structural neuroimaging markers (i.e., morphometry, structural connectivity) of psychotherapy and medication treatment response for OCD identified 26 eligible publications from 20 studies (average study total n=54 ± 41.6 [range: 11-175]; OCD group n=29 ± 19) in child, adolescent, and adult samples evaluating baseline brain structure correlates of treatment response as well as treatment-related changes in brain structure. Findings were inconsistent across studies; significant associations within the anterior cingulate cortex (3/5 regional, 2/8 whole brain studies) and orbitofrontal cortex (5/10 regional, 2/7 whole brain studies) were most common, but laterality and directionality were not always consistent. Structural neuroimaging markers of treatment response do not currently hold clinical utility. Given increasing evidence that associations between complex behavior and brain structure are characterized by small, but potentially meaningful, effects, much larger samples are likely needed. Multivariate approaches (e.g., machine learning) may also improve the clinical predictive utility of neuroimaging data.
Obsessive-Compulsive Disorder (OCD) has a lifetime prevalence of 1.3% [95% confidence interval: 0.9-1.8%; (1)] and brings with it tremendous individual (e.g., increased health care expenses and mortality; decreased work productivity) and societal (e.g., socioeconomic costs) burden (2–4). Effective psychological (i.e., exposure and response prevention; ERP) and medication (i.e., selective serotonin reuptake inhibitors; SSRIs) treatments are available (5–7); however, there remains tremendous variability in responsiveness to treatment [e.g., 9-76% (8)]. This variability in treatment response has inspired efforts to identify individual difference factors that may be leveraged to identify who may respond best to treatment, which may eventually contribute to more personalized medicine and greater insight into disorder and treatment heterogeneity and etiology (9). These efforts have identified some clinical predictors of treatment response, including symptom severity and hoarding pathology, while others (e.g., OCD illness duration, patient gender, age at onset, and the severity of comorbid depression or anxiety) have not been consistently associated with treatment response (10, 11). The investigation of these clinical features has had relatively little impact on treatment and has not provided clues to putative mechanisms through which therapeutic effects are generated.
There has been interest in moving beyond clinical indicators and demographic factors to identify objective and quantifiable biomarkers that are predictive of treatment response and may help inform putative mechanisms through which treatment works. While neuroimaging is not typically incorporated into clinical care for OCD, the past decade has seen an explosion of studies investigating neural predictors of treatment response as well as neural change in the context of treatment. Indeed, multiple psychiatric organizations have convened task forces to assess the existing evidence and potential for neuroimaging markers in predicting treatment response and in psychiatry more globally. The American Psychiatric Association’s working group on neuroimaging markers of psychiatric disorders concluded in their 2012 consensus report that there are promising results for predictive biomarkers of treatment response but that none yet had clinical utility (12). The World Federation of Societies for Biological Psychiatry’s task force on biological markers also argued that biomarkers can help identify treatments’ mechanisms of action (13). Recent work has continued to investigate the possibility of diagnostic and prognostic neuroimaging biomarkers for psychiatric disorders (e.g., (14–16); see (17) for an umbrella review of OCD diagnostic biomarkers). However, the literature is dispersed with a variety of approaches used and there is a need for systematic reviews to synthesize this work. While comprehensive reviews have been published recently for other disorders, including depression (18), an up-to-date systematic review of psychotherapy and medication treatments for OCD is needed.
Initial theoretical models of OCD neurobiology emphasized that alterations in a cortico-striato-thalamo-cortical (CSTC) circuit may contribute to the expression of OCD or arise following its expression (19–21). This circuit is involved in motor and response inhibition, affective and reward processing, and working memory and executive function, all of which are impaired in OCD. More recently the CSTC model has been updated to include additional regions, namely the amygdala (20), for its role in fear extinction, and the parietal cortex, for its role in cognitive control(see (22, 23) for recent reviews). Large scale international consortiums, such as the Enhancing Neuroimaging Genetics through Meta-Analysis (ENIGMA) consortium (24), have integrated smaller patient studies to more reliably estimate brain structure correlates of OCD (25) and other psychopathology. In relatively large samples (OCD patients ns: 874-2,278; control ns: 789-2,093), the ENIGMA OCD working group found that adult OCD is associated with: 1) smaller hippocampal and larger pallidal volume (26); 2) thinner bilateral inferior parietal cortex and smaller left transverse temporal surface area (27); 3) lower fractional anisotropy (FA) and higher radial diffusivity (RD) in the sagittal stratum and posterior thalamic radiation as well as higher mean diffusivity (MD) in the sagittal stratum (28). Pediatric OCD patients (OCD patients ns: 174-407; control ns: 144-324), like adult patients, had thinner left inferior parietal cortex, as well as thinner bilateral superior parietal, and left lateral occipital cortices, which were not seen in adult patients, but no significant differences in surface area (27), subcortical volume (26), or white matter microstructure (28). Notably, medication and/or severity may contribute to these adult and pediatric findings as a large number of included patients were medicated (43-50% of patients in studies analyzing medication groups) and no significant differences in volume, cortical thickness, or surface area were observed when restricting analyses to unmedicated adult patients and only one finding was observed for unmedicated pediatric patients (larger thalamic volume) (26, 27). Furthermore, multivariate machine learning analyses using cortical thickness, surface area, and subcortical volume to classify patients versus controls only performed above chance when grouping patients according to medication status (29). These findings highlight the potential effects of medications on brain structure and the importance of controlling for medication status. ENIGMA’s cross-sectional findings in medicated patients need to be combined with the results of studies explicitly designed to probe treatment, both medications and psychotherapy, which crucially include pre-treatment assessments.
Neuroimaging studies of treatment outcome typically utilize pre-treatment scans to predict treatment outcome or evaluate neural changes between pre- and post-treatment scans. These studies have used a variety of imaging-derived neural phenotypes, including functional and structural MRI. While fMRI studies have been the most common and have already been extensively reviewed in the context of OCD treatment (e.g. (30–32)), emerging evidence suggests that their low reliability may not be suitable for individual differences research [e.g., resting state: (33), task-based: (34)]. Structural MRI, however, has not suffered from this issue, with higher test-retest reliability than fMRI (34). Structural MRI also has other advantages over fMRI that make it valuable for studying treatment response. The expense of MRIs represents a hurdle for clinical feasibility, particularly in the context of expected small effects. However, many individuals undergo a structural MRI of the brain for other medical reasons that become part of their medical record. These scans may be leveraged for psychiatric purposes, further increasing the value of existing MRIs. Functional MRIs, on the other hand, are not routinely acquired for medical care. They also require more equipment, expertise, and processing efforts; therefore, structural scans may be more practical for clinical questions. It is also possible that in the near future structural analyses will be automatically constructed on MRI scanners (e.g., CorticoMetrics’ THINQ, which is an FDA-approved version of the FreeSurfer neuroimaging analysis software package for clinical use), increasing the accessibility of structural brain metrics.
While the mechanism of change for fMRI studies is intuitive [i.e., treatment affects neural activation through altering synaptic levels of neurotransmitters (for medications) or other molecular mechanisms of learning (for psychotherapy)], the mechanism of change for structural MRI studies is less clear. For medications, SSRIs, the primary class of medications for OCD, have been shown to change synaptic transmission and post-synaptic transcription growth factors and stimulate neurogenesis (35–38). For psychotherapy, treatment involves learning new cognitive and behavioral strategies, and learning processes, in general, have been associated with changes in brain structure (39); therefore, it is possible that psychotherapy could lead to structural changes in the brain. In fact, the most effective psychotherapy for OCD, exposure and response prevention, is a form of extinction learning, and studies of healthy controls have shown that structural differences (namely in the ventromedial prefrontal cortex) may be associated with extinction recall abilities (40). Thus, it would be reasonable for improvements in extinction recall following exposure and response prevention to be correlated with structural changes in these brain regions.
To date, there has not yet been a comprehensive review for structural markers of OCD treatment response. Existing reviews that include such studies (30–32, 41–44) only contain a handful of such studies, at most. Therefore, the aim of this paper is to provide a systematic review of the literature on structural neuroimaging markers of treatment response for OCD, including pre-treatment response predictors as well as changes after treatment.
A systematic review on brain structure correlates of OCD treatment was conducted according to the 2020 Preferred Reporting Items for Systematic Reviews and Meta-Analyses (PRISMA) guidelines (45) (see Supplementary Table 1 for PRISMA checklist). Database searches were conducted by author AM on September 19, 2020 and subsequently revisited prior to manuscript submission on January 28, 2022, May 21, 2022, and July 23, 2022. The study protocol was not preregistered; see Supplementary Data Sheet 1 for protocol details.
A systematic search using PsycINFO, PubMed, and Web of Science and the reference lists of included articles was conducted to identify studies in which neuroimaging was used to predict OCD treatment response or neuroimaging change was measured during the course of OCD treatment. Inclusion criteria included: peer-reviewed empirical journal articles, published in English, examines OCD treatment, and measures brain structure. Dates of publication and age of subjects were not restricted. Exclusion criteria included case studies and studies that acquired brain scans of patients already undergoing treatment or that included treatment status as a covariate for other research questions.
The following search terms were used: (“obsessive compulsive disorder” OR “obsessive-compulsive disorder”) AND (“treatment” OR “treatment response” OR “treatment outcome” OR “therapy” OR “psychotherapy” OR “counseling” OR “intervention” OR “empirically supported treatment” OR “empirically based treatment” OR “medication” OR “psychopharmacology” OR “pharmacotherapy” OR “cognitive behavioral therapy” OR “exposure and response prevention” OR “exposure therapy” OR “SSRIs” OR “neurostimulation” OR “deep brain stimulation” OR “DBS” OR “transcranial magnetic stimulation” OR “TMS” OR “electroconvulsive shock therapy” OR “ECT” OR “vagus nerve stimulation” OR “psychosurgery” OR “capsulotomy” OR “cingulotomy”) AND (“neuroimaging” OR “magnetic resonance imaging” OR “MRI” OR “structural magnetic resonance imaging” OR “structural MRI” OR “volume” OR “surface area” OR “cortical thickness” OR “diffusion” OR “diffusion weighted imaging” OR “diffusion tensor imaging”). Keywords were searched for in “MeSH subject headings” (PsycINFO), “Title/Abstract” (PubMed), and “Topic” (Web of Science).
Search results from all three databases were exported to Mendeley (Version 1.19.8, Mendeley Ltd.) and then abstrackr [YWJzdHJhY2tyLmNlYm0uYnJvd24uZWR1; (46)]. During the first round of screening, titles, abstracts, and keywords were reviewed by AM and IH to assess study eligibility (see Abstract screening tool in Supplementary Data Sheet 2). The first 100 search results were screened by both AM and IH to determine interrater reliability. The agreement rate was 95 percent, with four of the remaining five articles marked “no” by one rater and “requires full-text review” by the other; all discordant articles were ultimately excluded after full-text review. After establishing sufficient reliability and resolving any inconsistencies in screening approach, the remaining results were screened by either AM or IH. For articles deemed of potential relevance, the full text was reviewed by AM and RB was consulted as needed.
Study characteristics, methods, and results were extracted from included studies by AM, who has specialized clinical training in OCD and expertise in structural MRI. Neuroimaging or statistical files did not need to be obtained from study authors because the heterogeneity of methods (e.g., ROI vs whole brain) and approaches precluded a meta-analysis. All studies measured OCD symptom severity using the clinician-administered Yale-Brown Obsessive-Compulsive Scale (Y-BOCS) (47), or the Children’s Yale-Brown Obsessive-Compulsive Scale (CY-BOCS) (48) for pediatric patients, which each generate total scores, ranging from 0-40, as well as obsession and compulsion subscales ranging from 0-20 each. Outcome variables were Y-BOCS scores or morphometry measurements, depending on study design.
The systematic search identified 1,720 unique peer-reviewed journal articles, of which 26 publications met full inclusion criteria (Figure 1; Table 1). Most identified publications (i.e., 21 of 26) were published after 2012. Of these 26 articles, 6 analyzed data from a sample that had already been published on (e.g., using different techniques, reporting on different analyses, or conducting longitudinal analyses). Thus, there were 20 independent samples; total sample sizes ranged from 11 to 175 participants (mean ± SD = 54 ± 41.6), with OCD group sizes ranging from 11to 85 before treatment (mean ± SD = 29 ± 18.6) and 10 to 74 after treatment (mean ± SD = 26 ± 16). Most publications included healthy control groups (n=21). Thirty-one percent of publications (i.e., 8/26) were conducted in child/adolescent samples.
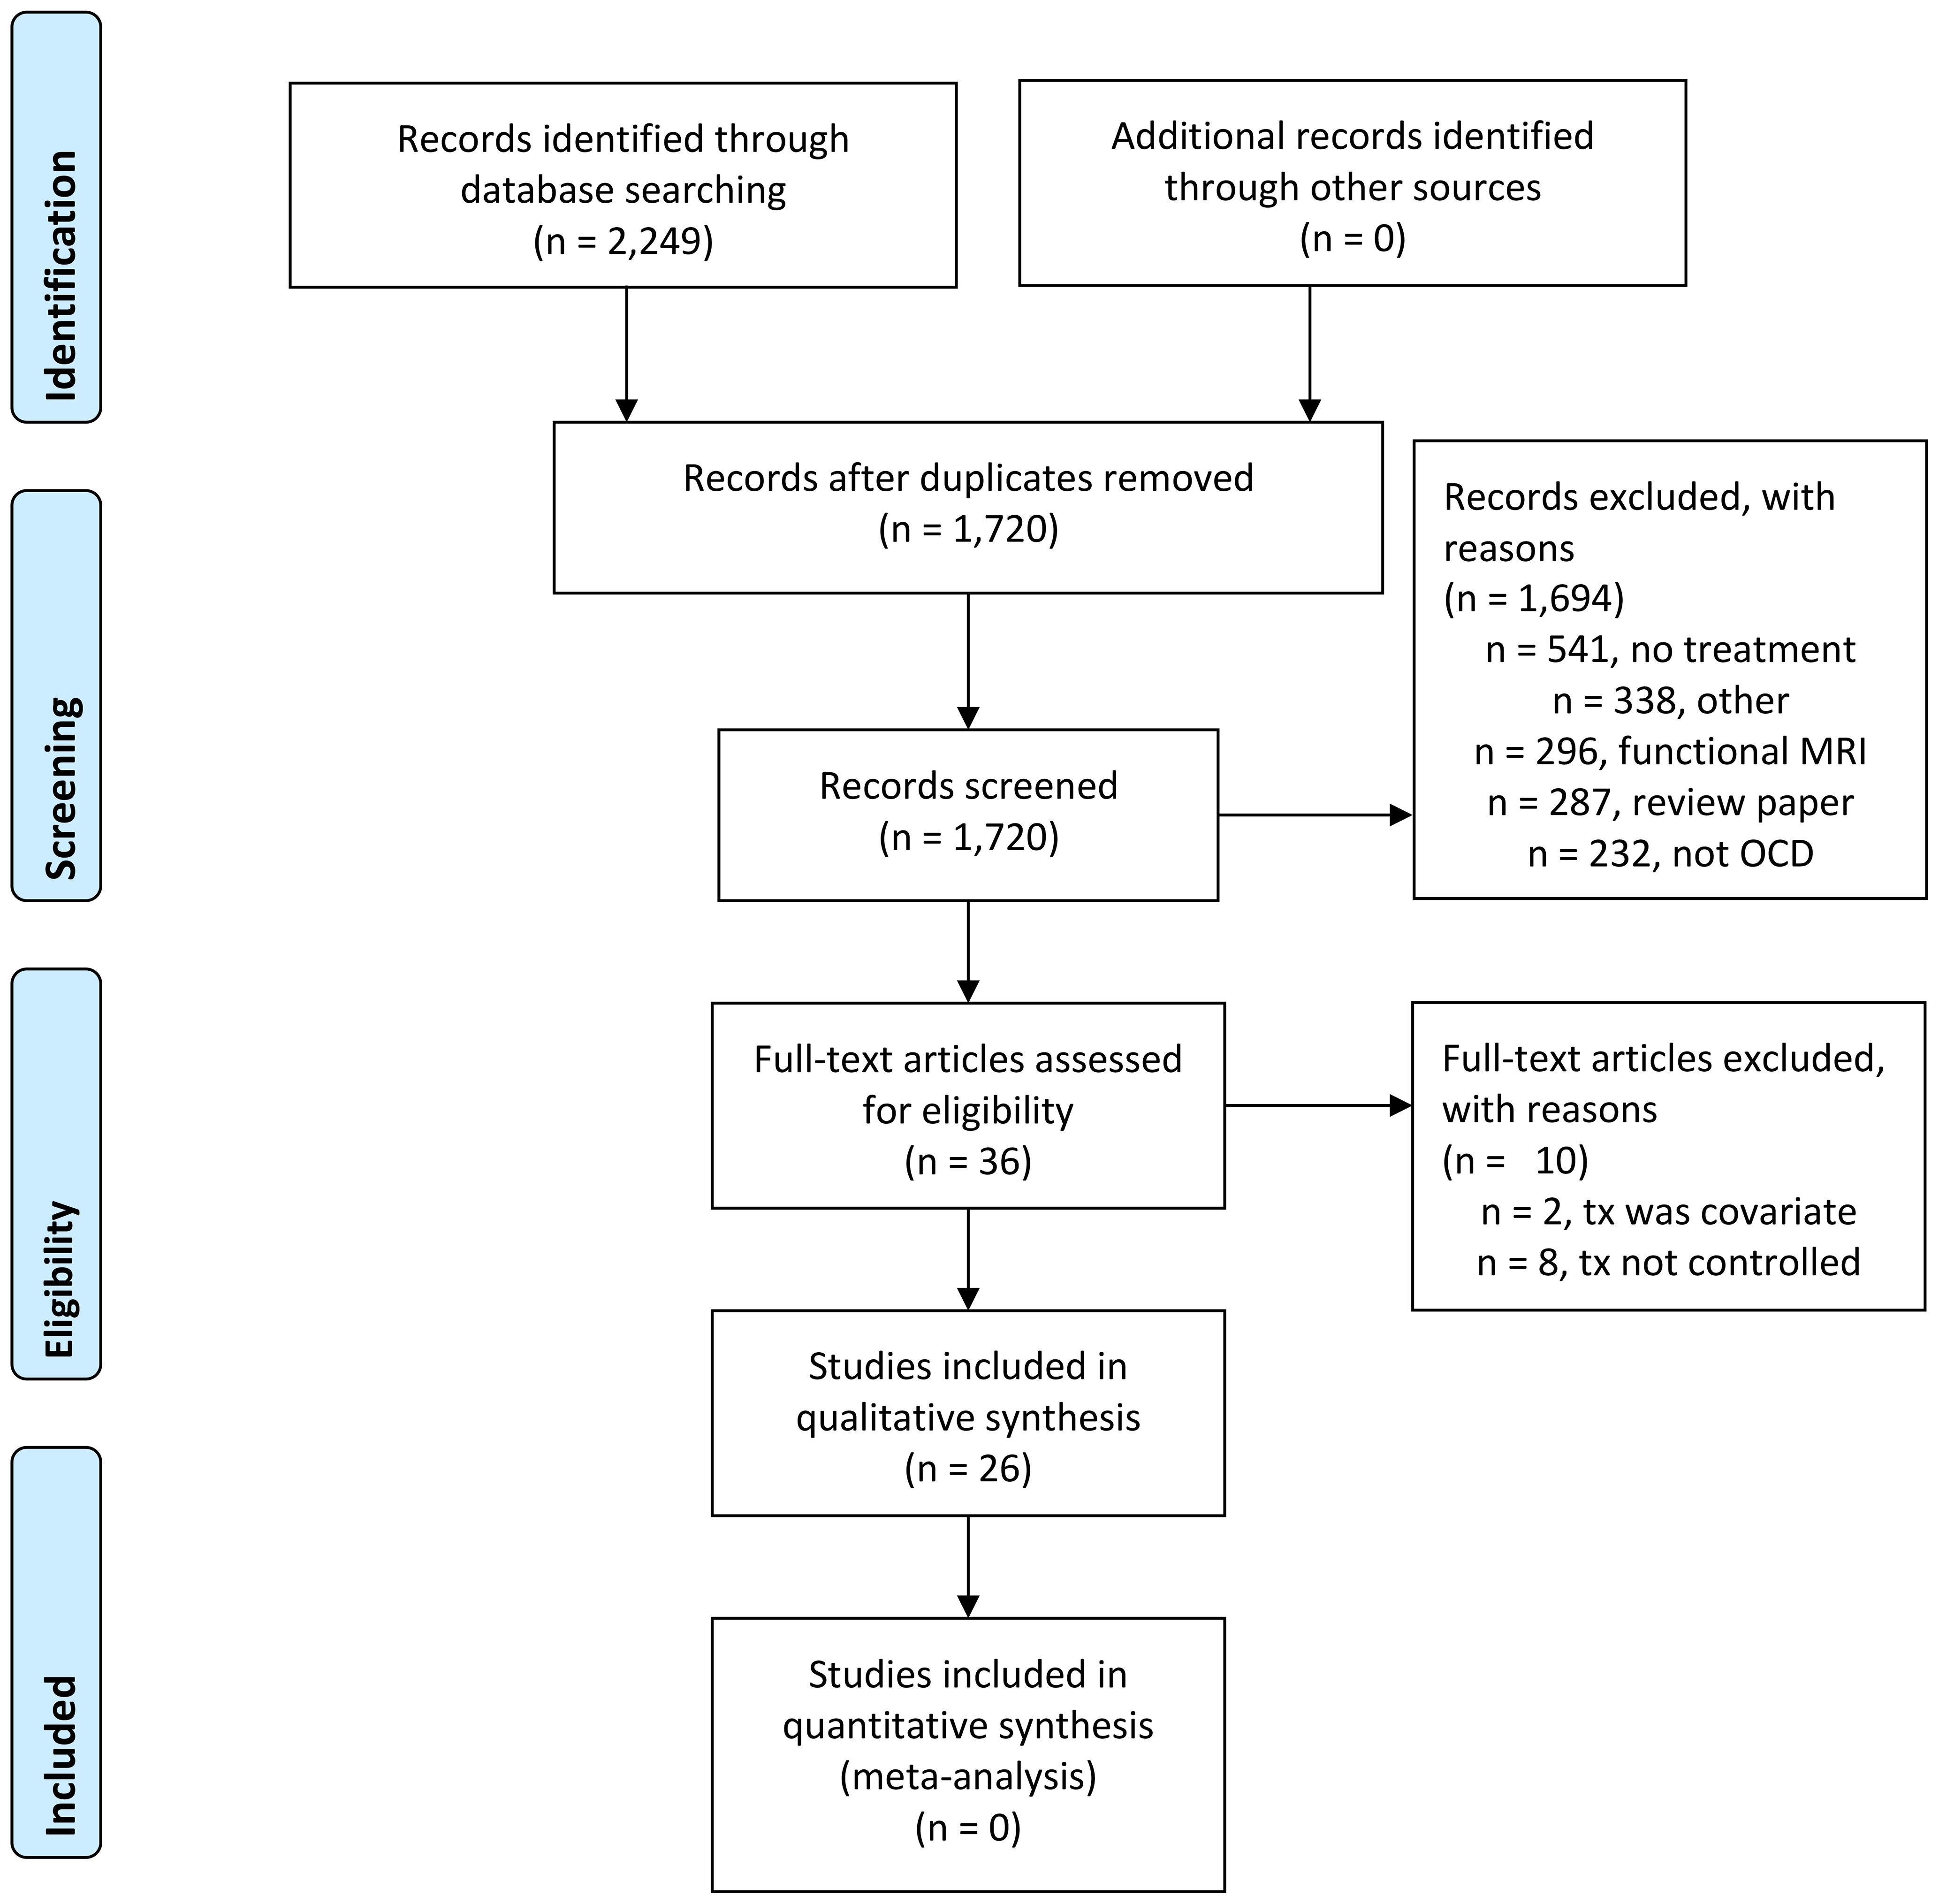
Figure 1. PRISMA flow diagram of systematic search process.
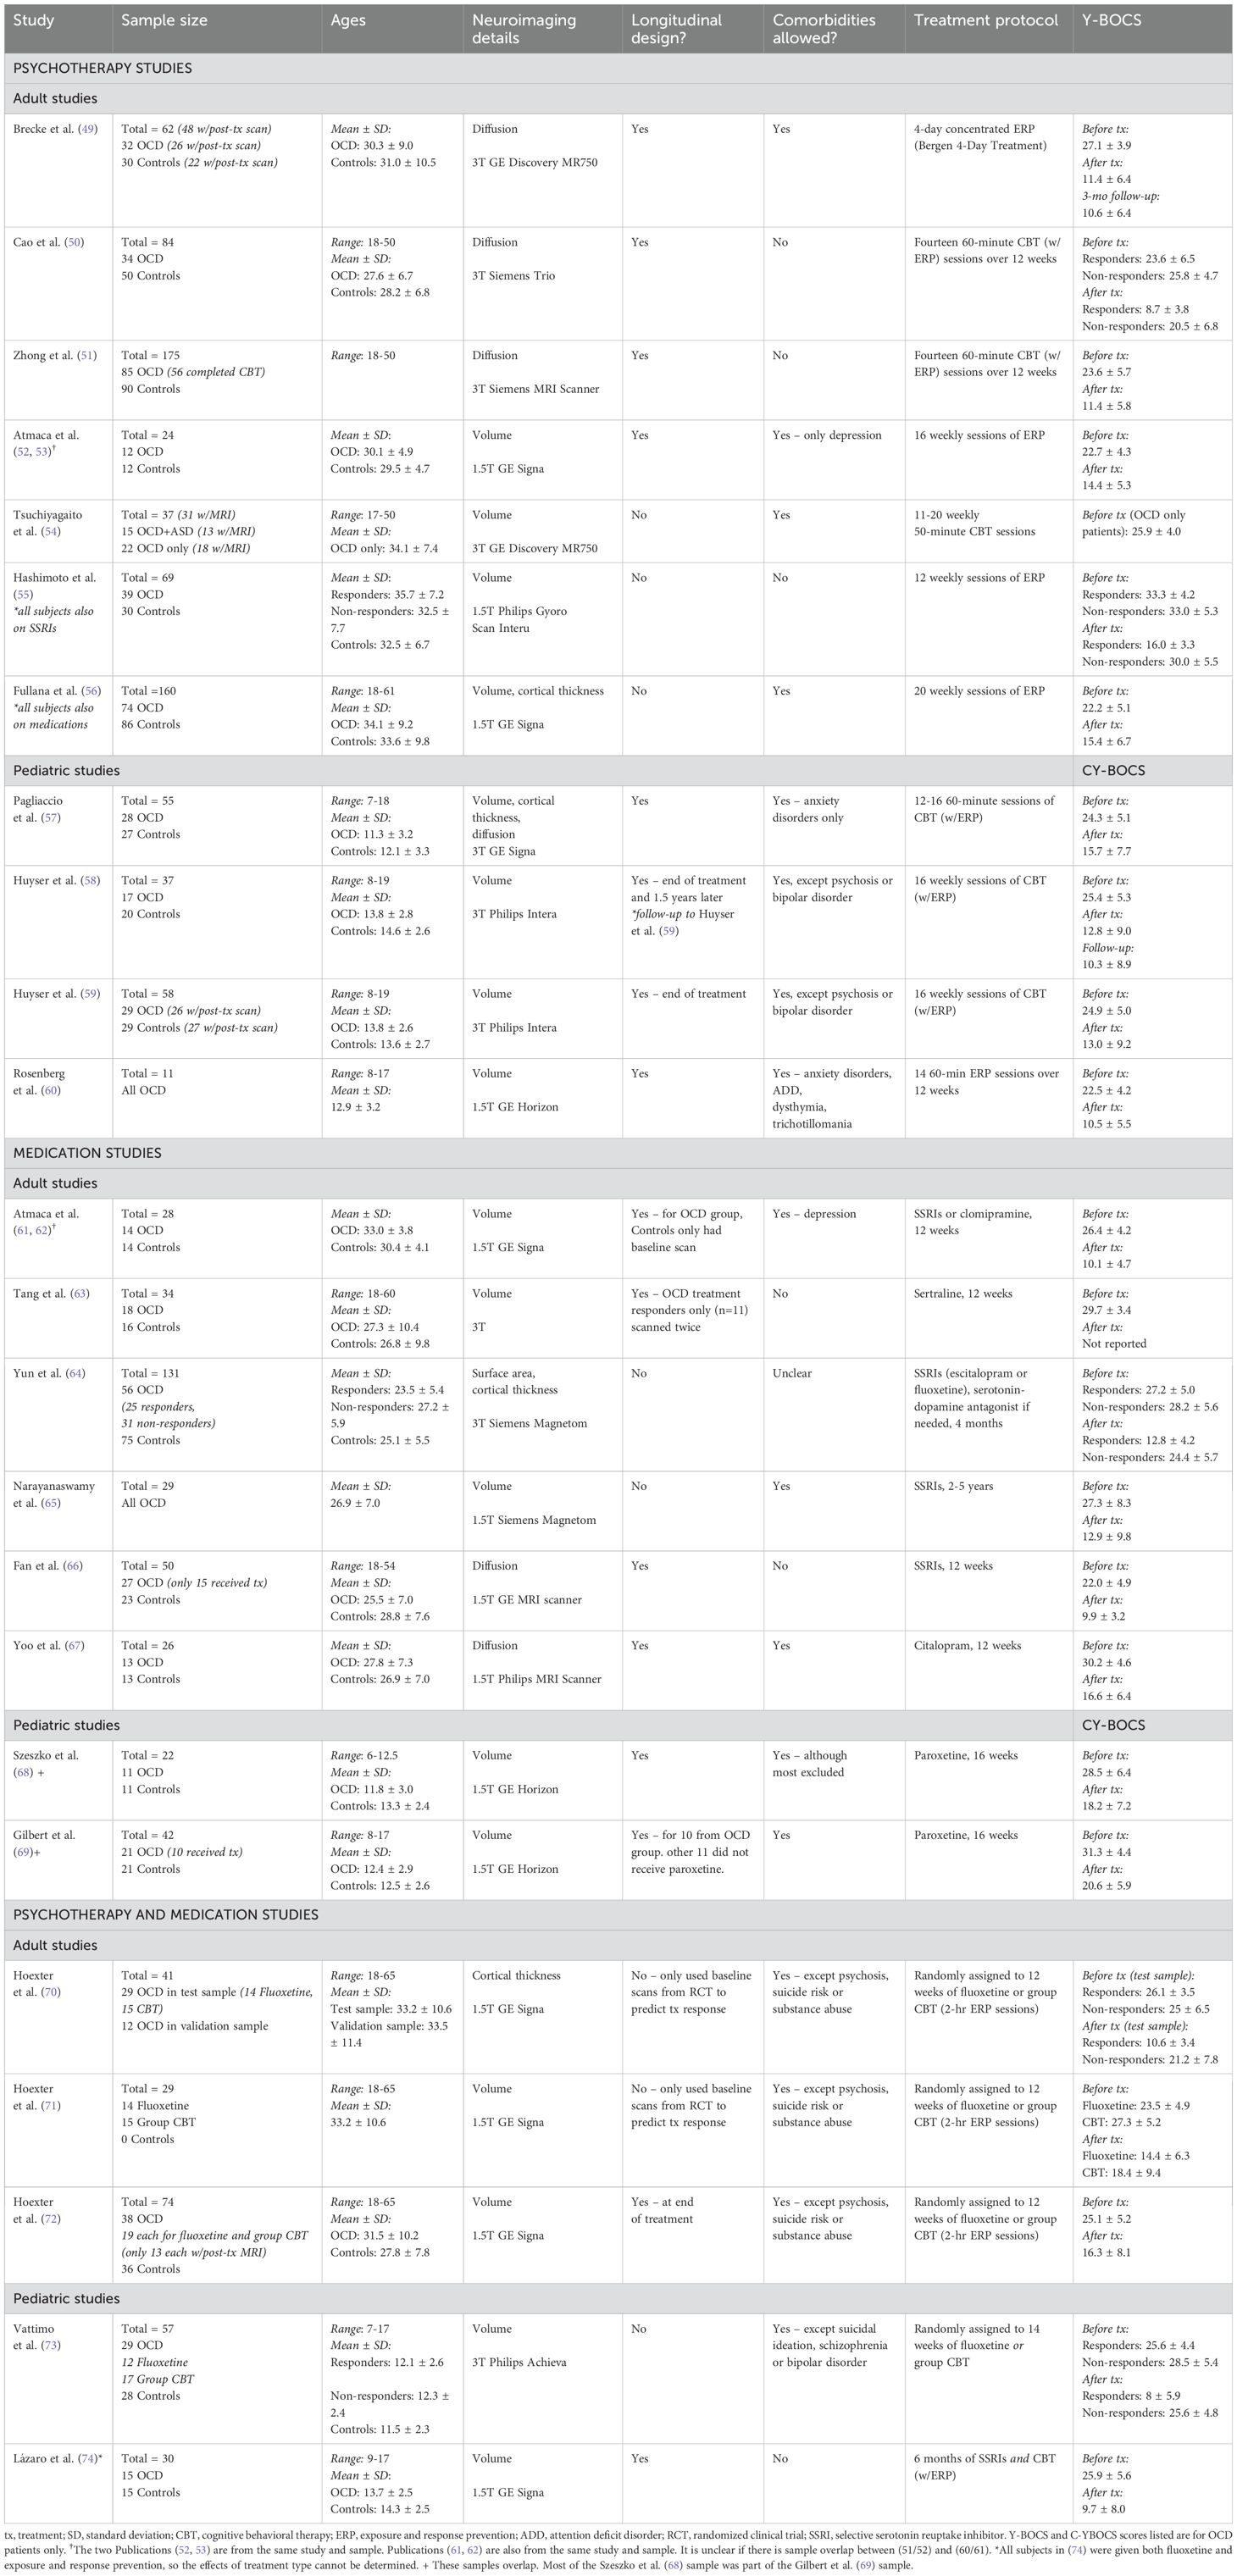
Table 1. Study characteristics.
Study treatments were relatively equally divided between psychotherapy (n=17) and medication (n=14) publications; five of these evaluated both psychotherapy and medication. Results are described below in subsections for each treatment type. The original search included any form of treatment (e.g., psychotherapy, medication, psychosurgery, or brain stimulation). However, given the small sample size of surgical and brain stimulation treatment studies, their smaller number, varying procedures (e.g., cingulotomy, capsulotomy, deep brain stimulation, transcranial magnetic stimulation), and the typical assessment of direct consequences of the operation or brain stimulation (e.g., post-surgery lesion measurement), these studies were not included in the systematic review.
Sixteen of the 26 publications reported on data acquired on MRI scanners with 1.5 Tesla field strength, with the remainder coming from 3T scanners. Twelve of the total 26 publications estimated associations between brain structure measured at pre-treatment and clinical response. In studies that included pre- and post-treatment scans of patients (n=17), six rescanned controls at the equivalent of post-treatment. Seventeen studies reported on brain structure differences from pre- to post-treatment and their associations with clinical outcomes.
The majority of publications evaluated gray (n=18) or white (n=4) matter volumes. Other brain structure metrics examined included white matter structural integrity (n=6), cortical thickness (n=4), and surface area (n=1). Studies examined associations across the entire brain (n=8), specific regions of interest (ROIs) (n=11), or adopted both approaches (n=7). The following specific ROIs were examined across studies (n= number of publications): orbitofrontal cortex (n=10), anterior cingulate cortex (n=5) and cingulum white matter tract (n=2), thalamus (n=7), caudate (n=5), amygdala (n=3), putamen (n=3), hippocampus (n=2), pallidum (n=2), parahippocampal gyrus (n=2), pituitary gland (n=2), dorsolateral prefrontal cortex (n=1), precentral gyrus (n=1), superior frontal and middle frontal gyri (n=1), parietal cortex (n=1), supramarginal gyrus (n=1), subcallosal cortex (n=1), sagittal stratum and posterior thalamic radiation white matter tracts (n=1), corpus callosum (n=1), and external and internal capsule white matter (n=2).
The 17 psychotherapy OCD treatment outcome publications (n=6 from pediatric samples) originated from 13 independent samples (n=5 from pediatric samples; Table 1). Total sample sizes ranged from 11 to 175 participants (mean ± SD = 60 ± 45), with OCD group sizes ranging from 11 to 85 before treatment (mean ± SD = 32 ± 20) and 11 to 74 after treatment (mean ± SD = 29 ± 16).
Samples contained patients who were: treatment naïve (nsamples=2; npublications=4); previously treated with medication but not currently using medication or never having used medication to treat OCD (nsamples=5; npublications=6); a mixture of those currently taking medication and those who were not (nsamples=4; npublications=4); all concurrently taking medications during therapy (nsamples=3; npublications=3). Of the treatment outcome studies allowing concurrent medication, two were conducted among medication non-responders, who remained on their medication (55, 56); one began four patients on SSRIs mid-therapy following lack of response to psychotherapy alone (57); one provided concurrent combination treatment (74); a longitudinal study began four patients on medications after psychotherapy ended (58); and the remaining two studies permitted patients already on medications to maintain stable doses throughout therapy (49, 54).
Six studies (nsamples=6) estimated associations across the whole brain using whole-brain voxel-based morphometry (nstudies=3) or voxel-based diffusion analyses (nstudies=1) with others analyzing all atlas ROIs (nstudies=2). Six publications (nsamples=5) analyzed specific ROIs only. Five publications (nsamples=3) used both ROI and whole brain voxel-wise analyses. The following specific ROIs were examined across studies (n=number of publications): orbitofrontal cortex (n=8), anterior cingulate cortex (n=4) and cingulum white matter tract (n=2), thalamus (n=5), caudate (n=4), amygdala (n=2), putamen (n=3), hippocampus (n=2), pallidum (n=1), parahippocampal gyrus (n=2), pituitary gland (n=1), precentral gyrus (n=1), superior and middle frontal gyri (n=1), parietal cortex (n=1), supramarginal gyrus (n=1), subcallosal cortex (n=1), sagittal stratum and posterior thalamic radiation white matter tracts (n=1), corpus callosum (n=1), and external and internal capsule white matter (n=2).
Thirteen publications (n=6 from pediatric samples), from 10 independent samples, estimated whether pre-treatment volume measures were associated with treatment response (n=6; 2 of which were in pediatric samples) or changes in brain volume after therapy (n=7; 4 of which were in pediatric samples) (Tables 1–3; Figures 2–5). Total sample sizes ranged from 11 to 160 participants (mean ± SD = 51 ± 38), with OCD group sizes ranging from 11 to 74 before (mean ± SD = 29 ± 17) and after (mean ± SD = 27 ± 17) treatment.
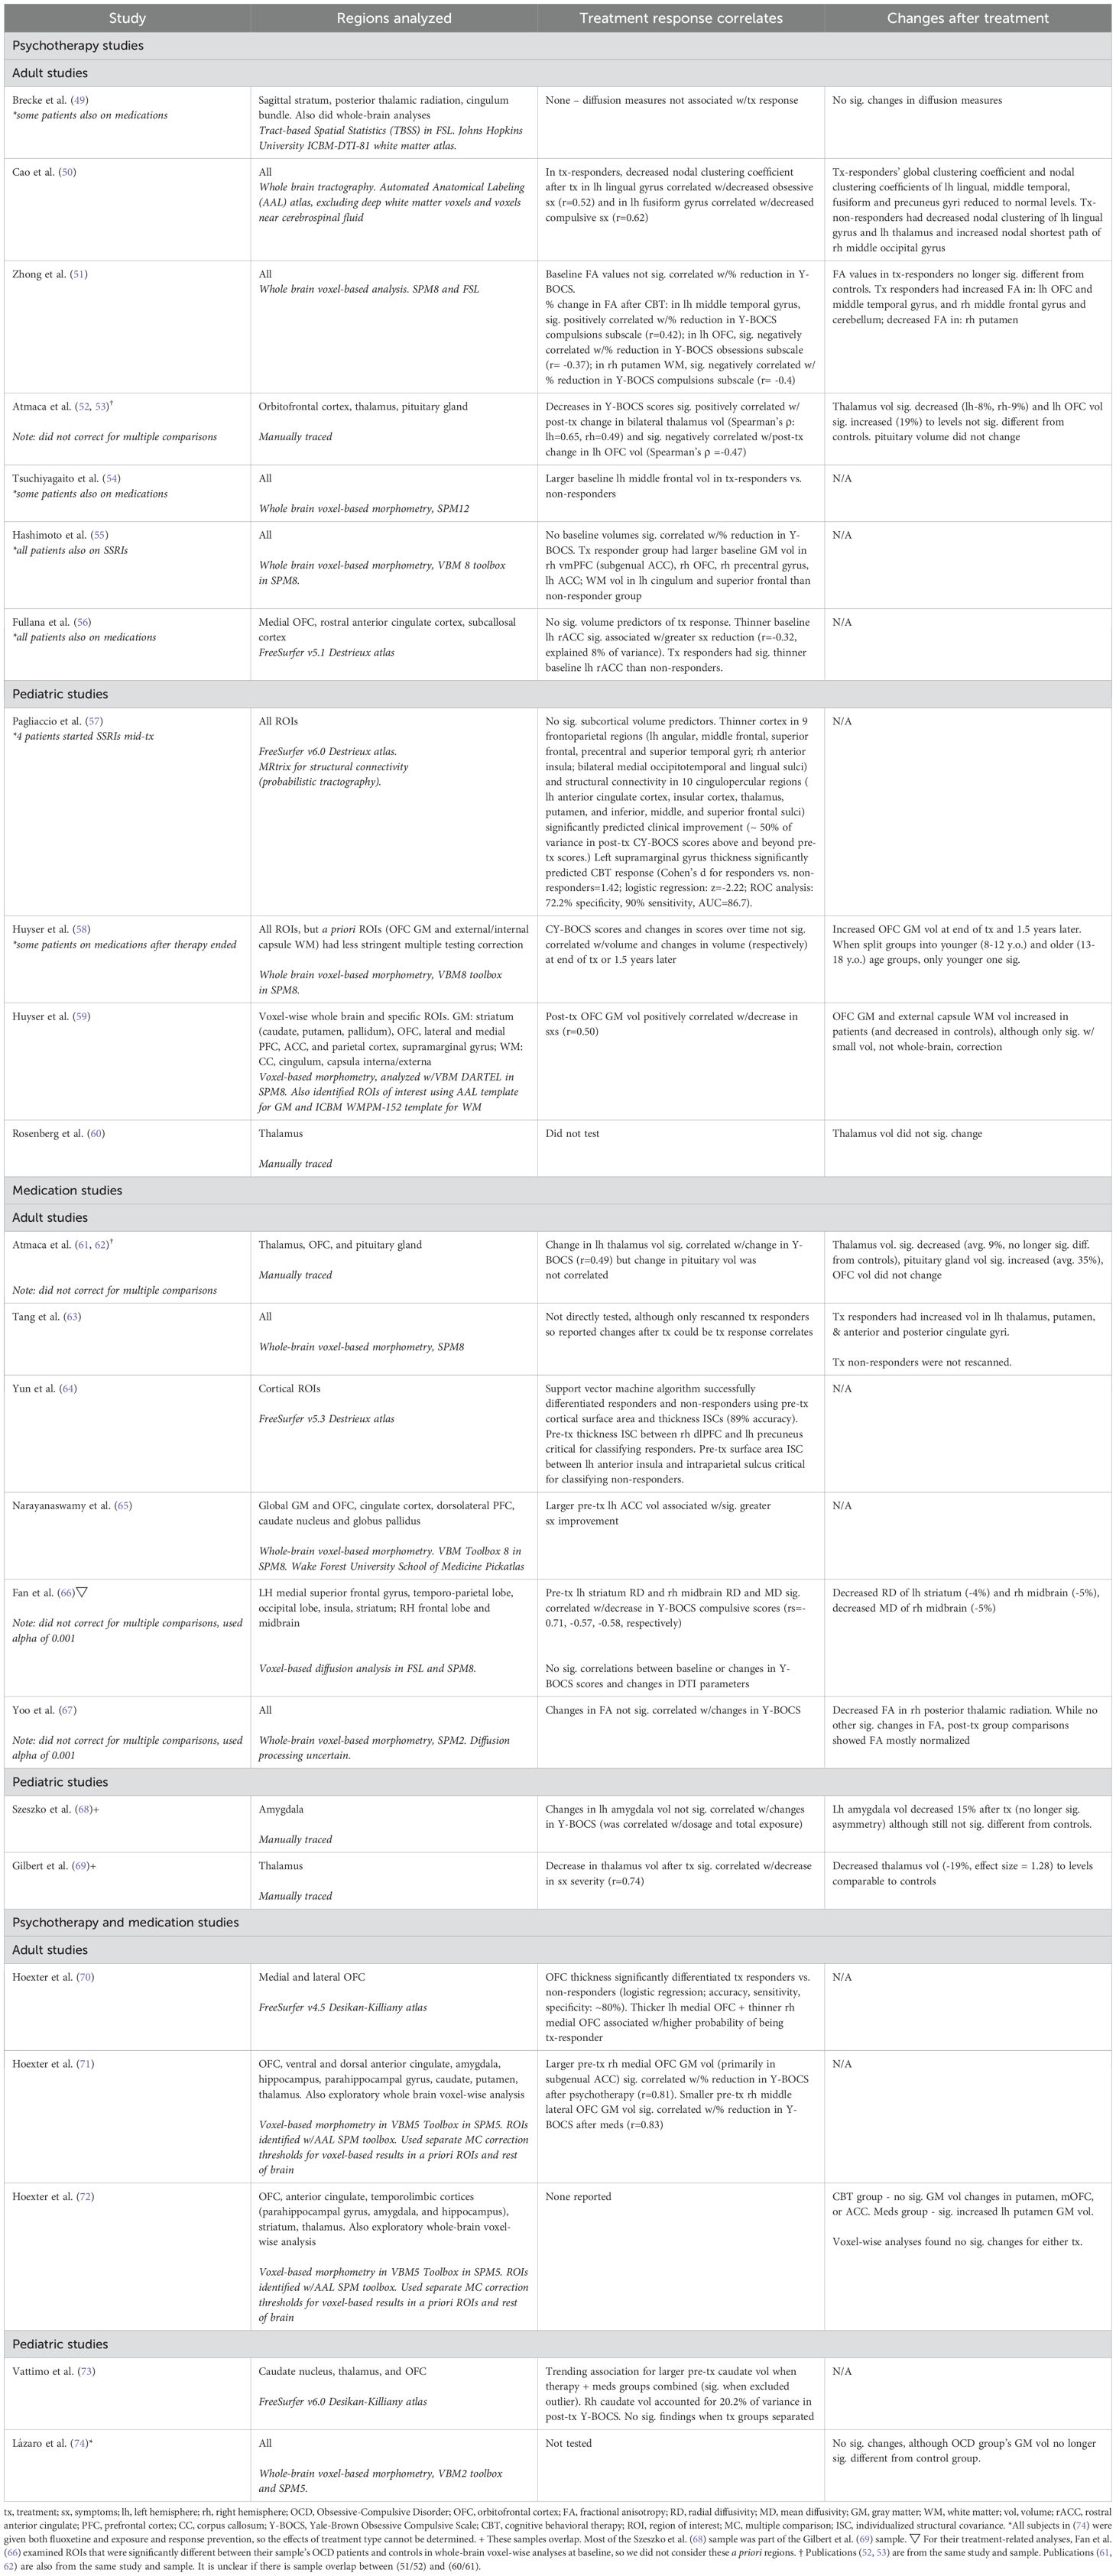
Table 2. Study results.
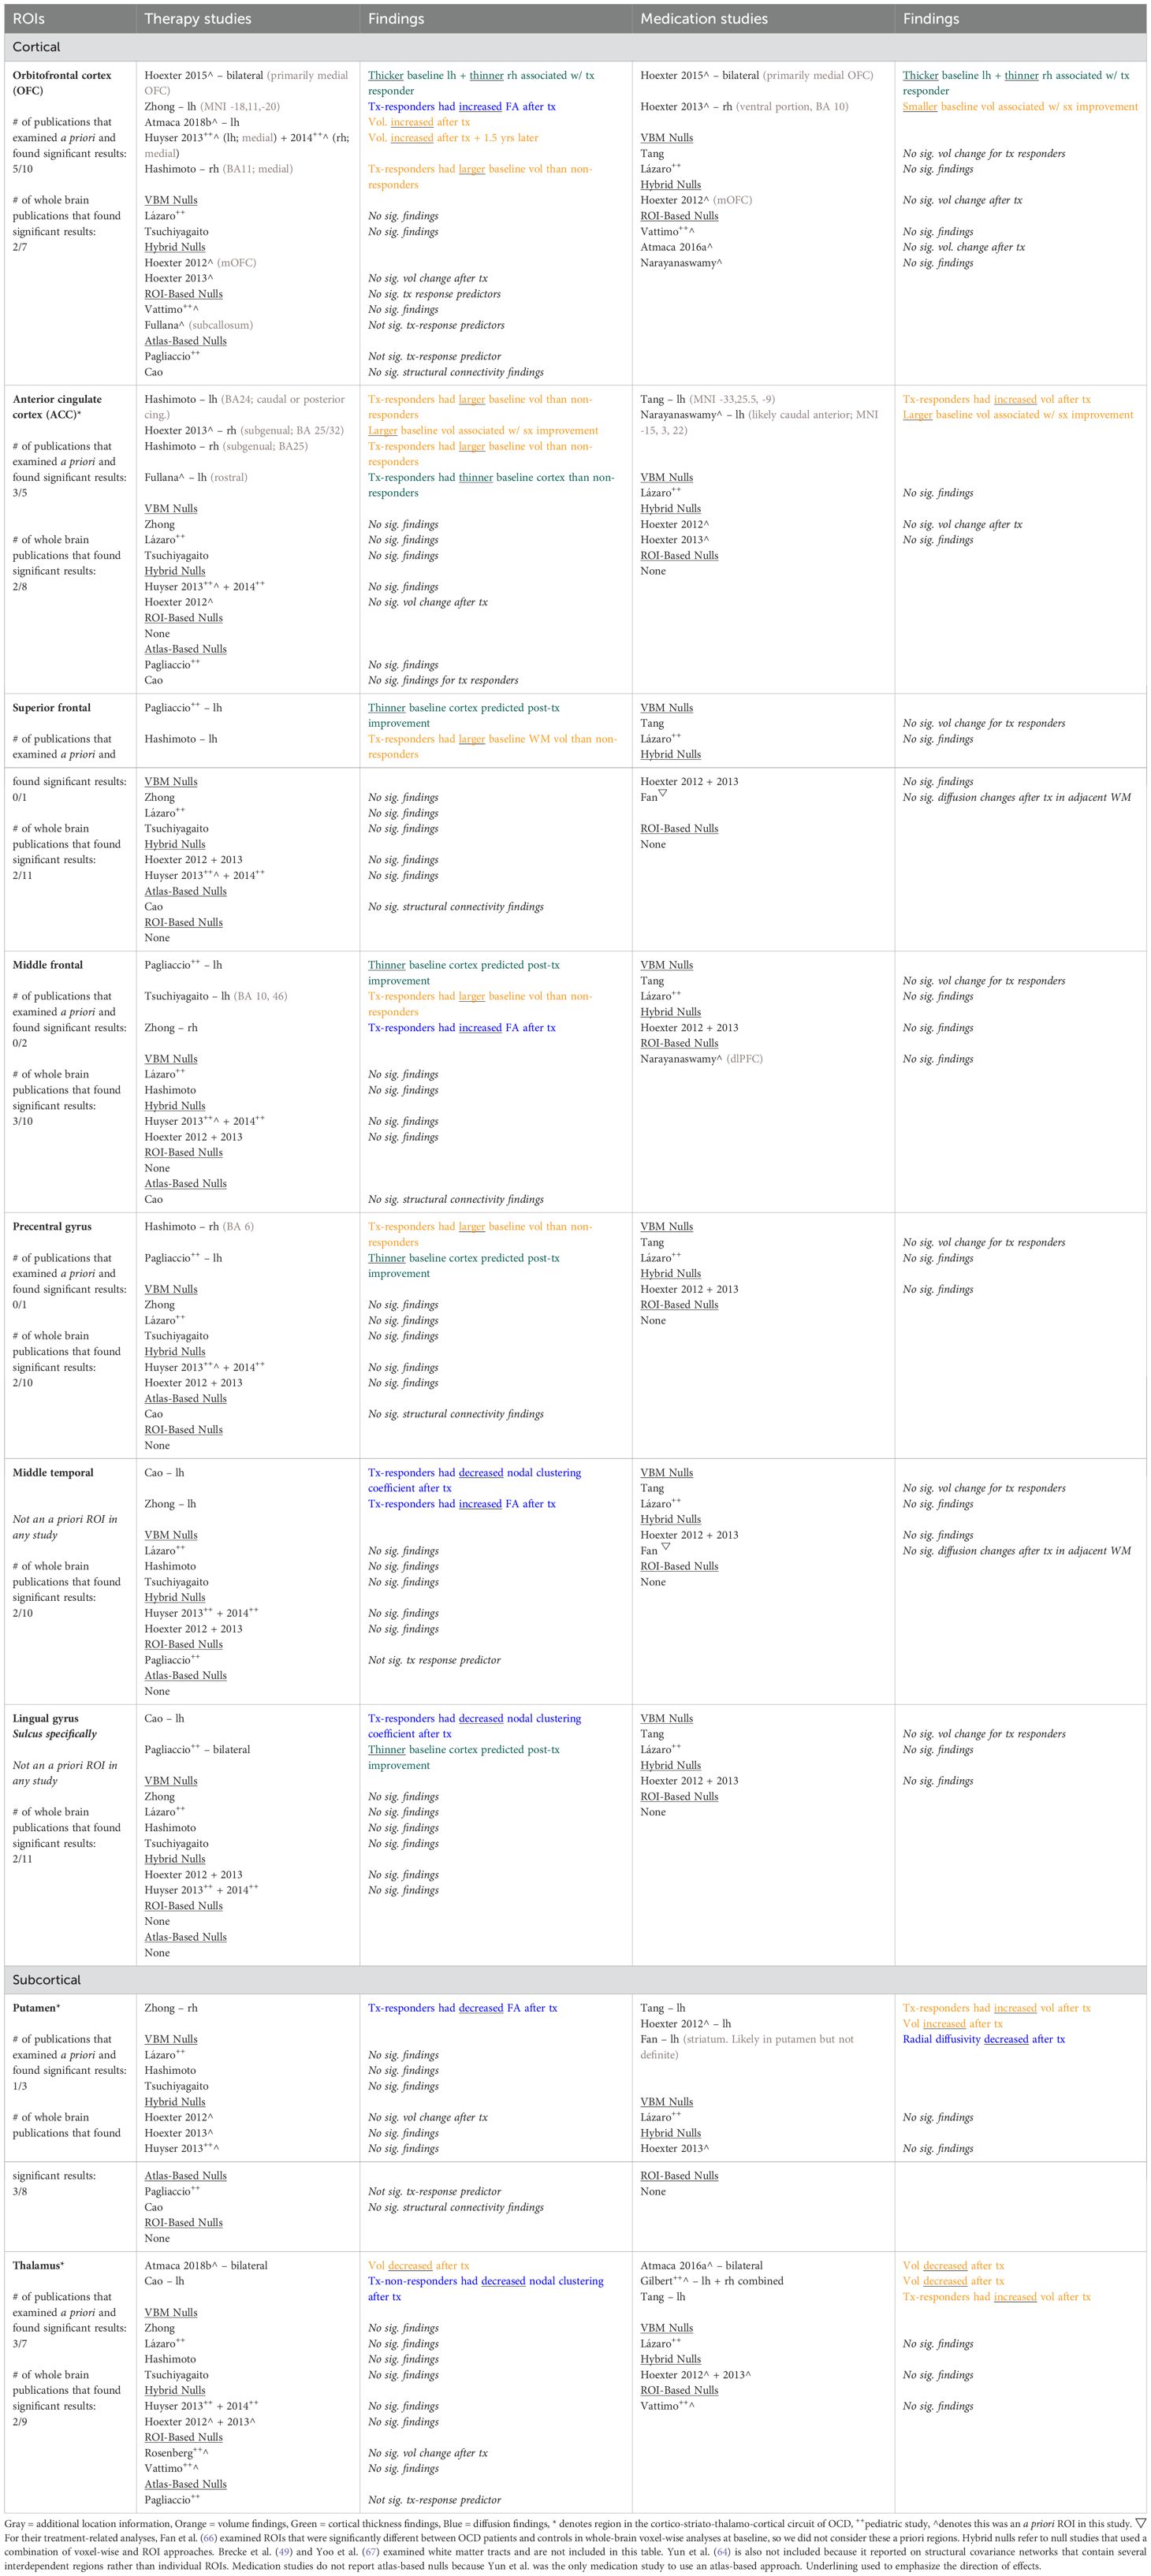
Table 3. Brain regions with significant findings in at least two studies.
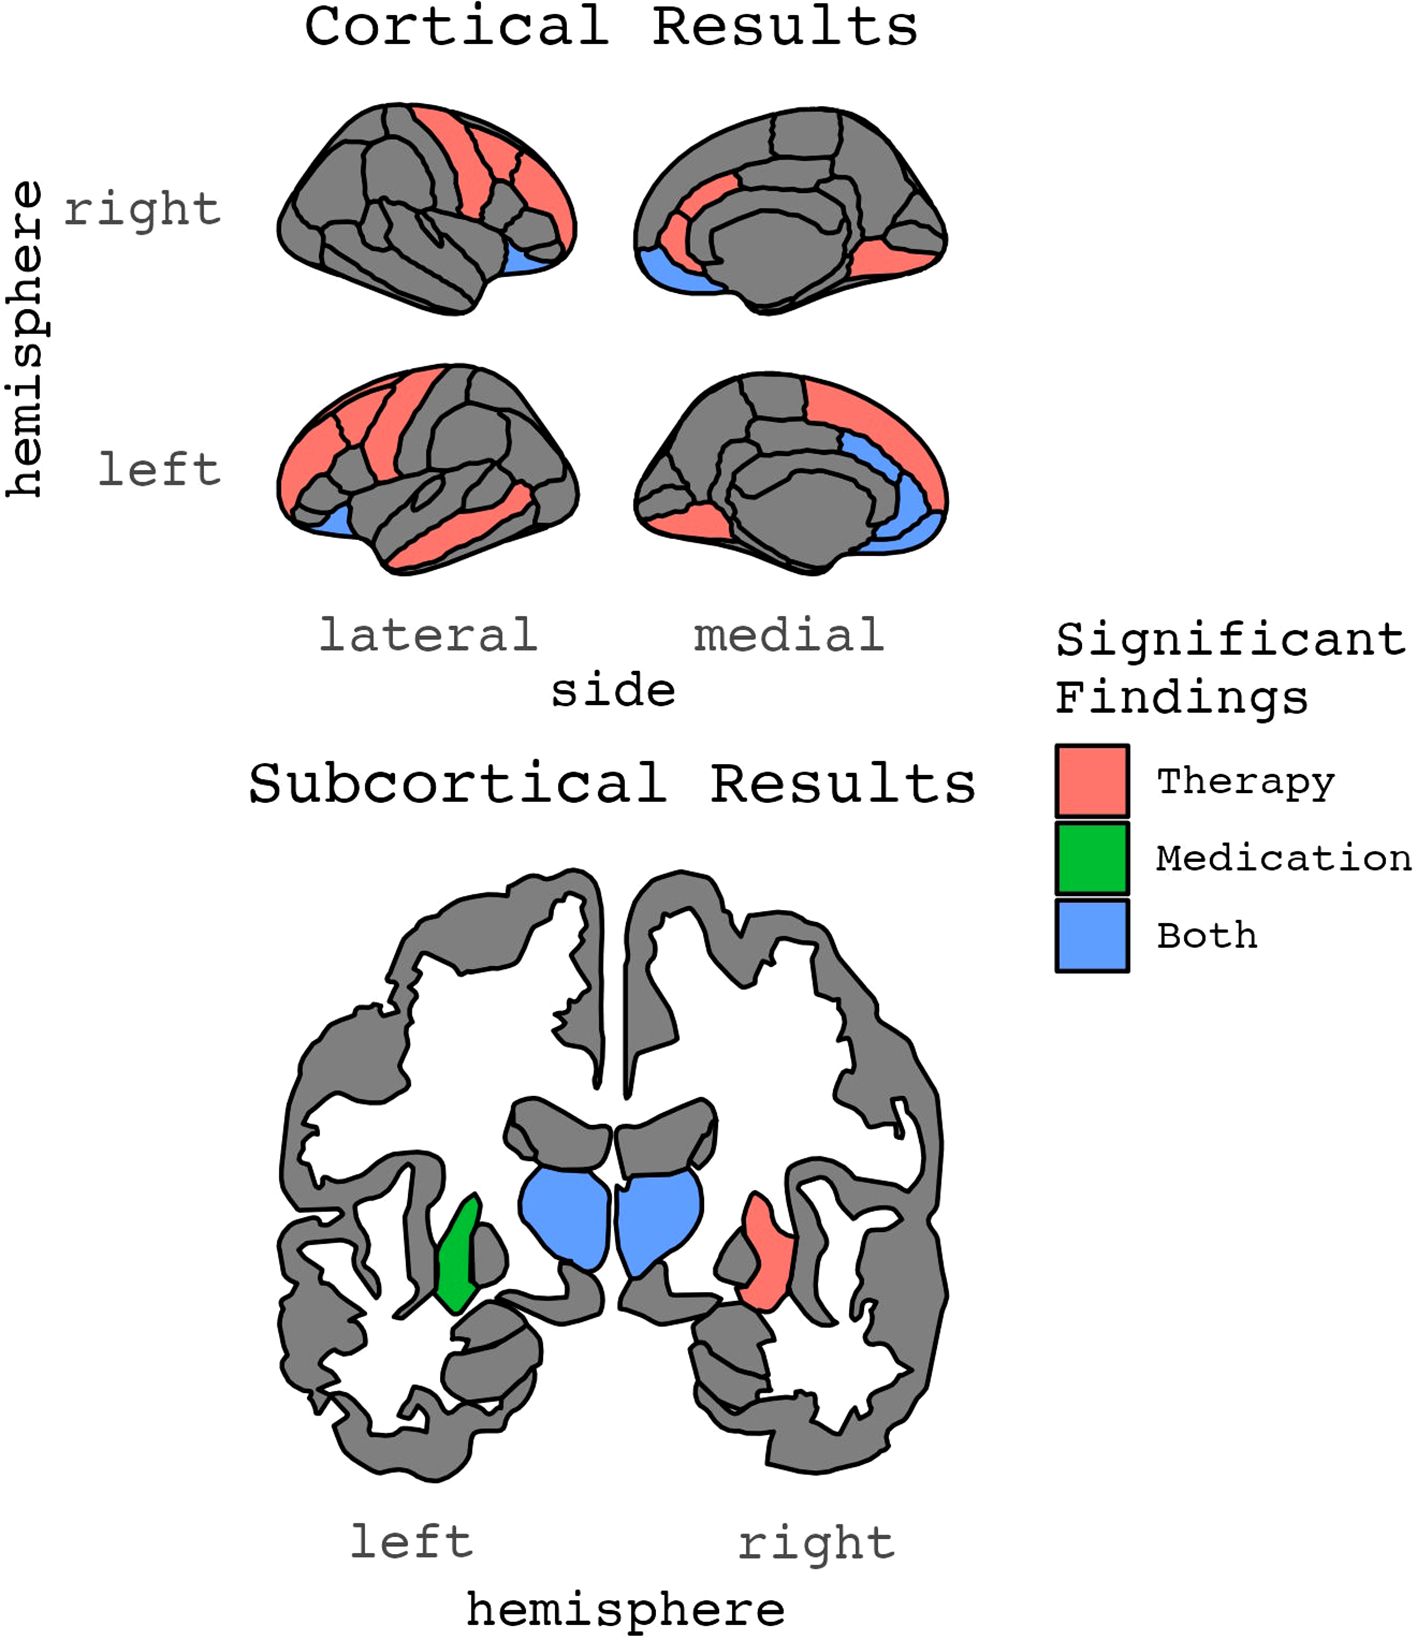
Figure 2. Results for ROIs with two or more significant findings.
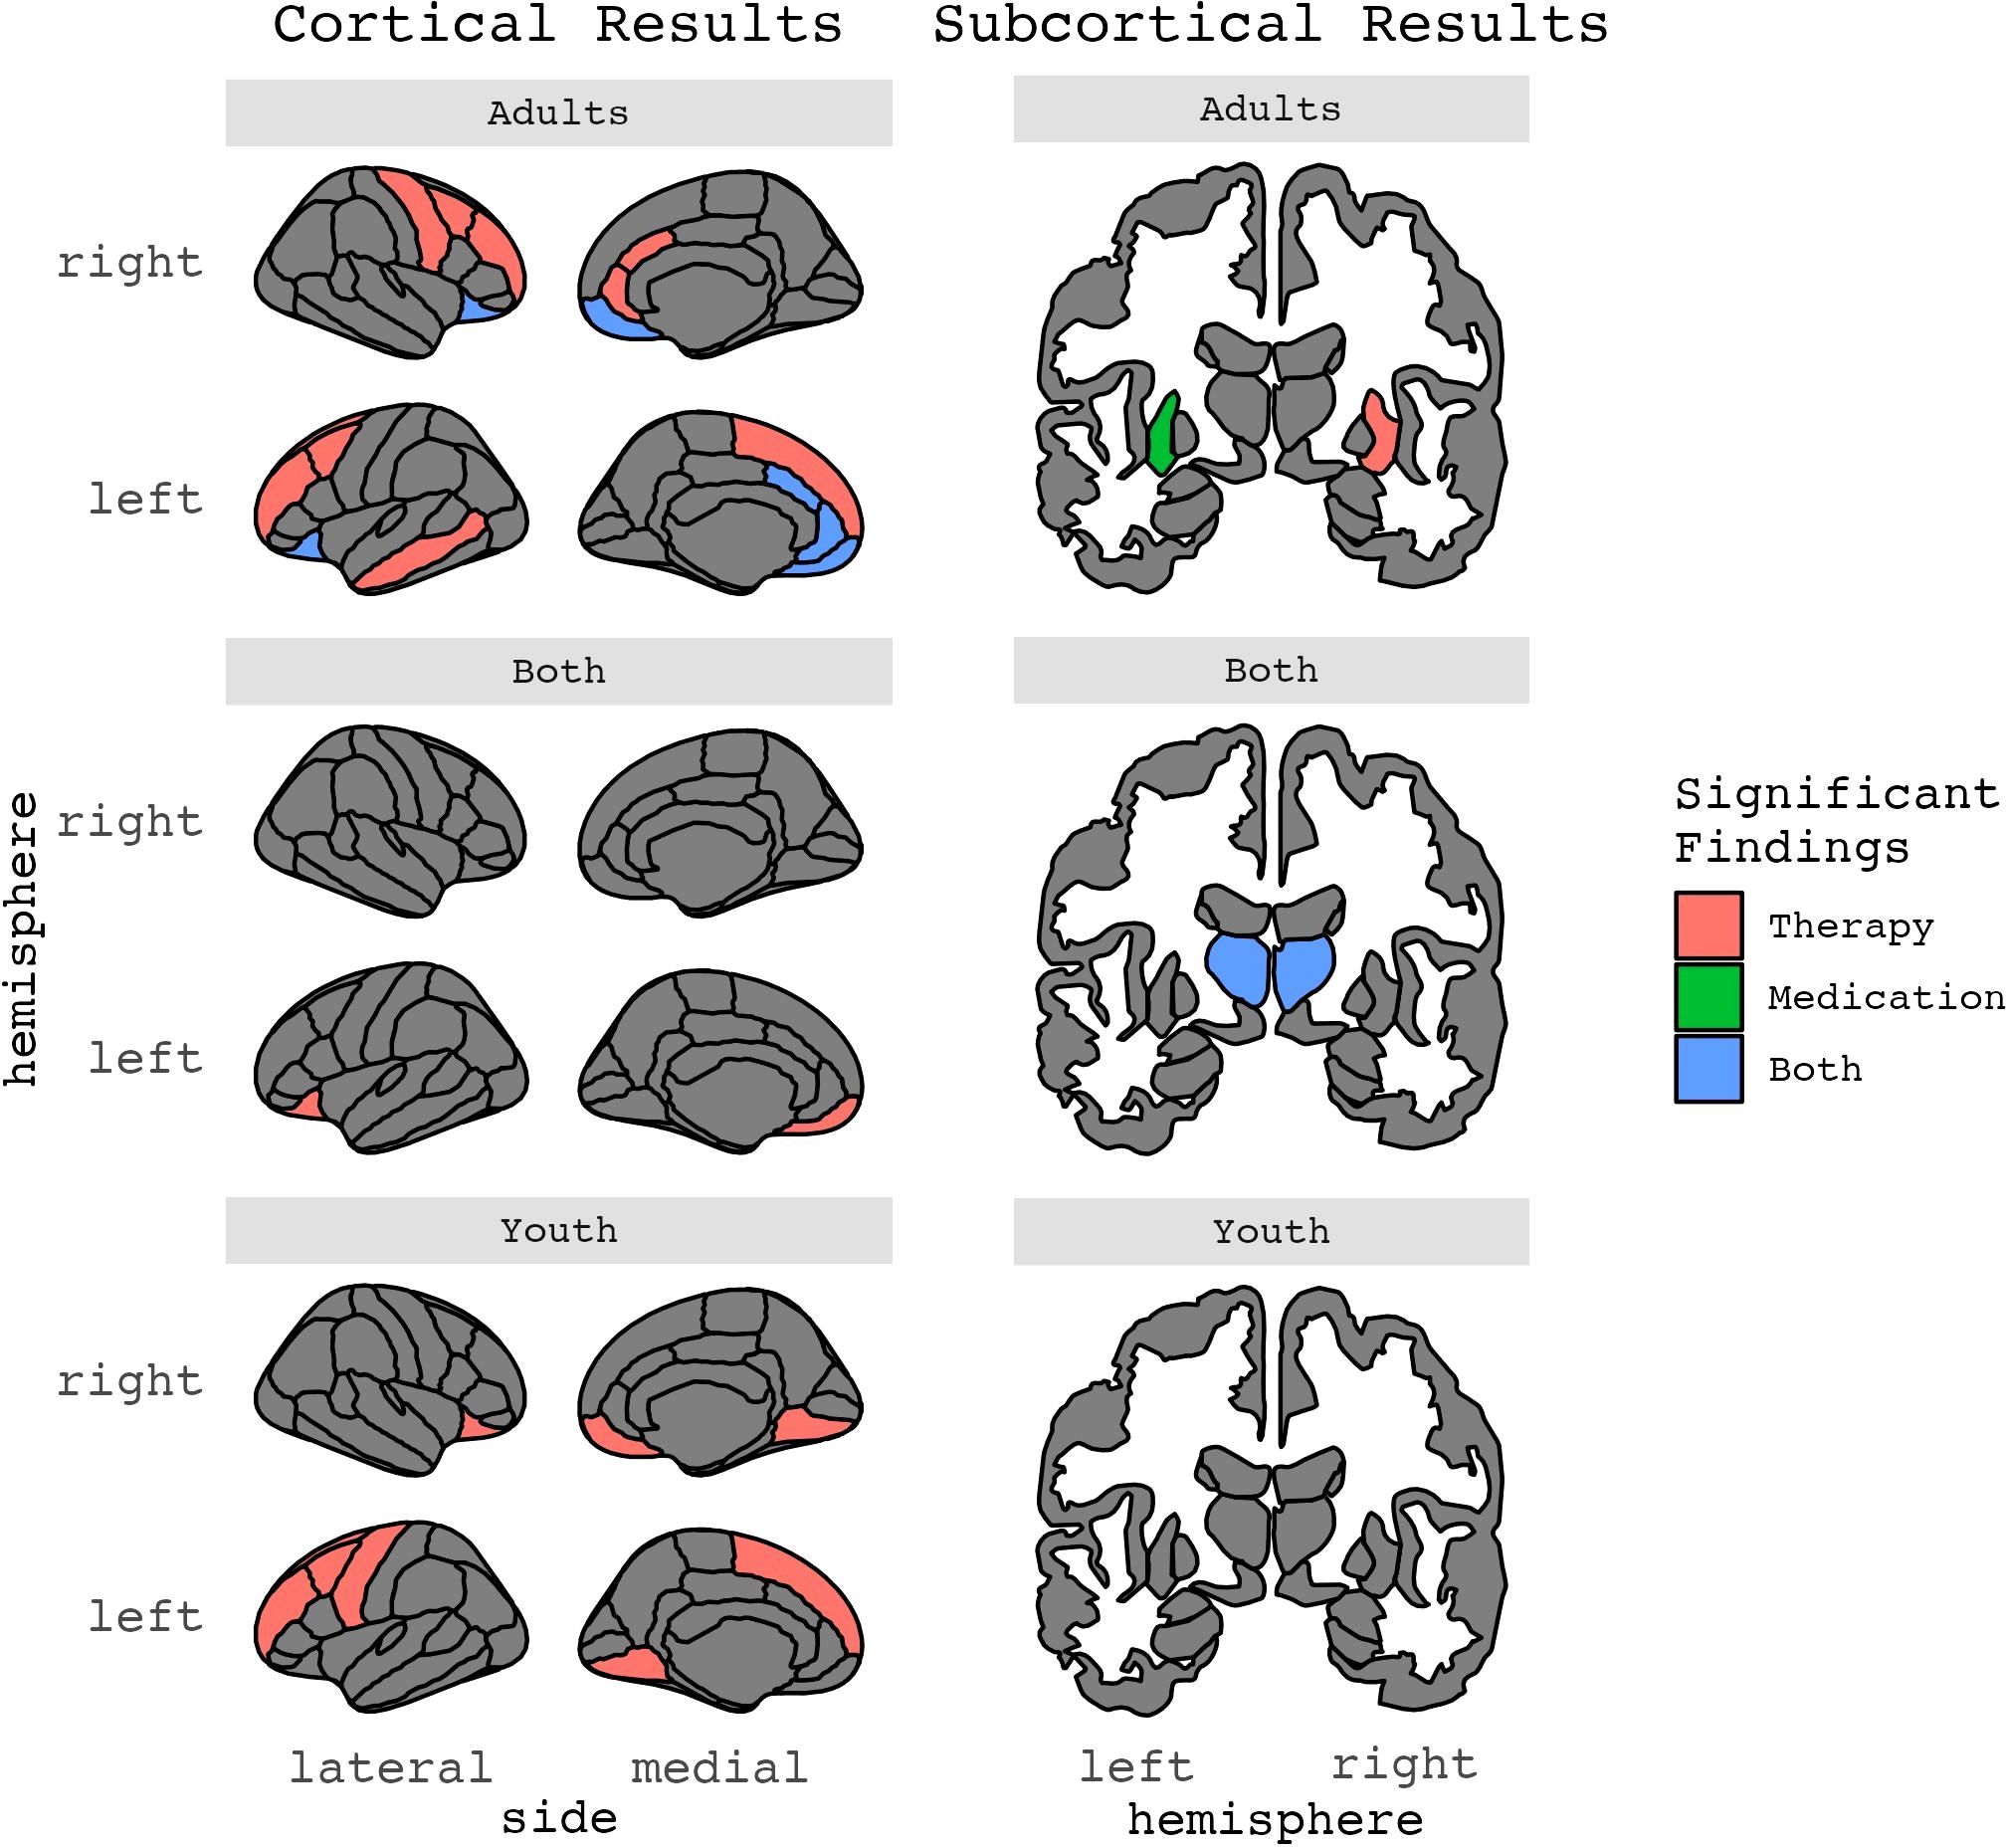
Figure 3. Results for ROIs with two or more significant findings, grouped by age.
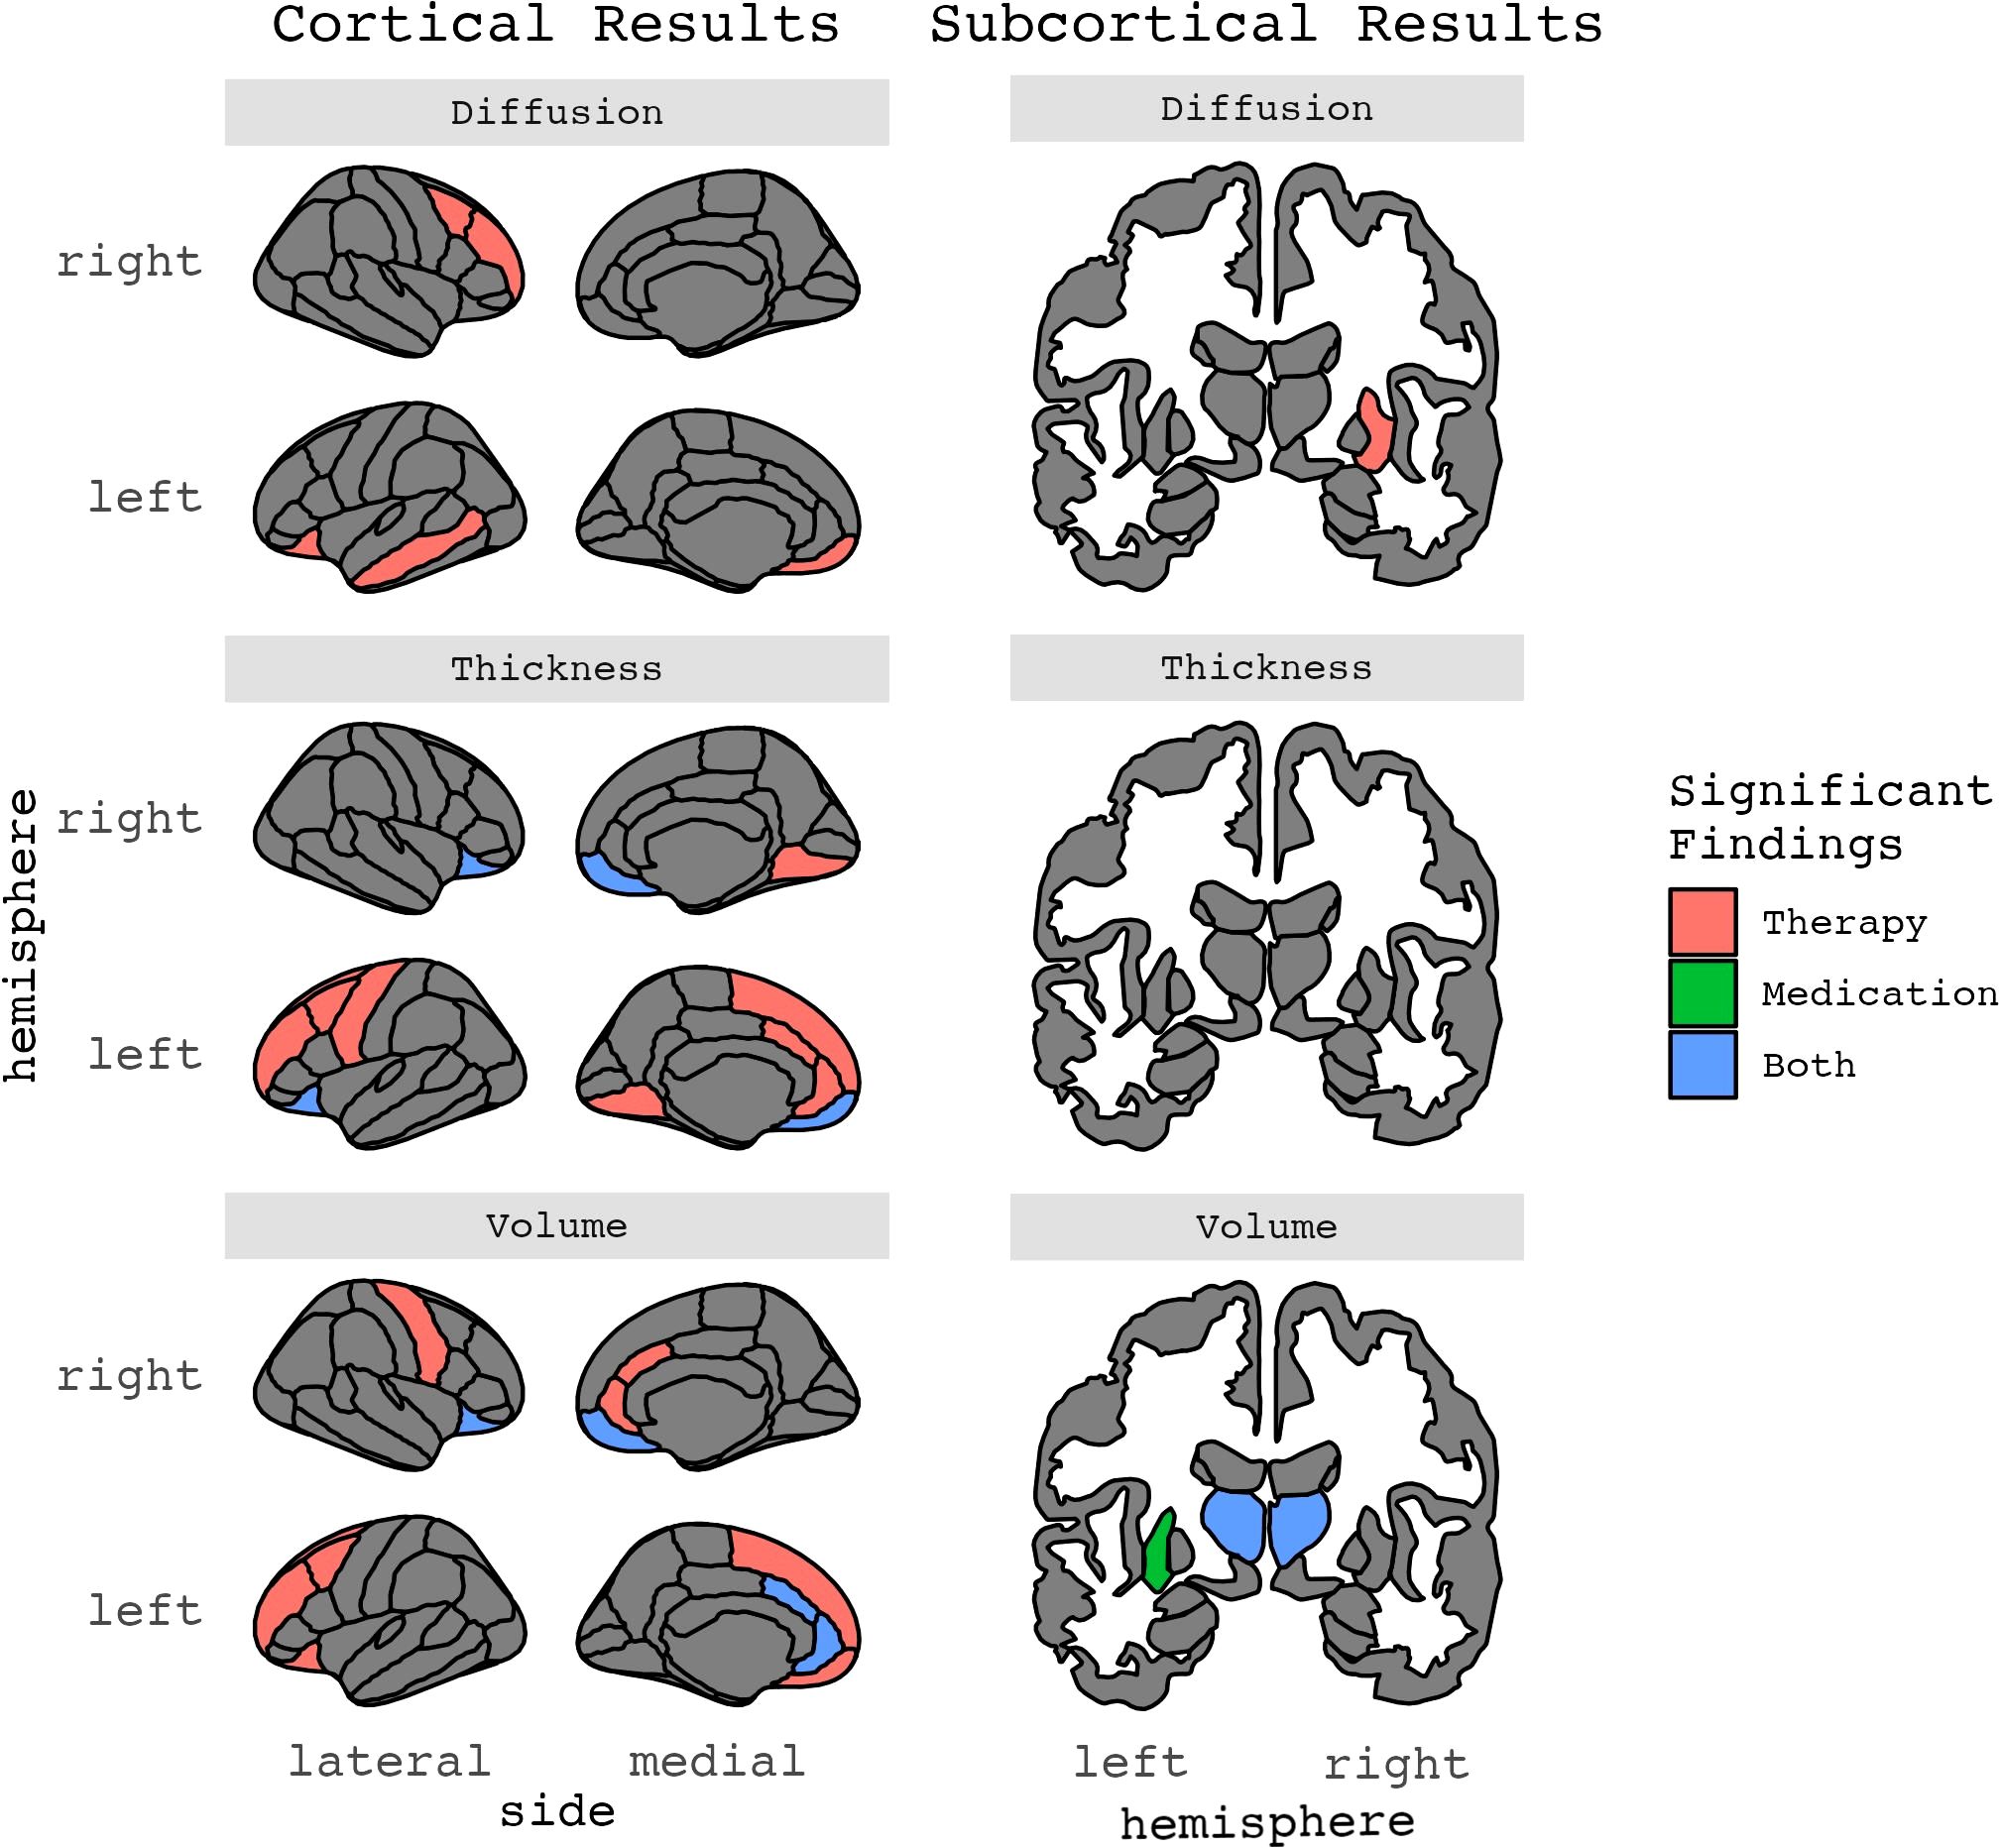
Figure 4. Results for ROIs with two or more significant findings, grouped by structural phenotype.
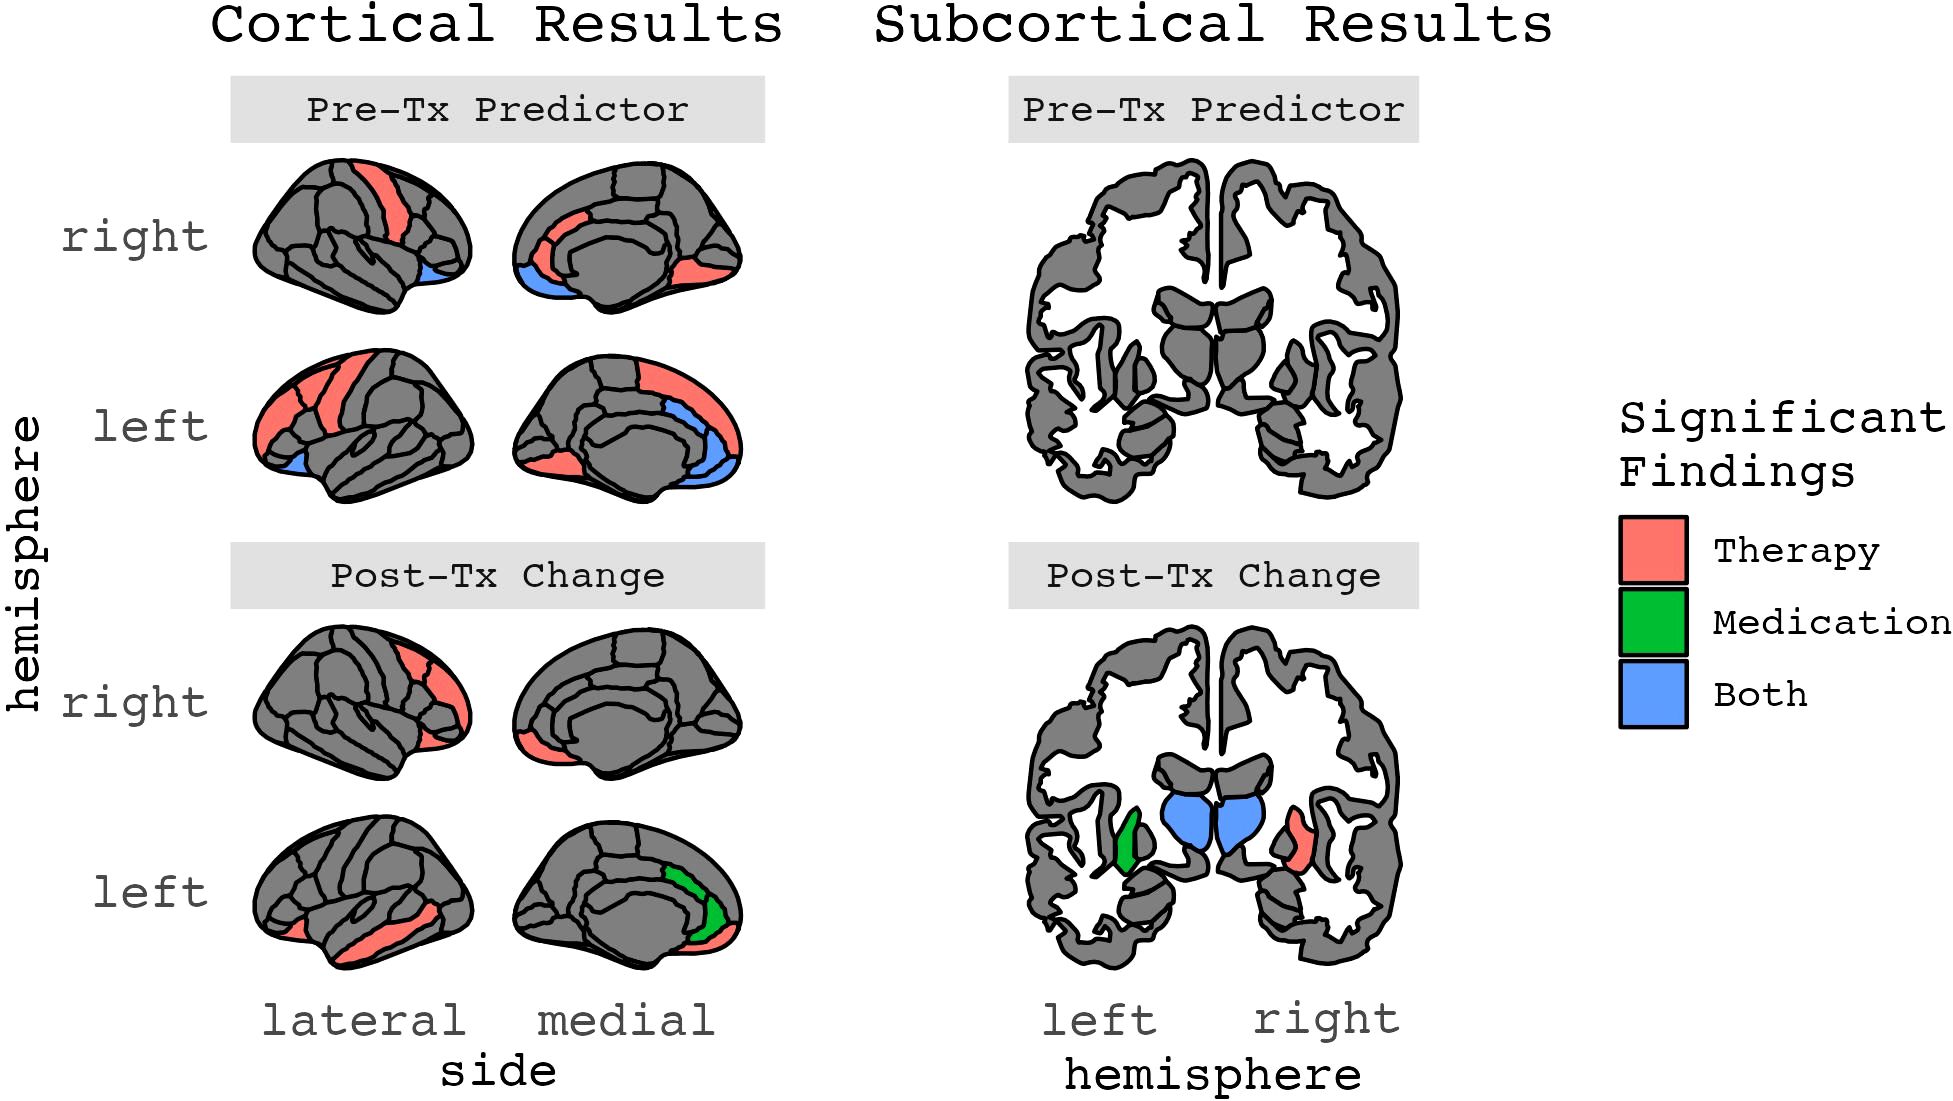
Figure 5. Results for ROIs with two or more significant findings, grouped by whether they were a treatment response predictor or change after treatment (Figures 2-5 in color).
Of four adult studies (nsamples=4; npublications=4), three reported on pre-treatment brain volume correlates of therapy-related symptom change (55, 56, 71) and two reported on pre-treatment differences between therapy responders and non-responders (54, 55). With the exception of Hoexter et al. (71), all of these studies included concurrent medication that originated prior to psychotherapy in at least some or all patients.
Among the three studies of pre-treatment brain structure and symptom change following psychotherapy, two (nOCD1 = 74, nOCD2 = 39) reported no significant associations between pre-treatment brain volume and therapy-related symptom change (55, 56). The third study of 15 patients treated for OCD, without concurrent medication, found that larger pre-treatment right medial prefrontal cortex gray matter volume (primarily in the subgenual cingulate) was associated with a greater reduction in OCD symptoms following therapy (71).
The two studies that evaluated treatment responders relative to non-responders both identified significant associations. In contrast to null findings described above when analyzing all OCD patients together, Hashimoto and colleagues (2014) found that eventual treatment responders (n=24) were characterized by larger prefrontal gray matter volumes in the bilateral anterior cingulate cortex, right orbitofrontal cortex, and right precentral gyrus in addition to larger white matter volumes in the left cingulum and superior frontal region at baseline when compared to non-responders (n=15) (55). Notably, the observed larger right anterior cingulate gray matter volume aligns with the finding from Hoexter and colleagues (2013) reviewed above. The second study found that responders (n=14) had larger left middle frontal gyrus gray matter volumes at baseline relative to non-responders (n=17) (54).
The two pediatric studies (nOCD1 = 28, nOCD2 = 29) of volume correlates and predictors of psychotherapy treatment response produced null findings (57, 73). Vattimo and colleagues (73) did note that larger pre-treatment caudate volume was associated with improved treatment response in analyses that combined therapy and medication treatment groups; however, this association was not significant in either the psychotherapy or medication treatment groups when considered independently (73).
In adult studies (nsamples=2; npublications=3), Hoexter and colleagues (2012) found no significant changes in gray matter volume associated with therapy (n=13) (72). The other sample (n=12), which examined volumes of the thalamus, orbitofrontal cortex, and pituitary gland only, reported that therapy-related symptom reductions were associated with decreases in bilateral thalamus volume and increases in left orbitofrontal cortex volume (52) but no differences in pituitary gland volume (53).
The four pediatric publications (nsamples=3) evaluating changes in brain volume in the context of therapy have produced inconsistent findings. One found significant volume increases in the parietal lobes, which normalized to the level of healthy controls, however these patients (n=15) were also on SSRIs during treatment (74). Another study (n=11) found no significant changes in thalamic volume after therapy, the only region of interest (ROI) assessed (60). A third pediatric study of OCD patients found that, much like an adult study (53), treatment was associated with increases in orbitofrontal cortex gray matter volume at the end of therapy (n=26) and one and half years later (n=17) (58, 59). Symptom improvement was positively correlated with orbitofrontal cortex gray matter volume at the completion of CBT but not follow-up (58). Notably, post-hoc analyses that split subjects into younger (8-12 years old) and older (13-19 years old) groups revealed that treatment-related increases in OFC volume were only present among younger patients (58). In the original study reporting on findings immediately following the end of treatment (59), bilateral external capsule white matter volume was also significantly increased in OCD patients (n=26) relative to controls (n=27), however, in the smaller longitudinal sample (n=17 patients, 20 controls)1, this was not found at the end of treatment or one and half years later (58).
Three studies (n=1 from pediatric samples) examined pre-treatment cortical thickness measures associated with psychotherapeutic treatment response (Tables 1–3; Figures 2–5). No identified studies evaluated cortical thickness change in the context of psychotherapy. Total sample sizes ranged from 41 to 160 participants (mean ± SD = 85 ± 65), with OCD group sizes ranging from 28 to 74 before and after treatment (mean ± SD = 44 ± 26).
The two identified adult studies reported conflicting results. Fullana and colleagues (56) analyzed cortical thickness in the medial OFC, rostral anterior cingulate cortex, and subcallosal cortex and found that thinner left rostral anterior cingulate cortex at baseline was correlated with greater therapy-related symptom improvement (56). Group comparisons also showed that eventual treatment responders (n=35) had significantly thinner left rACC than eventual treatment non-responders (n=39). It is important to note, though, that these patients were also receiving pharmacotherapy throughout the study. The other adult study (70), unlike Fullana et al. (56), found significant results in the orbitofrontal cortex. In a secondary analysis of a randomized clinical trial comparing fluoxetine and group CBT, Hoexter and colleagues (70) examined the medial and lateral orbitofrontal cortex and found that OFC thickness significantly differentiated treatment responders (n=13, including therapy and medication groups) and non-responders (n=16, including therapy and medication groups), regardless of whether the patient received medication or therapy. Thicker left and thinner right medial OFC were associated with a higher probability of being a treatment responder.
The only pediatric study analyzing baseline cortical thickness measures found that thinner cortex in nine frontoparietal regions, especially the left supramarginal gyrus, significantly predicted clinical improvement after CBT (n=28) (57). The other significant regions included left angular, middle frontal, superior frontal, precentral and superior temporal gyri, along with right anterior insula and bilateral medial occipitotemporal and lingual sulci. These findings remained significant when excluding the four subjects who began taking SSRIs mid-therapy. Left supramarginal gyrus cortical thickness significantly predicted who responded to therapy, with 72.2% specificity and 90% specificity (AUC=86.67), which was significantly better than predictions based on pretreatment CY-BOCS (AUC=63.06). The effect size for the mean difference in supramarginal gyrus thickness between the responder (n=10) and non-responder (n=18) groups was also large (Cohen’s d=1.42).
No identified studies measured cortical thickness after psychotherapy.
Four studies (n=1 from a pediatric sample) examined whether pre-treatment diffusion metrics, which are measures of white matter properties and structural connectivity, were associated with psychotherapeutic treatment response (n=2) or changes in diffusion metrics after therapy (n=3) (Tables 1–3; Figures 2–5). Total sample sizes ranged from 55 to 175 participants (mean ± SD = 94 ± 55), with OCD group sizes ranging from 28 to 85 before treatment (mean ± SD = 45 ± 27) and 26 to 56 after treatment (mean ± SD = 29 ± 17).
Of the three adult studies (nsamples=3, npublications=3), one found no significant predictors (nOCD=26) (49), while the other two (nOCD1 = 34, nOCD2 = 56) found significant associations between changes in diffusion metrics and decreases in OCD symptoms after CBT but not baseline measures alone and post-treatment symptom scores (50, 51). Still, of note, the percent reduction in the Y-BOCS obsessions and compulsions subscale scores following CBT were significantly correlated with changes in FA and nodal clustering coefficients (Table 2).
The only identified pediatric diffusion study (nOCD=28) found that lower structural connectivity in ten cinguloopercular regions (anterior cingulate cortex, insular cortex, thalamus, putamen, and inferior, middle, and superior frontal sulci) at baseline predicted 50% of the variance in post-therapy CY-BOCS scores, even when controlling for demographics and pre-treatment severity. However, associations were no longer statistically significant after accounting for comorbid anxiety disorders (57).
In adult studies (nsamples=3, npublications=3), Brecke and colleagues’ (49) analyses did not reveal any significant changes in diffusion measures three months after a concentrated ERP treatment (nOCD post-tx=26). Zhong and colleagues ((51) reported that CBT responders (n=38) had increased FA after therapy in the left orbitofrontal cortex and middle temporal gyrus and right middle frontal gyrus and cerebellum, as well as decreased FA in the right putamen; these values were no longer significantly different from controls (n=90). Using graph theory techniques, Cao and colleagues (50) reported that after treatment CBT responders (n=26) had significantly decreased global and nodal clustering coefficients in the left lingual, middle temporal, fusiform, and precuneus gyri. Notably, CBT non-responders (n=8) also had significantly decreased nodal clustering coefficients after treatment in the left lingual gyrus, as well as left thalamus, along with increased nodal shortest path length of the right middle occipital gyrus.
No identified pediatric studies measured changes in diffusion after psychotherapy.
The 14 medication OCD treatment outcome publications (n=4 from pediatric samples) originated from ten independent samples (n=3 from pediatric samples) (Table 1). One study administered medication and therapy concurrently to all subjects (74). Total sample sizes ranged from 22 to 131 participants (mean ± SD = 44 ± 29), with OCD group sizes ranging from 11 to 56 before treatment (mean ± SD = 25 ± 12) and 10 to 56 after treatment (mean ± SD = 22 ± 13).
Samples contained patients who were: drug naïve (nsamples=6, npublications=10); previously treated with medication but not currently using medication or never having used medication to treat OCD (nsamples= 3, npublications=3); or not taking medication within the past four weeks but the status of previous usage was not described (nsamples=1, npublications=1). Regarding previous or current psychotherapy, five publications (nsamples=3) explicitly stated that OCD patients had not previously received any therapy (nsamples=2, npublications=2) or more than 12 sessions of CBT (nsamples=1, npublications=3). Three studies (nsamples=3) also reported that patients did not receive therapy while taking medications and a fourth stated that concurrent supportive or family therapy, but not CBT, was allowed.
Four studies (nsamples=4) estimated associations across the whole brain using whole-brain voxel-based morphometry (npublications=2) or voxel-based diffusion analyses (npublications=1) with another analyzing all atlas cortical ROIs. Six publications (nsamples=3/4: Szeszko et al. (68) and Gilbert et al. (69) were largely, but not completely, overlapping samples) analyzed specific ROIs only. Four publications (nsamples=3) used both ROI and whole brain voxel-wise analyses. The following specific ROIs were examined across studies (n=number of publications): orbitofrontal cortex (n=6), thalamus (n=5), caudate (n=4), amygdala (n=3), anterior cingulate cortex (n=3), putamen (n=2), hippocampus (n=2), parahippocampal gyrus (n=2), pallidum (n=1), pituitary gland (n=1), and dorsolateral prefrontal cortex (n=1).
Ten publications (n=4 from pediatric samples) from seven independent studies estimated pre-treatment volume measures associated with pharmacological treatment response (npublications=3; 1 of which was in a pediatric sample) or changes in brain volume after pharmacotherapy (npublications=7; 3 of which were in pediatric samples) (Tables 1–3; Figures 2–5). Total sample sizes ranged from 22 to 74 participants (mean ± SD = 37 ± 16), with OCD group sizes ranging from 11 to 38 before treatment (mean ± SD = 22 ± 9) and 10 to 29 after treatment (mean ± SD = 19 ± 8).
In adult studies (nsamples=2; npublications=2), larger baseline left anterior cingulate cortex volume was correlated with greater symptom reduction after two to five years of SSRI treatment (n=29) (65). A therapy study found similar findings, though they were in the right hemisphere (55). The second study reported that smaller baseline right middle lateral orbitofrontal cortex volume was associated with greater symptom reduction after twelve weeks of fluoxetine (a type of SSRI) treatment (n=14) (71).
The only identified pediatric study found a trending association for larger pre-treatment caudate volume in analyses that combined therapy and medication treatment groups (n=29), with the right caudate accounting for 20.2% of the variance in Y-BOCS score changes after treatment (73). However, this finding did not hold in follow-up analyses testing the two treatment groups separately (nmedication=12, ntherapy=17).
Of the adult studies (nsamples=3; npublications=4), one found decreased thalamic volume after pharmacotherapy (n=14) (61), while another study found increased volume after treatment (63). However, Tang and colleagues (63) only rescanned patients who were deemed treatment responders (defined as greater than 50% decrease in Y-BOCS score, n=11), which could be driving this discrepancy. Atmaca and colleagues (61) reported that the changes in left thalamic volume were significantly correlated with changes in symptom severity after 12 weeks of SSRI or clomipramine treatment. Other identified volumetric changes after medication included larger pituitary gland (62), left putamen (63, 72) and left anterior and posterior cingulate gyri (63), although, again, the findings from Tang and colleagues were restricted to scans from treatment responders.
Of the pediatric studies (nsamples=2; npublications=3), one found no statistically significant changes in volume after treatment, although the patients (n=15) received both therapy and medication, so the effect of medication cannot be ascertained (74). Two others, based on substantially overlapping samples (n1 = 10, n2 = 11) but examining two different ROIs, found decreased thalamic (69) and left amygdala (68) volumes after 16 weeks of paroxetine treatment, decreasing by 19% and 15% respectively. Gilbert and colleagues (69) found that the observed decreases in thalamic volume were correlated with greater symptom improvement, while Szeszko and colleagues (68) did not find a significant association between the observed decreases in left amygdala volume and changes in symptom levels.
Two identified studies, both from adult samples, assessed whether pre-treatment cortical thickness measures were associated with treatment response to medications (Tables 1–3; Figures 2–5). One of these studies also examined surface area metrics. No identified studies evaluated changes in cortical thickness or surface area after medication treatment. Total sample sizes ranged from 41 to 131 participants (mean ± SD = 86 ± 64), with OCD group sizes ranging from 29 to 56 before and after treatment (mean ± SD = 43 ± 19).
In one study, a support vector machine classified OCD patients (n=56) receiving pharmacotherapy as responders (i.e., > 35% decrease in Y-BOCS) or non-responders with 89% accuracy based on combinations of pre-treatment cortical thickness and surface area individualized structural covariances (ISCs) included as feature sets in the classifier (64). This classifier included five cortical surface area-based and seven cortical thickness-based ISCs. Yun and colleagues found that the cortical thickness ISC between the right dorsolateral prefrontal cortex and left precuneus was critical for successfully classifying responders, while the cortical surface area ISC between left anterior insula and intraparietal sulcus was critical for successfully classifying non-responders.
The second study, a secondary analysis of an RCT comparing fluoxetine and group CBT treatments for OCD, described in the therapy section above, analyzed the medial and lateral orbitofrontal cortex and found in a logistic regression model that baseline OFC thickness significantly differentiated treatment responders (n=13, including therapy and medication groups) and non-responders (n=16, including therapy and medication groups) (accuracy 79.3%, sensitivity 77%, specificity 81%, area under the receiver operating curve of 0.88), regardless of whether the patient received medication or therapy (70). Thicker left and thinner right medial OFC were associated with a higher probability of being a treatment responder.
No identified studies measured changes in cortical thickness or surface area after medication treatment.
Two identified studies, both adult samples, estimated pre-treatment diffusion measures associated with treatment response (n=1) or changes in diffusion metrics after pharmacotherapy (n=2) (Tables 1–3; Figures 2–5). Total sample sizes ranged from 26 to 50 participants (mean ± SD = 38 ± 17), with OCD group sizes ranging from 13 to 27 before treatment (mean ± SD = 20 ± 10) and 13 to 15 after treatment (mean ± SD = 14 ± 1).
Fan and colleagues (66) reported that baseline RD values in the left striatum and right midbrain, as well as baseline MD values in the right midbrain, were significantly correlated with decreases in Y-BOCS compulsive subscale scores after 12 weeks of SSRI treatment (n=15). It is unclear if Yoo et al. (67) (n=13) examined whether baseline diffusion measures were associated with treatment response, however they reported that changes in FA after 12 weeks of citalopram treatment did not correlate with changes in Y-BOCS scores.
One study (n=15) reported no significant changes in FA values after 12 weeks of SSRI treatment (66) while the other (n=13) reported that right posterior thalamic radiation FA values decreased after 12 weeks of citalopram treatment (67). For Yoo and colleague’s patients, higher FA values, compared to controls, observed at baseline were mostly normalized after treatment, except in the left corpus callosum and right superior temporal region. Right midbrain RD and MD, along with left striatum RD, which had all been significantly higher in patients than controls at baseline, also decreased significantly after pharmacotherapy (66).
Our systematic review of MRI-derived brain structure correlates of psychotherapeutic and pharmacologic treatment response among patients with OCD revealed that despite some intriguing correlations, there is limited consistency across studies. Regions of the cortico-striatal-thalamocortical circuit, including the orbitofrontal and anterior cingulate cortices, thalamus, and putamen, predicted treatment response at baseline or changed longitudinally alongside treatment. However, caution is needed in drawing strong conclusions from the existing literature as sample sizes were mostly small (i.e., OCD groups ranging from 11 to 74) and replication was rare.
Indeed, no regions showed replication in the same hemisphere and imaging and treatment modalities across more than two studies. The lack of consistency in this literature may reflect the limited association between treatment response and brain structure and/or methodological differences including heterogeneity in analyses (e.g., divergent regions of interest examined), patients (e.g., pediatric, adult), and treatment regimens as well as low samples that would not permit the reliable estimation of associations that are small in magnitude. Below, we first describe overall trends in study findings as well as tentative evidence linking variability in cortico-striatal-thalamocortical structure to treatment response and potential mechanisms to explain these findings. We then discuss potential factors that may contribute to the limited number of consistent findings and highlight opportunities for this field including collaboration to boost sample sizes combined with novel multivariate analyses. While neuroimaging studies of treatment response have the potential to identify individual difference factors that may help personalize medicine and identify mechanisms of therapeutic response that may be leveraged to improve future treatments, larger samples will be needed before results will be sufficiently reliable.
The majority of studies found that some form of regional brain volume was associated with treatment response. Overall, numerous brain regions showed larger baseline volume associated with better treatment response [right OFC (55), bilateral ACC (55, 65, 71), left middle frontal gyrus (54), right precentral gyrus (55), left cingulum (55), left superior frontal white matter (55)]. Only one region, right orbitofrontal cortex, exhibited smaller baseline volume associated with better treatment response (71), although Hashimoto and colleagues (55) found the opposite. In contrast to volume, where larger was generally better, three studies examining cortical thickness all found thinner cortex at baseline was associated with improvement after treatment [left rostral ACC (56), right OFC (70), left angular, middle frontal, superior frontal, precentral and superior temporal gyri, right anterior insula, bilateral medial occipitotemporal and lingual sulci (57)] (although one study (70) also reported thicker cortex for the left OFC). On average, half or fewer of publications looking a priori at a region of interest reported significant results for that brain region.
While studies reported varying and sometimes conflicting results, key structures of the cortico-striato-thalamo-cortical circuit were implicated in many findings – the anterior cingulate, orbitofrontal cortex, thalamus, and putamen. The anterior cingulate is likely involved in action monitoring, error detection, and the expression of fear responses, which have all been implicated in OCD (20). Three out of five publications examining the ACC a priori reported significant results. Larger baseline anterior cingulate volume was correlated with better treatment response for both psychotherapy (55, 71) and pharmacotherapy (65) in three separate studies and in another treatment responders had increased ACC volume after treatment (63). Interestingly, however, thinner left ACC was found to be correlated with better response to psychotherapy (56). Meanwhile, the orbitofrontal cortex has been connected with reward processing and motor and response inhibition, a key component of compulsions (20). Five out of ten publications examining the OFC a priori reported significant results. Two studies found that OFC volume increased after therapy in both children (58, 59) and adults (53). Several studies also reported that OFC structural measures were correlated with treatment response, although the imaging phenotype, laterality, and direction of effects were inconsistent. In one study, larger right OFC baseline volume predicted better response to therapy (55), while in another decreases in left OFC volume after therapy were correlated with greater improvement (52). Further, smaller right OFC baseline volume was associated with better response to medications (71), the opposite direction of the therapy finding. Meanwhile, a cortical thickness study found that thicker left but thinner right medial OFC at baseline predicted better treatment response, regardless of modality (i.e., therapy or medication) (70). OFC white matter may also be affected by therapy, as Zhong and colleagues (2019) (51) found increased fractional anisotropy of the left OFC after therapy.
The thalamus relays sensory information as well as information between cortical and subcortical brain structures and possibly aids cognitive integration (75). Three out of seven publications examining the thalamus a priori reported significant results. Three studies reported decreased bilateral thalamic volume after treatment, including therapy (52) and medication (62, 69). However, another study, that only rescanned treatment responders (n=11), reported increased left thalamus volume after pharmacotherapy (63). Finally, the putamen is involved in motor function and other aspects of goal-directed behavior (76). One out of three publications examining the putamen a priori reported significant results. Left putamen volume increased after SSRI treatment in two studies (63, 72).
The mechanisms through which treatment may be related to brain structure are still up for debate. Treatment may normalize structural abnormalities or create compensatory neural mechanisms to address the abnormalities. Evidence suggests that SSRIs, the primary class of medications for OCD, change synaptic transmission, post-synaptic transcription growth factors and stimulate neurogenesis (35–38). Meanwhile, psychotherapy, especially cognitive-behavioral therapy and its exposure and response prevention (ERP) treatment for OCD, involves learning new cognitive and behavioral strategies, and learning processes have been linked to structural changes in the brain (39). In addition, fear extinction recall abilities, a key component to ERP success, have been associated with brain structure (specifically ventromedial prefrontal cortex thickness), so it is plausible that improvements in extinction recall following ERP would be correlated with changes in identified brain structures (40). Associations may also reflect neural changes following symptom reduction rather than a mechanism through which treatment causes change.
It is important to note that confounding factors besides treatment could also be influencing measured structural differences. Hydration levels, time of day, and head motion may affect structural MRIs (77–80). Successful treatment may also lead to improved health behaviors, such as better nutrition, hygiene, and exercise, which could themselves be linked to changes in brain structure (81, 82). Additionally, brain structure naturally changes across development (83) and most studies included subjects spanning wide age ranges (e.g., 18-65), which introduces age as a confound.
MRI-derived indices of brain structure are typically associated with behavior at small levels of effect that require large samples (e.g., Ns>8,000) to detect (84, 85). Such sample sizes are infeasible for individual treatment outcome studies and will require collaborative consortia to detect, such as ENIGMA and the Psychiatric Genomics Consortium (PGC). The small sample sizes of the current literature make it very likely that studies were underpowered, resulting in a host of issues such as imprecise association estimates, imprecise estimated effect sizes, low reproducibility, and reduced chances of detecting a true effect or, conversely, that “detected” effects are indeed true. Unfortunately, small sample sizes have historically been a common-place problem in neuroimaging studies, not just the ones included in the current review (86). One piece of evidence that suggests the current studies are underpowered is the discrepancy in findings for pretreatment patient versus control analyses for these small studies (not described in the current paper) compared to the large ENIGMA consortia results (described above in the Introduction). Additionally, there was within-sample inconsistency wherein removing some participants [e.g., for longitudinal analyses) resulted in differing findings (e.g., (58)]. The small samples and lower power, along with overfitting, may also explain why some effect sizes were extremely large (e.g., r >0.5). Guidelines for interpreting effect sizes vary; nevertheless, one set of recommendations based on 125 meta-analyses in psychology and psychiatry suggest that the Pearson correlation for most clinically important variables falls between 0.15 and 0.3 (87). For neuroimaging phenotypes, data from one of the largest neuroimaging and health studies, the UK Biobank, suggest that variance explained (i.e., R2) is commonly around 1% (88).
Even with sufficiently powered samples, it remains possible that MRI may have inadequate spatial resolution to detect changes associated with treatment. Given that the synaptic clef is approximately 20-40 nanometers wide, changes at the synaptic level, the primary mechanism of psychopharmacology, might be beyond the spatial resolution of MRI. Structural changes may be occurring on the nano- and micrometer, not millimeter, scale. Few studies in the existing literature acquired newly possible high-resolution data (i.e., higher than 1 millimeter cubed), and approximately two-thirds analyzed data from lower field strength (i.e., 1.5T) scanners, so these studies may especially be limited in their ability to detect treatment-related changes. Thus, translational models in non-human animals may be useful to test such putative mechanisms for pharmacological treatment [e.g., (89, 90)].
The wide array of methodologies employed in the reviewed studies reduces the pool of studies available to replicate findings. Beyond which brain structure metric was chosen, whether it be volume, cortical thickness, surface area, or diffusion-based measures, there are also different conceptual approaches, particularly voxel-based morphometry versus region-of-interest techniques, numerous software packages that implement these approaches and techniques in varying ways, and the numerous other “researcher degrees of freedom” (91) involved in a study. Many studies only looked at one or a few a priori ROIs, which often did not overlap between studies, making it difficult to determine whether identified findings would be replicated in other studies.
Studies varied on whether they included OCD patients with comorbid psychiatric disorders, and if so, which ones. 20 of the 26 publications analyzed samples that included comorbidities. Some permitted any coexisting disorder besides psychosis, while others allowed only comorbid depression. The remainder varied in which comorbidities were allowed. While OCD patients often meet criteria for other psychiatric disorders as well [e.g. 73-92% lifetime comorbidity rate (4, 92, 93)], increasing the external validity of such studies, other disorders will also exert effects on treatment efficacy, and possibly brain structure, making it difficult to isolate which findings can be attributed to OCD specifically. For example, a study comparing OCD patients with and without Major Depressive Disorder (MDD) found that patients with comorbid MDD had larger reductions of medial OFC gray matter volume than those with OCD alone (94). The ENIGMA OCD studies reported that adult OCD patients with comorbid anxiety had larger intracranial volume than those without comorbid anxiety but no group differences in cortical thickness or surface area for comorbid anxiety or depression (26, 27). However, they caution that these findings came from small samples, as many ENIGMA samples did not assess for or excluded patients with comorbidities, and separate ENIGMA studies of these disorders have reported associated structural abnormalities [e.g. (95)].
Some therapy studies (n=6) allowed OCD patients to concurrently be on psychoactive medications, although most required the dosage to remain stable throughout therapy. Indeed, one of these studies provided both therapy and medications to treatment-naïve pediatric patients (74). Multiple treatments confound findings and may have obscured patterns that otherwise would have proven consistent if all studies were restricted to a single treatment. It also makes it difficult to detect if effects differ for therapy versus medication. Two studies (n=4 publications) conducted randomized trials to compare therapy and medications (70–73). However, treatment group sizes were modest (n=12-19), limiting the ability to draw conclusions from these comparisons.
Studies also varied as to whether participants were treatment naïve, so baseline scans could be affected by previous treatment. Results from the ENIGMA studies suggest that medication status can impact structural findings as all but one observed difference between OCD patients and controls was no longer significant when comparing unmedicated patients and controls (26–28).
Larger samples are needed to understand brain structural correlates of OCD treatment; such samples may be achieved through consortia science wherein many smaller studies are pooled [e.g., ENIGMA, PGC (24, 96)]. In addition to being adequately powered to detect the expected small effects, consortia efforts can reduce methodological differences and other confounding factors such as comorbidities and polytreatment by providing sufficiently large subgroups for analyses that are not impacted by these factors.
Multivariate approaches that consider brain networks or all brain regions simultaneously can also better account for the dependent nature of brain structure, improving our ability to detect small effects (97). A recent review found that neuroimaging studies using multivariate pattern analysis techniques to classify OCD diagnosis had accuracies between 66-100% (98). Many of the treatment “prediction” studies in the current review analyzed data at a group level. For biomarkers to be used clinically, individual-level predictions will be needed using approaches such as logistic regression or machine learning. Machine learning techniques can adeptly implement multivariate analyses and provide data-driven predictions. However, this will require larger samples to produce generalizable results, which reinforces the need for future research using larger samples.
The large amount of between-study heterogeneity in design and analytic approach prevented us from conducting a meta-analysis. It also weakens our ability to draw strong conclusions from the literature. Another limitation of the current review is that unpublished or non-English studies were excluded, potentially leaving out relevant findings. While the “file drawer” problem is certainly problematic, the peer review process of publication theoretically should increase the level of rigor for included studies. In addition, the authors did not have the resources to adequately translate any potential non-English search results to determine if such studies otherwise met inclusion criteria.
Despite these limitations, the current systematic review holds many strengths as well. First, to our knowledge, this is the most comprehensive and up-to-date review of structural neuroimaging markers of treatment for OCD. Most existing reviews restricted their scope to either psychotherapy or pharmacotherapy, but not both. In addition, few included structural studies, with the majority only reporting on one or two structural studies at most. Second, we utilized reproducible and transparent systematic review processes, guided by PRISMA recommendations (45), to minimize the reporting biases that can exist in narrative literature reviews. Third, all studies used the same treatment outcome measure, the Y-BOCS, allowing for direct comparisons of treatment response across studies. Few other psychiatric disorders have a literature that utilizes a singular assessment tool, making it harder to conduct such direct comparisons. The OCD literature is very fortunate in this regard.
Our systematic review of brain structure correlates of psychotherapeutic and pharmacologic treatment response among patients with OCD revealed little consistent evidence that brain structure is associated with treatment response. Although structural neuroimaging markers are not yet clinically useful for OCD treatment prognosis or planning, further research is warranted. While potentially small effects and expense could place MRI behind other putative treatment response indicators (e.g., self-report, clinical assessments, genomics), MRI can provide unique mechanistic insights if successful treatment is associated with changes in the brain. In addition, the availability of structural brain scans in medical records and automated procedures being developed to evaluate brain structure in standard radiology workflows heighten the potential for more immediate clinical utility of structural MRI.
Future research should focus on consortia-based larger samples, higher resolution MRI data, and multivariate approaches to confirm our findings and identify other consistent and well-powered findings. There is also a need for more studies assessing cortical thickness, surface area, and diffusion, as these provide information on neurobiological processes distinct from volume which may be differentially altered by treatment for OCD. Finally, greater consistency in ROIs examined in future studies would allow for a meta-analysis to add quantitative insights to the debate on using structural neuroimaging markers in a personalized medicine approach to OCD treatment.
AM: Writing – original draft, Writing – review & editing, Conceptualization, Data curation, Formal analysis, Investigation, Methodology, Project administration, Visualization. IH: Project administration, Writing – original draft, Writing – review & editing, Data curation. RB: Project administration, Writing – original draft, Writing – review & editing, Conceptualization, Funding acquisition, Methodology, Resources, Supervision.
The author(s) declare financial support was received for the research, authorship, and/or publication of this article. Funding for this study was provided by the National Institutes of Health (R01AG061162). NIH had no role in the study design, collection, analysis, or interpretation of the data, writing the manuscript, or the decision to submit the paper for publication.
The authors wish to thank Mr. Justin Brooks who assisted in the abstract screening process. They would also like to thank Drs. Deanna Barch and Thomas Rodebaugh for providing feedback on an earlier version of this work.
The authors declare that the research was conducted in the absence of any commercial or financial relationships that could be construed as a potential conflict of interest.
All claims expressed in this article are solely those of the authors and do not necessarily represent those of their affiliated organizations, or those of the publisher, the editors and the reviewers. Any product that may be evaluated in this article, or claim that may be made by its manufacturer, is not guaranteed or endorsed by the publisher.
The Supplementary Material for this article can be found online at: https://www.frontiersin.org/articles/10.3389/fpsyt.2024.1432253/full#supplementary-material
1. Fawcett EJ, Power H, Fawcett JM. Women are at greater risk of OCD than men: A meta-analytic review of OCD prevalence worldwide. J Clin Psychiatry. (2020) 81:e1–13. doi: 10.4088/JCP.19r13085
2. DuPont RL, Rice DP, Shiraki S, Rowland CR. Economic costs of obsessive-compulsive disorder. Med Interface. (1995) 8:102–9.
3. Meier SM, Mattheisen M, Mors O, Schendel DE, Preben Mortensen B, Plessen KJ. Mortality among persons with obsessive-compulsive disorder in Denmark. JAMA Psychiatry. (2016) 73:268–74. doi: 10.1001/jamapsychiatry.2015.3105
4. Ruscio AM, Stein DJ, Chiu WT, Kessler RC. The epidemiology of obsessive-compulsive disorder in the National Comorbidity Survey Replication. Mol Psychiatry. (2010) 15:53–63. doi: 10.1038/mp.2008.94
5. Lack CW. Obsessive-compulsive disorder: Evidence-based treatments and future directions for research. World J Psychiatry. (2012) 2:86. doi: 10.5498/wjp.v2.i6.86
6. National Institute for Health and Care Excellence. Obsessive-compulsive disorder and body dysmorphic disorder: treatment (Issue Clinical Guideline 31) (2005). Available online at: https://www.nice.org.uk/guidance/cg31/resources/obsessivecompulsive-disorder-and-body-dysmorphic-disorder-treatment-975381519301 (Accessed August 2, 2021).
7. Skapinakis P, Caldwell DM, Hollingworth W, Bryden P, Fineberg NA, Salkovskis P, et al. Pharmacological and psychotherapeutic interventions for management of obsessive-compulsive disorder in adults: a systematic review and network meta-analysis. Lancet Psychiatry. (2016) 3:730–9. doi: 10.1016/S2215-0366(16)30069-4
8. Sharma E, Thennarasu K, Reddy YCJ. Long-term outcome of obsessive-compulsive disorder in adults. J Clin Psychiatry. (2014) 75:1019–27. doi: 10.4088/JCP.13r08849
9. Fernandes BS, Williams LM, Steiner J, Leboyer M, Carvalho AF, Berk M. The new field of “precision psychiatry. BMC Med. (2017) 15:1–7. doi: 10.1186/s12916-017-0849-x
10. Keeley ML, Storch EA, Merlo LJ, Geffken GR. Clinical predictors of response to cognitive-behavioral therapy for obsessive-compulsive disorder. Clin Psychol Rev. (2008) 28:118–30. doi: 10.1016/j.cpr.2007.04.003
11. Knopp J, Knowles S, Bee P, Lovell K, Bower P. A systematic review of predictors and moderators of response to psychological therapies in OCD: Do we have enough empirical evidence to target treatment? Clin Psychol Rev. (2013) 33:1067–81. doi: 10.1016/j.cpr.2013.08.008
12. First M, Botteron K, Carter C, Castellanos FX, Dickstein DP, Drevets W, et al. Consensus report of the APA work group on neuroimaging markers of psychiatric disorders. In: APA resource document Washington, D.C.: American Psychiatric Association (2012).
13. Bandelow B, Baldwin D, Abelli M, Altamura C, Dell’Osso B, Domschke K, et al. Biological markers for anxiety disorders, OCD and PTSD—A consensus statement Part I: Neuroimaging and genetics. World J Biol Psychiatry. (2016) 17:321–65. doi: 10.1080/15622975.2016.1181783
14. Boeke EA, Holmes AJ, Phelps EA. Toward robust anxiety biomarkers: A machine learning approach in a large-scale sample. Biol Psychiatry: Cogn Neurosci Neuroimaging. (2019) 5:1–9. doi: 10.1016/j.bpsc.2019.05.018
15. Elliott ML, Romer A, Knodt AR, Hariri AR. A connectome-wide functional signature of transdiagnostic risk for mental illness. Biol Psychiatry. (2018) 84:452–9. doi: 10.1016/j.biopsych.2018.03.012
16. Rashid B, Calhoun V. Towards a brain-based predictome of mental illness. Hum Brain Mapp. (2020) 41:3468–535. doi: 10.1002/hbm.25013
17. Fullana MA, Abramovitch A, Via E, López-Sola C, Goldberg X, Reina N, et al. Diagnostic biomarkers for obsessive-compulsive disorder: A reasonable quest or ignis fatuus. Neurosci Biobehav Rev. (2020) 118:504–13. doi: 10.1016/j.neubiorev.2020.08.008
18. Enneking V, Leehr EJ, Dannlowski U, Redlich R. Brain structural effects of treatments for depression and biomarkers of response: A systematic review of neuroimaging studies. psychol Med. (2019) 50:187–209. doi: 10.1017/S0033291719003660
19. Graybiel AM, Rauch SL. Toward a neurobiology of obsessive-compulsive disorder. Neuron. (2000) 28:343–7. doi: 10.1016/S0896-6273(00)00113-6
20. Milad MR, Rauch SL. Obsessive-compulsive disorder: beyond segregated cortico-striatal pathways. Trends Cogn Sci. (2012) 16:43–51. doi: 10.1016/j.tics.2011.11.003
21. Pauls DL, Abramovitch A, Rauch SL, Geller DA. Obsessive-compulsive disorder: An integrative genetic and neurobiological perspective. Nat Rev Neurosci. (2014) 15:410–24. doi: 10.1038/nrn3746
22. Shephard E, Stern ER, van den Heuvel OA, Costa DLC, Batistuzzo MC, Godoy PBG, et al. Toward a neurocircuit-based taxonomy to guide treatment of obsessive–compulsive disorder. Mol Psychiatry. (2021) 26:4583–604. doi: 10.1038/s41380-020-01007-8
23. Stein DJ, Costa DLC, Lochner C, Miguel EC, Reddy YCJ, Shavitt RG, et al. Obsessive–compulsive disorder. Nat Rev Dis Primers. (2019) 5:1–21. doi: 10.1038/s41572-019-0102-3
24. Thompson PM, Jahanshad N, Ching CRKK, Salminen LE, Thomopoulos SI, Bright J, et al. ENIGMA and global neuroscience: A decade of large-scale studies of the brain in health and disease across more than 40 countries. Trans Psychiatry. (2020) 10:1–28. doi: 10.1038/s41398-020-0705-1
25. van den Heuvel OA, Boedhoe PSWW, Bertolin S, Bruin WB, Francks C, Ivanov I, et al. An overview of the first 5 years of the ENIGMA obsessive–compulsive disorder working group: The power of worldwide collaboration. Hum Brain Mapping hbm. (2022) 43(1):24972. doi: 10.1002/hbm.24972
26. Boedhoe PSW, Schmaal L, Abe Y, Ameis SH, Arnold PD, Batistuzzo MC, et al. Distinct subcortical volume alterations in pediatric and adult OCD: A worldwide meta- and mega-analysis. Am J Psychiatry. (2017) 174:60–9. doi: 10.1176/appi.ajp.2016.16020201
27. Boedhoe PSW, Schmaal L, Abe Y, Alonso P, Ameis SH, Anticevic A, et al. Cortical abnormalities associated with pediatric and adult obsessive-compulsive disorder: Findings from the ENIGMA obsessive-compulsive disorder working group. Am J Psychiatry. (2018) 175:453–62. doi: 10.1176/appi.ajp.2017.17050485
28. Piras F, Piras F, Abe Y, Agarwal SM, Anticevic A, Ameis S, et al. White matter microstructure and its relation to clinical features of obsessive–compulsive disorder: findings from the ENIGMA OCD Working Group. Trans Psychiatry. (2021) 11:1–11. doi: 10.1038/s41398-021-01276-z
29. Bruin WB, Taylor L, Thomas RM, Shock JP, Zhutovsky P, Abe Y, et al. Structural neuroimaging biomarkers for obsessive-compulsive disorder in the ENIGMA-OCD consortium: medication matters. Trans Psychiatry. (2020) 10:1–12. doi: 10.1038/s41398-020-01013-y
30. Frydman I, de Salles Andrade JB, Vigne P, Fontenelle LF. Can neuroimaging provide reliable biomarkers for obsessive-compulsive disorder? A Narrative Review. Curr Psychiatry Rep. (2016) 18:90. doi: 10.1007/s11920-016-0729-7
31. Hazari N, Narayanaswamy JC, Arumugham SS. Predictors of response to serotonin reuptake inhibitors in obsessive-compulsive disorder. Expert Rev Neurother. (2016) 16:1175–91. doi: 10.1080/14737175.2016.1199960
32. Thorsen AL, van den Heuvel OA, Hansen B, Kvale G. Neuroimaging of psychotherapy for obsessive–compulsive disorder: A systematic review. Psychiatry Research: Neuroimaging. (2015) 233:306–13. doi: 10.1016/j.pscychresns.2015.05.004
33. Birn RM, Molloy EK, Patriat R, Parker T, Meier TB, Kirk GR, et al. The effect of scan length on the reliability of resting-state fMRI connectivity estimates. NeuroImage. (2013) 83:550–8. doi: 10.1016/j.neuroimage.2013.05.099
34. Elliott ML, Knodt AR, Ireland D, Morris ML, Poulton R, Ramrakha S, et al. What is the test-retest reliability of common task-functional MRI measures? New Empirical Evidence Meta-Analysis. psychol Sci. (2020) 31:792–806. doi: 10.1177/0956797620916786
35. Czéh B, Müller-Keuker JIH, Rygula R, Abumaria N, Hiemke C, Domenici E, et al. Chronic social stress inhibits cell proliferation in the adult medial prefrontal cortex: Hemispheric asymmetry and reversal by fluoxetine treatment. Neuropsychopharmacology. (2007) 32:1490–503. doi: 10.1038/sj.npp.1301275
36. Kodama M, Fujioka T, Duman RS. Chronic olanzapine or fluoxetine administration increases cell proliferation in hippocampus and prefrontal cortex of adult rat. Biol Psychiatry. (2004) 56:570–80. doi: 10.1016/j.biopsych.2004.07.008
37. Soumier A, Banasr M, Goff LK, Daszuta A. Region- and phase-dependent effects of 5-HT1A and 5-HT2C receptor activation on adult neurogenesis. Eur Neuropsychopharmacol. (2010) 20:336–45. doi: 10.1016/j.euroneuro.2009.11.007
38. Willner P, Scheel-Krüger J, Belzung C. The neurobiology of depression and antidepressant action. Neurosci Biobehav Rev. (2013) 37:2331–71. doi: 10.1016/j.neubiorev.2012.12.007
39. Draganski B, Gaser C, Kempermann G, Kuhn HG, Winkler J, Büchel C, et al. Temporal and spatial dynamics of brain structure changes during extensive learning. J Neurosci. (2006) 26:6314–7. doi: 10.1523/JNEUROSCI.4628-05.2006
40. Milad MR, Quinn BT, Pitman RK, Orr SP, Fischl B, Rauch SL. Thickness of ventromedial prefrontal cortex in humans is correlated with extinction memory. Proc Natl Acad Sci United States America. (2005) 102:10706–11. doi: 10.1073/pnas.0502441102
41. Bijanki KR, Pathak YJ, Najera RA, Storch EA, Goodman WK, Simpson HB, et al. Defining functional brain networks underlying obsessive-compulsive disorder (OCD) using treatment-induced neuroimaging changes: a systematic review of the literature. J Neurology Neurosurgery Psychiatry. (2021) 92:776–86. doi: 10.1136/jnnp-2020-324478
42. Maron E, Nutt D. Biological predictors of pharmacological therapy in anxiety disorders. Dialogues Clin Neurosci. (2015) 17:305–17. doi: 10.31887/DCNS.2015.17.3/emaron
43. Sagarwala R, Nasrallah HA. A systematic review of diffusion tensor imaging studies in drug-naïve OCD patients before and after pharmacotherapy. Ann Clin Psychiatry: Off J Am Acad Clin Psychiatrists. (2020) 32:42–7.
44. Weingarten CP, Strauman TJ. Neuroimaging for psychotherapy research: Current trends. Psychother Res. (2015) 25:185–213. doi: 10.1080/10503307.2014.883088
45. Page MJ, McKenzie JE, Bossuyt PM, Boutron I, Hoffmann TC, Mulrow CD, et al. The PRISMA 2020 statement: An updated guideline for reporting systematic reviews. BMJ. (2021) 372:1–9. doi: 10.1136/bmj.n71
46. Wallace BC, Small K, Brodley CE, Lau J, Trikalinos TA. Deploying an interactive machine learning System in an evidence-based practice center: abstrackr. In: Proceedings of the 2nd ACM SIGHIT international health informatics symposium (2012). p. 819–23.
47. Goodman WK, Price LH, Rasmussen SA, Mazure C, Fleischmann RL, Hill CL, et al. The yale-brown obsessive-compulsive scale (Y-BOCS): I. Delevopment, use, and reliability. Arch Gen Psychiatry. (1989) 46:1006–16. doi: 10.1001/archpsyc.1989.01810110048007
48. Scahill L, Riddle MA, McSwiggin-Hardin M, Ort SI, King RA, Goodman WK, et al. Children’s yale-brown obsessive compulsive scale: reliability and validity. J Am Acad Child Adolesc Psychiatry. (1997) 36:844–52. doi: 10.1097/00004583-199706000-00023
49. Brecke V, Thorsen AL, Ousdal OT, Vriend C, Alnaes D, Hagen K, et al. Diffusion tensor imaging before and 3 months after concentrated exposure response prevention in obsessive-compulsive disorder. Front Psychiatry. (2021) 12:674020. doi: 10.3389/fpsyt.2021.674020
50. Cao R, Yang X, Luo J, Wang P, Meng F, Xia M, et al. The effects of cognitive behavioral therapy on the whole brain structural connectome in unmedicated patients with obsessive-compulsive disorder. Prog Neuropsychopharmacol Biol Psychiatry. (2021) 104:1–12. doi: 10.1016/j.pnpbp.2020.110037
51. Zhong Z, Yang X, Cao R, Li P, Li Z, Lv L, et al. Abnormalities of white matter microstructure in unmedicated patients with obsessive-compulsive disorder: Changes after cognitive behavioral therapy. Brain Behav. (2019) 9:e01201. doi: 10.1002/brb3.1201
52. Atmaca M, Yildirim H, Yilmaz S, Caglar N, Baykara S, Kekilli Y, et al. Pituitary gland volumes in patients with obsessive-compulsive disorder before and after cognitive-behavioral therapy. Braz J Psychiatry. (2018) 40:420–3. doi: 10.1590/1516-4446-2017-2449
53. Atmaca M, Yildirim H, Yilmaz S, Caglar N, Mermi O, Korkmaz S, et al. Orbito-frontal cortex and thalamus volumes in the patients with obsessive-compulsive disorder before and after cognitive behavioral therapy. Int J Psychiatry Med. (2018) 53:243–55. doi: 10.1177/0091217415621038
54. Tsuchiyagaito A, Hirano Y, Asano K, Oshima F, Nagaoka S, Takebayashi Y, et al. Cognitive-behavioral therapy for obsessive–compulsive disorder with and without autism spectrum disorder: Gray matter differences associated with poor outcome. Front Psychiatry. (2017) 8:143. doi: 10.3389/fpsyt.2017.00143
55. Hashimoto N, Nakaaki S, Kawaguchi A, Sato J, Kasai H, Nakamae T, et al. Brain structural abnormalities in behavior therapy-resistant obsessive-compulsive disorder revealed by voxel-based morphometry. Neuropsychiatr Dis Treat. (2014) 10:1987–96. doi: 10.2147/NDT.S69652
56. Fullana MA, Cardoner N, Alonso P, Subirà M, López-Solà C, Pujol J, et al. Brain regions related to fear extinction in obsessive-compulsive disorder and its relation to exposure therapy outcome: A morphometric study. psychol Med. (2014) 44:845–56. doi: 10.1017/S0033291713001128
57. Pagliaccio D, Cha J, He X, Cyr M, Yanes-Lukin P, Goldberg P, et al. Structural neural markers of response to cognitive behavioral therapy in pediatric obsessive-compulsive disorder. J Child Psychol Psychiatry. (2020) 61:1299–308. doi: 10.1111/jcpp.13191
58. Huyser C, van den Heuvel OA, Wolters L, De Haan E, Lindauer R, Veltman DJ. A longitudinal VBM study in paediatric obsessive–compulsive disorder at 2-year follow-up after cognitive behavioural therapy. World J Biol Psychiatry. (2014) 15:443–52. doi: 10.3109/15622975.2013.819122
59. Huyser C, van den Heuvel OA, Wolters LH, de Haan E, Boer F, Veltman DJ. Increased orbital frontal gray matter volume after cognitive behavioural therapy in paediatric obsessive compulsive disorder. World J Biol Psychiatry. (2013) 14:319–31. doi: 10.3109/15622975.2012.674215
60. Rosenberg DR, Benazon NR, Gilbert A, Sullivan A, Moore GJ. Thalamic volume in pediatric obsessive-compulsive disorder patients before and after cognitive behavioral therapy. Biol Psychiatry. (2000) 48:294–300. doi: 10.1016/S0006-3223(00)00902-1
61. Atmaca M, Mermi O, Yildirim H, Gurok MG. Orbito-frontal cortex and thalamus volumes in obsessive-compulsive disorder before and after pharmacotherapy. Brain Imaging Behav. (2016) 10:669–74. doi: 10.1007/s11682-015-9426-0
62. Atmaca M, Yildirim H, Mermi O, Gurok MG. Effects of anti-obsessional treatment on pituitary volumes in obsessive-compulsive disorder. Psychiatria Danubina. (2016) 28:58–62.
63. Tang W, Zhu Q, Gong X, Zhu C, Wang Y, Chen S. Cortico-striato-thalamo-cortical circuit abnormalities in obsessive-compulsive disorder: A voxel-based morphometric and fMRI study of the whole brain. Behav Brain Res. (2016) 313:17–22. doi: 10.1016/j.bbr.2016.07.004
64. Yun J-YY, Jang JH, Kim SN, Jung WH, Kwon JS. Neural correlates of response to pharmacotherapy in obsessive-compulsive disorder: Individualized cortical morphology-based structural covariance. Prog Neuropsychopharmacol Biol Psychiatry. (2015) 63:126–33. doi: 10.1016/j.pnpbp.2015.06.009
65. Narayanaswamy JC, Kalmady SV, Cherian AV, Venkatasubramanian G, Reddy JYC. Neuoranatomical correlates of naturalistic long-term outcome of obsessive-compulsive disorder treated with selective serotonin reuptake inhibitors. J Clin Psychopharmacol. (2014) 34:282–5. doi: 10.1097/JCP.0000000000000101
66. Fan Q, Yan X, Wang J, Chen Y, Wang X, Li C, et al. Abnormalities of white matter microstructure in unmedicated obsessive-compulsive disorder and changes after medication. PloS One. (2012) 7:1–9. doi: 10.1371/journal.pone.0035889
67. Yoo SY, Jang JH, Shin YW, Kim DJ, Park HJ, Moon WJJ, et al. White matter abnormalities in drug-naive patients with obsessive-compulsive disorder: a Diffusion Tensor Study before and after citalopram treatment. Acta Psychiatrica Scandinavica. (2007) 116:211–9. doi: 10.1111/j.1600-0447.2007.01046.x
68. Szeszko PR, MacMillan S, McMeniman M, Lorch E, Madden R, Ivey J, et al. Amygdala volume reductions in pediatric patients with obsessive–compulsive disorder treated with paroxetine: Preliminary findings. Neuropsychopharmacology. (2004) 29:826–32. doi: 10.1038/sj.npp.1300399
69. Gilbert AR, Moore GJ, Keshavan MS, Paulson LAD, Narula V, Mac Master FP, et al. Decrease in thalamic volumes of pediatric patients with obsessive–compulsive disorder who are taking paroxetine. Arch Gen Psychiatry. (2000) 57:449–56. doi: 10.1001/archpsyc.57.5.449
70. Hoexter MQ, Diniz JB, Lopes AC, Batistuzzo MC, Shavitt RG, Dougherty DD, et al. Orbitofrontal thickness as a measure for treatment response prediction in Obsessive-Compulsive Disorder. Depression Anxiety. (2015) 32:900–8. doi: 10.1002/da.22380
71. Hoexter MQ, Dougherty DD, Shavitt RG, D’Alcante CC, Duran FLSS, Lopes AC, et al. Differential prefrontal gray matter correlates of treatment response to fluoxetine or cognitive-behavioral therapy in obsessive–compulsive disorder. Eur Neuropsychopharmacol. (2013) 23:569–80. doi: 10.1016/j.euroneuro.2012.06.014
72. Hoexter MQ, de Souza Duran FL, D’Alcante CC, Dougherty DD, Shavitt RG, Lopes AC, et al. Gray matter volumes in obsessive-compulsive disorder before and after fluoxetine or cognitive-behavior therapy: A randomized clinical trial. Neuropsychopharmacology. (2012) 37:734–45. doi: 10.1038/npp.2011.250
73. Vattimo EFQ, Barros VB, Requena G, Sato JR, Fatori D, Miguel EC, et al. Caudate volume differences among treatment responders, non-responders and controls in children with obsessive–compulsive disorder. Eur Child Adolesc Psychiatry. (2019) 28:1607–17. doi: 10.1007/s00787-019-01320-w
74. Lázaro L, Bargalló N, Castro-Fornieles J, Falcón C, Andrés S, Calvo R, et al. Brain changes in children and adolescents with obsessive–compulsive disorder before and after treatment: A voxel-based morphometric MRI study. Psychiatry Research: Neuroimaging. (2009) 172:140–6. doi: 10.1016/j.pscychresns.2008.12.007
75. Wolff M, Vann SD. The cognitive thalamus as a gateway to mental representations. J Neurosci. (2019) 39:3–14. doi: 10.1523/JNEUROSCI.0479-18.2018
76. Haber SN. Corticostriatal circuitry. Dialogues Clin Neurosci. (2016) 18:7–21. doi: 10.1007/978-1-4614-6434-1_135-1
77. Butler T, Deshpande A, Harvey P, Li Y, Rusinek H, Pirraglia E, et al. Precisely-Measured Hydration Status Correlates with Hippocampal Volume in Healthy Older Adults. The American Journal of Geriatric Psychiatry (2019) 27(6):653–. doi: 10.1016/j.jagp.2019.02.006
78. Nakamura K, Brown RA, Narayanan S, Collins DL, Arnold DL, et al. Diurnal fluctuations in brain volume: Statistical analyses of MRI from large populations. NeuroImage (2015) 118:126–32. doi: 10.1016/j.neuroimage.2015.05.077
79. Reuter M, Tisdall MD, Qureshi A, Buckner RL, van der Kouwe AJW, Fischl B, et al. Head motion during MRI acquisition reduces gray matter volume and thickness estimates. NeuroImage. (2015) 107:107–15. doi: 10.1016/j.neuroimage.2014.12.006
80. Trefler A, Sadeghi N, Thomas AG, Pierpaoli C, Baker CI, Thomas C, et al. Impact of time-of-day on brain morphometric measures derived from T1-weighted magnetic resonance imaging. NeuroImage. (2016) 133:41–52. doi: 10.1016/j.neuroimage.2016.02.034
81. Croll PH, Voortman T, Ikram MA, Franco OH, Schoufour JD, Bos D, Vernooij MW, et al. Better diet quality relates to larger brain tissue volumes. Neurology. (2018) 90(24):e2155–65. doi: 10.1212/WNL.0000000000005691
82. Stillman CM, Esteban-Cornejo I, Brown B, Bender CM, Erickson KI, et al. Effects of Exercise on Brain and Cognition Across Age Groups and Health States. Trends in Neurosciences. (2020) 43(7):533–43. doi: https://doi.org/10.1016/j.tins.2020.04.010
83. Pomponio R, Erus G, Habes M, Doshi J, Srinivasan D, Mamourian E, et al. Harmonization of large MRI datasets for the analysis of brain imaging patterns throughout the lifespan. NeuroImage. (2020) 208.doi: 10.1016/j.neuroimage.2019.116450
84. Dick AS, Lopez DA, Watts AL, Heeringa S, Reuter C, Bartsch H, et al. Meaningful associations in the adolescent brain cognitive development study. NeuroImage. (2021) 239:118262. doi: 10.1016/j.neuroimage.2021.118262
85. Marek S, Tervo-Clemmens B, Calabro FJ, Montez DF, Kay BP, Hatoum AS, et al. Reproducible brain-wide association studies require thousands of individuals. Nature. (2022) 603:654–60. doi: 10.1038/s41586-022-04492-9
86. Button KS, Ioannidis JPA, Mokrysz C, Nosek BA, Flint J, Robinson ESJ, et al. Power failure: Why small sample size undermines the reliability of neuroscience. Nat Rev Neurosci. (2013) 14:365–76. doi: 10.1038/nrn3475
87. Meyer GJ, Finn SE, Eyde LD, Kay GG, Moreland KL, Eisman EJ, et al. Psychological testing and psychological assessment. Am Psychol. (2001) 56:128–65. doi: 10.1037//OOO3-O66X.56.2.128
88. Miller KL, Alfaro-Almagro F, Bangerter NK, Thomas DL, Yacoub E, Xu J, et al. Multimodal population brain imaging in the UK Biobank prospective epidemiological study. Nat Neurosci. (2016) 19:1523–36. doi: 10.1038/nn.4393
89. Álvarez-Salvado E, Pallarés V, Moreno A, Canals S. Functional MRI of long-term potentiation: Imaging network plasticity. Philos Trans R Soc B: Biol Sci. (2014) 369:1–11. doi: 10.1098/rstb.2013.0152
90. Okabe S. Imaging synapse formation and remodeling in vitro and in vivo. In Toyama Y, Miyawaki A, Nakamura M, Jinzaki M. (eds) Make Life Visible. Springer, Singapore. (2020), 187–97. doi: 10.1007/978-981-13-7908-6
91. Simmons JP, Nelson LD, Simonsohn U. False-positive psychology: Undisclosed flexibility in data collection and analysis allows presenting anything as significant. psychol Sci. (2011) 22:1359–66. doi: 10.1177/0956797611417632
92. Rintala H, Chudal R, Leppämäki S, Leivonen S, Hinkka-Yli-Salomäki S, Sourander A. Register-based study of the incidence, comorbidities and demographics of obsessive-compulsive disorder in specialist healthcare. BMC Psychiatry. (2017) 17:1–8. doi: 10.1186/S12888-017-1224-3/TABLS/2
93. Torres AR, Shavitt RG, Torresan RC, Ferrão YA, Miguel EC, Fontenelle LF. Clinical features of pure obsessive-compulsive disorder. Compr Psychiatry. (2013) 54:1042–52. doi: 10.1016/J.COMPPSYCH.2013.04.013
94. Cardoner N, Soriano-Mas C, Pujol J, Alonso P, Harrison BJ, Deus J, et al. Brain structural correlates of depressive comorbidity in obsessive-compulsive disorder. NeuroImage. (2007) 38:413–21. doi: 10.1016/j.neuroimage.2007.07.039
95. Schmaal L, Hibar DP, Sämann PG, Hall GB, Baune BT, Jahanshad N, et al. Cortical abnormalities in adults and adolescents with major depression based on brain scans from 20 cohorts worldwide in the ENIGMA Major Depressive Disorder Working Group. Mol Psychiatry. (2017) 22:900–9. doi: 10.1038/mp.2016.60
96. Watson HJ, Yilmaz Z, Sullivan PF. The psychiatric genomics consortium: History, development, and the future. In: Personalized psychiatry. London: Elsevier Inc (2019). doi: 10.1016/B978-0-12-813176-3.00009-2
97. McIntosh AR, Mišić B. Multivariate statistical analyses for neuroimaging data. Annu Rev Psychol. (2013) 64:499–525. doi: 10.1146/annurev-psych-113011-143804
Keywords: structural magnetic resonance imaging, treatment, psychotherapy, pharmacotherapy, neuromarkers, obsessive-compulsive disorder
Citation: Moreau AL, Hansen I and Bogdan R (2025) A systematic review of structural neuroimaging markers of psychotherapeutic and pharmacological treatment for obsessive-compulsive disorder. Front. Psychiatry 15:1432253. doi: 10.3389/fpsyt.2024.1432253
Received: 13 May 2024; Accepted: 19 December 2024;
Published: 13 February 2025.
Edited by:
Maria Strauss, University Hospital Leipzig, GermanyReviewed by:
Michele Poletti, IRCCS Local Health Authority of Reggio Emilia, ItalyCopyright © 2025 Moreau, Hansen and Bogdan. This is an open-access article distributed under the terms of the Creative Commons Attribution License (CC BY). The use, distribution or reproduction in other forums is permitted, provided the original author(s) and the copyright owner(s) are credited and that the original publication in this journal is cited, in accordance with accepted academic practice. No use, distribution or reproduction is permitted which does not comply with these terms.
*Correspondence: Allison L. Moreau, QWxsaXNvbi5Nb3JlYXVAbm9ydGh3ZXN0ZXJuLmVkdQ==; Ryan Bogdan, Ym9nZGFuLnJ5YW5AZ21haWwuY29t
Disclaimer: All claims expressed in this article are solely those of the authors and do not necessarily represent those of their affiliated organizations, or those of the publisher, the editors and the reviewers. Any product that may be evaluated in this article or claim that may be made by its manufacturer is not guaranteed or endorsed by the publisher.
Research integrity at Frontiers
Learn more about the work of our research integrity team to safeguard the quality of each article we publish.