 Sean Arthur Cully
 Malin Björnsdotter
- 1Department of Psychiatry for Affective Disorders, Sahlgrenska University Hospital, Gothenburg, Sweden
- 2Center for Cognitive and Computational Neuropsychiatry, Karolinska Institutet, Stockholm, Sweden
A Corrigendum on
Lateral prefrontal cortex thickness is associated with stress but not cognitive fatigue in exhaustion disorder
By Arthur Cully S and Björnsdotter M (2023). Front. Psychiatry. 14:1314667. doi: 10.3389/fpsyt.2023.1314667
In the published article, the SMBQ-CWE scores were incorrectly computed. This resulted in slight errors in the tables, figures and text, as listed below.
In the published article, there were errors in Table 1. The standard deviation and minimum number for SMBQ-CWE were incorrectly reported as 0.89 and 2.2, respectively. The corrected Table 1 and its caption appears below.
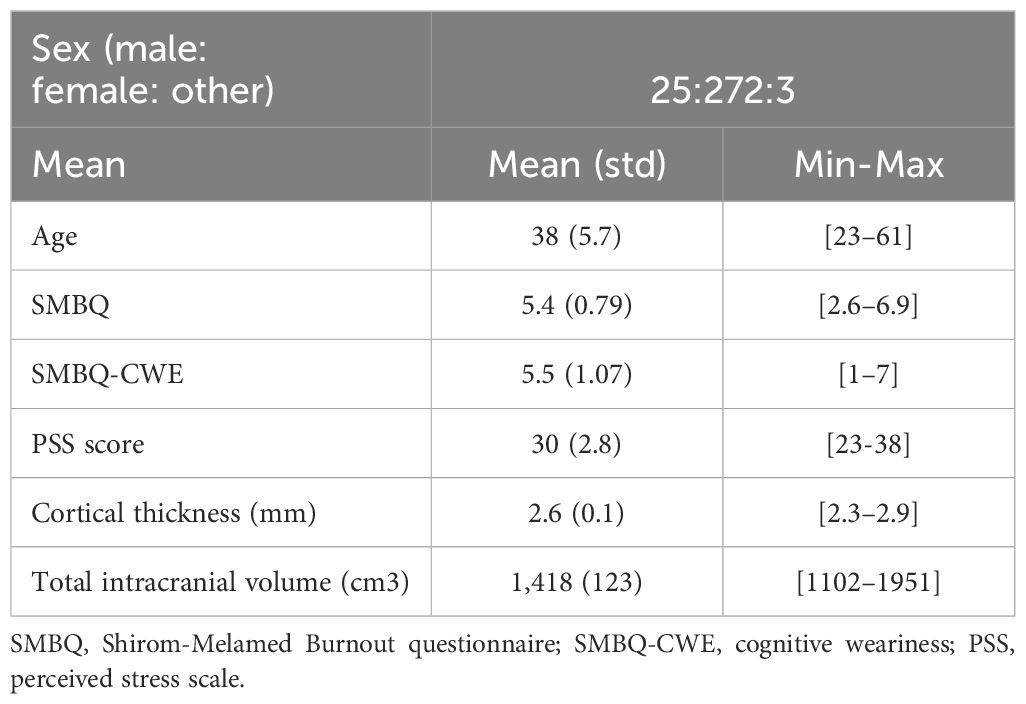
Table 1. Participant characteristics.
In the published article, there were errors in Table 2. The SMBQ-CWE data for ‘All participants (n = 300)’ and ‘Women only (n = 272)’ were incorrectly reported. The corrected Table 2 and its caption appear below.
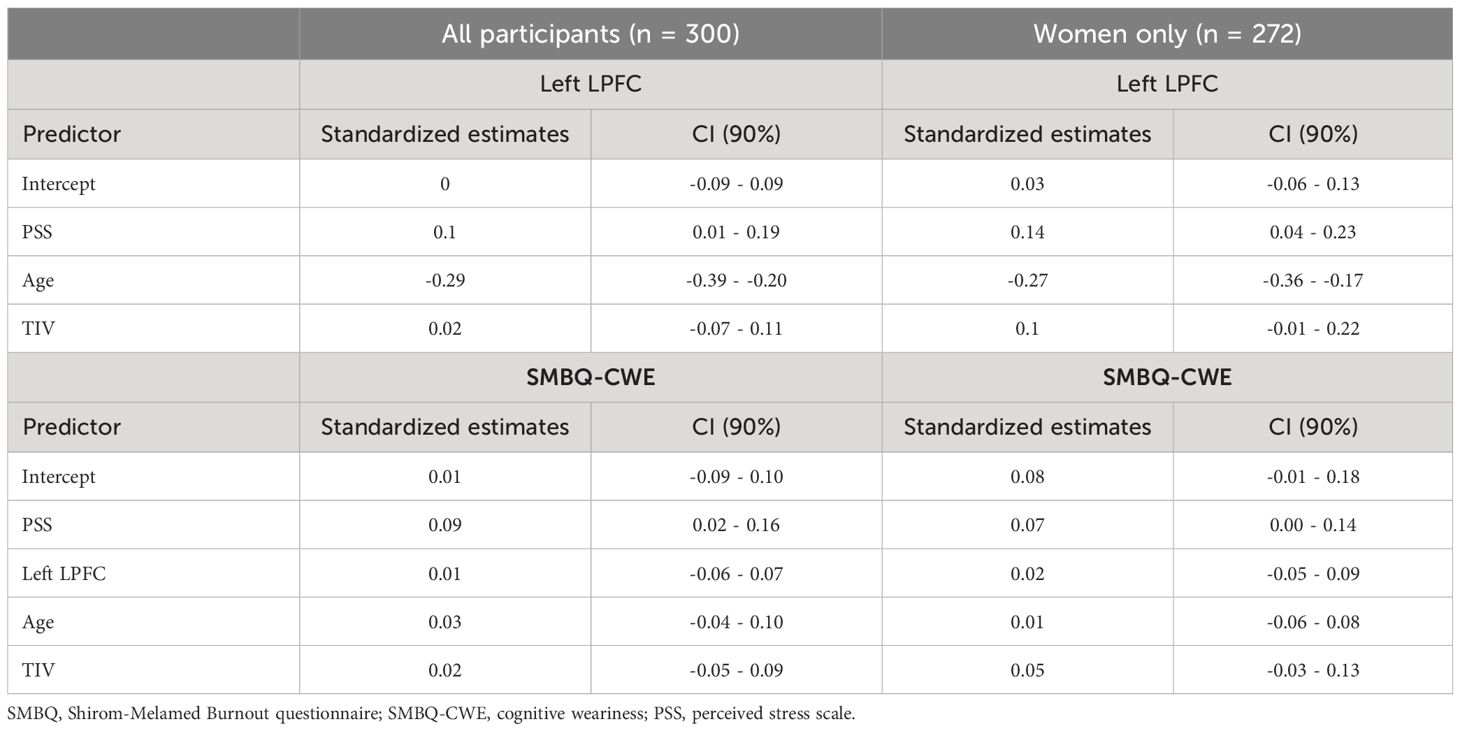
Table 2. Parameter estimates from the mediation model path analysis.
In the published article, there were errors in all data in Table 3. The corrected Table 3 and its caption appear below.
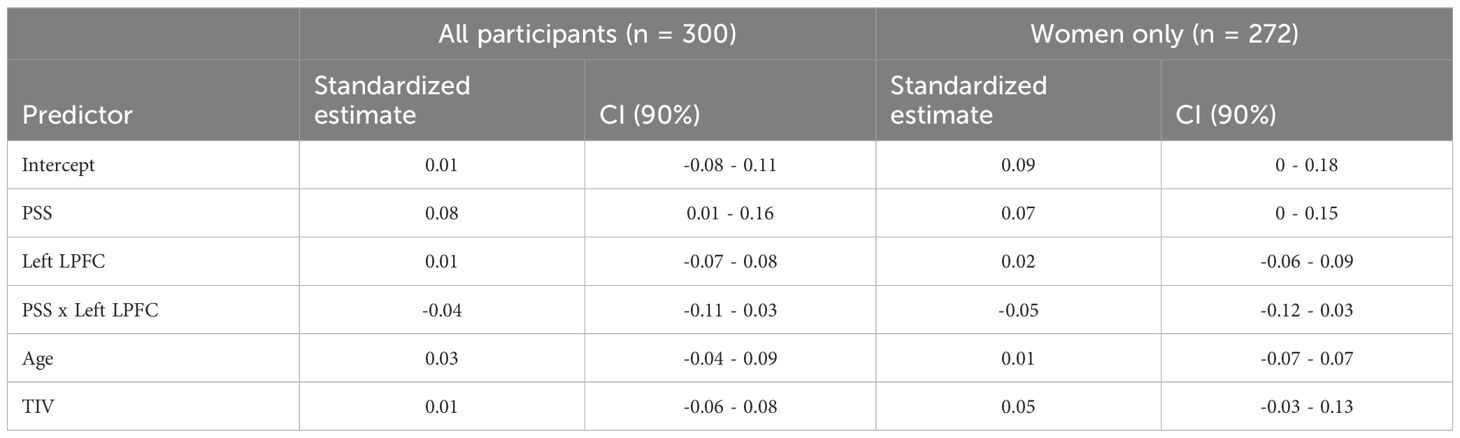
Table 3. Standardized moderation model parameter estimates.
In the Published article, there were errors in Figure 4. The scatter plot points and T scores for ‘(A) perceived stress and cognitive fatigue’, ‘(B) perceived stress and left lateral prefrontal cortex thickness’, and ‘(C) left lateral prefrontal cortex thickness and cognitive fatigue’, were incorrectly given as T = .09, T = .10 and T = .010, respectively. The corrected Figure 4 and its caption appear below.
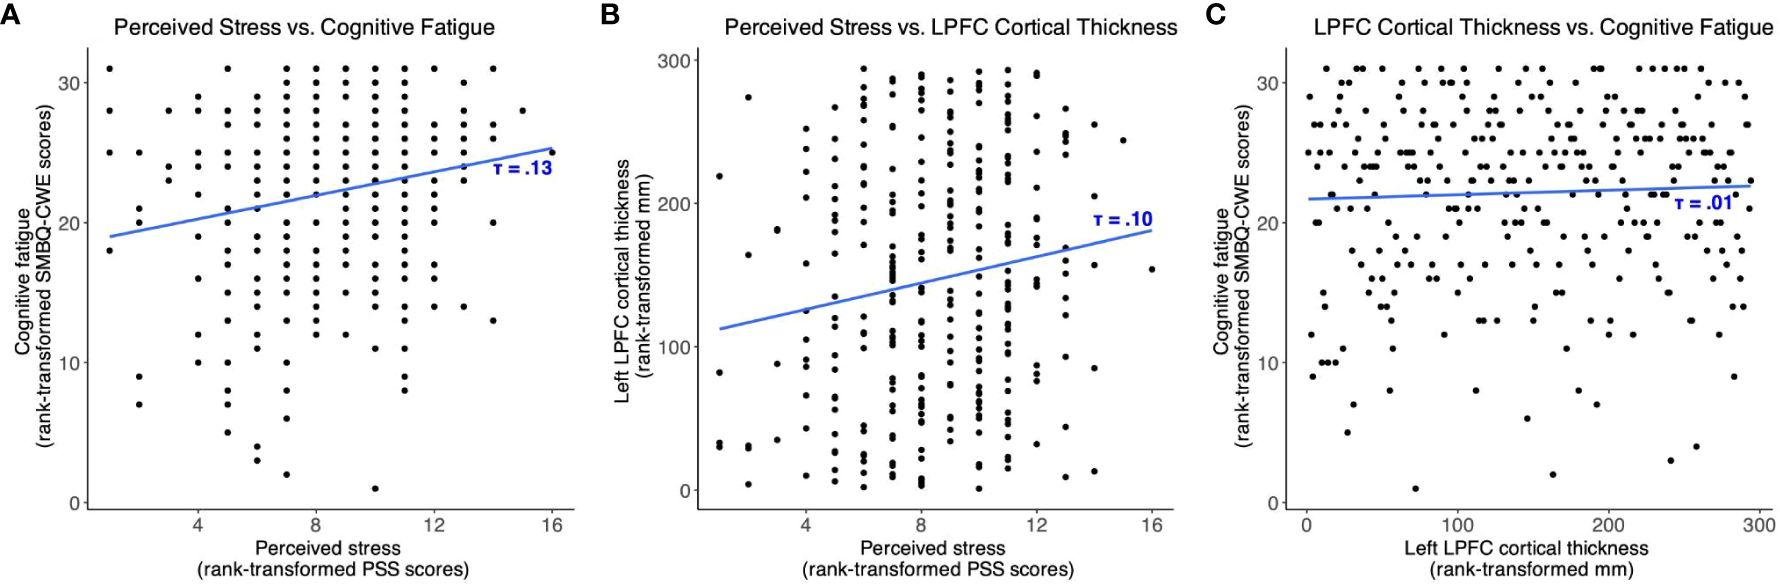
Figure 4. Scatter plots showing the associations between (A) perceived stress and cognitive fatigue, (B) perceived stress and left lateral prefrontal cortex thickness, and (C) left lateral prefrontal cortex thickness and cognitive fatigue. SMBQ-CWE, Shirom-Melamed Burnout questionnaire cognitive weariness; PSS, perceived stress scale; LPFC, lateral prefrontal cortex.
In the Published article, there were errors in Figure 5. The path analysis results with standardized path estimates were in correctly reported for ‘Total intracranial volume’ – ‘Cognitive fatigue’ (-0.07 (-0.16, 0.02)), ‘Age’ – ‘Cognitive fatigue’ (0.01 (-0.08, 0.10)), ‘LPFC thickness’ – ‘Cognitive fatigue’ (0.02 (-0.07, 0.11)) and ‘Perceived stress’ – ‘Cognitive fatigue’ (0.10 (0.01, 0.18)). The corrected Figure 5 and its caption appear below.
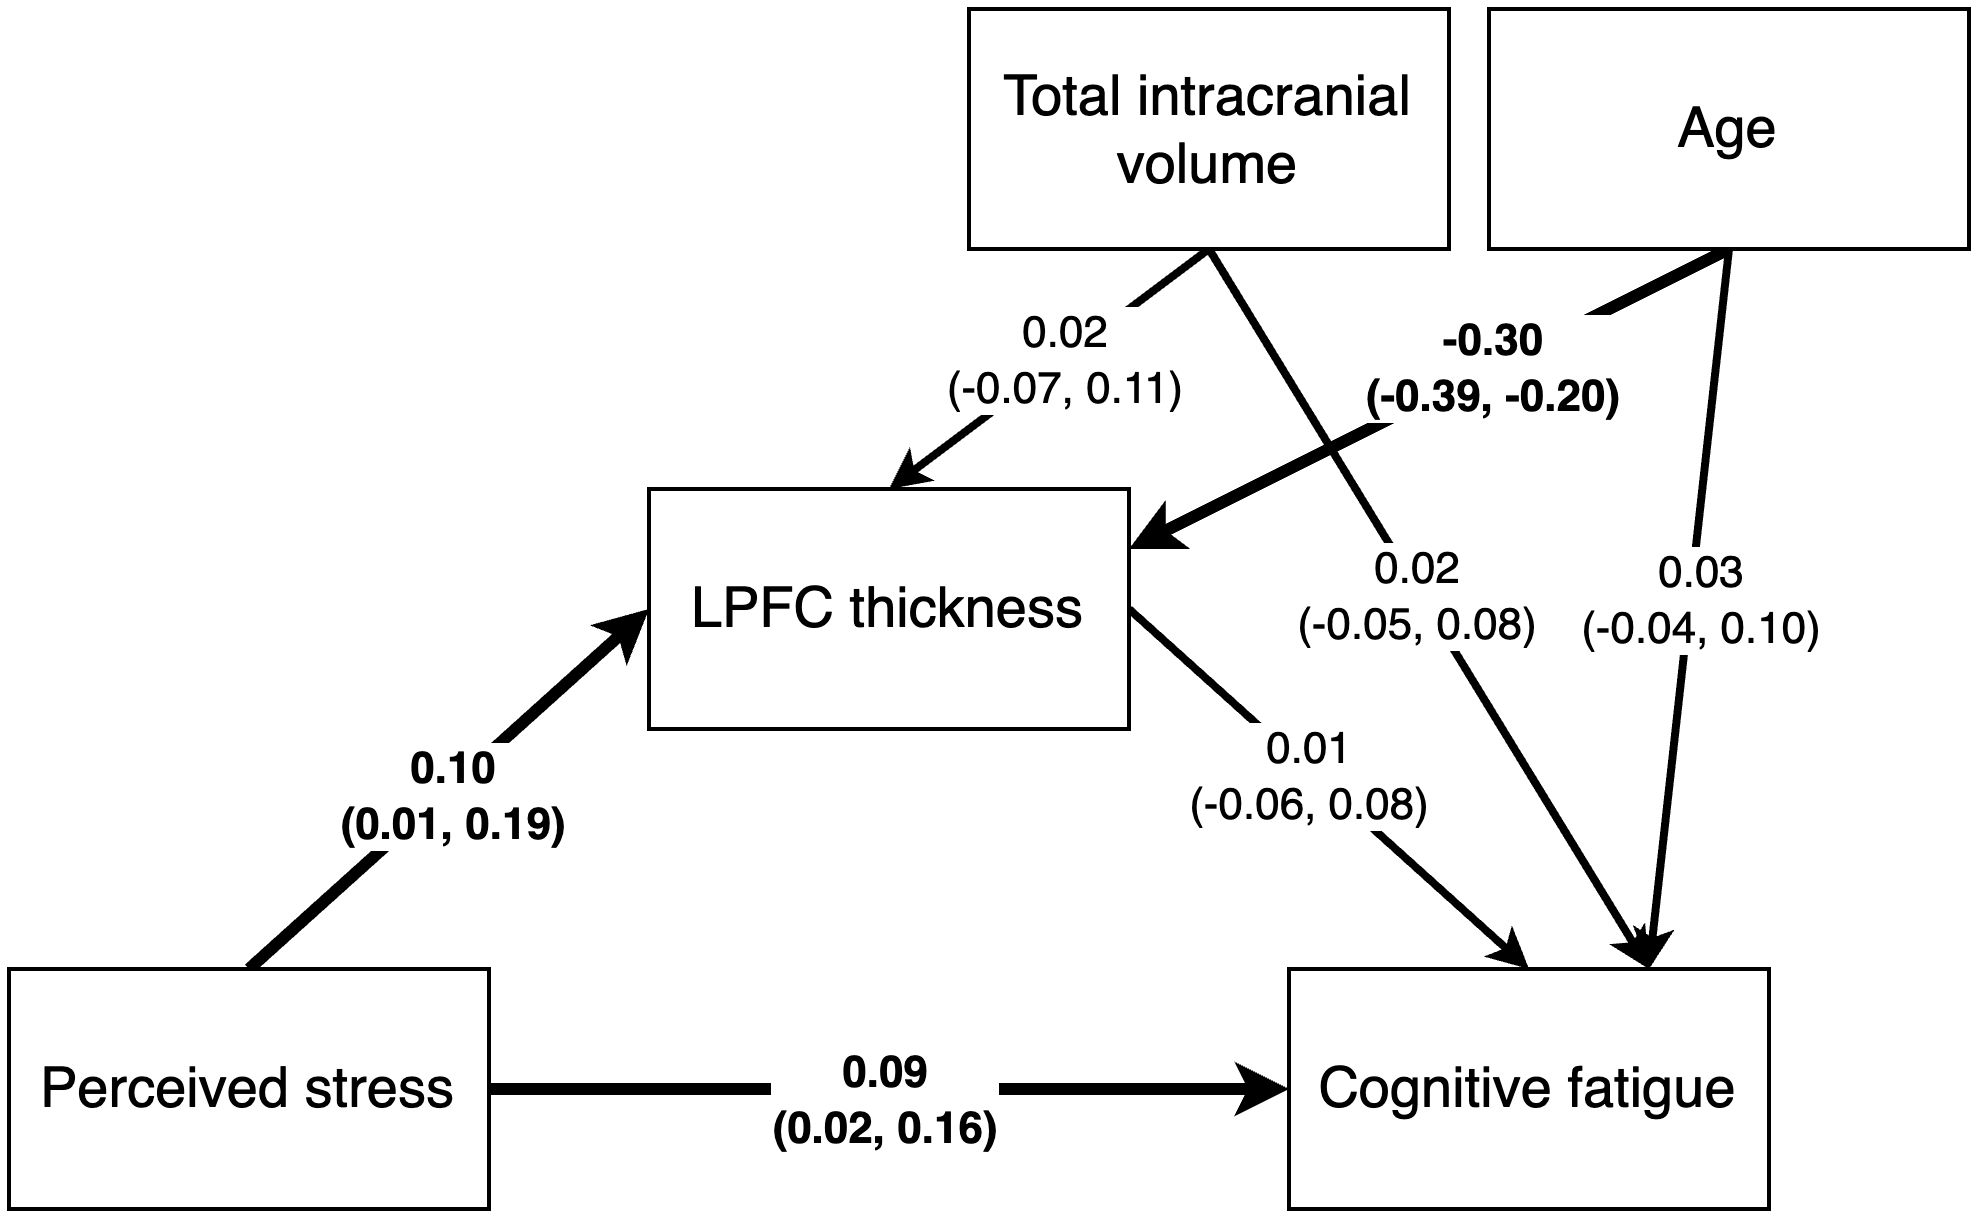
Figure 5. Path analysis results with standardized path estimates and 90% highest density credible interval. Estimates in bold indicate the 90% credible interval did not cover 0.
In the published article, there were errors in the Results, Data analysis, Paragraph 1. The effect of PSS scores on SMBQ-CWE scores and the correlation between PSS and SMBQ-CWE scores were incorrectly reported. The sentences previously stated:
“The mediation path model revealed a positive effect of PSS scores on SMBQ-CWE scores [b = 0.03, (0.003, 0.06), β = 0.10, (0.01, 0.18)], indicating that higher levels of perceived stress were associated with higher levels of cognitive fatigue. Specifically, the model indicated a corresponding 0.03-point change in cognitive fatigue for every 1-point change in perceived stress. In other words, a 10% change in the PSS score was associated with an approximate 1.7% change in the SMBQ-CWE score. The corresponding correlation between PSS and SMBQ-CWE scores τ = 0.09 (BF10 = 4.12).”
The corrected sentences appears below:
“The mediation path model revealed a positive effect of PSS scores on SMBQ-CWE scores [b = 0.03, (0.007, 0.06), β = 0.10, (0.01, 0.18)], indicating that higher levels of perceived stress were associated with higher levels of cognitive fatigue. Specifically, the model indicated a corresponding 0.03-point change in cognitive fatigue for every 1-point change in perceived stress. In other words, a 10% change in the PSS score was associated with an approximate 1.7% change in the SMBQ-CWE score. The corresponding correlation between PSS and SMBQ-CWE scores τ = 0.13 (BF10 = 38.6).”
In the published article, there were errors in the Results, Data analysis, Paragraph 3. The percentage of variance in SMBQ-CWE scores explained by the model and the correlation between SMBQ-CWE and LPFC thickness were incorrectly reported. The sentences previously stated:
“The overall model explained approximately 2.5% of the variance in SMBQ-CWE scores (R2 = 0.025). The corresponding correlation between SMBQ-CWE and LPFC thickness τ=0.00 (BF01 = 7.06).”
The corrected sentences appear below:
“The overall model explained approximately 1.5% of the variance in SMBQ-CWE scores (R2 = 0.015). The corresponding correlation between SMBQ-CWE and LPFC thickness τ=0.00 (BF01 = 6.36).”
In the published article, there were errors in the Results, Data analysis, Paragraph 5. The interaction effect between PSS scores and LPFC thickness on SMBQ-CWE scores were incorrectly reported. The sentences previously stated:
“For the post hoc moderation model, we found no strong evidence of an interaction effect between PSS scores and LPFC thickness on SMBQ-CWE scores [β =−0.05, (−0.13, 0.04); Table 3]. The model explained approximately 2.9% of the variance in SMBQ-CWE scores, R2 = 0.029.”
The corrected sentences appears below:
“For the post hoc moderation model, we found no strong evidence of an interaction effect between PSS scores and LPFC thickness on SMBQ-CWE scores [β =−0.04, (−0.11, 0.03); Table 3]. The model explained approximately 1.8% of the variance in SMBQ-CWE scores, R2 = 0.018.”
The authors apologize for these errors and state that this does not change the scientific conclusions of the article in any way. The original article has been updated.
Publisher’s note
All claims expressed in this article are solely those of the authors and do not necessarily represent those of their affiliated organizations, or those of the publisher, the editors and the reviewers. Any product that may be evaluated in this article, or claim that may be made by its manufacturer, is not guaranteed or endorsed by the publisher.
Keywords: exhaustion disorder, mental fatigue, MRI, prefrontal, stress, utmattningssyndrom, psychiatric, executive functions
Citation: Cully SA and Björnsdotter M (2024) Corrigendum: Lateral prefrontal cortex thickness is associated with stress but not cognitive fatigue in exhaustion disorder. Front. Psychiatry 15:1431572. doi: 10.3389/fpsyt.2024.1431572
Received: 12 May 2024; Accepted: 13 June 2024;
Published: 05 September 2024.
Edited and Reviewed by:
Charlotte Lotta Borg Skoglund, Uppsala University, SwedenCopyright © 2024 Cully and Björnsdotter. This is an open-access article distributed under the terms of the Creative Commons Attribution License (CC BY). The use, distribution or reproduction in other forums is permitted, provided the original author(s) and the copyright owner(s) are credited and that the original publication in this journal is cited, in accordance with accepted academic practice. No use, distribution or reproduction is permitted which does not comply with these terms.
*Correspondence: Malin Björnsdotter, bWFsaW4uYmpvcm5zZG90dGVyQGdtYWlsLmNvbQ==