 Xiaoxiao Mo1,2†
 Chao Wang
 Zhengdong Zhang
 Dongmei Wu
- 1Department of Genetic Toxicology, The Key Laboratory of Modern Toxicology of Ministry Education, Center for Global Health, School of Public Health, Nanjing Medical University, Nanjing, China
- 2Department of Environmental Genomics, School of Public Health, Nanjing Medical University, Nanjing, China
Introduction: Major Depression (MD) is a common mental disorder. In East Asian ancestry, the association, causality, and shared genetic basis between blood-based biomarkers and MD remain unclear.
Methods: We investigated the relationships between blood-based biomarkers and MD through a cross-sectional study and Mendelian randomization (MR) analysis. Cross-trait analysis and enrichment analyses were used to highlight the shared genetic determinants and biological pathways. We conducted summary data–based MR to identify shared genes, which were then validated using a transcriptome dataset from drug-naïve patients with MD.
Results: In the cross-sectional study, C-Reactive Protein showed the significantly positive correlation with depressive symptoms, while hematocrit, hemoglobin, and uric acid exhibited significantly negative correlations. In MR analysis, basophil count (BASO) and low-density lipoprotein cholesterol (LDLc) had a significant causal effect on MD. The enrichment analysis indicated a significant role of inflammatory cytokines and oxidative stress. The shared genes MFN2, FAM55C, GCC2, and SCAPER were validated, with MFN2 identified as a pleiotropic gene involved in MD, BASO, and LDLc.
Discussion: This study highlighted that BASO and LDLc have a causal effect on MD in East Asian ancestry. The pathological mechanisms of MD are related not only to inflammatory cytokines and oxidative stress but also to down regulation of MFN2 expression and mitochondrial dysfunction.
1 Introduction
Major Depression (MD) is a common mental disorder, characterized by symptoms like depressed mood or loss of interest and pleasure, persisting for at least two weeks (1). Globally, the prevalence of MD was about 3.15% in 2020, accounting for nearly 50 million disability-adjusted life years (2). In East Asia, the lifetime prevalence of MD is 6.9% with an incidence rate of 2,882.9 per 100,000 people in 2019 (3, 4).
There is growing clinical and preclinical evidence suggesting that the pathogenesis of psychiatric disorders may involve increased peripheral, cerebral inflammation, and oxidative stress (5, 6). Inflammatory mediators released by blood cells, such as cytokines, chemokines, and proteins in the complement system, can reach the brain through various pathways, including neurological, humoral, and chemical routes. These mediators can activate inflammasomes and affect immune cell movement (7, 8). MD is associated with higher plasma levels of proinflammatory cytokines, such as IL-4, IL-5, IL-6, and C-reactive protein (CRP) (9–11). Inflammation and oxidative stress are interconnected and function together (6). In MD, inflammation activates oxidative and nitrosative stress pathways, leading to increased production of reactive oxygen species (ROS) and reactive nitrogen species (RNS) (12). MD is also characterized by decreased antioxidant levels, including low serum concentrations of antioxidants like zinc, copper, tyrosine, and tryptophan (13–15).
Alterations in blood cell function and properties have been linked to various mental and neurological disorders, including MD, schizophrenia (16), multiple sclerosis (17), stroke (18), and Parkinson’s disease (19). Additionally, counts of monocytes, platelets, basophils, and serum uric acid levels have been associated with MD in cross-sectional studies and randomized controlled trials (20–23). It is believed that the associations between blood-based biomarkers and MD share genetic basis (24). Several studies using genome-wide association study (GWAS) summary statistics from individuals of European ancestry have demonstrated relationships between lymphocyte count, monocyte percentage of white cells, and psychiatric disorders. These studies further explored the causality and biological mechanisms between these blood-based biomarkers and MD (24–26). However, the association, causality, and shared genetic basis between blood-based biomarkers and MD remain unclear in individuals of East Asian ancestry.
The aim of this study is to investigate the association and causality between blood-based biomarkers and MD in individuals of East Asian ancestry and to comprehensively characterize the shared genetic basis and biological mechanisms. First, we conducted a cross-sectional study to investigate the association between blood-based biomarkers and MD, based on the China Health and Retirement Longitudinal Study (CHARLS, wave 3). Subsequently, MR analysis was performed to examine the causality between blood-based biomarkers and MD using GWAS summary statistics. Furthermore, single-cell, and pathway enrichment analyses were conducted to explore the biological mechanisms. Finally, shared genes between blood-based biomarkers and MD were identified using summary data–based MR (SMR). The transcriptome study from Gene Expression Omnibus (GEO) database was used to determine whether the shared genes were differentially expressed between patients and controls. The detailed study design is shown in Figure 1.
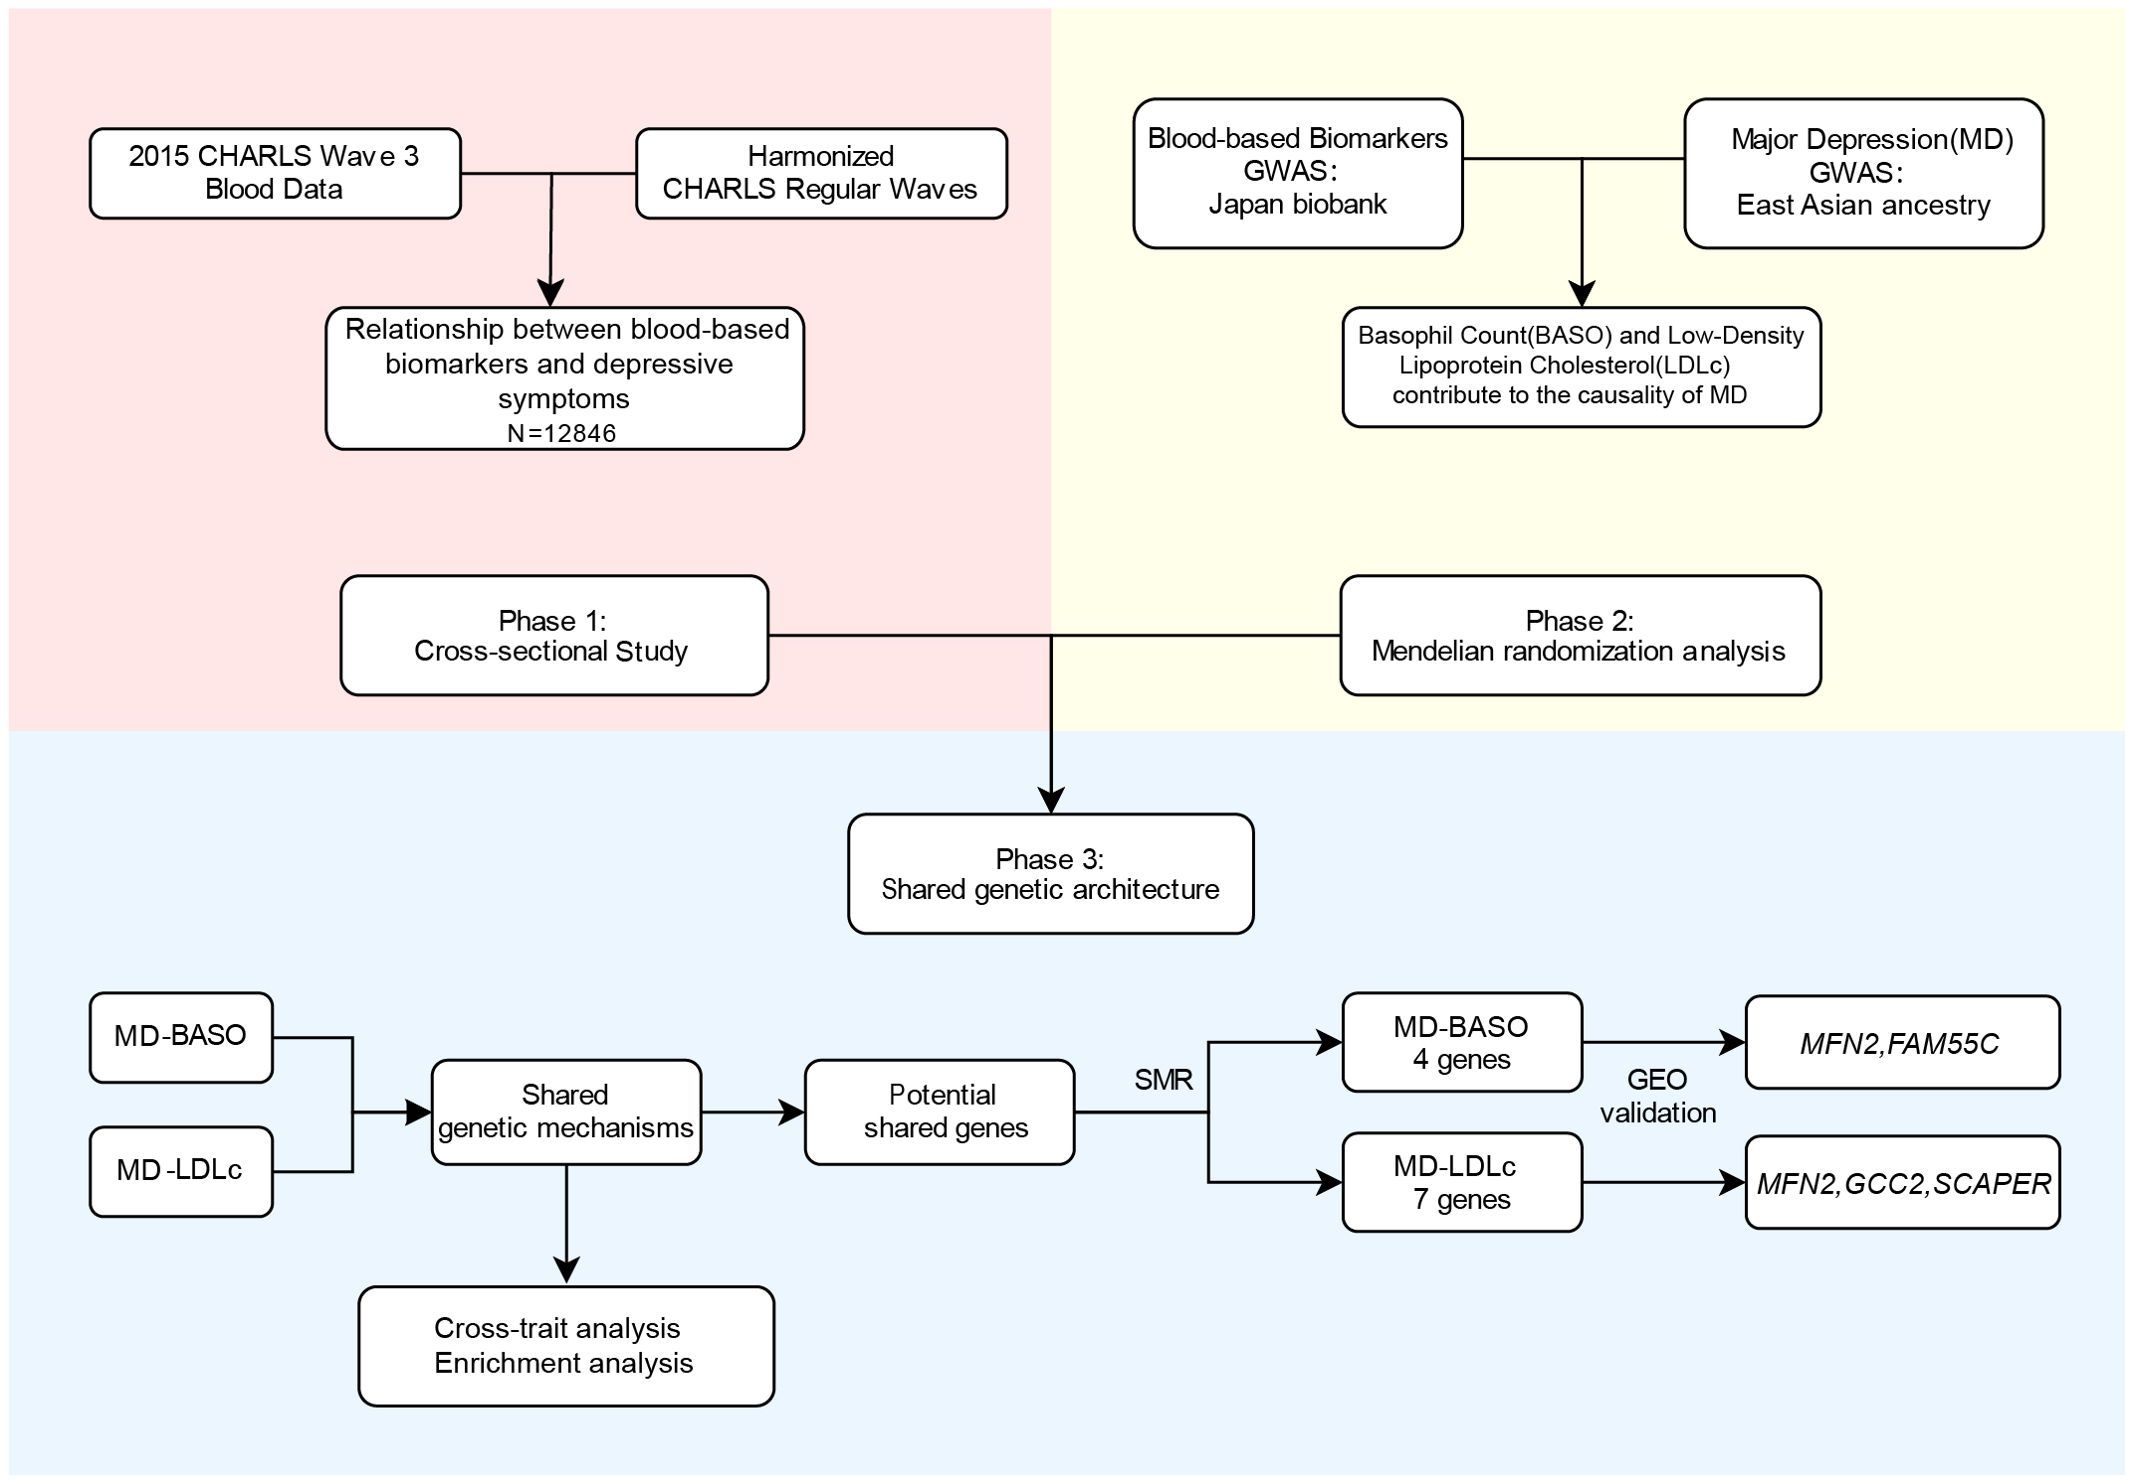
Figure 1. Overview of the main analyses in the study. CHARLS, China Health and Retirement Longitudinal Survey; MD, major depression; BASO, basophil count; LDLc, low-density lipoprotein cholesterol; GEO, Gene Expression Omnibus dataset.
2 Methods
2.1 Data collection
We conducted a cross-sectional study based on the CHARLS, which aimed to collect a high-quality, nationally representative sample of Chinese residents aged 45 and older. The baseline national wave of CHARLS commenced in 2011, approximately 17,500 individuals. As for our study, data from wave 3 was utilized because it contained extensive blood-based bioassays. This study utilized CHARLS data, comprising datasets from the 2015 CHARLS Wave 3 Blood Data (Version ID: 20190620) and Harmonized CHARLS Regular Waves (Version as of June 2021). All analyses in this study adhered to the Data Release Note (27).
2.2 Measurement of depressive symptoms
The Center for Epidemiologic Studies Depression Scale 10 (CES-D10) comprises questions posed on a 4-point scale, corresponding to the frequency of feelings experienced by individuals over the past week. The CES-D10 score ranges from 0 to 30. The reliability and validity of the CES-D10 have been previously established (28). Data from the CES-D10 were available for 25,586 participants. Depressive symptoms were transformed into categorical variable based on the CES-D10 score. With reference to previous studies, a cut-off score of 12 was valid for identifying clinically depression (29, 30). Cutoff scores for depressive symptoms were set at 12 for the 10-item questionnaire. Therefore, if the score is 12 or higher, the individual had depressive symptoms.
2.3 Blood-based bioassays
The Blood-Based Bioassays encompassed a total of 16 blood-based biomarkers, all of which were continuous variables (Supplementary Table 1). The Blood-Based Bioassays samples were assayed for high-sensitivity CRP, glycated hemoglobin (HbA1c), total cholesterol (TCHO), HDL cholesterol (HDL-C), LDL cholesterol (LDL-C, referred to as LDLc), triglycerides (TG), glucose (BG), blood urea nitrogen (BUN), creatinine (SCr), uric acid (UA), and cystatin C (CysC). Additionally, blood count analyses were included comprising hemoglobin (HGB), hematocrit (HCT), white blood cell count (WBC), platelet counts (PLT), and mean corpuscular volume (MCV). Blood data was available for 13,420 participants.
2.4 Covariates
Covariate variables were obtained from the Harmonized CHARLS datasets, which were categorized into quantitative variables (age and economic situation) and qualitative variables (gender, smoking, alcohol consumption, and education level) (Supplementary Table 1). Notably, the education level was determined based on the integration of raw data. The variable RAEDUC_C was defined using the following codes: 1. No Formal Education (Illiterate), 2. Did Not Finish Primary School but can Read, 3. Sishu (Private Tutoring), 4. Elementary School, 5. Middle School, 6. High School, 7. Vocational School, 8. Two/three-year college, 9. College Grad and 10. Post-graduate degree. We recoded levels 1-3 as 1 (labeled as “Before Elementary School”), level 4 as 2 (labeled as “Elementary School”), level 5 as 3 (labeled as “Middle School”), levels 6-7 as 4 (labeled as “High School”), and levels 8-10 as 5 (labeled as “Above Three-year College”).
2.5 Missing data
First, individual IDs were used to merge the blood bioassays data and the harmonized CHARLS dataset. The missing data were categorized into three types: basic demographic characteristics, blood-based biometric indicators, and CES-D10 scores. For the first type of missing data, if the missing rate was not more than 2%, the samples containing missing data were excluded. For the variable of economic situation, which had a missing rate of about 15%, the missing data was excluded in Model 3. For the second type of missing data, multiple imputation by chained equations (MICE) was performed based on random forests (31, 32). For the third type, if there were missing answers but the CES-D 10 score was greater than or equal to 12, or there is no missing data, the individual would be included in the analysis.
2.6 Multi-omics data sources
We used the GWAS summary statistics of 23 blood-based biomarkers (33) and MD (34) in East Asian ancestry (Figure 1, Supplementary Table 1). The 23 blood-based biomarkers GWAS were all sourced from the Japan Biobank, which collected DNA and serum samples from 12 medical institutions in Japan and recruited approximately 200,000 participants. MD GWAS data was sourced from Giannakopoulou et al. including 15,771 individuals with depression and 178,777 control participants from 9 different studies. In SMR analysis, we utilized expression quantitative trait loci (eQTL) datasets from Japanese (35). Additionally, we obtained genome-wide profiling of the transcriptome in the peripheral blood of drug-naïve MD patients and health controls (GSE201332) (36). The single-cell RNA sequencing (scRNA-seq) data from peripheral blood (GSE112845) was downloaded from ABC portal (http://abc.sklehabc.com) (37, 38).
2.7 Statistical analysis
2.7.1 Observational analysis
In this study, we estimated the correlation of blood-based biomarkers on depressive symptoms using logistic regression model analysis. We selected blood-based biomarkers with statistically significant results (P<0.05) from the univariate analysis to further perform multivariate regression. In Model 1, we adjusted for age and gender. Model 2 additionally adjusted for smoking and alcohol consumption based on Model 1. Model 3 further adjusted for education level and economic situation based on Model 2. We assessed the statistical significance of the effects of variables on the outcome of depressive symptoms using odds ratio (OR), 95% confidence intervals (95%CI), and P value of Model 3. Using a false discovery rate (FDR) threshold of 5% for multiple testing correction.
2.7.2 MR analysis
We used MR analysis to estimate the magnitude of the causal relationship between 23 blood-based biomarkers and MD. MR is a method that uses genetic variants as instrumental variables (IVs) to infer causality (39). The Inverse Variance Weighted method (IVW) was utilized as the main analysis using a random-effects model (40). Additionally, 6 alternative MR methods (CAUSE, GSMR, MR-Egger, MR-PRESSO, Weighted Median, and Weighted Mode) were employed as sensitivity analyses to reinforce the results (41–44). Valid IVs need to satisfy the assumption that IVs are strongly associated with the exposure, but not directly associated with the outcome or confounding factors. We selected independent significant SNPs as IVs (P<5×10⁻⁸, physical distance >10,000 kb, and LD r2<0.001 base on 1000 Genomes Project phase 3 of East Asian population). Then, IVs were removed if they were significantly (P<5×10⁻⁸) associated with the outcome. We categorized the 23 blood cell phenotypes into three groups: metabolic category, blood cell, and inflammatory/kidney-related category. Based on different categories of blood-based biomarkers, the FDR threshold of 5% was utilized to correct the results of IVW method to reduce false positives. Additionally, if there is a single IV, the Wald ratio is used as the main analysis and CAUSE as the sensitivity analysis (45). Horizontal pleiotropy test and Cochran’s heterogeneity test were performed as sensitivity analyses.
2.7.3 The enrichment analyses
A cross-trait analysis using Pleiotropic Analysis under Composite null hypothesis (PLACO) was conducted to identify shared genetic components between MD and BASO as well as LDLc (46). Unlike conventional cross-trait analyses that test the global null hypothesis that there is no association of a genetic variant with any of the traits, PLACO test a composite null hypothesis of no pleiotropy is that at most one trait is associated with the genetic variant. Thus, the alternative hypothesis suggests that two traits is significantly associated with the genetic variant.
For significant pleiotropic variants identified by PLACO, we employed gene level analysis by Multi-marker Analysis of Genomic Annotation (MAGMA v1.10). Then, we used Functional Mapping and Annotation (FUMA v1.5.2) for pathway enrichment analysis (47). Initially, Gene Ontology (GO) gene sets from MsigDB v2023.1. Hs were utilized for pathway enrichment analysis (48). We perform a pathway-based polygenic regression method (scPagwas) to discover trait-relevant cells (49, 50).
2.7.4 SMR
SMR, an analysis similar to the MR framework, combines GWAS summary statistics with eQTL datasets to identify genes associated with complex traits. Heterogeneity in dependent instruments (HEIDI) uses multiple SNPs in a cis-eQTL region to distinguish pleiotropy from linkage. The SMR & HEIDI methodology can be interpreted as an analysis to test if the effect size of a SNP on the phenotype is mediated by gene expression (51). Significant genes are defined as genes with PSMR<0.05 and PHEIDI>0.01.
2.8 Database validation
To validate potential shared genes, we utilized the published transcriptome study of whole blood samples from patients with depression in Chinese population (36). The study sample included 20 healthy controls and 20 drug-naïve MD patients. Genes that survived multiple test corrections were defined as significant genes.
3 Results
3.1 Relationship between blood-based biomarkers and depressive symptoms
A total of 12,846 samples were analyzed after excluding those with missing data and conducting multiple imputations. The basic demographic characteristics, blood-based biomarkers, and CES-D10 scores of the participants are presented in Supplementary Tables 1 and 2. The mean CES-D10 score for all participants was 8.0 ± 6.3, with 3,310 participants identified as depressive symptoms. Univariate logistic regression results showed the significant differences in CRP, CysC, HCT, HDL-C, HGB, MCV, SCr, and UA between individuals with depressive symptoms and controls (Supplementary Table 3). In the multivariate analysis, CRP was significantly positively correlated with depressive symptoms in Model 3 (OR=1.011, 95% CI=1.004-1.018, Padjust = 0.005) after multiple testing correction. HCT and UA showed significant negative correlations with depressive symptoms across all three adjusted models (Table 1). There were significant positive correlations between CysC and HGB and depressive symptoms in Model 1 and Model 2, but not in Model 3 after multiple testing correction. No significant association was found between HDL-C, MCV, SCr and depressive symptoms.
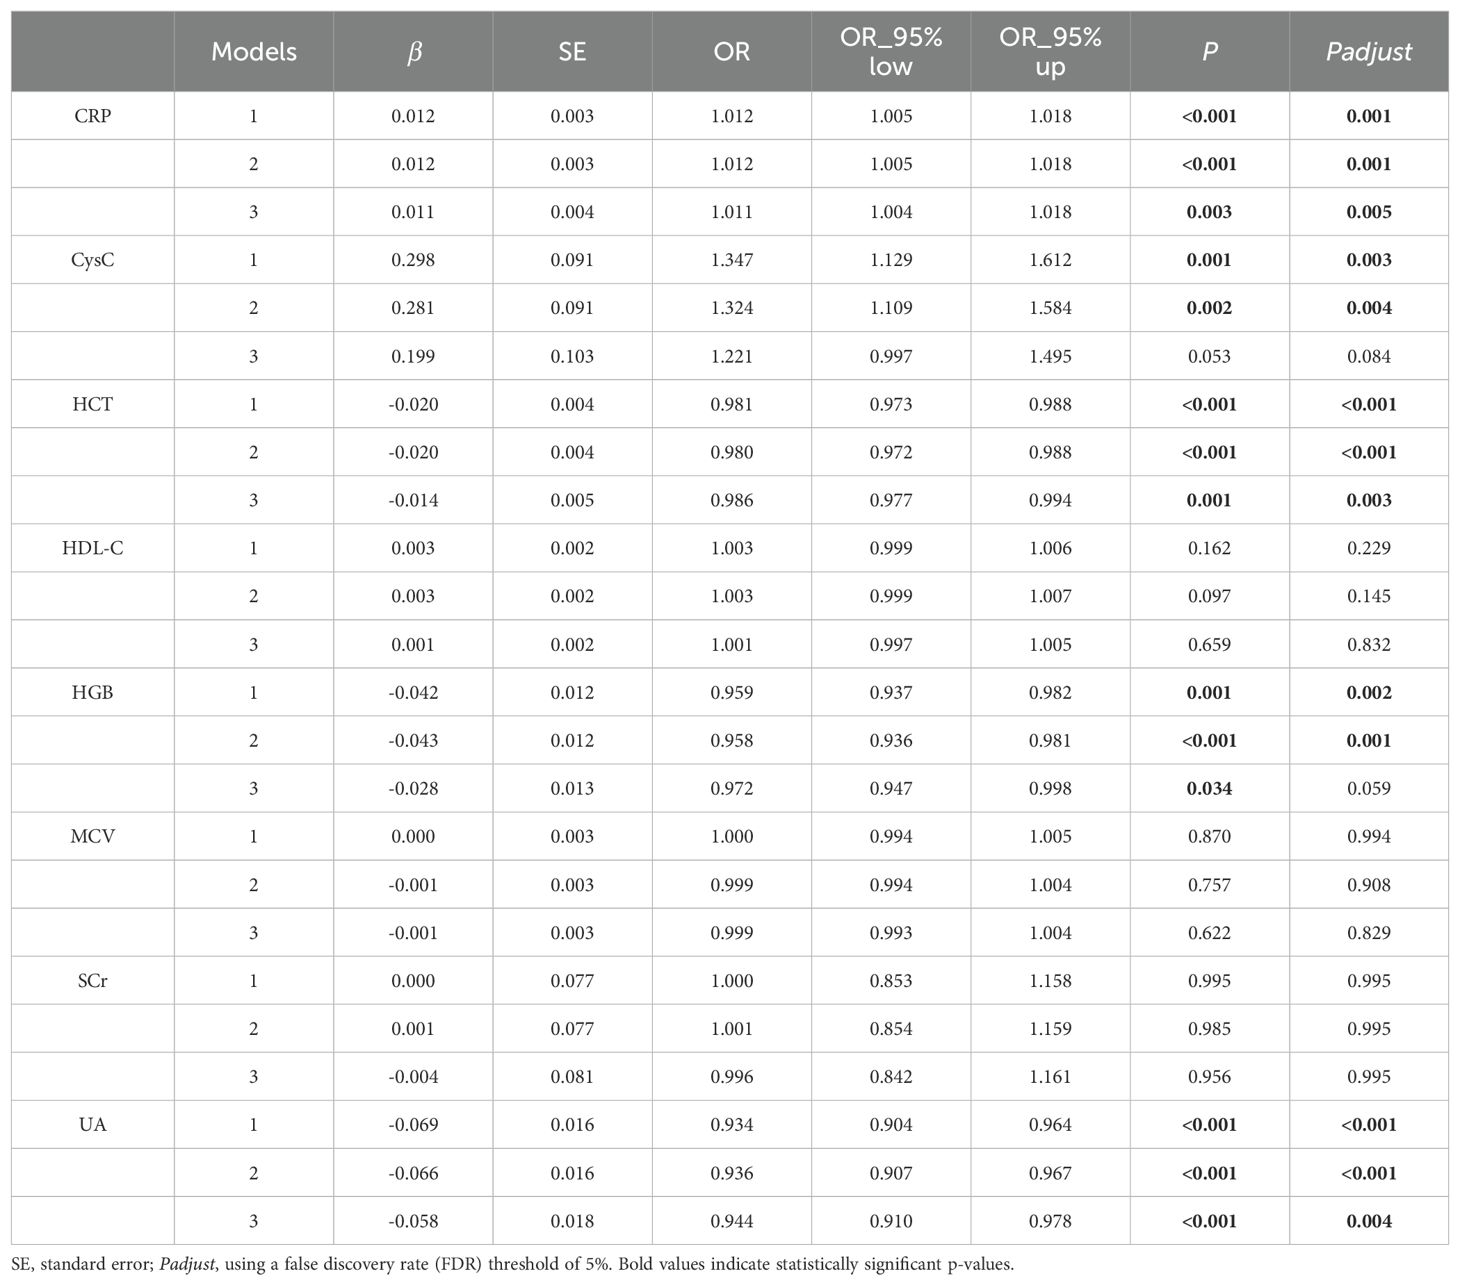
Table 1. Multivariable analysis in CHARLS between blood-based biomarkers and MD.
3.2 Genetic causality between blood-based biomarkers and MD
In blood cell category, BASO had a suggestive causal effect on MD (OR=1.17, 95% CI=1.04-1.33, P=0.012), with 3 out of 6 alternative MR analyses supporting this result. In metabolic category, LDLc showed significantly causal effects on MD (OR = 0.87, 95% CI=0.79-0.96, P=0.006), with 3 out of 6 alternative MR analyses in consistent with this finding (Figure 2; Supplementary Tables 4, 5). It was worth noting that this causal effect was still significant after multiple testing correction. The sensitivity analysis showed no heterogeneity of IVs both in BASO, LDLc, and MD (Supplementary Tables 6, 7). In Inflammatory/Kidney-related category, no causal effect between other blood-based biomarkers and MD was found (Supplementary Table 4). The trait pairs of BASO and LDLc with MD were included in subsequent analyses due to the priority of MR in causal inference.
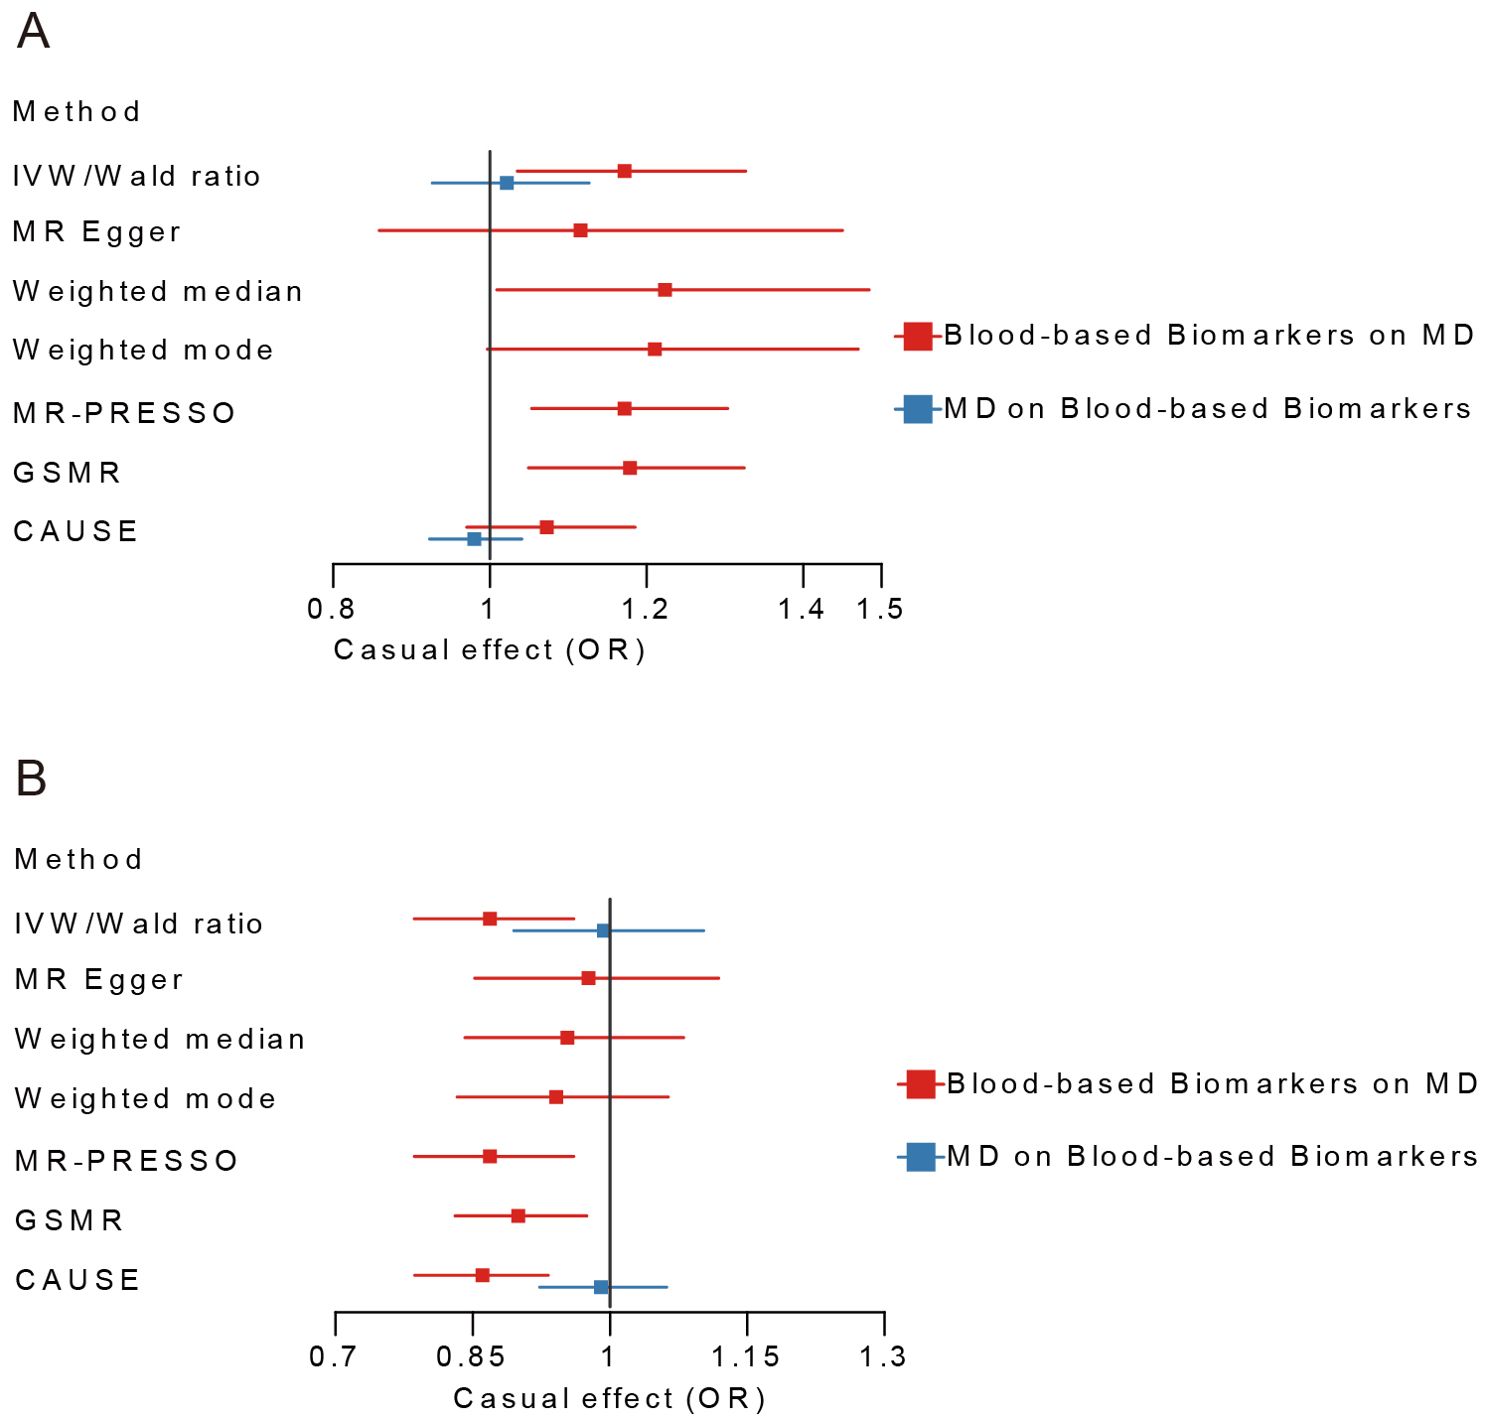
Figure 2. Bi-directional Mendelian Randomization analyses between BASO, LDLc and MD. (A) MD-BASO. (B) MD-LDLc. Blue color represents the estimated causal effect of MD on blood-based biomarkers, red represents the estimated causal effect of blood-based biomarkers on MD. MD, major depression; BASO, basophil count; LDLc, low-density lipoprotein cholesterol; IVW, Inverse Variance Weighted; CAUSE, Causal Analysis Using Summary Effect Estimates; GSMR, Generalized Summary-data-based Mendelian Randomization.
3.3 Pathway enrichment and single-cell analyses
Based on PLACO, gene set enrichment analysis identified 800 nominally significant pathways associated with the MD-BASO trait pair, but none remained significant after Bonferroni correction. The top five pathways mainly involved phosphatase activity and immune response (Figure 3A). Notably, phosphoprotein phosphatase activity (GO:0004721) and protein serine/threonine phosphatase activity (GO:0004722), which regulate the phosphorylation state of cellular proteins, were highlighted. Additionally, the pathway specific to organ or tissue immune response (GO:0002251) was significantly enriched.
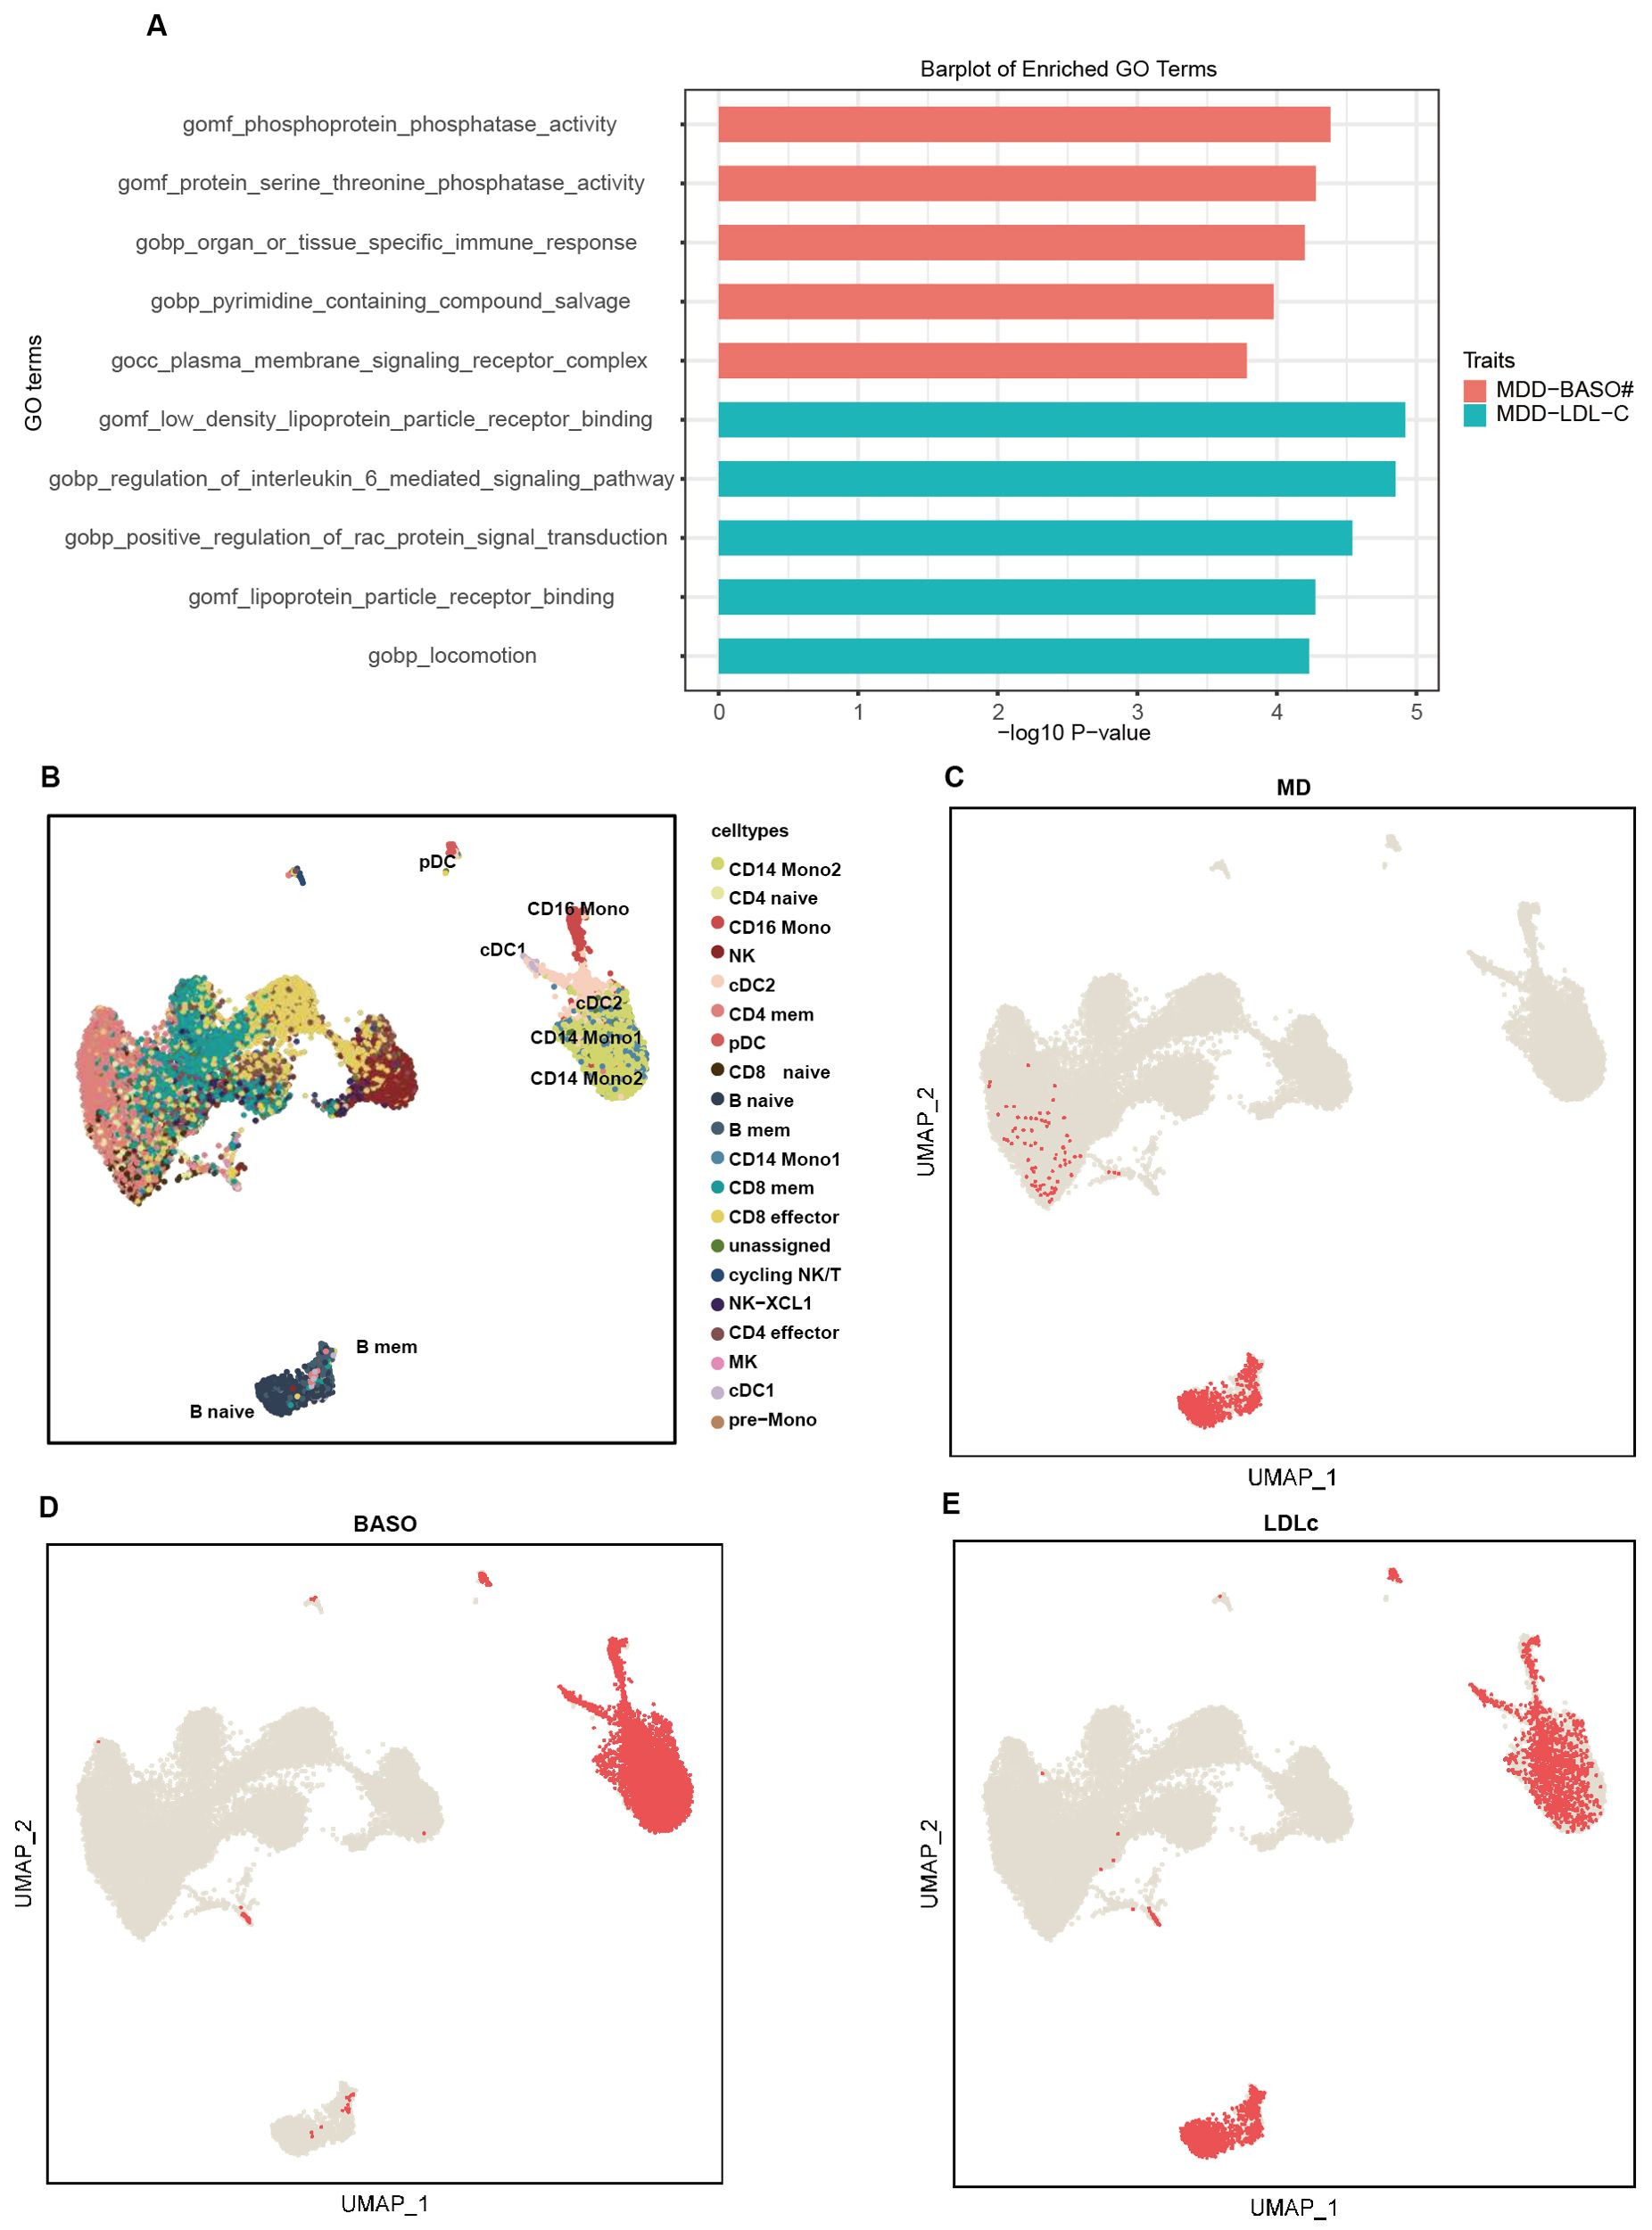
Figure 3. The pathway and single-cell enrichment analysis. (A) The pathway enrichment analysis. The x-axis represents -log10 P-values, and the y-axis represents top 5 gene sets across datasets. (B) The umap plot shows the cell type labels. (C–E) Per-cell TRSs after background correction calculated by scPagwas (Seurat) for three traits including MD (C), BASO (D), and LDLc (E) are shown in per cell type.
For the MD-LDLc trait pair, 840 pathways were significantly enriched, but none remained significant after Bonferroni correction. The top five pathways were primarily related to low-density lipoprotein receptors, cytokine regulation, and locomotion (GO:0040011) (Figure 3A). Moreover, pathways related to inflammation, such as IL-6 (GO:0070102) and RAC protein (GO:0035022), were also emphasized.
scPagwas identified that B cells (naive and memory B cells) were associated with MD, and dendritic cells (cDC1 and cDC2) along with mononuclear cells (CD16 mono, CD14mono1, and CD14mono2) were associated with BASO (Figures 3B–D). Interestingly, all of these cell types were also related to LDLc (Figure 3E).
3.4 Share genes identification and transcriptome validation
We identified 43 nominally significant genes for MD, 98 for BASO, and 87 for LDLc (Figure 4A). The MD-BASO trait pair had four shared genes (MFN2, AC074286.1, FAM55C, and RP11-115L11.1), while the MD-LDLc trait pair had seven shared genes (MFN2, GCC2, GPR20, CTD-3064M3.3, CKAP2, SCAPER, and RPL36P4). Notably, one pleiotropic gene was identified among BASO, LDLc, and MD (Figure 4A). Furthermore, the expression of MFN2 (mitofusin 2), FAM55C (neurexophilin and PC-esterase domain family member 3), GCC2 (GRIP and coiled-coil domain containing 2), and SCAPER (S-phase cyclin A associated protein in the ER) was down-regulated in GEO, consistent with the SMR results. (Figure 4B; Table 2). As shown in Figure 4C, the down-regulation of MFN2 was significantly associated with an increased risk of MD, as confirmed by differential gene expression results. Additionally, down-regulation of MFN2 was significantly associated with an increase in BASO and a positive causal relationship between BASO and MD. Concurrently, down-regulation of MFN2 was significantly associated with a decrease in LDLc and a causal relationship between LDLc and MD.
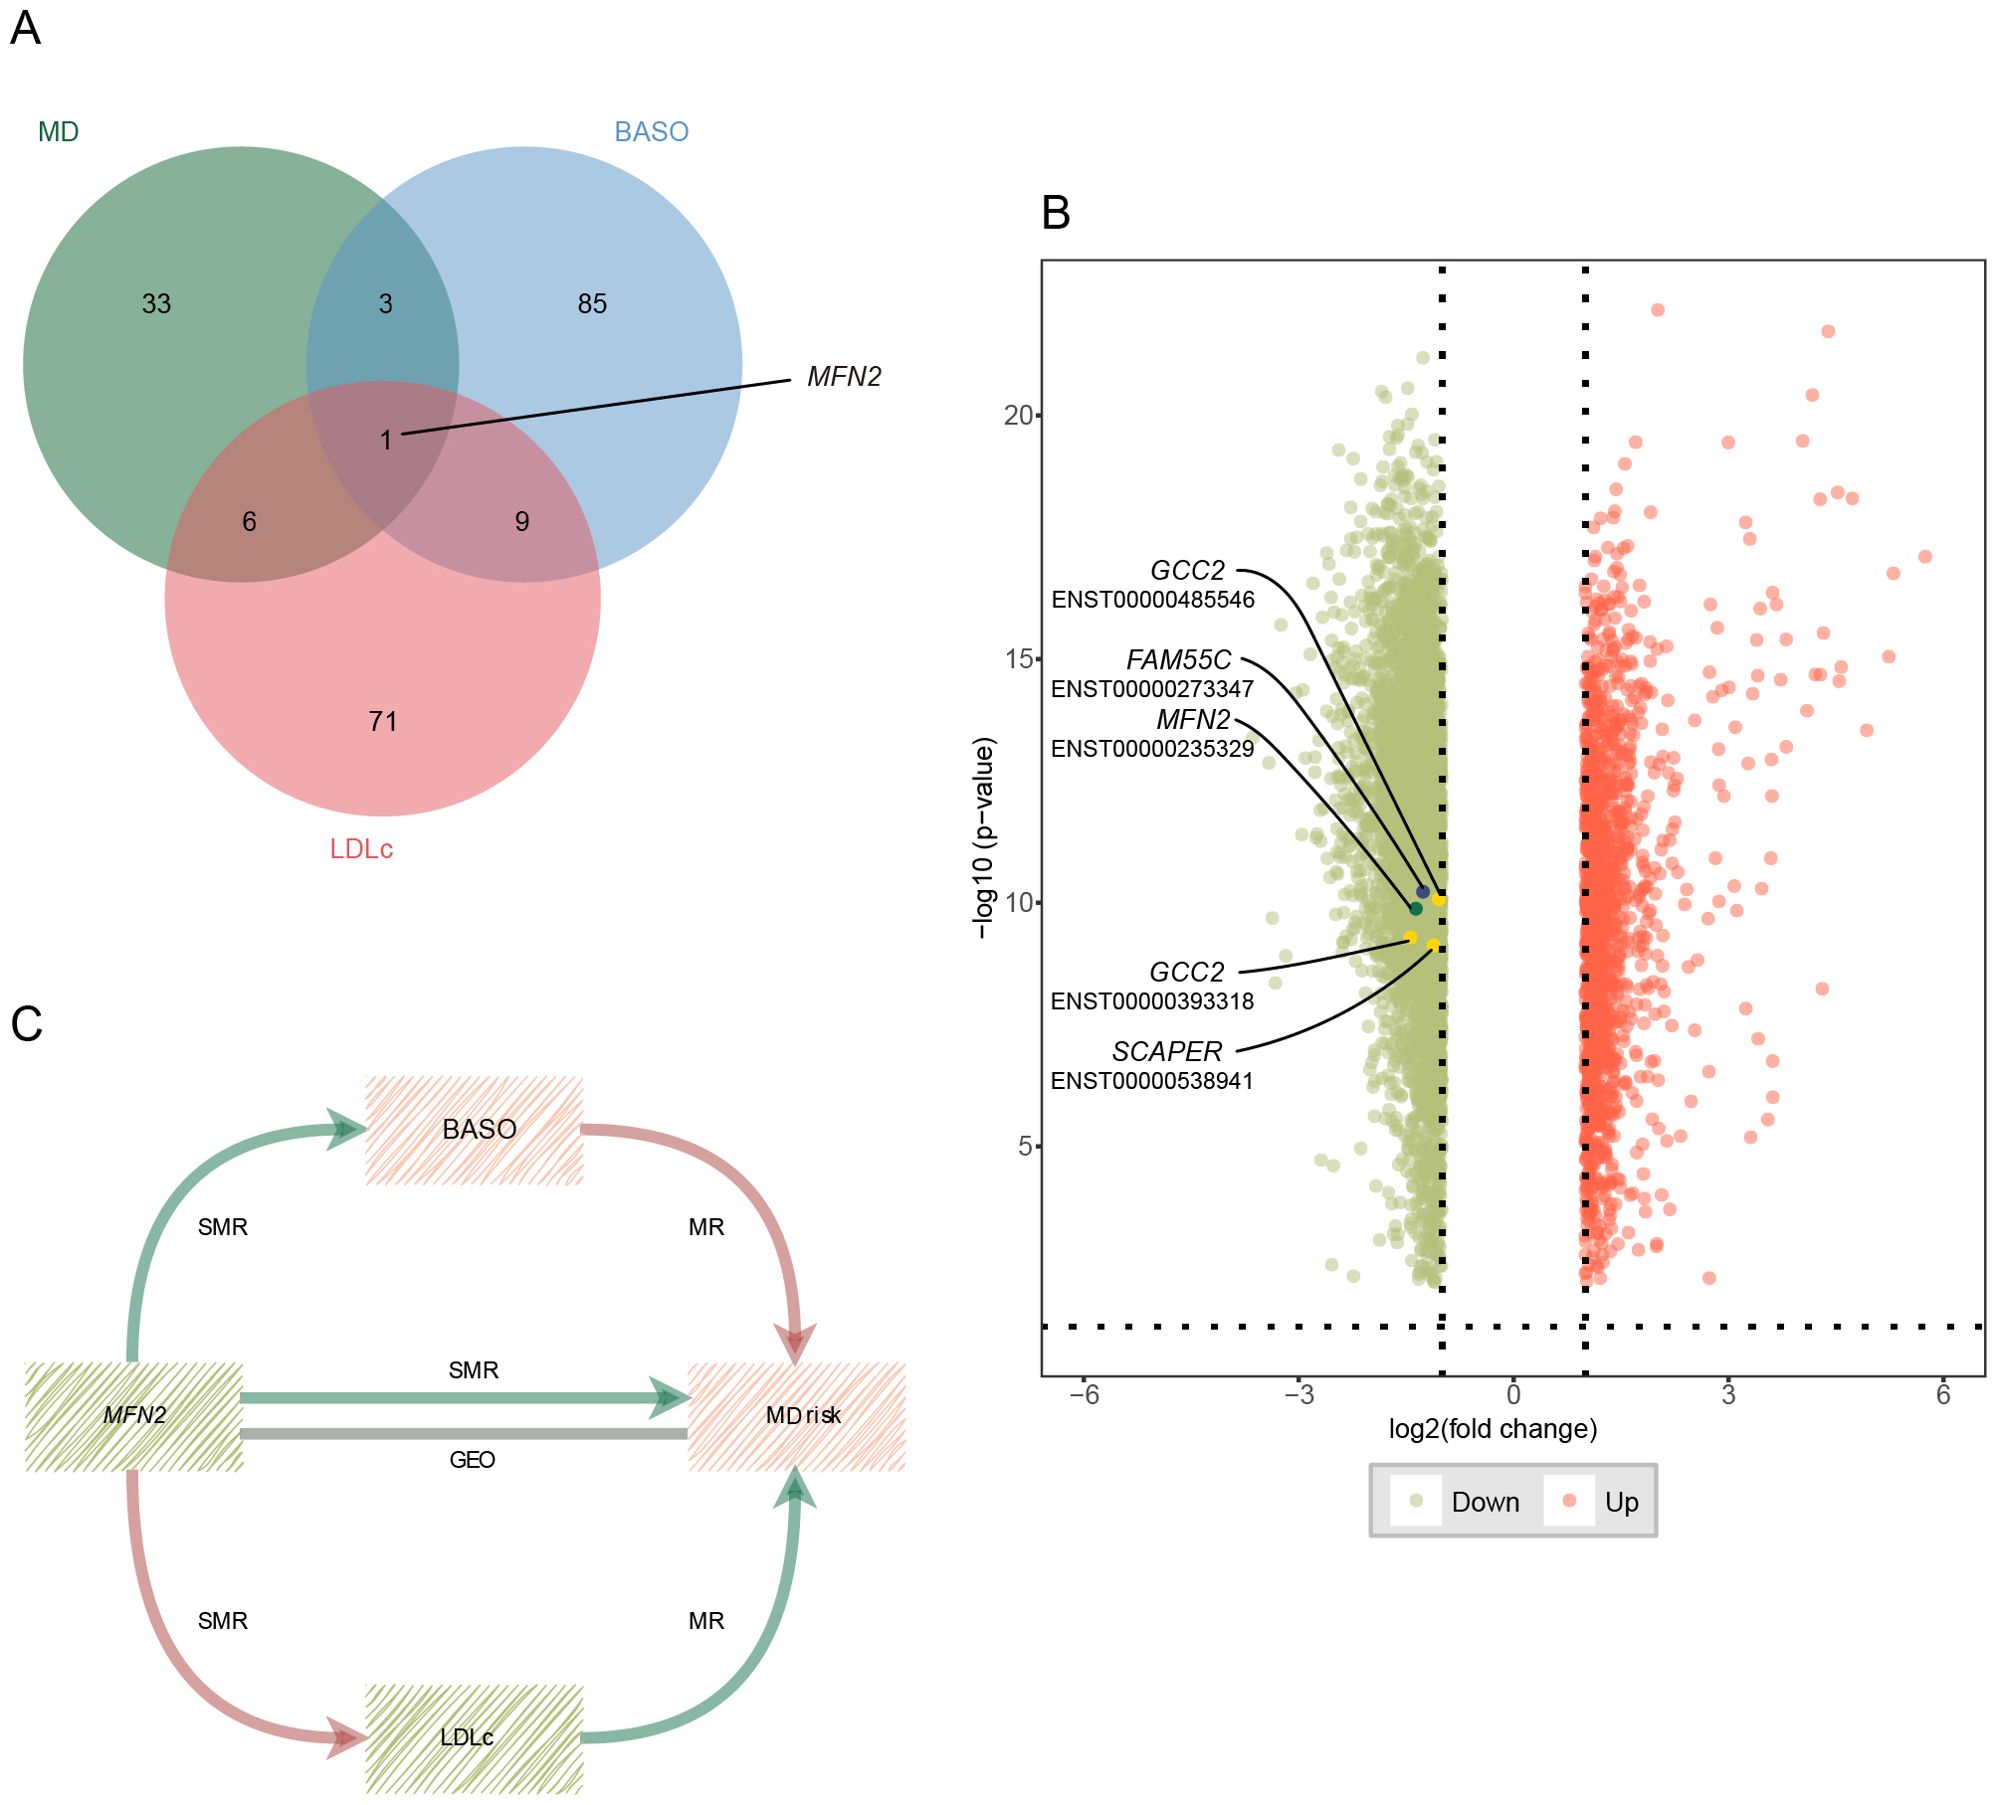
Figure 4. Potential shared genes identification and validation. (A) The Venn diagram of shared genes identified by SMR across three traits. (B) Volcano plot for differential expression analysis between MD patients and health control. Vertical and horizontal dashed lines represent the thresholds for discovering differentially expressed genes. Log2 fold change >1 and P<0.01. Red color represents up-regulated genes, and green color represents down-regulated genes. The points with the name and transcript are validated genes. (C) The critical role of MFN2 between BASO, LDLc and MD. Red color represents up-regulation or positive correlation, and green color represents down-regulation or negative correlation. MD, major depression; BASO, basophil count; LDLc, low-density lipoprotein cholesterol.
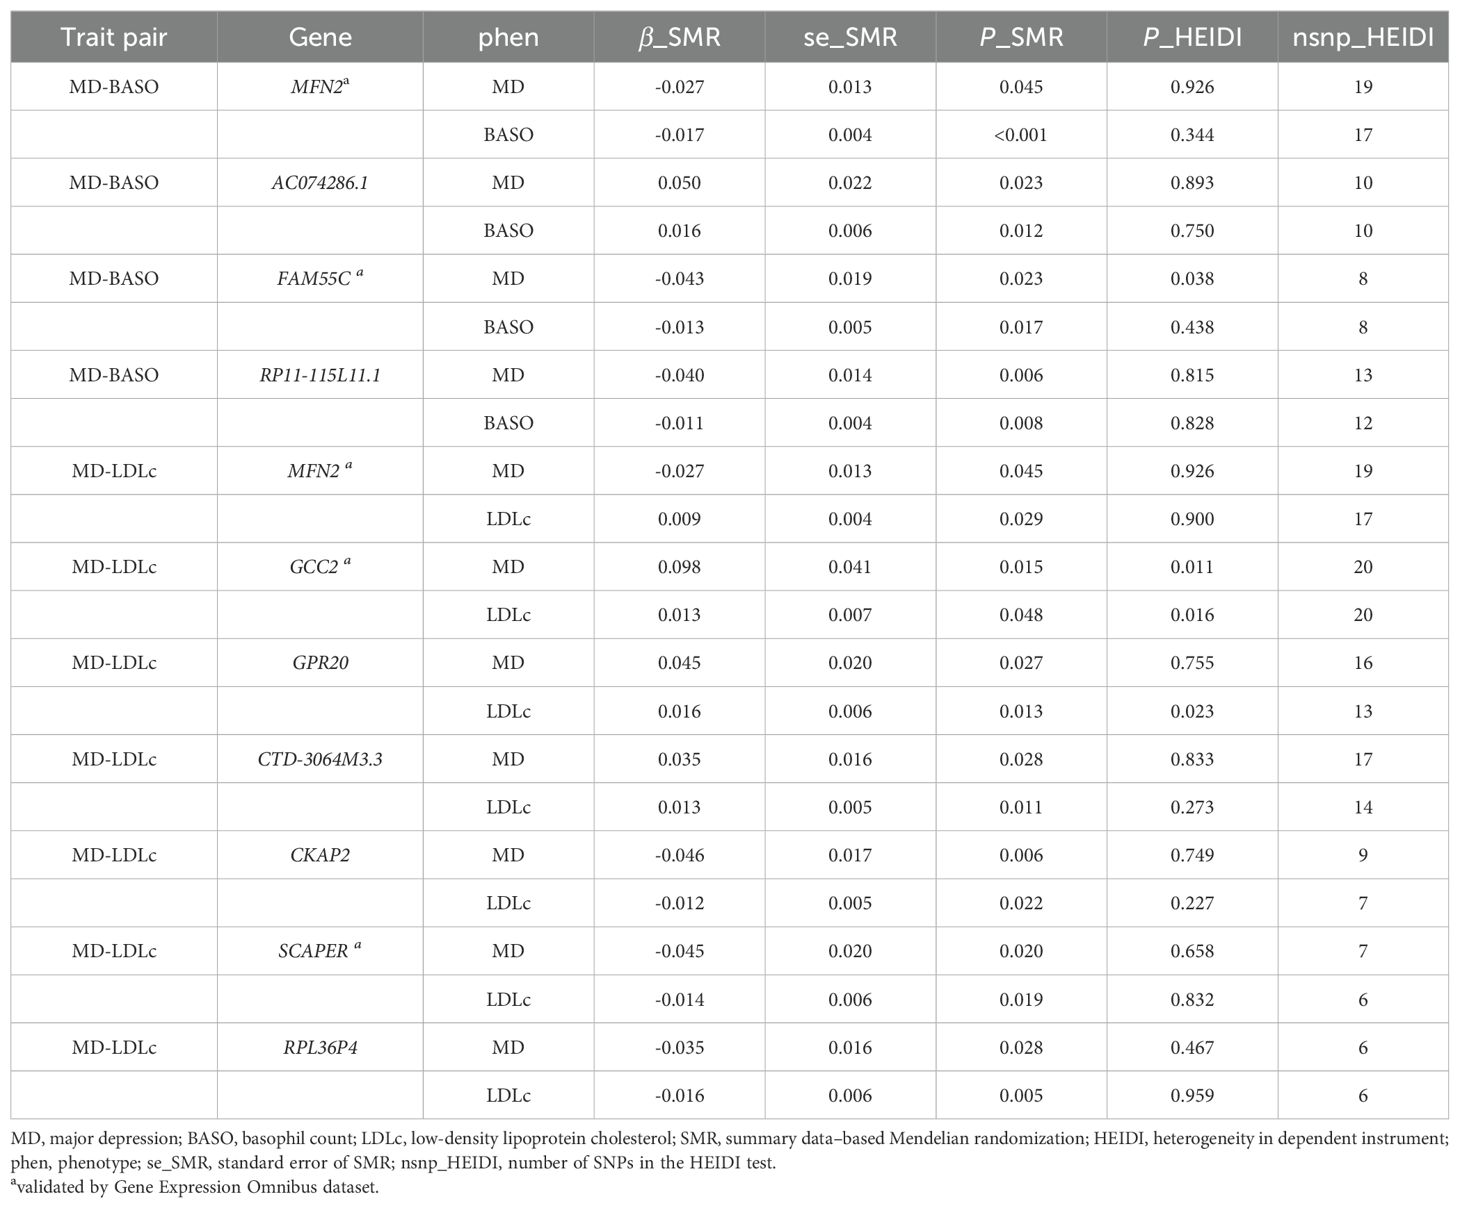
Table 2. Shared genes between blood-based biomarkers and MD.
4 Discussion
In this study, we used a combination of cross-sectional and MR analyses to explore the association and causality between blood-based biomarkers and MD. We identified a total of four shared genes (MFN2, AC074286.1, FAM55C, and RP11-115L11.1), which MFN2 being a pleiotropic gene linked to MD, BASO, and LDLc.
In our cross-sectional study, we found associations between depressive symptoms and several blood-based biomarkers, including CRP, HCT, HGB, and UA. CRP showed a significant positive correlation with depressive symptoms, while HCT, HGB, and UA exhibited significant negative correlations. Similarly, previous clinical trials have reported associations between these biomarkers and depressive symptoms. Haapakoski et al. observed higher mean levels of CRP in patients with MD compared to non-depressed controls (10). Lee et al. reported that Korean adults with MD typically have lower HCT levels (52). Additionally, Kesebir et al. found that UA levels were lower in patients with MD than in healthy controls (53). These findings are consistent with our results. However, Lee et al. reported no association between HGB level and MD in Korean adults (52), which differ from our finding that HGB was negative related with depressive symptoms. Several factors might explain this discrepancy. First, our study did not account for family history and stress as confounding factors, which are known genetic and environmental risk factors for depression. The CHARLS cohort aims to describe the basic information of middle-aged and elderly people in China comprehensively, so the questionnaire did not include psychiatric-specific information. Second, the CES-D10 score used to define depressive symptoms is not a standard for the clinical diagnosis of depression. Third, differences in the age and ethnic groups of the participants might have influenced the associations. Unlike the study in Korean adults (52), findings from other studies in older populations were consistent with our results. Trevisan et al. revealed that low HGB strongly predicted incident depression in older Italian men (54). Vulser et al. reported that depression and antidepressant use were associated with lower HGB levels in elderly French individuals (55).
In the MR analysis, BASO was found to have a significant causal effect on MD. Although BASO was not available in the Blood-Based Bioassays and there was no significant association found between WBC and depressive symptoms, the change in basophil count is challenging to detect through WBC because basophils make up less than 1% of circulating leukocytes. However, several cross-sectional and prospective cohort studies have demonstrated a relationship between BASO count and MD. Bai et al. reported that MD patients had significantly increased basophil counts (P=0.030) (56). Puangsri et al. found that basophil percentages significantly decreased after antidepressant treatment (P=0.027) (23). Although the association between LDLc and depressive symptoms was not significant in our cross-sectional results, MR analysis indicated that LDLc had a causal effect on MD. Previous studies support the idea that alterations in lipid levels may be linked to MD. For example, Aijänseppä et al. found an independent association between low LDLc concentration and depressive symptoms in elderly Finnish men (57). Additionally, a randomized controlled trial suggested that basophil counts predicted cognitive dysfunction in depression when stratified by BMI status, with LDLc also associated with BMI (58, 59). Therefore, further research is needed to explore the shared genetic basis between BASO, LDLc, and MD.
The results of the enrichment analyses supported the hypothesis that inflammation and oxidative stress play roles in the etiology of MD. In pathway enrichment analysis, the pathways GO:0004721 and GO:0004722, related to protein serine threonine/phosphatase activity, were highlighted. Previous studies have shown that two distinct lineages of this phosphatase, the PPP family and the PPM family, can influence depressive-like behaviors by regulating stress pathways, such as by modulating the synthesis of synaptic proteins or neuronal excitability (60, 61). Protein serine/threonine phosphatase have also been shown to affect histamine release from basophils in several studies (62, 63). The pathways GO:0002251 and GO:0070102 were associated with immune response and changes in cytokine levels, such as IL-6. Basophils are involved in the immune response as granulocytes, and the immune dysregulation has been observed in patients with depression (64–66). The shared pathways in the MD-LDLc trait pair emphasized the role of the LDLc receptor and GTPases Rac proteins. Several studies suggest that LDLc may affect stress disorders and depression through the epigenetic regulation of RAC1 (67–70).
We found that both naive and memory B cells were associated with MD and LDLc according to the results of single-cell enrichment analysis. Altered B-cell activation has been reported in association with postpartum depression (71). Furthermore, Diana et al. reported a reduction in naive B cell frequencies in severely depressed patients (72). The apolipoprotein-mediated pathway of lipid antigen presentation in B cells plays a crucial role in the innate help provided by NKT cells (73). IgM antibodies produced by B cells can bind to oxidized low-density lipoprotein, exerting anti-atherosclerotic effects (74). Atherosclerosis has also been reported to associated with MD (75). Therefore, the relationship between LDLc and MD may be mediated through its interaction with B cells.
In this study, the expression of four significantly shared genes were found to be downregulated in MD patients. Notably, MFN2, a key player in mitochondrial function, was identified as a gene associated with MD, BASO, and LDLc. MFN2 may be play a crucial role in mediating the relationship between increased BASO, decreased LDLc and the elevated risk of MD. Mitochondrial dysfunction and increased mitochondrial fragmentation have been observed in Mfn2 conditional knockout mice, which is associated with appropriate mitochondrial shape, function, and intracellular distribution (76–78). Evidence of mitochondrial damage in MD has been documented in various areas, including inflammation, oxidative stress, and changes in neuroplasticity (79). Animal studies have demonstrated that Mfn2 in the nucleus accumbens can regulate depressive-like behaviors by affecting mitochondrial structure and function (80). This suggests that MFN2 is involved in the pathophysiological processes of MD. Furthermore, MFN2 protein levels were found to be downregulated in MD patients, but were restored following treatment with a selective serotonin reuptake inhibitor (81). However, another clinical trial showed increased mitochondrial fragmentation and upregulated MFN2 protein levels in MD patients (82). These conflicting results on MFN2 protein levels in MD patients may arise from discrepancies between changes in MFN2 gene expression and protein levels.
This study has several limitations. First, the relationship between MD and BASO, as well as LDLc, has not been validated in prospective cohort studies or clinical trials. Second, although the link between MFN2 and MD has been validated by external databases and supported by prior research, the roles of BASO and LDLc in this relationship remain unclear.
This study research that BASO and LDLc have a causal effect on MD in individuals of East Asian ancestry. These findings suggest that the genetic structures linking BASO, LDLc and MD are related not only to inflammatory cytokines and oxidative stress but also to mitochondrial dysfunction. It is speculated that the down regulation of MFN2 may play a significant role in the mitochondrial theory of depression.
Data availability statement
The original contributions presented in the study are included in the article/Supplementary Material. Further inquiries can be directed to the corresponding author.
Author contributions
XM: Data curation, Formal analysis, Investigation, Visualization, Writing – original draft, Writing – review & editing. CW: Data curation, Formal analysis, Methodology, Validation, Writing – review & editing. QP: Investigation, Validation, Writing – review & editing. ZZ: Funding acquisition, Project administration, Supervision, Writing – review & editing. DW: Conceptualization, Formal analysis, Funding acquisition, Project administration, Supervision, Writing – review & editing.
Funding
The author(s) declare financial support was received for the research, authorship, and/or publication of this article. This work was supported by the Program of Education Development Foundation of Nanjing Medical University (JZ214490202301).
Acknowledgments
We are also grateful to all research participants and the consortium for sharing of summary statistics, and the development of advanced software tools.
Conflict of interest
The authors declare that the research was conducted in the absence of any commercial or financial relationships that could be construed as a potential conflict of interest.
Publisher’s note
All claims expressed in this article are solely those of the authors and do not necessarily represent those of their affiliated organizations, or those of the publisher, the editors and the reviewers. Any product that may be evaluated in this article, or claim that may be made by its manufacturer, is not guaranteed or endorsed by the publisher.
Supplementary material
The Supplementary Material for this article can be found online at: https://www.frontiersin.org/articles/10.3389/fpsyt.2024.1424958/full#supplementary-material
References
1. American Psychiatric Association, DSM-5 Task Force. Diagnostic and statistical manual of mental disorders: DSM-5™ (5th ed.). American Psychiatric Publishing, Inc. (2013). doi: 10.1176/appi.books.9780890425596
2. COVID-19 Mental Disorders Collaborators. Global prevalence and burden of depressive and anxiety disorders in 204 countries and territories in 2020 due to the COVID-19 pandemic. Lancet. (2021) 398:1700–12. doi: 10.1016/S0140-6736(21)02143-7
3. Bai R, Dong W, Peng Q, Bai Z. Trends in depression incidence in China, 1990-2019. J Affect Disord. (2022) 296:291–7. doi: 10.1016/j.jad.2021.09.084
4. Lu J, Xu X, Huang Y, Li T, Ma C, Xu G, et al. Prevalence of depressive disorders and treatment in China: a cross-sectional epidemiological study. Lancet Psychiatry. (2021) 8:981–90. doi: 10.1016/S2215-0366(21)00251-0
5. Lamers F, Milaneschi Y, Smit JH, Schoevers RA, Wittenberg G, Penninx BWJH. Longitudinal association between depression and inflammatory markers: results from the Netherlands study of depression and anxiety. Biol Psychiatry. (2019) 85:829–37. doi: 10.1016/j.biopsych.2018.12.020
6. Bhatt S, Nagappa AN, Patil CR. Role of oxidative stress in depression. Drug Discov Today. (2020) 25:1270–6. doi: 10.1016/j.drudis.2020.05.001
7. Capuron L, Miller AH. Immune system to brain signaling: neuropsychopharmacological implications. Pharmacol Ther. (2011) 130:226–38. doi: 10.1016/j.pharmthera.2011.01.014
8. Miller AH, Raison CL. The role of inflammation in depression: from evolutionary imperative to modern treatment target. Nat Rev Immunol. (2016) 16:22–34. doi: 10.1038/nri.2015.5
9. Dean B, Tawadros N, Scarr E, Gibbons AS. Regionally-specific changes in levels of tumour necrosis factor in the dorsolateral prefrontal cortex obtained postmortem from subjects with major depressive disorder. J Affect Disord. (2010) 120:245–8. doi: 10.1016/j.jad.2009.04.027
10. Haapakoski R, Mathieu J, Ebmeier KP, Alenius H, Kivimäki M. Cumulative meta-analysis of interleukins 6 and 1β, tumour necrosis factor α and C-reactive protein in patients with major depressive disorder. Brain Behav Immun. (2015) 49:206–15. doi: 10.1016/j.bbi.2015.06.001
11. Valkanova V, Ebmeier KP, Allan CL. CRP. IL-6 and depression: a systematic review and meta-analysis of longitudinal studies. J Affect Disord. (2013) 150:736–44. doi: 10.1016/j.jad.2013.06.004
12. Leonard B, Maes M. Mechanistic explanations how cell-mediated immune activation, inflammation and oxidative and nitrosative stress pathways and their sequels and concomitants play a role in the pathophysiology of unipolar depression. Neurosci Biobehav Rev. (2012) 36:764–85. doi: 10.1016/j.neubiorev.2011.12.005
13. Song C, Dinan T, Leonard BE. Changes in immunoglobulin, complement and acute phase protein levels in the depressed patients and normal controls. J Affect Disord. (1994) 30:283–8. doi: 10.1016/0165-0327(94)90135-x
14. Maes M, De Vos N, Demedts P, Wauters A, Neels H. Lower serum zinc in major depression in relation to changes in serum acute phase proteins. J Affect Disord. (1999) 56:189–94. doi: 10.1016/s0165-0327(99)00011-7
15. Ding J, Zhang Y. Associations of dietary copper, selenium, and manganese intake with depression: A meta-analysis of observational studies. Front Nutr. (2022) 9:854774. doi: 10.3389/fnut.2022.854774
16. Medema S, Mocking RJT, Koeter MWJ, Vaz FM, Meijer C, de Haan L, et al. Levels of red blood cell fatty acids in patients with psychosis, their unaffected siblings, and healthy controls. Schizophr Bull. (2016) 42:358–68. doi: 10.1093/schbul/sbv133
17. Orian JM, D’Souza CS, Kocovski P, Krippner G, Hale MW, Wang X, et al. Platelets in multiple sclerosis: early and central mediators of inflammation and neurodegeneration and attractive targets for molecular imaging and site-directed therapy. Front Immunol. (2021) 12:620963. doi: 10.3389/fimmu.2021.620963
18. Furlan JC, Vergouwen MDI, Fang J, Silver FL. White blood cell count is an independent predictor of outcomes after acute ischaemic stroke. Eur J Neurol. (2014) 21:215–22. doi: 10.1111/ene.12233
19. Jensen MP, Jacobs BM, Dobson R, Bandres-Ciga S, Blauwendraat C, Schrag A, et al. Lower lymphocyte count is associated with increased risk of parkinson’s disease. Ann Neurol. (2021) 89:803–12. doi: 10.1002/ana.26034
20. Baek JH, Kim H-J, Fava M, Mischoulon D, Papakostas GI, Nierenberg A, et al. Reduced venous blood basophil count and anxious depression in patients with major depressive disorder. Psychiatry Investig. (2016) 13:321. doi: 10.4306/pi.2016.13.3.321
21. Chen H, Liu F, Sun D, Zhang J, Luo S, Liao Q, et al. The potential risk factors of early-onset post-stroke depression from immuno-inflammatory perspective. Front Immunol. (2022) 13:1000631. doi: 10.3389/fimmu.2022.1000631
22. Li Y, Zhao L, Yu D, Ding G. Associations between serum uric acid and depression among middle-aged and elderly participants in China. Psychol Health Med. (2019) 24:1277–86. doi: 10.1080/13548506.2019.1622748
23. Puangsri P, Jinanarong V, Ninla-aesong P. Impact of antidepressant treatment on complete blood count parameters and inflammatory ratios in adolescents with major depressive disorder. J Psychiatr Res. (2023) 157:26–35. doi: 10.1016/j.jpsychires.2022.11.017
24. Reay WR, Kiltschewskij DJ, Geaghan MP, Atkins JR, Carr VJ, Green MJ, et al. Genetic estimates of correlation and causality between blood-based biomarkers and psychiatric disorders. Sci Adv. (2022) 8:eabj8969. doi: 10.1126/sciadv.abj8969
25. Sealock JM, Lee YH, Moscati A, Venkatesh S, Voloudakis G, Straub P, et al. Use of the psycheMERGE network to investigate the association between depression polygenic scores and white blood cell count. JAMA Psychiatry. (2021) 78:1365–74. doi: 10.1001/jamapsychiatry.2021.2959
26. Yang Y, Zhou Y, Nyholt DR, Yap CX, Tannenberg RK, Wang Y, et al. The shared genetic landscape of blood cell traits and risk of neurological and psychiatric disorders. Cell Genom. (2023) 3:100249. doi: 10.1016/j.xgen.2022.100249
27. Zhao Y, Hu Y, Smith JP, Strauss J, Yang G. Cohort profile: the China health and retirement longitudinal study (CHARLS). Int J Epidemiol. (2014) 43:61–8. doi: 10.1093/ije/dys203
28. Boey KW. Cross-validation of a short form of the CES-D in Chinese elderly. Int J Geriatr Psychiatry. (1999) 14:608–17. doi: 10.1002/(sici)1099-1166(199908)14:8<608::aid-gps991>3.0.co;2-z
29. Andresen EM, Malmgren JA, Carter WB, Patrick DL. Screening for depression in well older adults: evaluation of a short form of the CES-D (Center for Epidemiologic Studies Depression Scale). Am J Prev Med. (1994) 10:77–84. doi: 10.1016/S0749-3797(18)30622-6
30. Cheng S-T, Chan ACM. The Center for Epidemiologic Studies Depression Scale in older Chinese: thresholds for long and short forms. Int J Geriatr Psychiatry. (2005) 20:465–70. doi: 10.1002/gps.1314
31. Breiman L. Statistical Modeling: The Two Cultures (with comments and a rejoinder by the author). Stat Sci. (2001) 16:199–231. doi: 10.1214/ss/1009213726
32. Buuren SV, Groothuis-Oudshoorn K. Mice: multivariate imputation by chained equations in R. J Stat Soft. (2011) 45:1–67. doi: 10.18637/jss.v045.i03
33. Sakaue S, Kanai M, Tanigawa Y, Karjalainen J, Kurki M, Koshiba S, et al. A cross-population atlas of genetic associations for 220 human phenotypes. Nat Genet. (2021) 53:1415–24. doi: 10.1038/s41588-021-00931-x
34. Giannakopoulou O, Lin K, Meng X, Su M-H, Kuo P-H, Peterson RE, et al. The genetic architecture of depression in individuals of east asian ancestry: A genome-wide association study. JAMA Psychiatry. (2021) 78:1258. doi: 10.1001/jamapsychiatry.2021.2099
35. Ishigaki K, Kochi Y, Suzuki A, Tsuchida Y, Tsuchiya H, Sumitomo S, et al. Polygenic burdens on cell-specific pathways underlie the risk of rheumatoid arthritis. Nat Genet. (2017) 49:1120–5. doi: 10.1038/ng.3885
36. Xiu J, Li J, Liu Z, Wei H, Zhu C, Han R, et al. Elevated BICD2 DNA methylation in blood of major depressive disorder patients and reduction of depressive-like behaviors in hippocampal Bicd2 -knockdown mice. Proc Natl Acad Sci USA. (2022) 119:e2201967119. doi: 10.1073/pnas.2201967119
37. Chen J, Cheung F, Shi R, Zhou H, Lu W, CHI Consortium. PBMC fixation and processing for Chromium single-cell RNA sequencing. J Transl Med. (2018) 16:198. doi: 10.1186/s12967-018-1578-4
38. Gao X, Hong F, Hu Z, Zhang Z, Lei Y, Li X, et al. ABC portal: a single-cell database and web server for blood cells. Nucleic Acids Res. (2023) 51:D792–804. doi: 10.1093/nar/gkac646
39. Davey Smith G, Hemani G. Mendelian randomization: genetic anchors for causal inference in epidemiological studies. Hum Mol Genet. (2014) 23:R89–98. doi: 10.1093/hmg/ddu328
40. Burgess S, Butterworth A, Thompson SG. Mendelian randomization analysis with multiple genetic variants using summarized data. Genet Epidemiol. (2013) 37:658–65. doi: 10.1002/gepi.21758
41. Bowden J, Davey Smith G, Haycock PC, Burgess S. Consistent estimation in mendelian randomization with some invalid instruments using a weighted median estimator. Genet Epidemiol. (2016) 40:304–14. doi: 10.1002/gepi.21965
42. Burgess S, Thompson SG. Interpreting findings from Mendelian randomization using the MR-Egger method. Eur J Epidemiol. (2017) 32:377–89. doi: 10.1007/s10654-017-0255-x
43. Hartwig FP, Davey Smith G, Bowden J. Robust inference in summary data Mendelian randomization via the zero modal pleiotropy assumption. Int J Epidemiol. (2017) 46:1985–98. doi: 10.1093/ije/dyx102
44. Verbanck M, Chen C-Y, Neale B, Do R. Detection of widespread horizontal pleiotropy in causal relationships inferred from Mendelian randomization between complex traits and diseases. Nat Genet. (2018) 50:693–8. doi: 10.1038/s41588-018-0099-7
45. Chapman and Hall/CRC. Mendelian randomization, in: Methods for Causal Inference Using Genetic Variants. (2021) (Accessed March 1, 2024).
46. Ray D, Chatterjee N. A powerful method for pleiotropic analysis under composite null hypothesis identifies novel shared loci between Type 2 Diabetes and Prostate Cancer. PloS Genet. (2020) 16:e1009218. doi: 10.1371/journal.pgen.1009218
47. Watanabe K, Taskesen E, van Bochoven A, Posthuma D. Functional mapping and annotation of genetic associations with FUMA. Nat Commun. (2017) 8:1826. doi: 10.1038/s41467-017-01261-5
48. Liberzon A, Subramanian A, Pinchback R, Thorvaldsdóttir H, Tamayo P, Mesirov JP. Molecular signatures database (MSigDB) 3.0. Bioinformatics. (2011) 27:1739–40. doi: 10.1093/bioinformatics/btr260
49. Ma Y, Deng C, Zhou Y, Zhang Y, Qiu F, Jiang D, et al. Polygenic regression uncovers trait-relevant cellular contexts through pathway activation transformation of single-cell RNA sequencing data. Cell Genom. (2023) 3:100383. doi: 10.1016/j.xgen.2023.100383
50. Ma Y, Qiu F, Deng C, Li J, Huang Y, Wu Z, et al. Integrating single-cell sequencing data with GWAS summary statistics reveals CD16+monocytes and memory CD8+T cells involved in severe COVID-19. Genome Med. (2022) 14:16. doi: 10.1186/s13073-022-01021-1
51. Zhu Z, Zhang F, Hu H, Bakshi A, Robinson MR, Powell JE, et al. Integration of summary data from GWAS and eQTL studies predicts complex trait gene targets. Nat Genet. (2016) 48:481–7. doi: 10.1038/ng.3538
52. Lee BJ. Association of depressive disorder with biochemical and anthropometric indices in adult men and women. Sci Rep. (2021) 11:13596. doi: 10.1038/s41598-021-93103-0
53. Kesebir S, Tatlıdil Yaylacı E, Süner O, Gültekin BK. Uric acid levels may be a biological marker for the differentiation of unipolar and bipolar disorder: the role of affective temperament. J Affect Disord. (2014) 165:131–4. doi: 10.1016/j.jad.2014.04.053
54. Trevisan C, Veronese N, Bolzetta F, De Rui M, Correll CU, Zambon S, et al. Low hemoglobin levels and risk of developing depression in the elderly: results from the prospective PRO.V.A. Study. J Clin Psychiatry. (2016) 77:e1549–56. doi: 10.4088/JCP.15m10270
55. Vulser H, Lemogne C, Boutouyrie P, Côté F, Perier M-C, Van Sloten T, et al. Depression, antidepressants and low hemoglobin level in the Paris Prospective Study III: A cross-sectional analysis. Prev Med. (2020) 135:106050. doi: 10.1016/j.ypmed.2020.106050
56. Bai S, Bai H, Li D, Zhong Q, Xie J, Chen J. Gut microbiota-related inflammation factors as a potential biomarker for diagnosing major depressive disorder. Front Cell Infect Microbiol. (2022) 12:831186. doi: 10.3389/fcimb.2022.831186
57. Aijänseppä S, Kivinen P, Helkala E-L, Kivelä S-L, Tuomilehto J, Nissinen A. Serum cholesterol and depressive symptoms in elderly Finnish men. Int J Geriatr Psychiatry. (2002) 17:629–34. doi: 10.1002/gps.666
58. Fourrier C, Sampson E, Hori H, Schubert KO, Clark S, Mills NT, et al. Exploratory study of association between blood immune markers and cognitive symptom severity in major depressive disorder: Stratification by body mass index status. Brain Behavior Immun. (2020) 88:242–51. doi: 10.1016/j.bbi.2020.06.007
59. McLaughlin T, Allison G, Abbasi F, Lamendola C, Reaven G. Prevalence of insulin resistance and associated cardiovascular disease risk factors among normal weight, overweight, and obese individuals. Metabolism. (2004) 53:495–9. doi: 10.1016/j.metabol.2003.10.032
60. Gao F, Liu A, Qi X, Wang M, Chen X, Wei S, et al. Ppp4r3a deficiency leads to depression-like behaviors in mice by modulating the synthesis of synaptic proteins. Dis Model Mech. (2022) 15:dmm049374. doi: 10.1242/dmm.049374
61. Liu J, Meng F, Wang W, Cui M, Wu M, Jiang S, et al. PPM1F in hippocampal dentate gyrus regulates the depression-related behaviors by modulating neuronal excitability. Exp Neurol. (2021) 340:113657. doi: 10.1016/j.expneurol.2021.113657
62. Hanson DA, Ziegler SF. Regulation of ionomycin-mediated granule release from rat basophil leukemia cells. Mol Immunol. (2002) 38:1329–35. doi: 10.1016/s0161-5890(02)00083-4
63. Peirce MJ, Munday MR, Peachell PT. Characterization of protein serine/threonine phosphatase activities in human lung mast cells and basophils. Br J Pharmacol. (1998) 125:1095–101. doi: 10.1038/sj.bjp.0702169
64. Dowlati Y, Herrmann N, Swardfager W, Liu H, Sham L, Reim EK, et al. A meta-analysis of cytokines in major depression. Biol Psychiatry. (2010) 67:446–57. doi: 10.1016/j.biopsych.2009.09.033
65. Drevets WC, Wittenberg GM, Bullmore ET, Manji HK. Immune targets for therapeutic development in depression: towards precision medicine. Nat Rev Drug Discovery. (2022) 21:224–44. doi: 10.1038/s41573-021-00368-1
66. Sukoff Rizzo SJ, Neal SJ, Hughes ZA, Beyna M, Rosenzweig-Lipson S, Moss SJ, et al. Evidence for sustained elevation of IL-6 in the CNS as a key contributor of depressive-like phenotypes. Transl Psychiatry. (2012) 2:e199. doi: 10.1038/tp.2012.120
67. Golden SA, Christoffel DJ, Heshmati M, Hodes GE, Magida J, Davis K, et al. Epigenetic regulation of RAC1 induces synaptic remodeling in stress disorders and depression. Nat Med. (2013) 19:337–44. doi: 10.1038/nm.3090
68. Goldstein BI, Carnethon MR, Matthews KA, McIntyre RS, Miller GE, Raghuveer G, et al. Major depressive disorder and bipolar disorder predispose youth to accelerated atherosclerosis and early cardiovascular disease: A scientific statement from the american heart association. Circulation. (2015) 132:965–86. doi: 10.1161/CIR.0000000000000229
69. Lee CF, Carley RE, Butler CA, Morrison AR. Rac GTPase signaling in immune-mediated mechanisms of atherosclerosis. Cells. (2021) 10:2808. doi: 10.3390/cells10112808
70. Wang H, Xiao L, Wang H, Wang G. Involvement of chronic unpredictable mild stress-induced hippocampal LRP1 up-regulation in microtubule instability and depressive-like behavior in a depressive-like adult male rat model. Physiol Behav. (2020) 215:112749. doi: 10.1016/j.physbeh.2019.112749
71. Guintivano J, Aberg KA, Clark SL, Rubinow DR, Sullivan PF, Meltzer-Brody S, et al. Transcriptome-wide association study for postpartum depression implicates altered B-cell activation and insulin resistance. Mol Psychiatry. (2022) 27:2858–67. doi: 10.1038/s41380-022-01525-7
72. Ahmetspahic D, Schwarte K, Ambrée O, Bürger C, Falcone V, Seiler K, et al. Altered B cell homeostasis in patients with major depressive disorder and normalization of CD5 surface expression on regulatory B cells in treatment responders. J Neuroimmune Pharmacol. (2018) 13:90–9. doi: 10.1007/s11481-017-9763-4
73. Allan LL, Hoefl K, Zheng D-J, Chung BK, Kozak FK, Tan R, et al. Apolipoprotein-mediated lipid antigen presentation in B cells provides a pathway for innate help by NKT cells. Blood. (2009) 114:2411–6. doi: 10.1182/blood-2009-04-211417
74. Tsiantoulas D, Sage AP, Mallat Z, Binder CJ. Targeting B cells in atherosclerosis: closing the gap from bench to bedside. Arterioscler Thromb Vasc Biol. (2015) 35:296–302. doi: 10.1161/ATVBAHA.114.303569
75. Chrysohoou C, Kollia N, Tousoulis D. The link between depression and atherosclerosis through the pathways of inflammation and endothelium dysfunction. Maturitas. (2018) 109:1–5. doi: 10.1016/j.maturitas.2017.12.001
76. Filadi R, Pendin D, Pizzo P. Mitofusin 2: from functions to disease. Cell Death Dis. (2018) 9:330. doi: 10.1038/s41419-017-0023-6
77. Jacob S, Kosaka Y, Bhatlekar S, Denorme F, Benzon H, Moody A, et al. Mitofusin-2 regulates platelet mitochondria and function. Circ Res. (2024) 134:143–61. doi: 10.1161/CIRCRESAHA.123.322914
78. Zhao N, Zhang Y, Liu Q, Xiang W. Mfn2 affects embryo development via mitochondrial dysfunction and apoptosis. PloS One. (2015) 10:e0125680. doi: 10.1371/journal.pone.0125680
79. Klinedinst NJ, Regenold WT. A mitochondrial bioenergetic basis of depression. J Bioenerg Biomembr. (2015) 47:155–71. doi: 10.1007/s10863-014-9584-6
80. Gebara E, Zanoletti O, Ghosal S, Grosse J, Schneider BL, Knott G, et al. Mitofusin-2 in the nucleus accumbens regulates anxiety and depression-like behaviors through mitochondrial and neuronal actions. Biol Psychiatry. (2021) 89:1033–44. doi: 10.1016/j.biopsych.2020.12.003
81. Goetzl EJ, Wolkowitz OM, Srihari VH, Reus VI, Goetzl L, Kapogiannis D, et al. Abnormal levels of mitochondrial proteins in plasma neuronal extracellular vesicles in major depressive disorder. Mol Psychiatry. (2021) 26:7355–62. doi: 10.1038/s41380-021-01268-x
Keywords: major depression, mendelian randomization, basophil, low-density lipoprotein cholesterol, MFN2
Citation: Mo X, Wang C, Pu Q, Zhang Z and Wu D (2024) Revealing genetic causality between blood-based biomarkers and major depression in east Asian ancestry. Front. Psychiatry 15:1424958. doi: 10.3389/fpsyt.2024.1424958
Received: 29 April 2024; Accepted: 26 August 2024;
Published: 10 September 2024.
Edited by:
Patrícia Patrício, University of Minho, PortugalReviewed by:
Marcin Siwek, Jagiellonian University, PolandStefanie Malan-Müller, Complutense University of Madrid, Spain
Yunlong Ma, University of Pennsylvania, United States
Copyright © 2024 Mo, Wang, Pu, Zhang and Wu. This is an open-access article distributed under the terms of the Creative Commons Attribution License (CC BY). The use, distribution or reproduction in other forums is permitted, provided the original author(s) and the copyright owner(s) are credited and that the original publication in this journal is cited, in accordance with accepted academic practice. No use, distribution or reproduction is permitted which does not comply with these terms.
*Correspondence: Dongmei Wu, ZG13dUBuam11LmVkdS5jbg==
†These authors have contributed equally to this work and share first authorship