 Xianlin Zhu
 Peng Wang2†
 Yanping Shu
- 1Department of Clinical Psychology, The Third Affiliated Hospital of Soochow University, Changzhou, China
- 2Department of Neurology, Anqing Municipal Hospital, Anqing, China
- 3Department of Psychiatry of Women and Children, The Second People’s Hospital of Guizhou Province, Guiyang, China
- 4Department of Rehabilitation Medicine, Kangda College of Nanjing Medical University, Nanjing, China
- 5Ninth clinical Department, Mental Health Center, the First Hospital of Hebei Medical University, Shijiazhuang, China
Background: Lipid Accumulation Product (LAP) is a new type of obesity index. The relationship between LAP and depression is unclear, and this cross-sectional study was conducted to explore the relationship between LAP and depression using the National Health and Nutrition Examination Survey (NHANES) database from 2005–2018.
Methods: In our study, logistic regression analysis was used to calculate the odds ratio between depression and LAP, and subgroup analysis and sensitivity analysis were also performed to verify the robustness of the results.
Results: The analysis included 13,240 participants aged 20 years or older. After adjusting for multiple variables, LAP was positively associated with depression, OR 1. 50 (95% CI, 1. 05–2. 12). In subgroup analysis, LAP was significantly positively, associated with depression among male (2. 52, OR; 95% CI, 1. 39,4. 57), non-Hispanic Black (2. 55, OR; 95% CI, 1. 49,4. 36), those without diabetes (1. 67, OR; 95% CI, (1. 06,2. 61) or in the overweight (2. 09, OR; 95% CI, (1. 23,3. 54) subgroups. After inverse probability of treatment weighting (IPTW), the OR for the highest versus lowest quartile was 1. 55 (95% CI: 1. 24 – 1. 95).
Conclusion: There are positive results between LAP and depression after adjusting for multiple potential variables, and prospective studies are needed to verify the results.
1 Introduction
Depression is a type of mental illness characterized by low mood that interferes with an individual’s social functioning and leads to mental disability (1). Depression is a leading cause of disability, causing more than $10 billion a year in health care costs (2, 3). Depression is associated with diabetes (4), osteoarthritis (5), hypertension (6), obesity (7) and many other diseases, increasing the risk of hospitalization among depressed patients (8). An Australian study showed a biphasic relationship between depression and obesity, with a 37% increased risk of obesity among depressed people and an 18% increased risk of depression among obese people (9). This increased risk may be related to the presence of both genetic factors and lifestyle factors, such as a sedentary lifestyle, unhealthy diet, and smoking (10, 11). This dual correlation was stronger in the sensitivity analyses of young and middle-aged individuals.
Obesity is usually defined by relative body weight and is associated with a variety of cardiovascular and psychological disorders. Previously, BMI was often used to assess obesity, but in recent years, the accuracy of BMI in assessing obesity has been questioned (12). BMI does not reflect fat distribution or abdominal fat content and has limitations in assessing obesity (13). Excessive fat accumulation in patients with a normal BMI may also be hazardous to their health. Visceral fat accumulation increases the risk of depression (14) Yamamoto et al., 2016). Therefore, researchers have begun to study new indicators to assess obesity, and waist circumference(WC) is considered a better indicator because of its ability to assess abdominal fat accumulation (15) Fedewa et al., 2019). Researchers have introduced a new metric, the lipid accumulation product (LAP), which is an indicator of abdominal fat accumulation that is a combination of WC and triglyceride(TG) levels (16).
Several studies have shown that LAP is superior to WC and BMI in identifying CVD risk (16–18). In a longitudinal study on diabetes, LAP was shown to be associated with and better predict the 6-year incidence of type 2 diabetes than BMI (19). A German study showed that LAP was negatively associated with the risk of all-cause mortality (20). LAP is associated with a number of diseases, but few population-based epidemiological studies have examined the relationship between LAP and depression.
Moreover, whether subjects with higher LAP have an increased risk of depression is unknown. Therefore, the aim of our study was to examine the relationship between LAP and depression in adults in the general population.
2 Methods
2.1 Study design and participants
The National Health and Nutrition Examination Survey (NHANES) is conducted by the National Center for Health Statistics (NCHS) of the Centers for Disease Control and Prevention to determine the status of nutrition and health in the United States. We analyzed data for eight cycles from 2005 to 2018. All participants signed informed consent forms, and the study protocol was approved by the NCHS. Specific ethics information is available on the website (NHANES - NCHS Research Ethics Review Board Approval (cdc.gov)). The exclusion criteria were as follows: age younger than 20 years or missing age, depression diagnosis, and LAP data. The detailed results are shown in the flow chart in Figure 1.
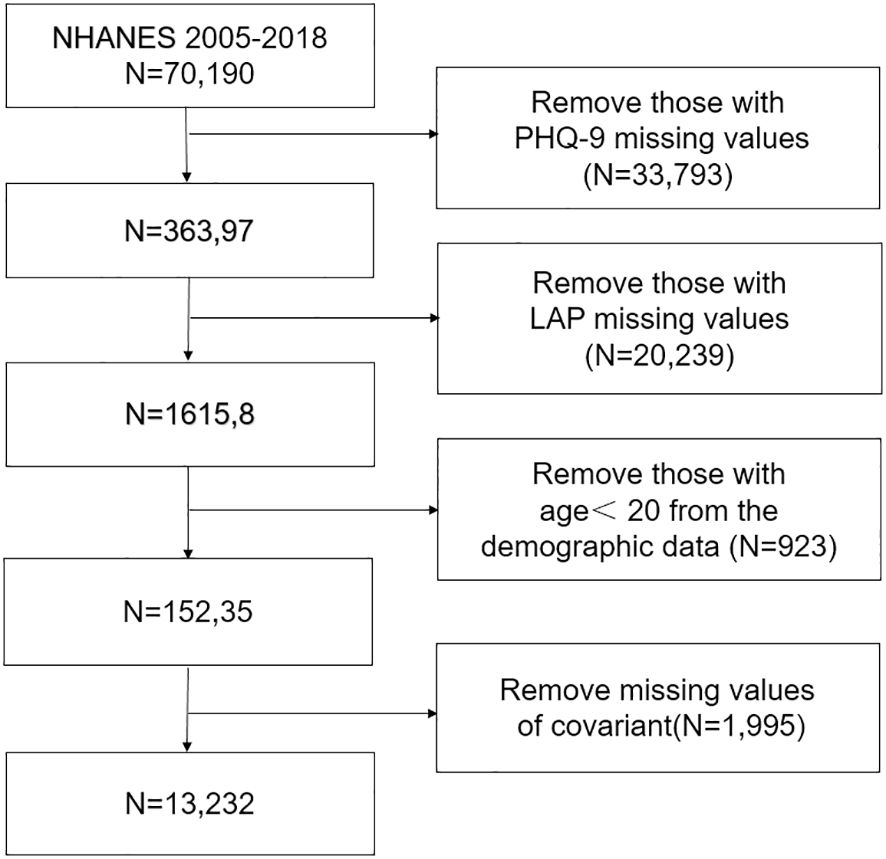
Figure 1 Selection of participants in the study.
2.2 Variables
2.2.1 Depression
In the NHANES dataset, the PHQ-9 was used to assess participants’ depressive symptoms over the past 2 weeks. Based on previous studies, a PHQ-9 score greater than 10 was defined as depression (21, 22).
2.2.2 Assessment of LAP
Triglycerides in the NHANES are measured by fasting blood samples taken by health professionals at mobile screening centers and sent to professional institutions using the end point method in the Beckman Synchron LX system in mmol/L(NHANES 2005–2006: Standard Biochemistry Profile Data Documentation, Codebook, and Frequencies (cdc. gov). Waist circumference is measured by a health professional using a tape measure to measure the length above the iliac crest in the midaxillary line at the end of normal breathing, accurate to within 0. 1 cm (23). The formula for LAP is as follows:
LAP for men = (WC [cm] - 65) × (TG concentration [mmol/L])
LAP for women = (WC [cm] - 58) × (TG concentration [mmol/L]) (24).
2.2.3 Covariates
The covariates included in our study were sex, race, age, marital status, education level, household income, body mass index, smoking status, alcohol consumption, diabetes status, and hypertension. Race was divided into four categories: Mexican American, non-Hispanic Black, non-Hispanic White and other. Education level was divided into four groups: college graduate or above, high school graduate/GED, below high school, or some college or AA degree. Marital status was divided into four groups: divorced/separated, married/cohabiting, never married, and widowed. BMI was classified as normal (18. 5≤BMI<25), overweight (25≤BMI<30) and obese (BMI≥30) (25). If there was a 0 in the group with a BMI <18. 5, the group was removed from the subgroup analysis. Age was divided into three groups: age group 1 (20–39), age group 2 (40–59) and age group 3 (≥60). Individuals were divided into three groups according to smoking status: never (smoked fewer than 100 cigarettes in a lifetime); former (current nonsmoker, former smoker who smoked more than 100 cigarettes); and current (smoking more than 100 cigarettes and regular smoking) smokers. Individuals were divided into three groups according to alcohol consumption: never (fewer than 12 drinks in a lifetime); former (drinking more than 12 drinks but not in the past year); and current (drinking more than 12 drinks in the past year) drinkers. The diagnostic criteria for diabetes were as follows: was diagnosed with diabetes by a doctor, was taking hypoglycemic medication and insulin, had a glycated hemoglobin level ≥6. 5%, had a fasting blood glucose level ≥7. 0 mmol/l, and had a random blood glucose or 2-hour OGTT blood glucose level ≥11. 1 mmol/l. The diagnostic criteria for hypertension were as follows: mean SBP≥140 mmHg or mean DBP≥90 mmHg; was diagnosed with hypertension by a doctor; and was taking blood pressure medication (26, 27).
2.4 Statistical analysis
Our analysis included NHANES sampling weights to increase the representativeness of the results. Continuous variables are expressed as the means ± standard errors, and categorical variables are expressed as percentages. LAP data were divided into quartiles, with the lowest quartile serving as the reference category. We used multiple weighted logistic regression models to analyze the association between LAP and depression, and the results are presented with 95% confidence intervals (CIs) and odds ratios (ORs). No variables were adjusted for in the crude model. Model 1 was adjusted for age, sex, and race. Model 2 was adjusted for marital status, household income, smoking status, alcohol consumption, hypertension status, and diabetes status based on Model 1. Model 3 further adjusted for BMI based on Model 2. In addition, subgroup analyses were conducted to test the association between LAP and depression by sex, race, diabetes status, and hypertension status. Finally, we conducted a sensitivity analysis and performed analysis of variance on the unweighted data. We included all covariates to perform inverse probability of treatment weighting (IPTW) on the unweighted data. R 4. 3. 0 was used for the statistical analysis. Restricted cubic splines (RCSs) were used to examine the nonlinear relationship between LAP and depression. All tests were two-sided, and p < 0. 05 was considered to indicate statistical significance.
3 Results
3.1 Patient characteristics
The NHANES database from 2005 to 2018 included 39,749 adult participants; 26,059 participants with missing values were excluded, and 13,240 individuals were included in the analysis. According to the unweighted data, 1098 (8. 29%) participants had depression, and 12,142 (91. 71%) did not have depression; similarly, the weighted ratios of depression to non-depression were 7. 16% and 92. 84%, respectively. As shown in Table 1, there were significant differences according to sex, race, household income, BMI, education level, marital status, smoking status, alcohol consumption, hypertension status, diabetes status, take statins, LAP and depression.
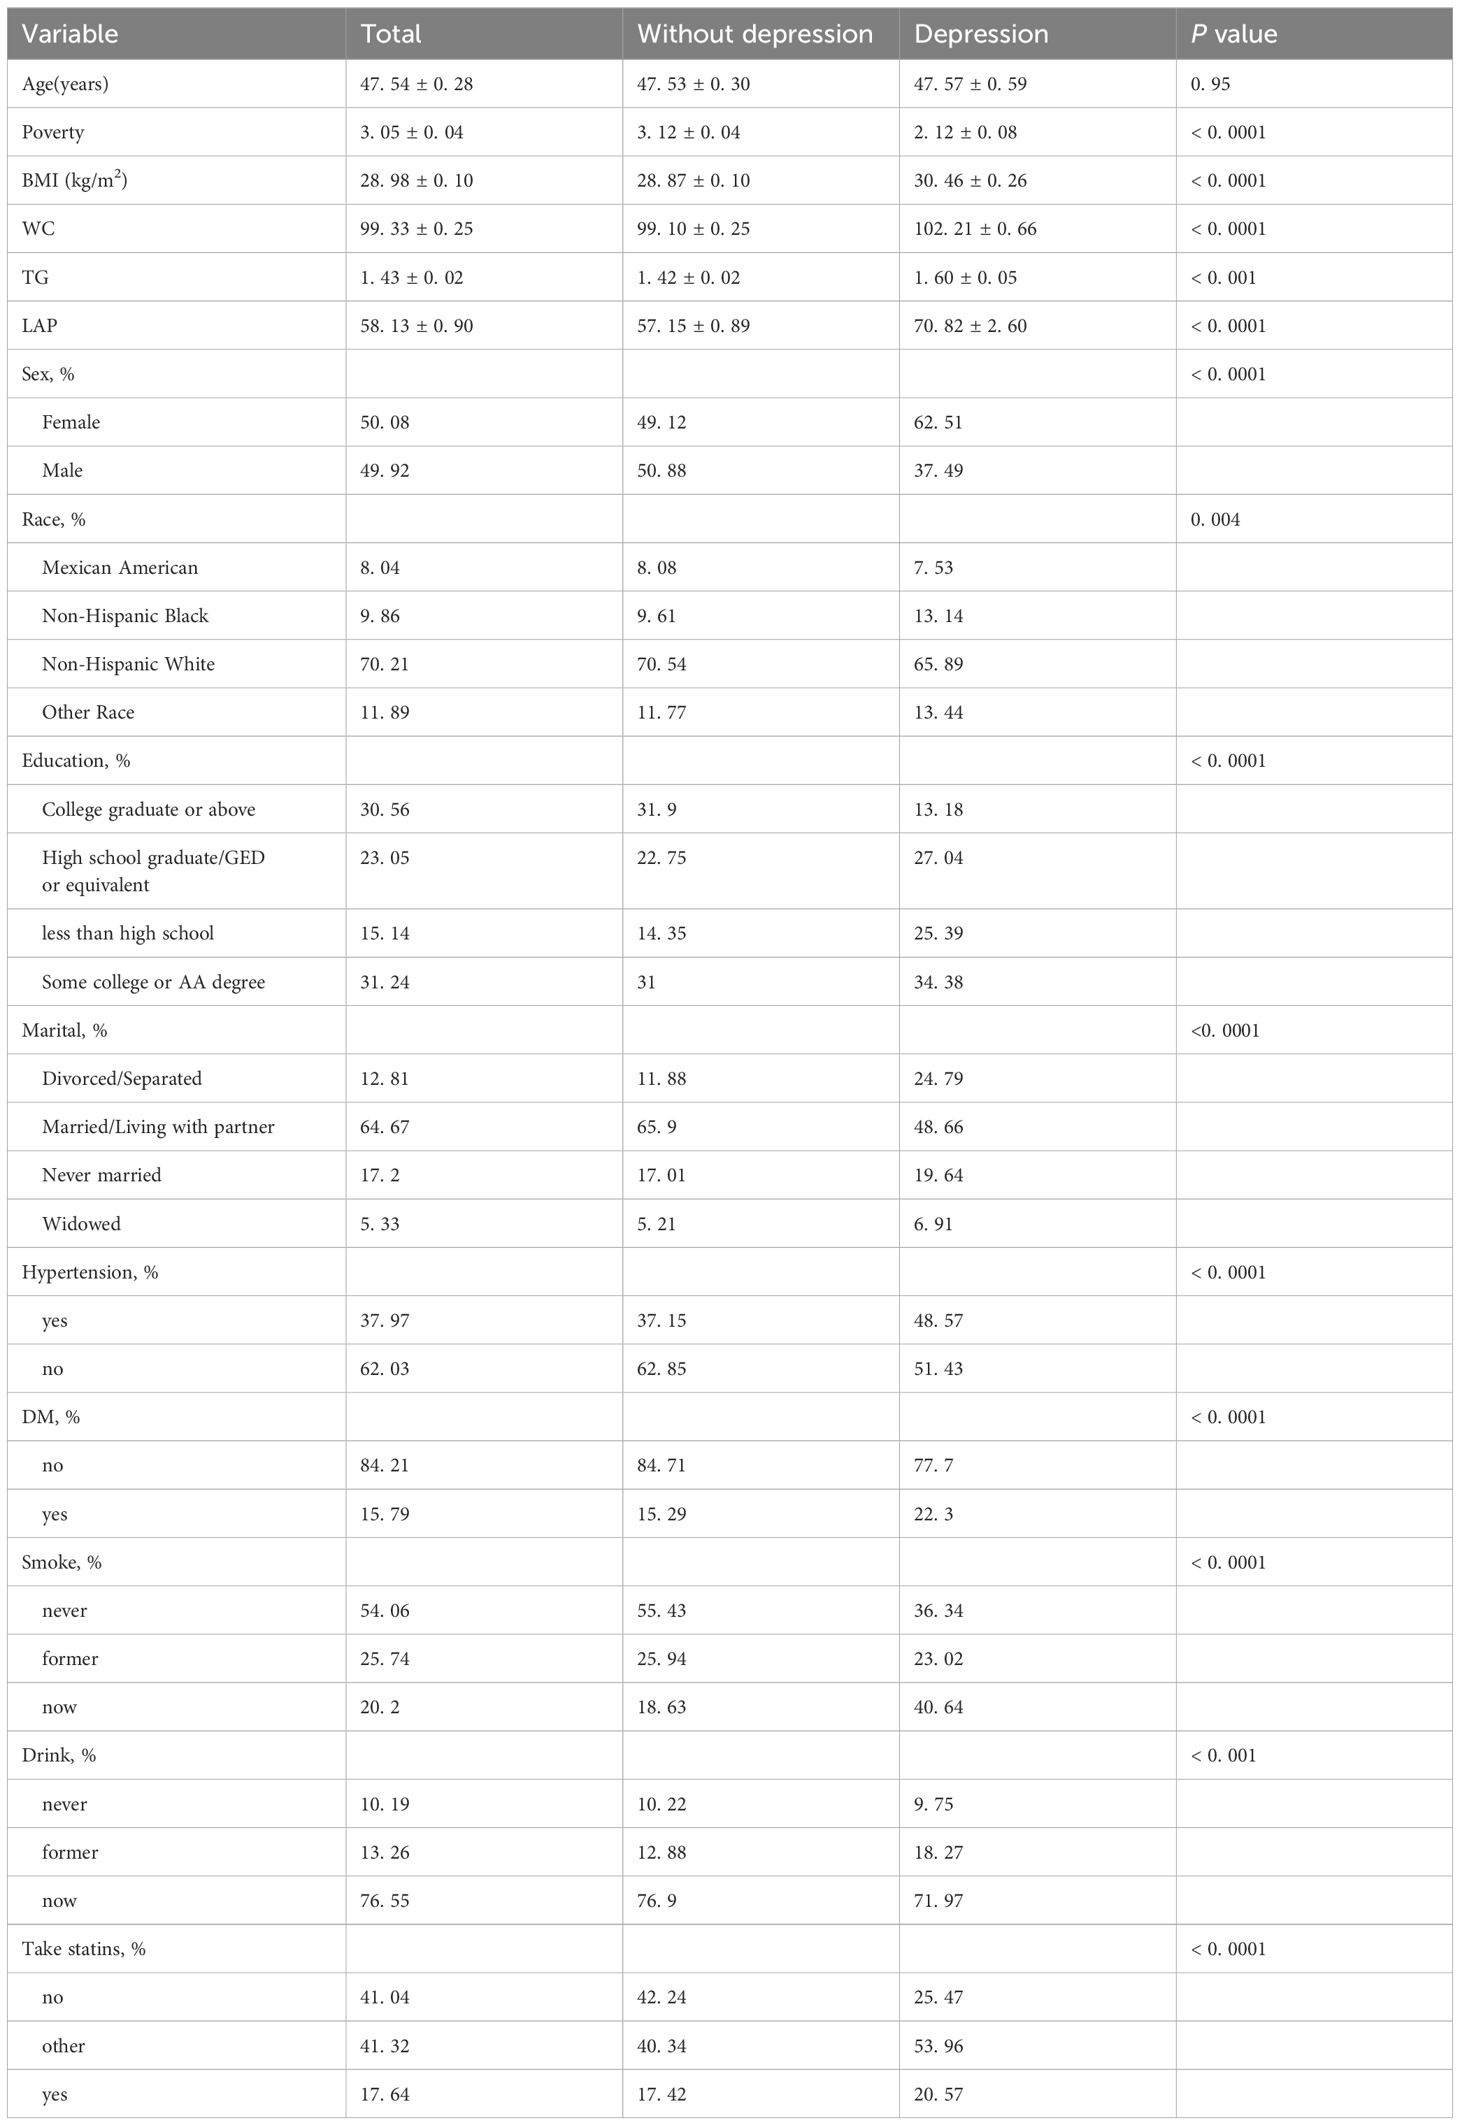
Table 1 Weighted baseline characteristics of patients with or without depression.
3.2 Association of LAP with depression
The relationship between LAP and depression is shown in Table 2. The LAP was divided into four groups: Q1 (LAP =0. 34, 23. 75), Q2 (LAP =23. 75, 42. 60), Q3 (LAP =42. 60, 73. 60), and Q4 (LAP =73. 60, 2642. 84). No covariates were adjusted for in the crude model, and there was a positive relationship between LAP and depression. The OR with 95% CI in the highest quartile versus the lowest quartile was 2. 02 (1. 56, 2. 61). In Model 1, after adjusting for LAP, age, race and sex, the OR with 95% CI of depression in the highest quartile versus the lowest quartile was 2. 35 (1. 89, 2. 92). After further adjustment for marital status, PIR, educational level, smoking status, alcohol consumption, and hypertension and diabetes status based on Model 1, the OR with 95% CI in Model 2 was 1. 68 (1. 32, 2. 14). The relationship between LAP and depression was still robust in Model 3 (fully adjusted model; OR, 1. 50; 95% CI, 1. 05–2. 15). A significant positive trend was observed between increasing LAP and the risk of depression (p for trend<0. 05).
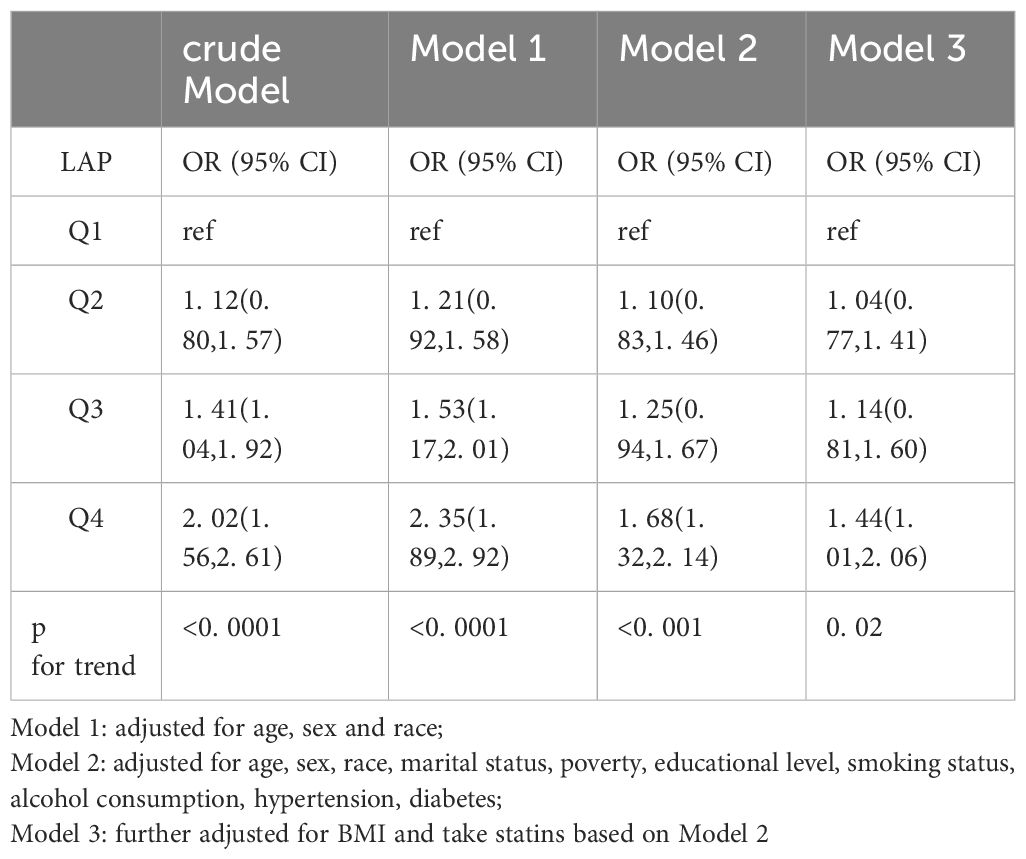
Table 2 Association between LAP and depression.
3.3 Subgroup analyses
The results of the subgroup analyses are shown in Table 3. LAP was significantly positively associated with depression among males (2. 52, OR; 95% CI, 1. 39, 4. 57), non-Hispanic Black individuals (2. 55, OR; 95% CI, 1. 49, 4. 36), individuals without diabetes (1. 67, OR; 95% CI, 1. 06, 2. 61) and individuals in the overweight (2. 09, OR; 95% CI, 1. 23, 3. 54) subgroup.
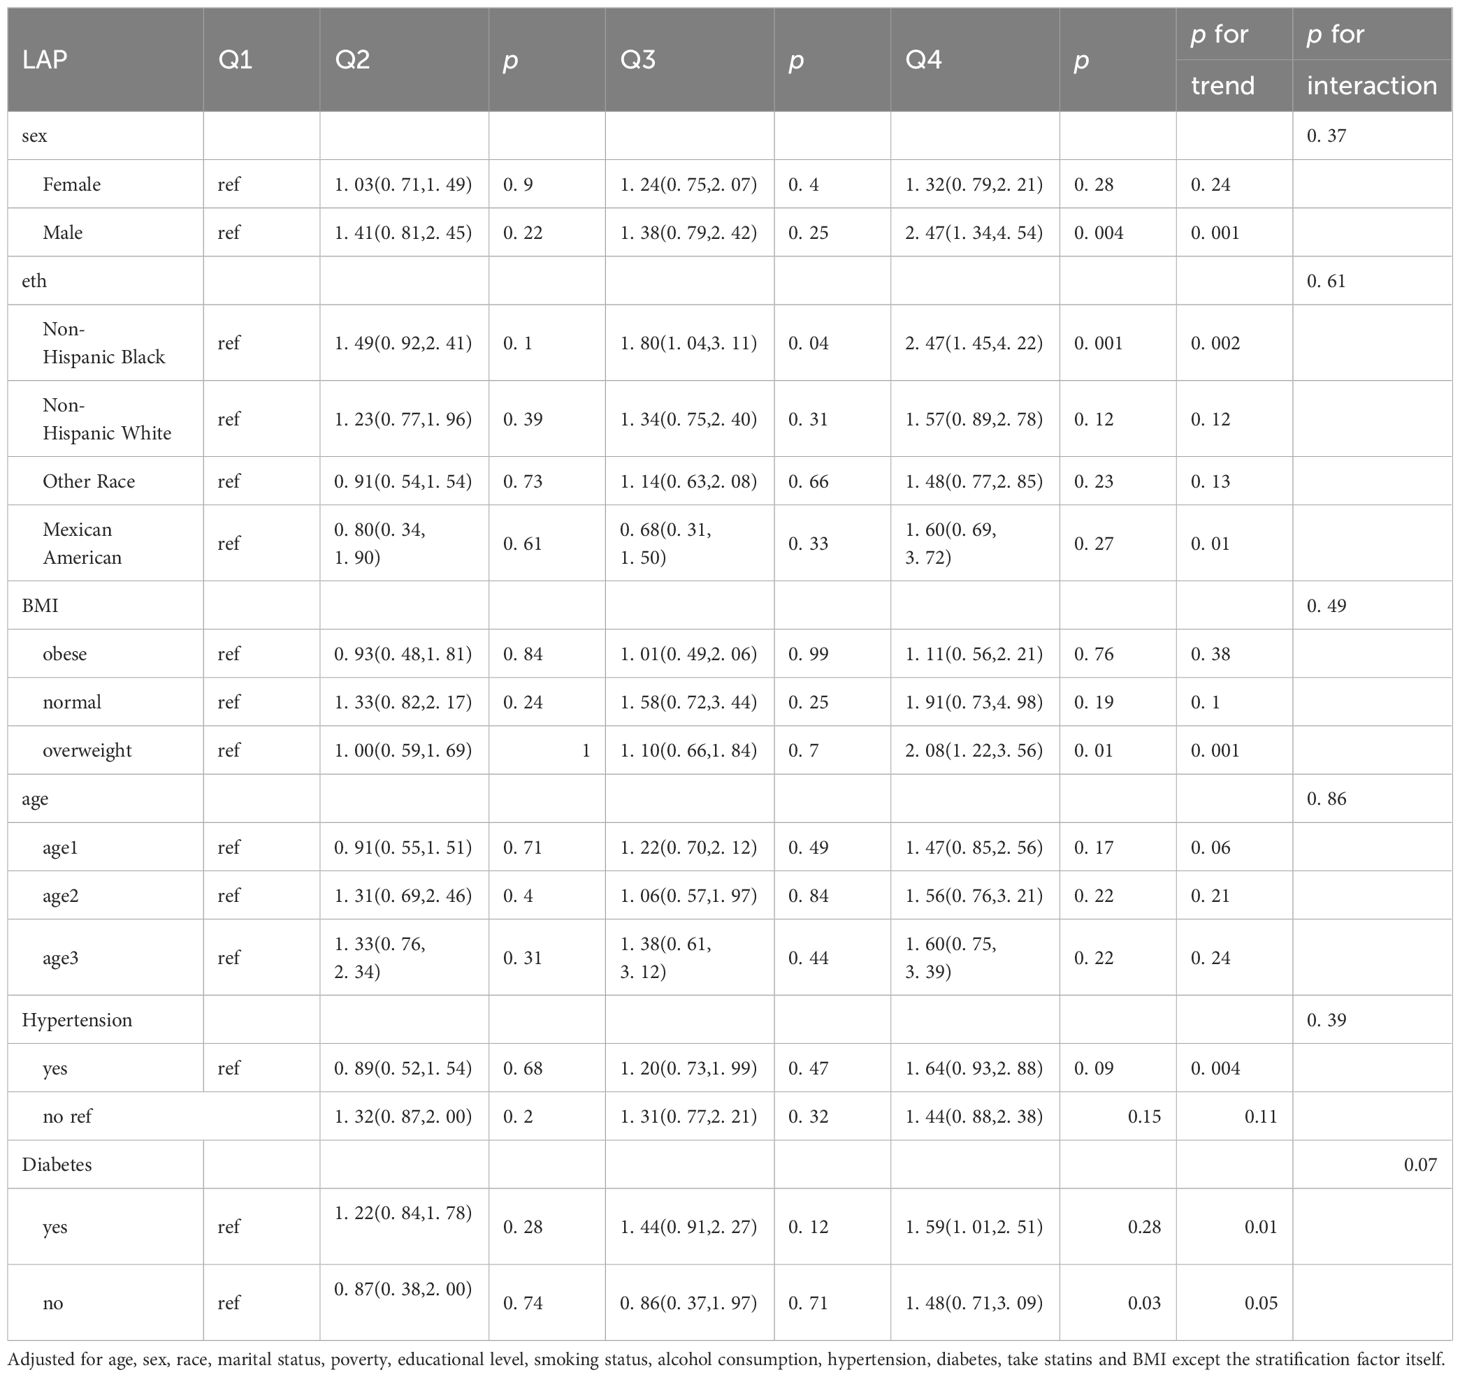
Table 3 Subgroup analyses stratified by sex, race, BMI, age, diabetes and hypertension.
3.4 Sensitivity analyses
The results of the subgroup analysis are presented in Table 4. After IPTW, the OR for the highest quartile versus the lowest quartile was 1. 55 (95% CI: 1. 24–1. 95). The trend test yielded results consistent with those of the previous analysis (p for trend<0. 01).
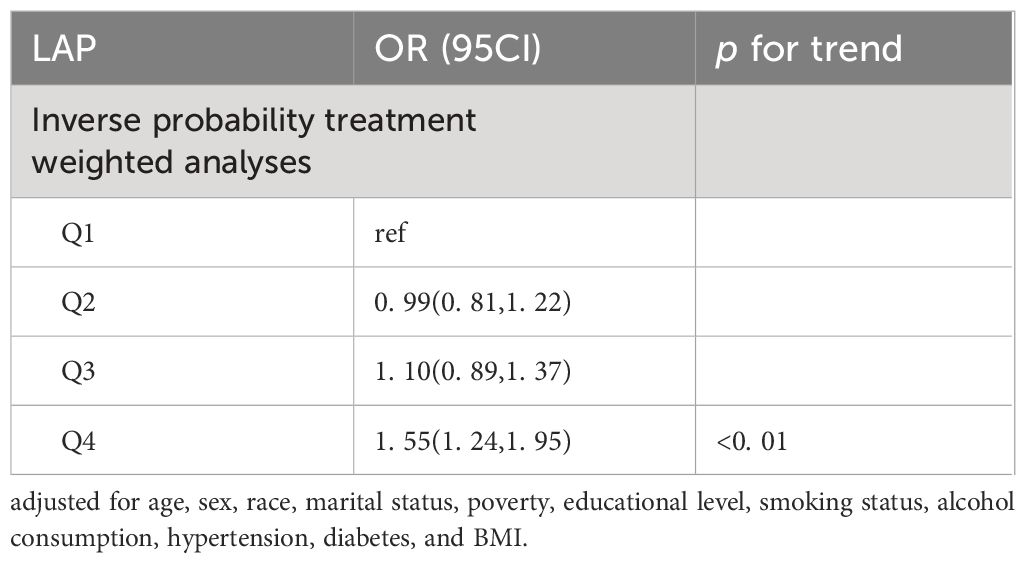
Table 4 Sensitivity analyses.
3.5 The non-linear relationship between LAP and depression
After adjusting for multiple variables, the RCS analysis showed a nonlinear correlation between LAP and depression (P for nonlinearity < 0. 05; Figure 2). The risk of depression was significantly lower when the LAP value was <30. 56, significantly higher when the LAP value was in the range of 30. 56–131. 90, and slightly lower when the LAP value was greater than 131. 90. There was a complex nonlinear relationship between Lap and depression.
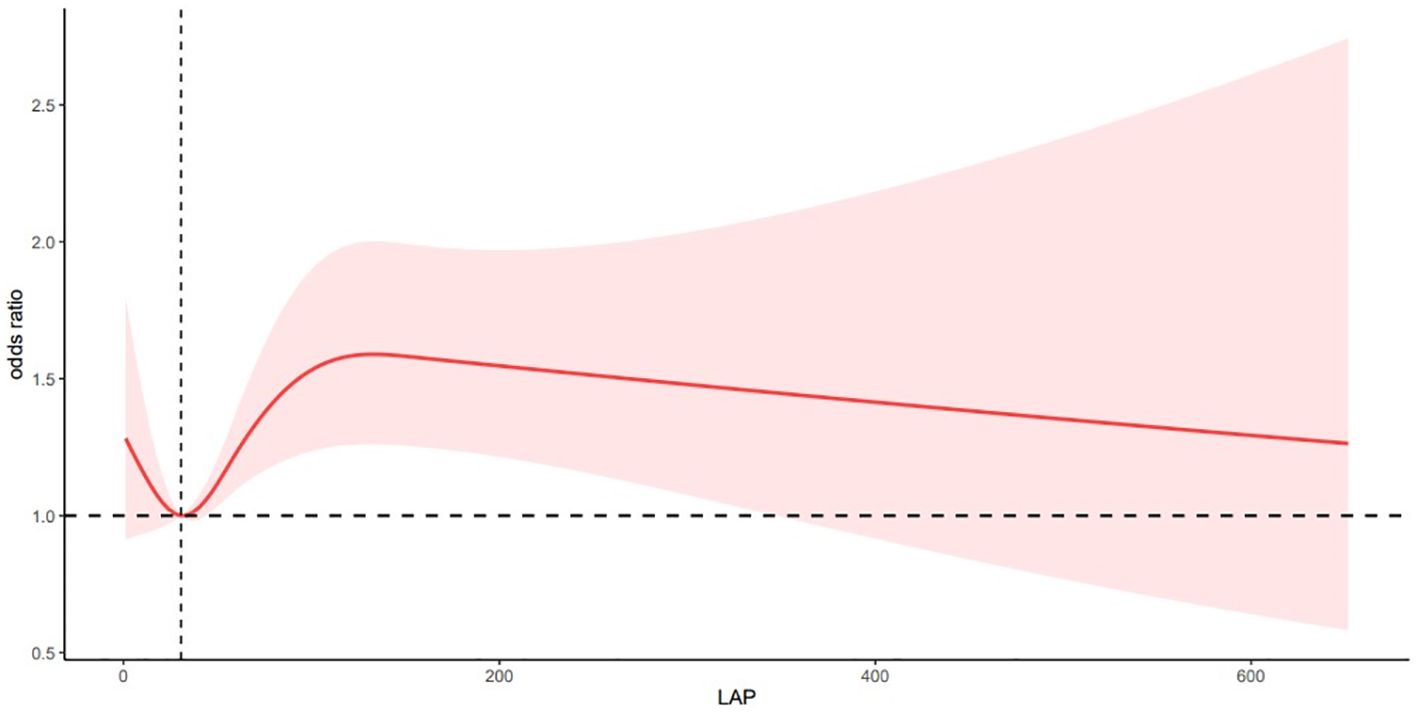
Figure 2 Association of LAP and depression in a RCS model among all participants.
P overall< 0. 05 P for nonlinear< 0. 05
Adjusted for age, sex, race, marital status, poverty, educational level, smoking status, alcohol consumption, hypertension, diabetes, and BMI.
4 Discussion
To our knowledge, this is the first study to explore the relationship between LAP and depression using a representative sample from the United States. We found a positive association between LAP and depression. Subgroup analyses revealed higher ORs for the association between LAP and depression in men, non-Hispanic Black people, individuals without diabetes, and overweight individuals. The results of the sensitivity analysis supported our findings.
To date, there are limited data on the relationship between LAP and depression. The LAP was originally proposed by Kahn et al. to compensate for the inadequacy of BMI in assessing obesity (24). In a cross-sectional sample of 8942 middle-aged and elderly people in China, researchers found that LAP was correlated with depressive symptoms in men and women and could be used as an indicator of depressive symptoms in middle-aged and elderly people (28). The results for middle-aged and older Asians may not be representative of the American population. In addition, adjusting for BMI made our results on LAP more reliable.
The mechanism of the relationship between LAP and depression needs to be further explored and may be related to the following reasons. First, depression is associated with insulin resistance (IR) (29, 30). IR levels increase by 6. 1% in women and 13. 2% in men with depression, and WC partially mediates this association (31). Animal studies have shown that IR alters dopamine transport in mice, leading to depression-like behavior (32). Curcumin can upregulate insulin receptor substrates in the liver, improve insulin sensitivity, and alleviate depression-like behavior in rats (33). In the population, high glycemic variability increases the incidence of depression (34). LAP is a novel indicator of IR (35). Our study is the first to observe a positive association between LAP quartiles and depression in a representative population. A high LAP may also mediate depression in a manner similar to IR. Second, triglycerides may bind to glucocorticoid receptors via cortisol, and glucocorticoid receptors activate lipids to inhibit lipid mobilization, thereby affecting metabolic abnormalities of the hypothalamic pituitary adrenal axis and contributing to depression (36, 37). Finally, a greater WC causes abdominal fat to accumulate as white fat in the form of stored triglycerides, and adipose tissue secretes cytokines such as IL-6 and TNF-α (38, 39). Animal studies have shown that IL-6 and TNF-α lead to depressive behavior in mice through neuroinflammatory pathways (40–42).
According to our subgroup analysis, a higher LAP was associated with a greater risk of depression in men (p for trend < 0. 05). This finding may be related to higher rates of IR among men than among women (31), and longitudinal studies have shown that IR increases the risk of developing depression 5 years later (43). This difference may also be related to differences in leptin levels between men and women among depressed patients (44, 45). In addition, WC is higher in men than in women (46). Women store most of their fat in subcutaneous fat such as hips and thighs, while male fat is concentrated in the viscera and is associated with high central obesity (47). Estrogen is lower in men than in women and estrogen is protective against fat accumulation (48) In the overweight population, a higher LAP was associated with a greater risk of depression. Studies have shown that overweight, depressed patients may have increased exogenous peripheral inflammation, and decreased systemic inflammation contributes to the development of depression (49, 50). Therefore, it is important to consider men with a high LAP and overweight as a high-risk group for depression. Further clinical and longitudinal studies are needed to validate our findings.
The strengths of our study include the fact that the results can be extrapolated to the general population based on a large sample population and a sophisticated sampling design. Second, the collection of laboratory, scale assessment and anthropometric data was standardized and homogeneous. Third, the LAP test is relatively convenient and inexpensive, making it easier to generalize its use to clinical settings in the future. However, this study also has several limitations: this was a cross-sectional study, and a causal relationship between LAP and depression could not be inferred. Second, the diagnosis of depression was made using the PHQ-9 scale rather than the gold standard of the Diagnostic and Statistical Manual of Mental Disorders (DSM-V), but numerous studies have demonstrated the reliability of the PHQ-9 (22, 51). Finally, the influence of antilipidemic drugs could not be excluded.
5 Conclusion
In conclusion, our study revealed a significant association between LAP and depression after we adjusted for multiple confounders. Lowering LAP may play an important role in the diagnosis and treatment of depression, but this needs to be further confirmed in prospective studies.
Data availability statement
Publicly available datasets were analyzed in this study. This data can be found here: www.cdc.gov/nchs/nhanes/index.htm.
Ethics statement
The studies involving humans were approved by NCHS Research Ethics Review Board Approval. The studies were conducted in accordance with the local legislation and institutional requirements. The participants provided their written informed consent to participate in this study.
Author contributions
XZ: Conceptualization, Data curation, Software, Writing – original draft, Writing – review & editing. PW: Conceptualization, Data curation, Software, Writing – original draft, Writing – review & editing. YY: Writing – original draft, Writing – review & editing. TW: Writing – original draft, Writing – review & editing. JC: Writing – original draft, Writing – review & editing. YS: Conceptualization, Funding acquisition, Supervision, Writing – review & editing. LM: Conceptualization, Supervision, Writing – review & editing.
Funding
The author(s) declare financial support was received for the research, authorship, and/or publication of this article. The work was supported by Science and Technology Plan Project of Guizhou Provincial Health commission in 2021 (gzwkj2021-150; 2022 Guizhou Provincial Health Commission Science and Technology Fund Project Application gzwkj2022-073, Guizhou Science and Technology Plan Project (Guizhou Science and Technology Foundation-ZK (2023) General 195), Guizhou High-level Innovative Talent Project (thousand levels): gzwjrs2022-013.
Acknowledgments
We thank the participants and the staff of the NHANES database.
Conflict of interest
The authors declare that the research was conducted in the absence of any commercial or financial relationships that could be construed as a potential conflict of interest.
Publisher’s note
All claims expressed in this article are solely those of the authors and do not necessarily represent those of their affiliated organizations, or those of the publisher, the editors and the reviewers. Any product that may be evaluated in this article, or claim that may be made by its manufacturer, is not guaranteed or endorsed by the publisher.
References
1. Kupferberg A, Bicks L, Hasler G. Social functioning in major depressive disorder. Neurosci Biobehav Rev. (2016) 69:313–32. doi: 10.1016/j.neubiorev.2016.07.002
2. James SL, Abate D, Abate KH, Abay SM, Abbafati C, Abbasi N, et al. Global, regional, and national incidence, prevalence, and years lived with disability for 354 diseases and injuries for 195 countries and territories, 1990–2017: a systematic analysis for the global burden of disease study 2017. Lancet. (2018) 392:1789–858. doi: 10.1016/S0140-6736(18)32279-7
3. Tanner J, Hensel J, Davies PE, Brown LC, Dechairo BM, Mulsant BH. Economic burden of depression and associated resource use in manitoba, Canada. Can J Psychiatry. (2020) 65:338–46. doi: 10.1177/0706743719895342
4. Owens-Gary MD, Zhang X, Jawanda S, Bullard KM, Allweiss P, Smith BD. The importance of addressing depression and diabetes distress in adults with type 2 diabetes. J Gen Internal Med. (2019) 34:320–4. doi: 10.1007/s11606-018-4705-2
5. Fonseca-Rodrigues D, Rodrigues A, Martins T, Pinto J, Amorim D, Almeida A, et al. Correlation between pain severity and levels of anxiety and depression in osteoarthritis patients: a systematic review and meta-analysis. Rheumatology. (2022) 61:53–75. doi: 10.1093/rheumatology/keab512
6. Fernald F, Snijder M, van den Born B, Lok A, Peters R, Agyemang C. Depression and hypertension awareness, treatment, and control in a multiethnic population in the Netherlands: HELIUS study. Intern Emerg Med. (2021) 16:1895–903. doi: 10.1007/s11739-021-02717-9
7. Milaneschi Y, Simmons WK, van Rossum EFC, Penninx BW. Depression and obesity: evidence of shared biological mechanisms. Mol Psychiatr. (2019) 24:18–33. doi: 10.1038/s41380-018-0017-5
8. Frank P, Batty GD, Pentti J, Jokela M, Poole L, Ervasti J, et al. Association between depression and physical conditions requiring hospitalization. JAMA Psychiat. (2023) 80:690. doi: 10.1001/jamapsychiatry.2023.0777
9. Mannan M, Mamun A, Doi S, Clavarino A. Is there a bi-directional relationship between depression and obesity among adult men and women? Systematic Rev bias-adjusted meta analysis. Asian J Psychiatr. (2016) 21:51–66. doi: 10.1016/j.ajp.2015.12.008
10. Hidese S, Asano S, Saito K, Sasayama D, Kunugi H. Association of depression with body mass index classification, metabolic disease, and lifestyle: A web-based survey involving 11,876 Japanese people. J Psychiatr Res. (2018) 102:23–8. doi: 10.1016/j.jpsychires.2018.02.009
11. Yancey AK, Wold CM, McCarthy WJ, Weber MD, Lee B, Simon PA, et al. Physical inactivity and overweight among Los Angeles County adults. Am J Prev Med. (2004) 27:146–52. doi: 10.1016/j.amepre.2004.03.012
12. Donini LM, Pinto A, Giusti AM, Lenzi A, Poggiogalle E. Obesity or BMI paradox? Beneath Tip Iceberg. Front Nutr (Lausanne). (2020) 7:53. doi: 10.3389/fnut.2020.00053
13. Mamtani MR, Kulkarni HR. Predictive performance of anthropometric indexes of central obesity for the risk of type 2 diabetes. Arch Med Res. (2005) 36:581–9. doi: 10.1016/j.arcmed.2005.03.049
14. Yamamoto S, Matsushita Y, Nakagawa T, Honda T, Hayashi T, Noda M, et al. Visceral fat accumulation, insulin resistance, and elevated depressive symptoms in middle-aged Japanese men. PloS One. (2016) 11:e149436. doi: 10.1371/journal.pone.0149436
15. Fedewa MV, Nickerson BS, Esco MR. Associations of body adiposity index, waist circumference, and body mass index in young adults. Clin Nutr. (2019) 38:715–20. doi: 10.1016/j.clnu.2018.03.014
16. Kahn HS. The lipid accumulation product is better than BMI for identifying diabetes: a population-based comparison. Diabetes Care. (2006) 29:151–3. doi: 10.2337/diacare.29.01.06.dc05-1805
17. Tian T, Pei H, Chen Z, Hailili G, Wang S, Sun Y, et al. Comparison of lipid accumulation product and body mass index as indicators of diabetes diagnosis among 215,651 Chinese adults. Peerj. (2020) 8:e8483. doi: 10.7717/peerj.8483
18. Wang Y, Liu W, Sun L, Zhang Y, Wang B, Yuan Y, et al. A novel indicator, childhood lipid accumulation product, is associated with hypertension in Chinese children and adolescents. Hypertens Res. (2020) 43:305–12. doi: 10.1038/s41440-019-0366-8
19. Bozorgmanesh M, Hadaegh F, Azizi F. Diabetes prediction, lipid accumulation product, and adiposity measures; 6-year follow-up: Tehran lipid and glucose study. Lipids Health Dis. (2010) 9:45. doi: 10.1186/1476-511X-9-45
20. Bozorgmanesh M, Hadaegh F, Azizi F. Predictive performances of lipid accumulation product vs. adiposity measures for cardiovascular diseases and all-cause mortality, 8. 6-year follow-up: Tehran lipid and glucose study. Lipids Health Dis. (2010) 9:100. doi: 10.1186/1476-511X-9-100
21. Kroenke K, Spitzer RL, Williams JB. The PHQ-9: validity of a brief depression severity measure. J Gen Intern Med. (2001) 16:606–13. doi: 10.1046/j.1525-1497.2001.016009606.x
22. Carey M, Jones KA, Yoong SL, D’Este C, Boyes AW, Paul C, et al. Comparison of a single self-assessment item with the PHQ-9 for detecting depression in general practice. Fam Pract. (2014) 31:483–9. doi: 10.1093/fampra/cmu018
23. Zhu X, Yue Y, Li L, Zhu L, Cai Y, Shu Y. The relationship between depression and relative fat mass (RFM): A population-based study. J Affect Disord. (2024) 356:323–8. doi: 10.1016/j.jad.2024.04.031
24. Kahn HS. The “lipid accumulation product” performs better than the body mass index for recognizing cardiovascular risk: a population-based comparison. BMC Cardiovasc Disor. (2005) 5:26. doi: 10.1186/1471-2261-5-26
25. Akram D, Astrup A, Atinmo T, Boissin J, Bray GA, Carroll KK, et al. Obesity: preventing and managing the global epidemic. Rep WHO consultation. World Health Organ Tech Rep Ser. (2000) 894:1–253.
26. Unger T, Borghi C, Charchar F, Khan NA, Poulter NR, Prabhakaran D, et al. 2020 international society of hypertension global hypertension practice guidelines. Hypertension. (2020) 75:1334–57. doi: 10.1161/HYPERTENSIONAHA.120.15026
27. Wu L, Kong C, Shi Y, Zhang J, Chen S. Associations between novel anthropometric measures and the prevalence of hypertension among 45,853 adults: A cross-sectional study. Front Cardiovasc Med. (2022) 9:1050654. doi: 10.3389/fcvm.2022.1050654
28. Wang Y, Zhang X, Li Y, Gui J, Mei Y, Yang X, et al. Predicting depressive symptom by cardiometabolic indicators in mid-aged and older adults in China: a population-based cross-sectional study. Front Psychiatry. (2023) 14:1153316. doi: 10.3389/fpsyt.2023.1153316
29. Fernandes BS, Salagre E, Enduru N, Grande I, Vieta E, Zhao Z. Insulin resistance in depression: A large meta-analysis of metabolic parameters and variation. Neurosci Biobehav R. (2022) 139:104758. doi: 10.1016/j.neubiorev.2022.104758
30. Sen ZD, Danyeli LV, Woelfer M, Lamers F, Wagner G, Sobanski T, et al. Linking atypical depression and insulin resistance-related disorders via low-grade chronic inflammation: Integrating the phenotypic, molecular and neuroanatomical dimensions. Brain Behavior Immun. (2021) 93:335–52. doi: 10.1016/j.bbi.2020.12.020
31. Pearson S, Schmidt M, Patton G, Dwyer T, Blizzard L, Otahal P, et al. Depression and insulin resistance: cross-sectional associations in young adults. Diabetes Care. (2010) 33:1128–33. doi: 10.2337/dc09-1940
32. Kleinridders A, Cai W, Cappellucci L, Ghazarian A, Collins WR, Vienberg SG, et al. Insulin resistance in brain alters dopamine turnover and causes behavioral disorders. Proc Natl Acad Sci. (2015) 112:3463–8. doi: 10.1073/pnas.1500877112
33. Shen J, Wei Y, Li Y, Qiao J, Li Y. Curcumin reverses the depressive-like behavior and insulin resistance induced by chronic mild stress. Metab Brain Dis. (2017) 32:1163–72. doi: 10.1007/s11011-017-0017-1
34. Kwon M, Lee M, Kim EH, Choi D, Jung E, Kim KY, et al. Risk of depression and anxiety disorders according to long-term glycemic variability. J Affect Disord. (2023) 343:50–8. doi: 10.1016/j.jad.2023.09.017
35. Ahn N, Baumeister SE, Amann U, Rathmann W, Peters A, Huth C, et al. Visceral adiposity index (VAI), lipid accumulation product (LAP), and product of triglycerides and glucose (TyG) to discriminate prediabetes and diabetes. Sci Rep-Uk. (2019) 9:9693. doi: 10.1038/s41598-019-46187-8
36. Bjorntorp P. Do stress reactions cause abdominal obesity and comorbidities? Obes Rev. (2001) 2:73–86. doi: 10.1046/j.1467-789x.2001.00027.x
37. Vogelzangs N, Suthers K, Ferrucci L, Simonsick EM, Ble A, Schrager M, et al. Hypercortisolemic depression is associated with the metabolic syndrome in late-life. Psychoneuroendocrino. (2007) 32:151–9. doi: 10.1016/j.psyneuen.2006.11.009
38. Lamers F, Vogelzangs N, Merikangas K, de Jonge P, Beekman A, Penninx BWJH. Evidence for a differential role of HPA-axis function, inflammation and metabolic syndrome in melancholic versus atypical depression. Mol Psychiatr. (2013) 18:692–9. doi: 10.1038/mp.2012.144
39. Shelton RC, Miller AH. Eating ourselves to death (and despair): The contribution of adiposity and inflammation to depression. Prog Neurobiol. (2010) 91:275–99. doi: 10.1016/j.pneurobio.2010.04.004
40. Menard C, Pfau ML, Hodes GE, Kana V, Wang VX, Bouchard S, et al. Social stress induces neurovascular pathology promoting depression. Nat Neurosci. (2017) 20:1752–60. doi: 10.1038/s41593-017-0010-3
41. Kelly KM, Smith JA, Mezuk B. Depression and interleukin-6 signaling: A Mendelian Randomization study. Brain Behavior Immun. (2021) 95:106–14. doi: 10.1016/j.bbi.2021.02.019
42. Xu X, Piao HN, Aosai F, Zeng XY, Cheng JH, Cui YX, et al. Arctigenin protects against depression by inhibiting microglial activation and neuroinflammation via HMGB1/TLR4/NF-κB and TNF-α/TNFR1/NF-κB pathways. Brit J Pharmacol. (2020) 177:5224–45. doi: 10.1111/bph.15261
43. Ford AH, Flicker L, Hankey GJ, Yeap BB, Chubb SAP, Golledge J, et al. Insulin resistance and depressive symptoms in older men: the health in men study. Am J Geriatric Psychiatry. (2015) 23:872–80. doi: 10.1016/j.jagp.2014.10.010
44. Antonijevic IA, Murck H, Frieboes RM, Horn R, Brabant G, Steiger A. Elevated nocturnal profiles of serum leptin in patients with depression. J Psychiatr Res. (1998) 32:403–10. doi: 10.1016/S0022-3956(98)00032-6
45. Li L, Gower BA, Shelton RC, Wu X. Gender-specific relationship between obesity and major depression. Front Endocrinol. (2017) 8:292. doi: 10.3389/fendo.2017.00292
46. Ross R, Neeland IJ, Yamashita S, Shai I, Seidell J, Magni P, et al. Waist circumference as a vital sign in clinical practice: A Consensus Statement from the IAS and ICCR Working Group on Visceral Obesity. Nat Rev Endocrinology. (2020) 16:177–89. doi: 10.1038/s41574-019-0310-7
47. Karpe F, Pinnick KE. Biology of upper-body and lower-body adipose tissue–link to whole-body phenotypes. Nat Rev Endocrinol. (2015) 11:90–100. doi: 10.1038/nrendo.2014.185
48. Zhang ZC, Liu Y, Xiao LL, Li SF, Jiang JH, Zhao Y, et al. Upregulation of miR-125b by estrogen protects against non-alcoholic fatty liver in female mice. J Hepatol. (2015) 63:1466–75. doi: 10.1016/j.jhep.2015.07.037
49. McLaughlin AP, Nikkheslat N, Hastings C, Nettis MA, Kose M, Worrell C, et al. The influence of comorbid depression and overweight status on peripheral inflammation and cortisol levels. Psychol Med. (2022) 52:3289–96. doi: 10.1017/S0033291721000088
50. Wium-Andersen MK, Ørsted DD, Nielsen SF, Nordestgaard BG. Elevated C-reactive protein levels, psychological distress, and depression in 73131 individuals. JAMA Psychiatry. (2013) 70:176–84. doi: 10.1001/2013.jamapsychiatry.102
51. Maske UE, Busch MA, Jacobi F, Beesdo-Baum K, Seiffert I, Wittchen H, et al. Current major depressive syndrome measured with the Patient Health Questionnaire-9 (PHQ-9) and the Composite International Diagnostic Interview (CIDI): results from a cross-sectional population-based study of adults in Germany. BMC Psychiatry. (2015) 15:77. doi: 10.1186/s12888-015-0463-4
Keywords: depression, NHANES, LAP, obesity, survey
Citation: Zhu X, Wang P, Yue Y, Wu T, Cui J, Shu Y and Ma L (2024) The relationship between depression and lipid accumulation product: a population-based study. Front. Psychiatry 15:1395766. doi: 10.3389/fpsyt.2024.1395766
Received: 04 March 2024; Accepted: 19 June 2024;
Published: 08 July 2024.
Edited by:
Ravi Philip Rajkumar, Jawaharlal Institute of Postgraduate Medical Education and Research (JIPMER), IndiaReviewed by:
Pei Jiang, Jining First People’s Hospital, ChinaLaura Beth McIntire, NewYork-Presbyterian, United States
Copyright © 2024 Zhu, Wang, Yue, Wu, Cui, Shu and Ma. This is an open-access article distributed under the terms of the Creative Commons Attribution License (CC BY). The use, distribution or reproduction in other forums is permitted, provided the original author(s) and the copyright owner(s) are credited and that the original publication in this journal is cited, in accordance with accepted academic practice. No use, distribution or reproduction is permitted which does not comply with these terms.
*Correspondence: Yanping Shu, c3lwXzgwNTNAMTYzLmNvbQ==; Ling Ma, Y3ptYWxpbmdAMTYzLmNvbQ==
†These authors have contributed equally to this work