
94% of researchers rate our articles as excellent or good
Learn more about the work of our research integrity team to safeguard the quality of each article we publish.
Find out more
ORIGINAL RESEARCH article
Front. Psychiatry, 23 July 2024
Sec. Aging Psychiatry
Volume 15 - 2024 | https://doi.org/10.3389/fpsyt.2024.1373797
 Sanjula D. Singh1,2,3‡
 Cyprien A. Rivier4,5‡
 Keren Papier6†
 Zeina Chemali1,2,7
 Leidys Gutierrez-Martinez1,2,3Livia Parodi1,2,3,8,9
 Ernst Mayerhofer1,2,3,8,9
 Jasper Senff1,2,3,10
 Santiago Clocchiatti-Tuozzo4,5Courtney Nunley1
 Amy Newhouse1,7,11An Ouyang1
 M. Brandon Westover1,2
 Rudolph E. Tanzi1,2
 Ronald M. Lazar12
 Aleksandra Pikula13,14
 Sarah Ibrahim13,15,16,17H. Bart Brouwers18
 Virginia J. Howard19
 George Howard19Nirupama Yechoor1,2,3Thomas Littlejohns6Kevin N. Sheth4,5Jonathan Rosand1,2,3,8Gregory Fricchione1,20Christopher D. Anderson1,2,3,8,9*‡
 Guido J. Falcone4,5*‡
Introduction: The 21-point Brain Care Score (BCS) is a novel tool designed to motivate individuals and care providers to take action to reduce the risk of stroke and dementia by encouraging lifestyle changes. Given that late-life depression is increasingly recognized to share risk factors with stroke and dementia, and is an important clinical endpoint for brain health, we tested the hypothesis that a higher BCS is associated with a reduced incidence of future depression. Additionally, we examined its association with a brain health composite outcome comprising stroke, dementia, and late-life depression.
Methods: The BCS was derived from the United Kingdom Biobank baseline evaluation in participants with complete data on BCS items. Associations of BCS with the risk of subsequent incident late-life depression and the composite brain health outcome were estimated using multivariable Cox proportional hazard models. These models were adjusted for age at baseline and sex assigned at birth.
Results: A total of 363,323 participants were included in this analysis, with a median BCS at baseline of 12 (IQR: 11-14). There were 6,628 incident cases of late-life depression during a median follow-up period of 13 years. Each five-point increase in baseline BCS was associated with a 33% lower risk of incident late-life depression (95% CI: 29%-36%) and a 27% lower risk of the incident composite outcome (95% CI: 24%-30%).
Discussion: These data further demonstrate the shared risk factors across depression, dementia, and stroke. The findings suggest that a higher BCS, indicative of healthier lifestyle choices, is significantly associated with a lower incidence of late-life depression and a composite brain health outcome. Additional validation of the BCS is warranted to assess the weighting of its components, its motivational aspects, and its acceptability and adaptability in routine clinical care worldwide.
Late-life depression, dementia and stroke and are amongst the age-related brain diseases with the highest prevalence and incidence worldwide (1). Late-life depression, usually characterized as primary depression occurring in individuals over the age of 60, has significant implications. It not only increases mortality and morbidity rates but also imposes a considerable economic burden, both directly through healthcare costs and indirectly through impacts on productivity and societal roles (2). Moreover, past research has correlated late-life depression with cognitive decline (e.g., decreased pace of information processing, memory disorders and decreased executive function) (3). Clinically, the diagnoses of late-life depression and dementia can be difficult to disentangle. In a study involving approximately 1000 participants from the Framingham Heart Study, those who had experienced depression before the study’s baseline were found to have a 50% increased risk of dementia over a 17-year follow-up period, compared to participants without a history of depression (4). The same is thought to be true for stroke and depression: people with a depression are reported to have a 45% higher risk for stroke and a 25% higher risk of stroke-related mortality compared to those without a depression (5). Shared modifiable risk factors for late-life depression, dementia and stroke have been consistently reported in previous meta-analyses: and include smoking tobacco, nutrition, physical activity and social-emotional determinants of health, all of which are included in the McCance Brain Care Score [BCS] (2, 6–9).
The aims, characteristics, and development of the BCS have been described elsewhere (10). Briefly, the BCS includes modifiable risk factors for the most common age-related brain diseases (dementia, stroke, and late-life depression), which are endorsed by professional societies and patient advocacy groups (11). The total BCS ranges from 0-21 and consists of 4 physical components (blood pressure, haemoglobin A1c, cholesterol, and Body Mass Index [BMI]), 5 lifestyle elements (nutrition, alcohol intake, smoking, aerobic activities, and sleep), and 3 social emotional factors (stress, relationships, and purpose in life) (Figure 1). The BCS is designed to be implemented into routine primary care, ultimately as a motivational tool for health behaviours which stimulate risk factor reduction for dementia, stroke and late-life depression as manifestations of impaired brain health. Previous results have shown clinically relevant and statistically significant associations between the BCS and dementia and stroke incidence using the United Kingdom Biobank (UKB). Herewith, we report the first-ever analyses of associations between the BCS and late-life depression incidence, as well as a combined incidence of stroke, dementia, and late-life depression. Our hypothesis is that a higher baseline BCS in the UKB cohort, which indicates better brain care, would be associated with a lower incidence of late-life depression – in line with the findings for baseline BCS in the UKB and subsequent dementia and stroke incidence (10). Through demonstrating that the Brain Care Score (BCS) serves as a reliable predictor for brain health events, we aim to further substantiate its utility as a clinically relevant tool.
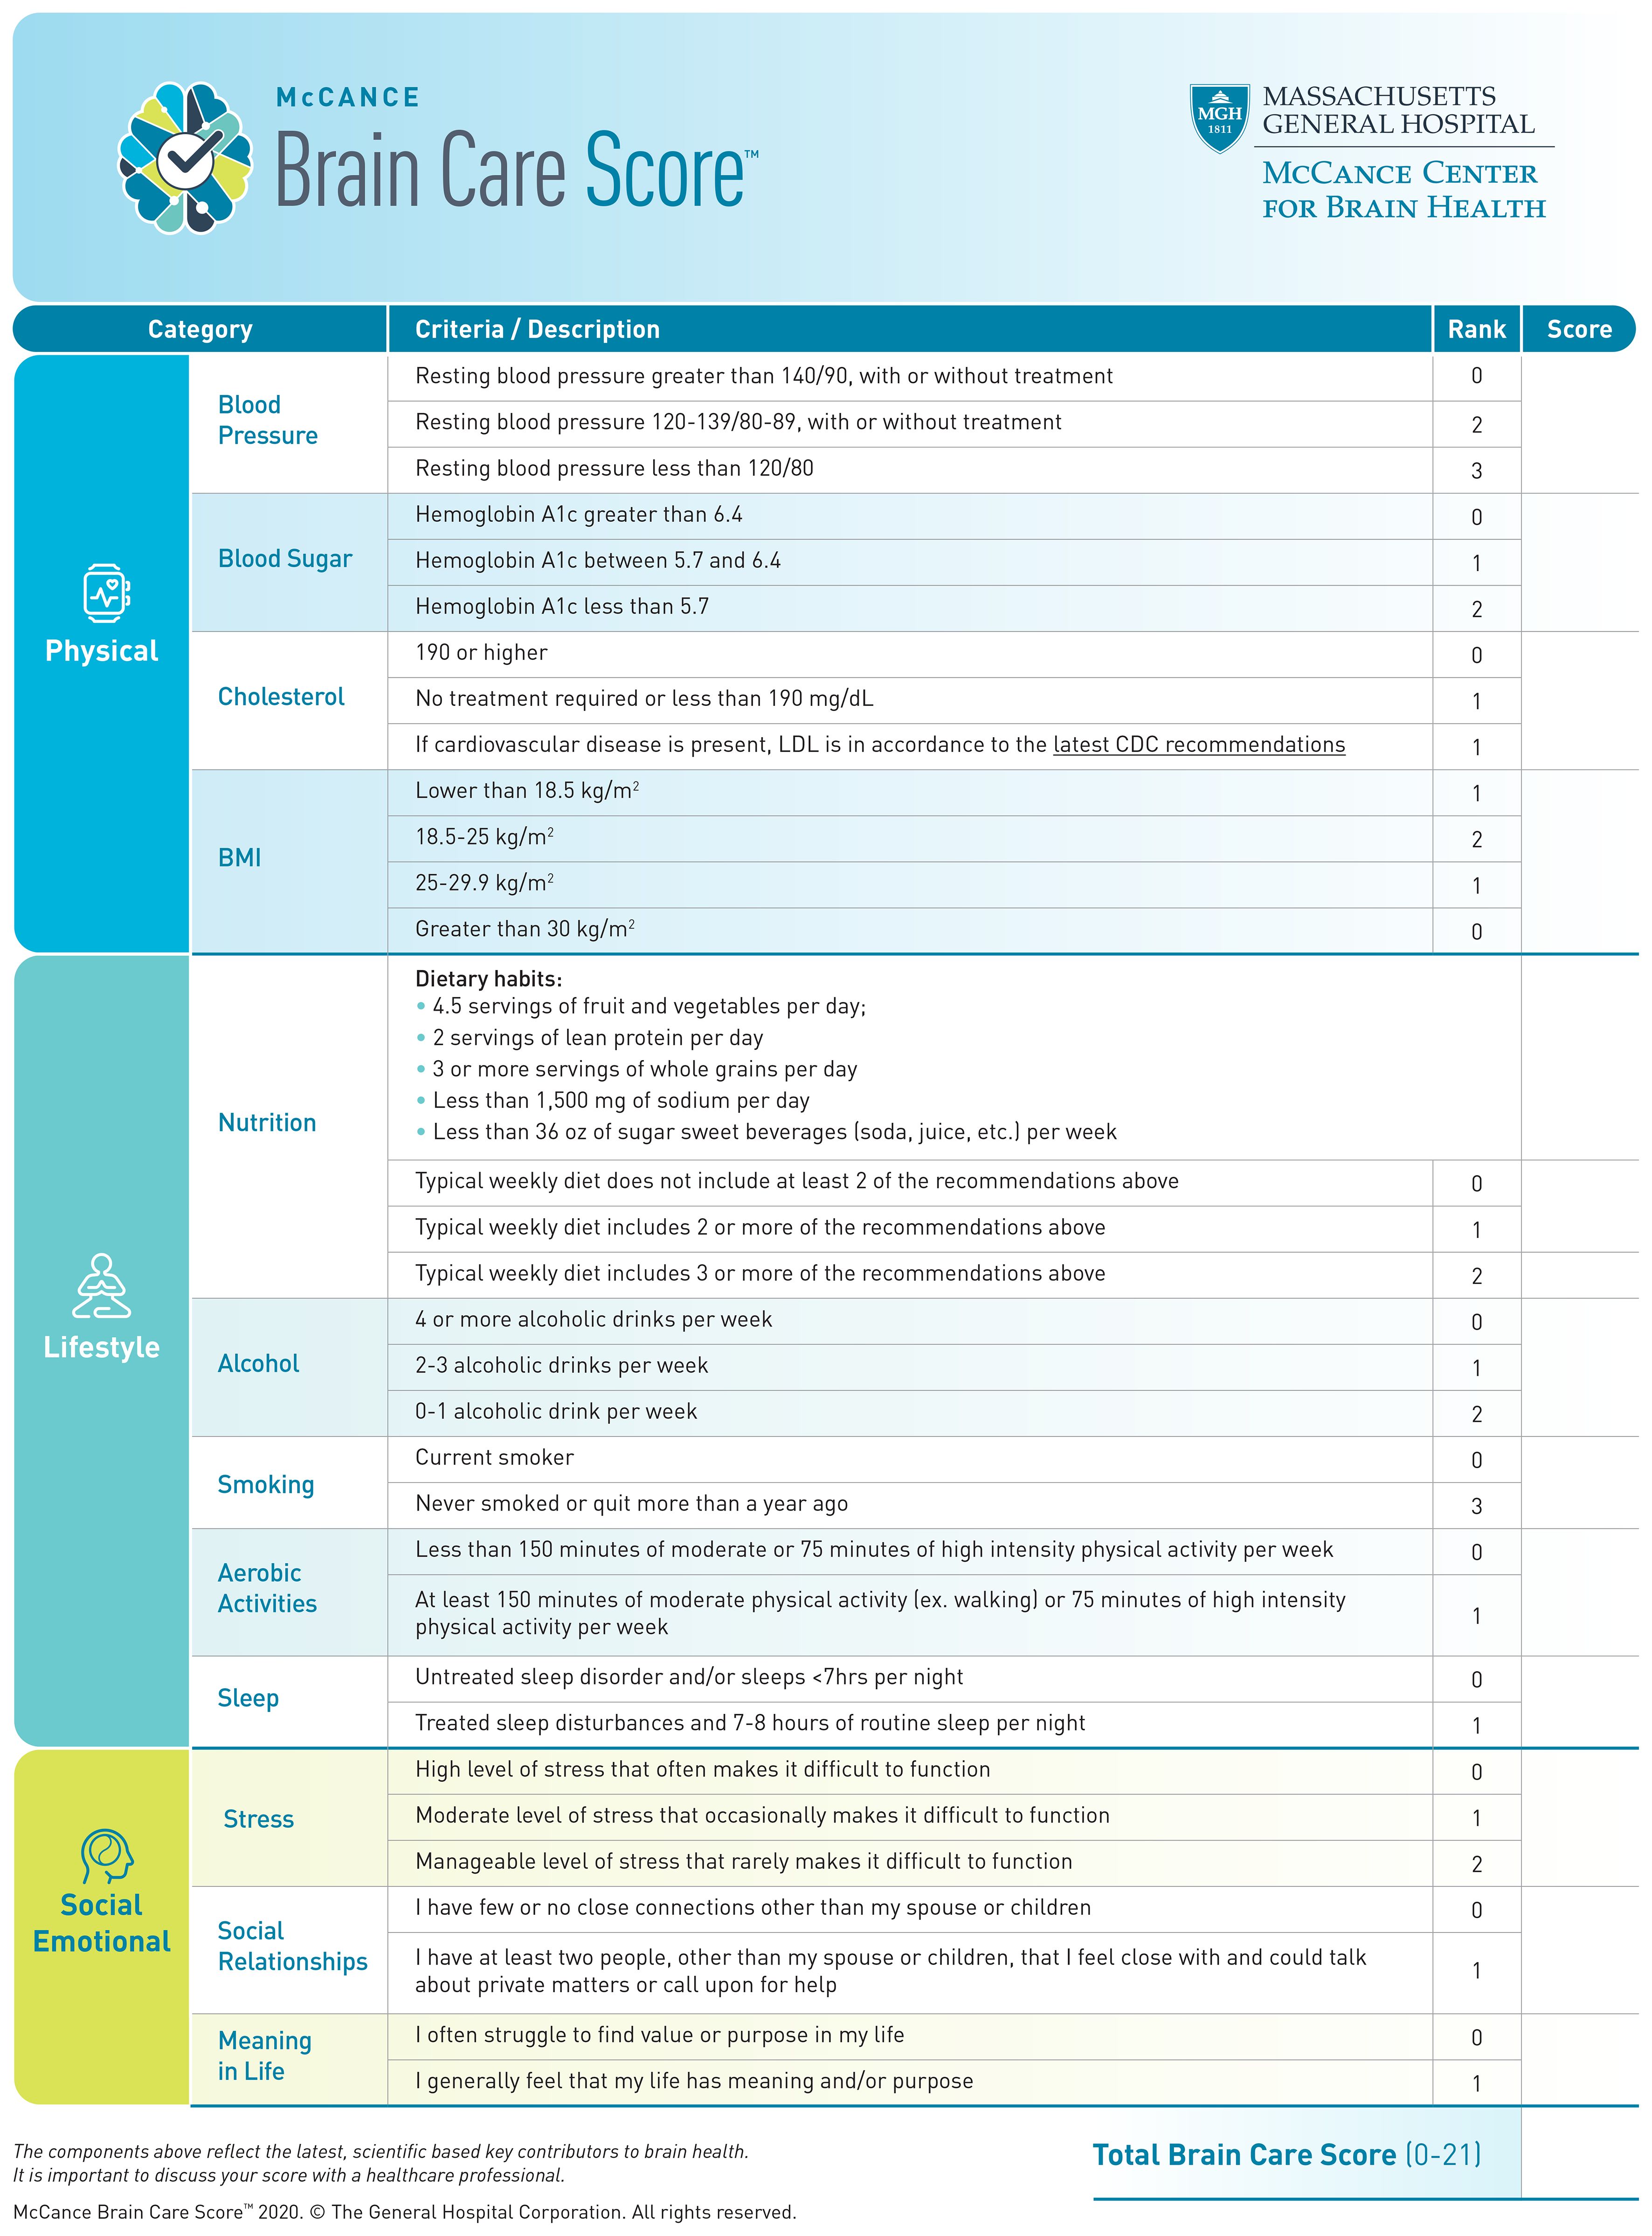
Figure 1. The Brain Care Score.
The methodology, study design, and inclusion and exclusion criteria of the UK Biobank study, have been delineated in a previous publication (12). In essence, the UK Biobank study constitutes a population-based, prospective cohort study that comprises half a million voluntary participants from the United Kingdom. These participants were enrolled from 22 centres dispersed across the country. Comprehensive data were assembled at baseline (between 2006 and 2010) through questionnaires, anthropometric evaluations, and biomedical measurements. The recruitment targeted individuals aged between 40 and 69 years, with only a negligible number of participants being outside this age range (mainly those who accompanied those invited to the UK Biobank study’s assessment centres). As of the present, there have been three follow-up assessments, conducted in 2012-2013, 2014 onwards, and 2019 onwards, respectively. Health outcomes for all participants are consistently gathered via linkage to health data, encompassing both hospital and mortality data. The UK Biobank study was performed in accordance with the principles established in the Declaration of Helsinki and received approval from the Northwest Multi-Centre Research Ethics Committee (reference number 06/MRE08/65). All human research participants in the UK Biobank study provided their informed consent.
The BCS is a three-dimensional instrument that captures physical, lifestyle, and social and emotional measures. Physical measures include blood pressure, blood sugar, cholesterol, and Body Mass Index (BMI); lifestyle measures include nutrition, alcohol consumption, smoking, aerobic activities, and sleep; and emotional measures include stress, social relationships, and meaning in life (Figure 1) (13). In the context of the present study, the Brain Care Score (BCS) has been tailored using the data collected by the UK Biobank (UKB), hence leading to a modified version of the BCS (refer to Table 1; for detailed variable definitions of the UKB-derived BCS and discrepancies with the original BCS, see Supplementary Information Table S1). The process of deriving individual BCS components started with the precise criterion for each component. Adjustments were made only if required due to statistical power considerations or in the absence of relevant data within the UK Biobank. For all components of the BCS that rely on self-reported data, participants who responded with “do not know” or “prefer not to answer” in the UKB questionnaires were omitted from the study (12, 14).
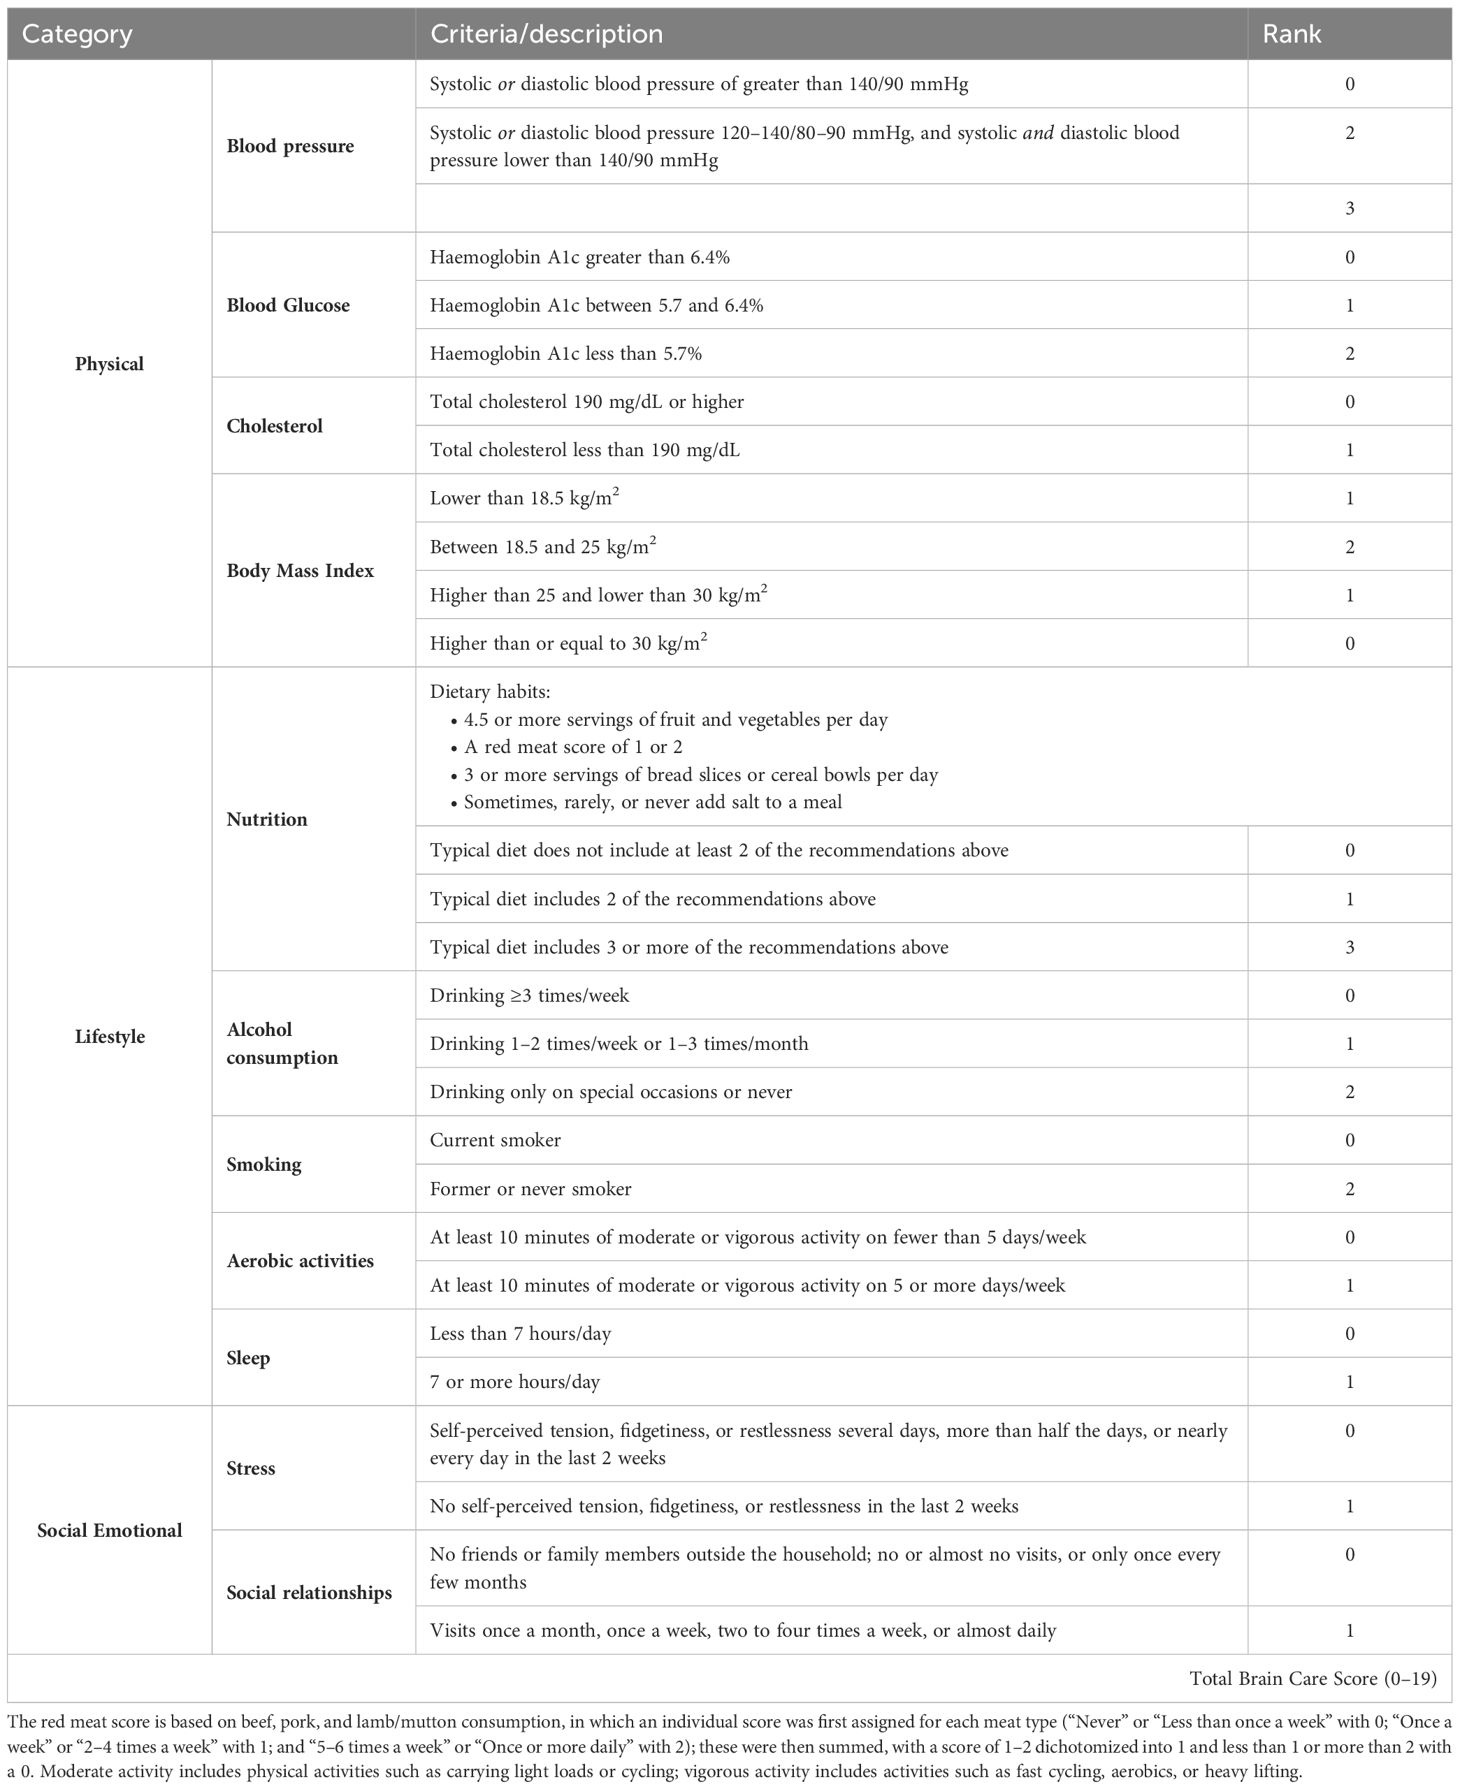
Table 1. Brain Care Score in the UK Biobank.
The BCS is determined by the summation of the specific scores allocated to each component for an individual. To illustrate: a person who obtains the lowest score in all components will have a BCS of 0, while a person consistently achieving the highest score — either 1, 2, or 3, contingent upon the component — will possess a BCS of 19. Originally, the BCS spanned a range of 0 to 21, but when adapted for the UK Biobank, the scale was adjusted to span from 0 to 19 due to modifications in the scoring for nutrition, stress, and life purpose. A greater BCS correlates with superior brain care. An increase of five points in the total BCS, for example from 0–5 or 10–15, is indicative of a significant, yet attainable, enhancement in one’s brain care. Consequently, a 5-point increment in BCS can be set as an initial target for patients and healthcare providers, with several strategies available to attain this improvement. For instance, a 5-point elevation in BCS could be accomplished through: ceasing smoking and reducing stress levels (no symptoms of tension, restlessness, or anxiety in the past two weeks) while improving social connections (engaging with family or friends at least once monthly); or reducing alcohol intake (from 4 units per week to less than 1 unit per week or only on special occasions), and managing blood pressure (from >140/90 mmHg to <120/80 mmHg); or managing weight (from a BMI ≥30 kg/m2 to a range of 18.5–25 kg/m2) and controlling blood sugar levels (from HbA1c >6.4 to HbA1c <5.7). For the current study, the BCS has been calculated from the data made available by the UKB, and follows the exact same definitions used in prior research (10).
The hospital data that is linked with the UK Biobank cohort is derived from Hospital Episode Statistics for England (censoring date: September 30, 2021), the Scottish Morbidity Record (censoring date: July 31, 2021), and the Patient Episode Database for Wales (censoring date: February 28, 2018). The mortality data for England and Wales is provided by NHS Digital (censoring date: September 30, 2021) and the NHS Central Registries, National Records of Scotland (censoring date: October 31, 2021). In accordance with prior research (15, 16), late-life depression cases were derived from multiple ICD-10 codes appearing at or beyond the age of 60. These codes included: depressive episodes (F32), recurrent depressive disorder (F33), persistent mood (affective) disorders (F34), other mood (affective) disorders (F38), or unspecific mood (affective) disorders (F39). Individuals with earlier life depression, defined as a depression ICD-10 code appearing before the age of 60, as well as those whose earlier life depression extended into later life were excluded from the analyses. Additionally, and following the research mentioned previously (15, 16), individuals with any of the following codes were excluded from the analyses: delirium, not induced by alcohol and other psychoactive substances (F05), other mental disorders due to brain damage and dysfunction and physical disease (F06), personality and behavioural disorders due to brain disease, damage and dysfunction (F07), unspecified organic or symptomatic mental disorder (F09), mental and behavioural disorders due to psychoactive substance use (F10-F19), schizophrenia, schizotypal and delusional disorders (F20-29), manic episodes (F30), and bipolar affective disorder (F31). Any primary or secondary diagnosis or a contributory cause of death citing the included ICD codes was considered a late-life depression, except for events that occurred before the baseline measurement or in the first two years of follow-up (which was defined according to the data source listed above). The exclusion of such events was done to address any concerns of reverse causation (17).
This study considered all UK Biobank participants with fully available BCS data while excluding those with any missing information concerning one or more individual BCS components (the ‘meaning of life’ component was an exception, as it was missing for all UKB participants).
The distributions of measurements, self-reported responses, and data missing from UKB questionnaires were documented. Further, the distribution of the total BCS of the included UKB participants was presented, and the median along with the interquartile range (IQR) or mean and standard deviation (SD) were reported.
In order to estimate the associations of incident dementia, stroke, and late-life depression with five-point differences in the BCS, we utilized Cox proportional hazard regression models on non-stratified samples. These were adjusted for gender (female versus male) and age at baseline (as a continuous variable) and were separately employed on samples stratified by age group at baseline (<50, 50-59, >59 years), with adjustments made for sex. The time to event for cases was defined as the number of days from the baseline survey to the date of the first occurrence of dementia, stroke or late-life depression. For the other participants, the time to event was identified as the number of days to the censoring date, based on the source of hospital data (as listed above), or, for those who died due to other causes, the date of death. Cox regression models were conducted on one primary outcome: late-life depression, and one secondary outcome: the composite of dementia, stroke or late-life depression. In estimating the per 5-point BCS risk increase for the composite outcome, we used the date of the first outcome that occurred during the follow-up period. The median time to event and follow-up time, alongside the interquartile ranges, were reported for all outcomes. The Cox proportional hazard regression analyses produced estimated hazard ratios (HR) and corresponding 95% confidence intervals (CI). Schoenfeld residuals were plotted to verify whether the proportional hazards assumption was met. To evaluate the predictive accuracy of our models, we calculated and reported the concordance statistics (c-statistics), which gauge the area under the receiver operating characteristic curve. We simulated and visualized the HRs and 95% CI for late-life depression risk, for each age group, as a dose-response risk curve over the range of total BCS (0 to 20) employing a method by King, Tomz, and Wittenberg (18, 19). In this method, the mean BCS per group was considered the reference group, for which we executed 10,000 simulations per model.
Sensitivity analyses involved (A) replicating the principal analysis with late-life depression being determined by READv2 and READv3 codes extracted from general practitioner data within a subset of the primary cohort, and (B) evaluating a potential bias due to the competing risks of death from other causes.
Secondary analyses included (C) statistically testing the variations in the associations of the BCS with the four outcomes across age and sex strata, (D) estimating the absolute risk across BCS quintiles. The secondary analyses (C) and (D) are presented in the supplementary information.
To evaluate the consistency of our results, we replicated the Cox proportional hazards analysis within a subset of the UK Biobank (UKB) cohort. This subset was specifically chosen as it uniquely contains data sourced from general practitioners (GPs), allowing for a different method of depression case ascertainment. Primary care data for approximately 230,000 UK Biobank participants (up until 2016 or 2017, contingent upon the data supplier) was released in 2019. This dataset comprises information from the GP system suppliers and includes coded clinical events (such as consultations, diagnoses, procedures, and laboratory tests), prescribed medications (including prescription date, drug code, and, when available, drug name and quantity), and a variety of administrative codes (for example, referrals to specialist hospital clinics). This data is coded using the READ2 and READ3 systems. Following a previously reported approach (20), we determined late-life depression cases based on the appearance of a list of codes listed in Supplementary Information Table 14.
In sensitivity analyses, we employed Fine and Gray subdistribution hazard models to estimate the association of the BCS with incident dementia, stroke, and the composite outcome, factoring in the competing risk of death due to any other cause (which prevents the occurrence of the outcome of interest). A substantial discrepancy between estimates from the main and sensitivity analyses would indicate a possible bias in the former (21). The Fine and Gray model analyses yielded subdistribution, cause-specific HRs, and 95% CI, with these HRs representing estimates of the relative difference in the rate of the event of interest’s (incident dementia, stroke, late-life depression or either of the three) occurrence among subjects who have not yet experienced the event of interest but may have experienced a competing event (18).
All statistical analyses were performed using R 4.2.1 (22). The current manuscript is written in line with the STROBE (Strengthening the Reporting of Observational Studies in Epidemiology) guidelines.
The UKB study has enrolled 502,408 participants between 2006 and 2010, for whom baseline measurements are available. We excluded 86,016 participants (17%) due to missing data on one or more of the individual BCS components. A total of 416,370 participants (mean age: 57, of which 54% were females) were included in the analyses (Figure 2).
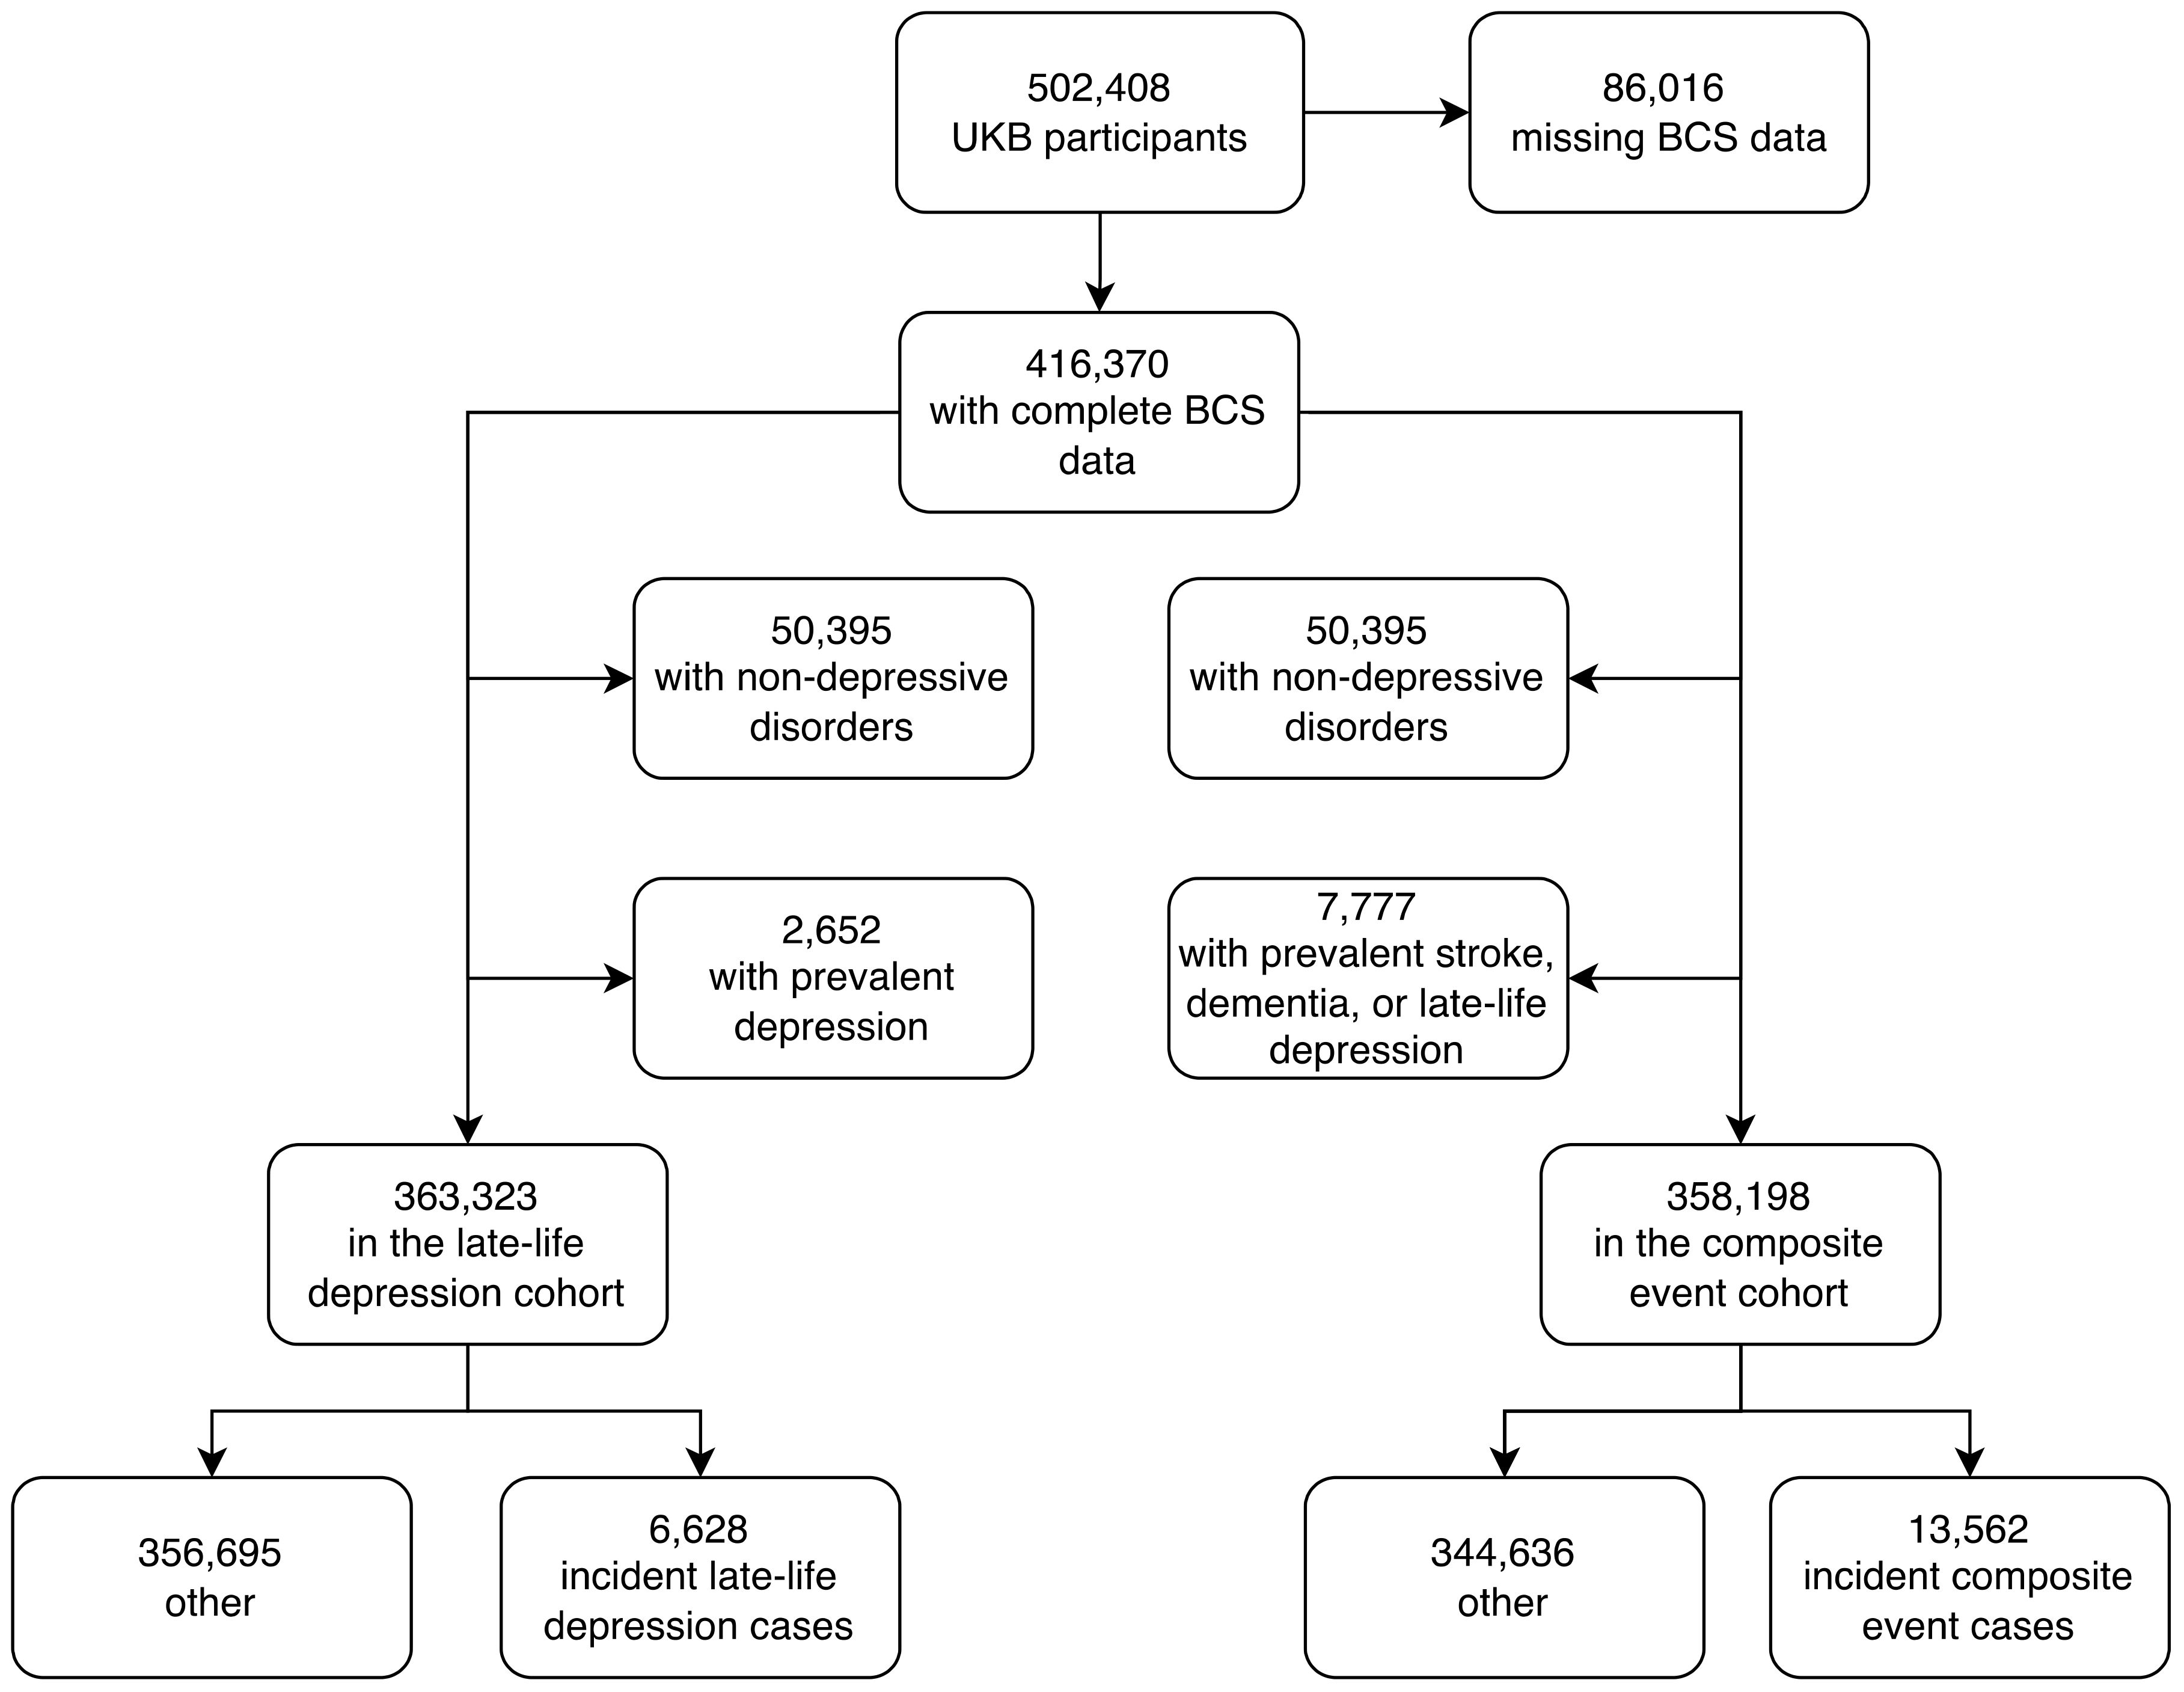
Figure 2. Flowchart for the late-life depression, and composite outcomes cohorts.
To study late-life depression, we also excluded 50,395 UKB participants who had a mood or psychiatric disorder other than unipolar depression as well as 2,652 participants with depression at baseline or with a history of depression, and the final cohort for this analysis included 365,975 participants. When comparing the UKB participants included in the late-life depression study (who had complete data on the BCS and without a non-depressive mood or psychiatric disorder) with UKB participants excluded from the late-life depression study (who either were lacking data on the BCS or experienced a non-depressive mood or psychiatric disorder), there were fewer men in the study sample (45%) than in the excluded sample (48%), and the participants were younger in the study sample (56.4 years) than in the excluded sample (56.9 years) (Supplementary Information Table S3).
The distributions of all UKB measurements making up the BCS are shown in Figure 3. Responses from the UKB questionnaires (mean and standard deviations, or frequencies for categorical variables), along with missingness percentage (%), stratified by three age categories (<50, 50-59, and >59 years), are provided in Table 2. The missingness for the BCS components at baseline ranged from 0.17% for physical activity to 7.2% for HbA1c.
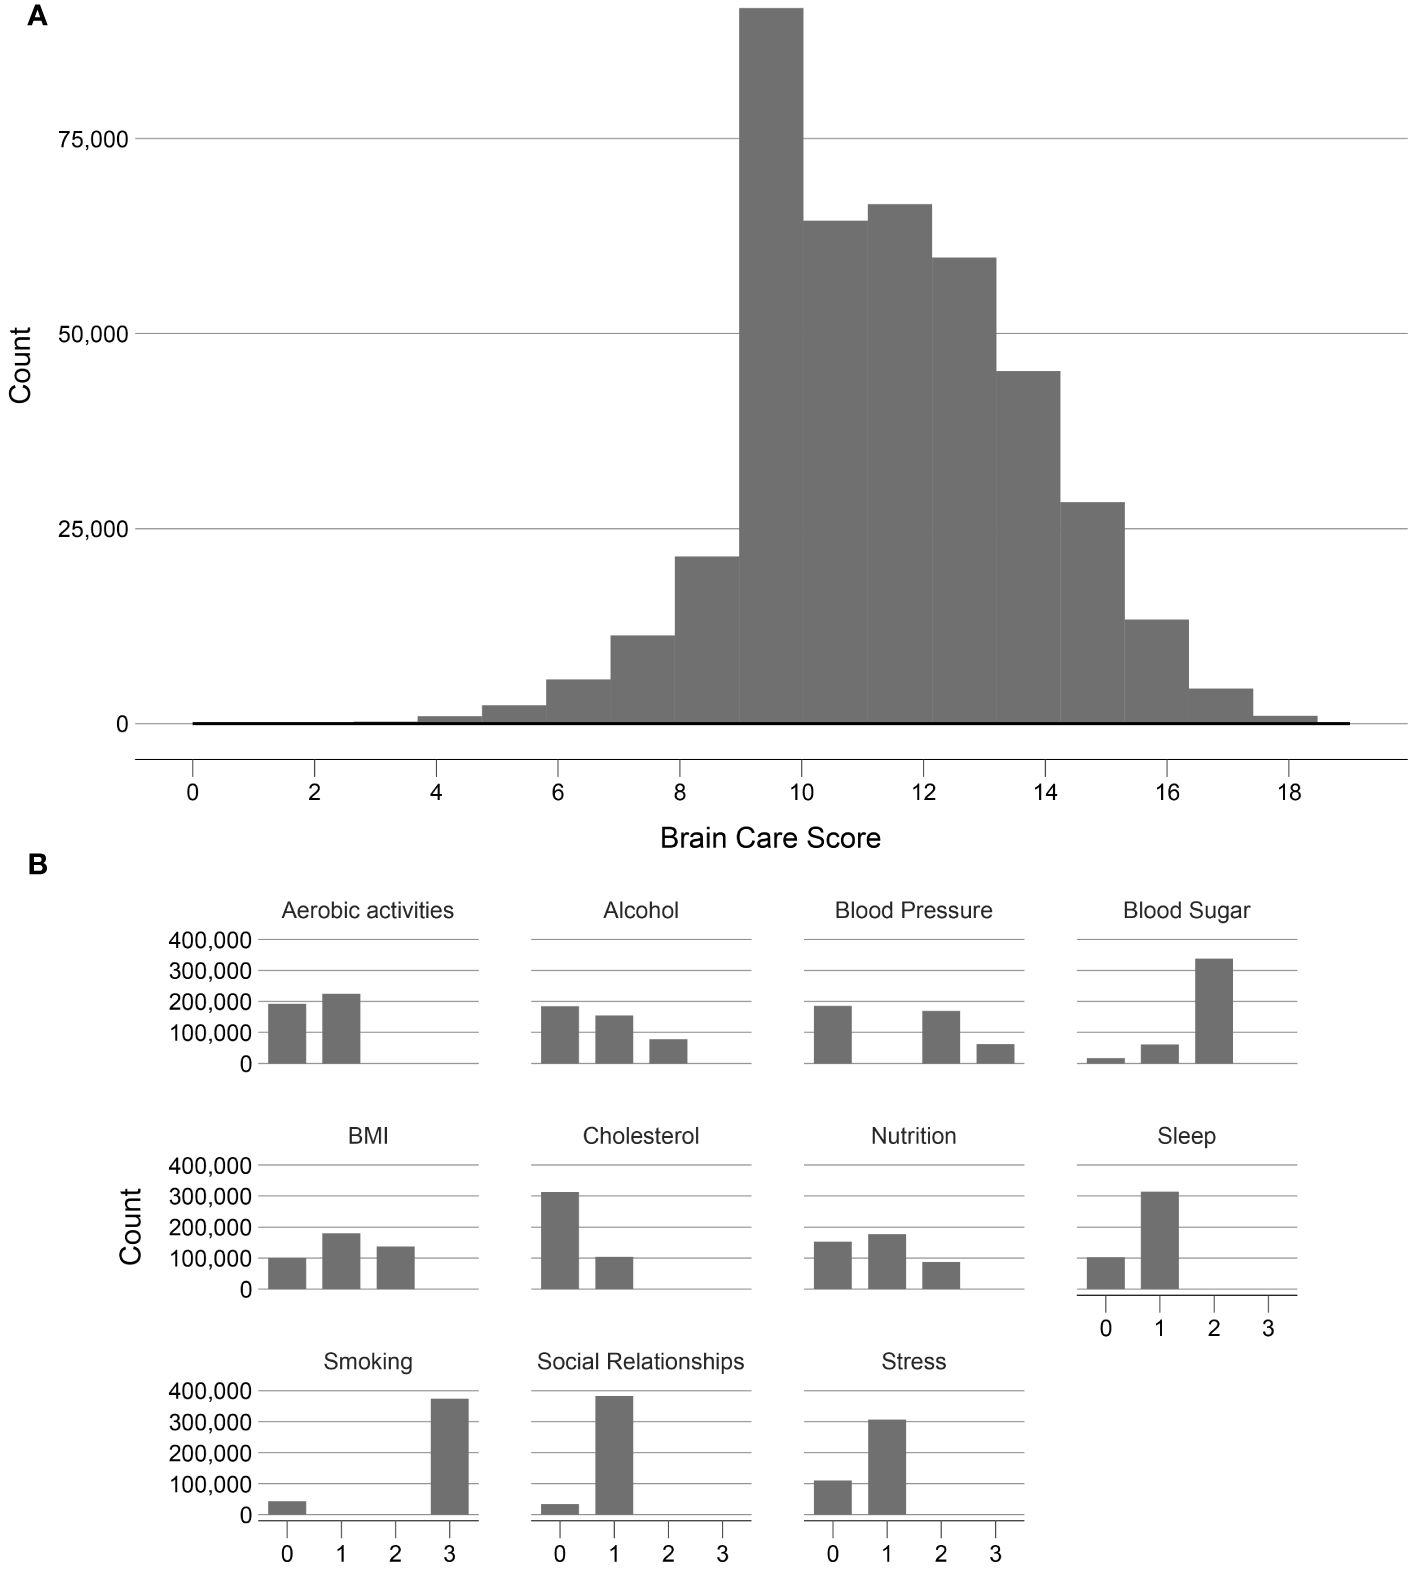
Figure 3. Frequency distribution of the Brain Care Score and its components in the UK Biobank. (A) shows the frequency of the total Brain Care Score over the range 1 to 19 observed in participants of the UKB study; (B) shows the frequencies of scores from the individual components of the total Brain Care Score.
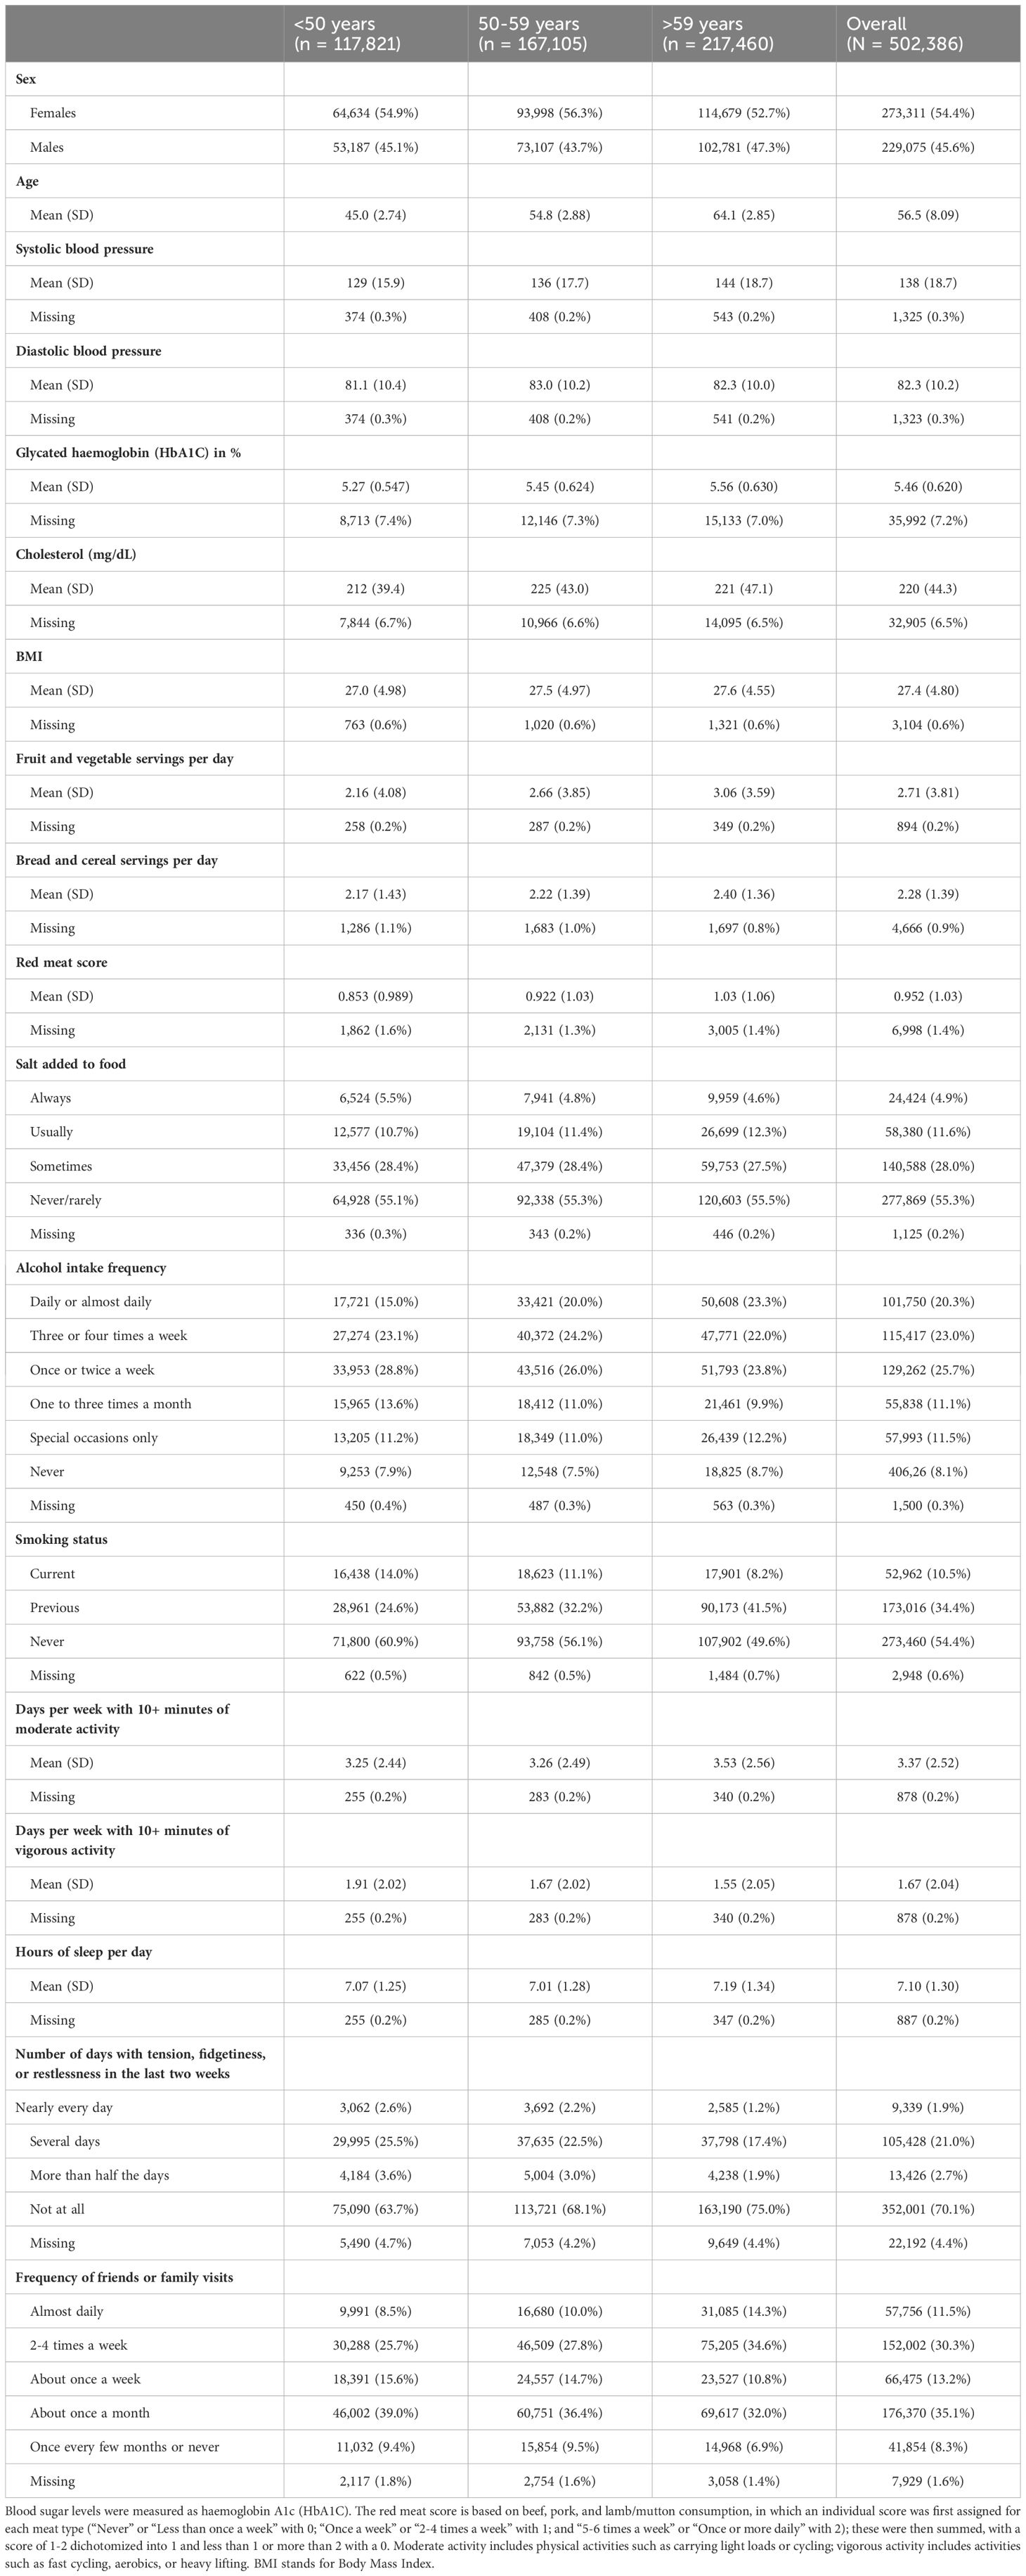
Table 2. Cohort characteristics at baseline entry into the UKB.
Of the included 365,975 UK participants, the median total BCS was 12 (total observed range: 2-19); with a median of 13 for participants aged <50 years, 12 for participants aged 50-59 years, and 12 for participants aged >59 years. There was a left-skewed distribution visible of the BCS (Figure 3).
In total, after excluding 50,395 UKB participants who had a mood or psychiatric disorder other than depression and 2,652 prevalent cases of depression that occurred before baseline or in the first two years of follow-up, 6,628 incident cases of late-life depression were recorded (n = 363,323); the cumulative incidence of late-life depression was 1.8% (95% CI: 1.8-1.9), in line with previous findings (23, 24). The median time to event was 8.2 years and the median follow-up time was 12.5 years (Supplementary Information Tables S4, 5). Older age was significantly associated with the incidence of late-life depression (p<0.001 when modelling age linearly). In stratified analyses, among participants aged <50 at baseline (n = 86,323), the cumulative incidence was 0.1% (95% CI: 0.1-0.1), with 81 late-life depression cases in total. The low incidence rate in this demographic is due to the ascertainment criteria for late-life depression that excludes cases in participants under the age of 60. Among those aged 50-59 years (n = 122,995), 2,313 cases of incident late-life depression were recorded, corresponding to a cumulative incidence of 1.9% (95% CI: 1.8-2.0). Among participants aged >59 (n = 154,005), the cumulative incidence was 2.7% (95% CI: 2.7-2.8), with 4,234 late-life depression cases.
Each five-point increase in the baseline BCS was significantly associated with a 33% lower risk of incident late-life depression when adjusted for age and sex (HR: 0.67 [95% CI: 0.64-0.71], p-value: <0.01, c-statistic: 0.69; Figure 4; Supplementary Information Table S6). Age was a significant effect modifier of the association between the BCS and late-life depression (interaction p<0.001), with the BCS being associated with larger reductions in the risk of incident late-life depression among younger persons. Among participants aged <50 years at baseline, each five-point higher BCS was associated with a 59% lower risk of incident late-life depression (HR: 0.41, 95% CI: 0.26-0.63, p-value: <0.01, c-statistic: 0.63), adjusted for sex. Among those aged 50 to 59 years at baseline, each five-point increase in the BCS was associated with a 35% lower risk of late-life depression (HR: 0.65, 95% CI: 0.60-0.71, p-value: <0.01, c-statistic: 0.58), adjusted for sex. For participants aged >59 years at baseline, each five-point higher BCS was associated with a 28% lower risk of late-life depression (HR: 0.72, 95% CI: 0.67-0.77, p-value: <0.01, c-statistic: 0.58), adjusted for sex.
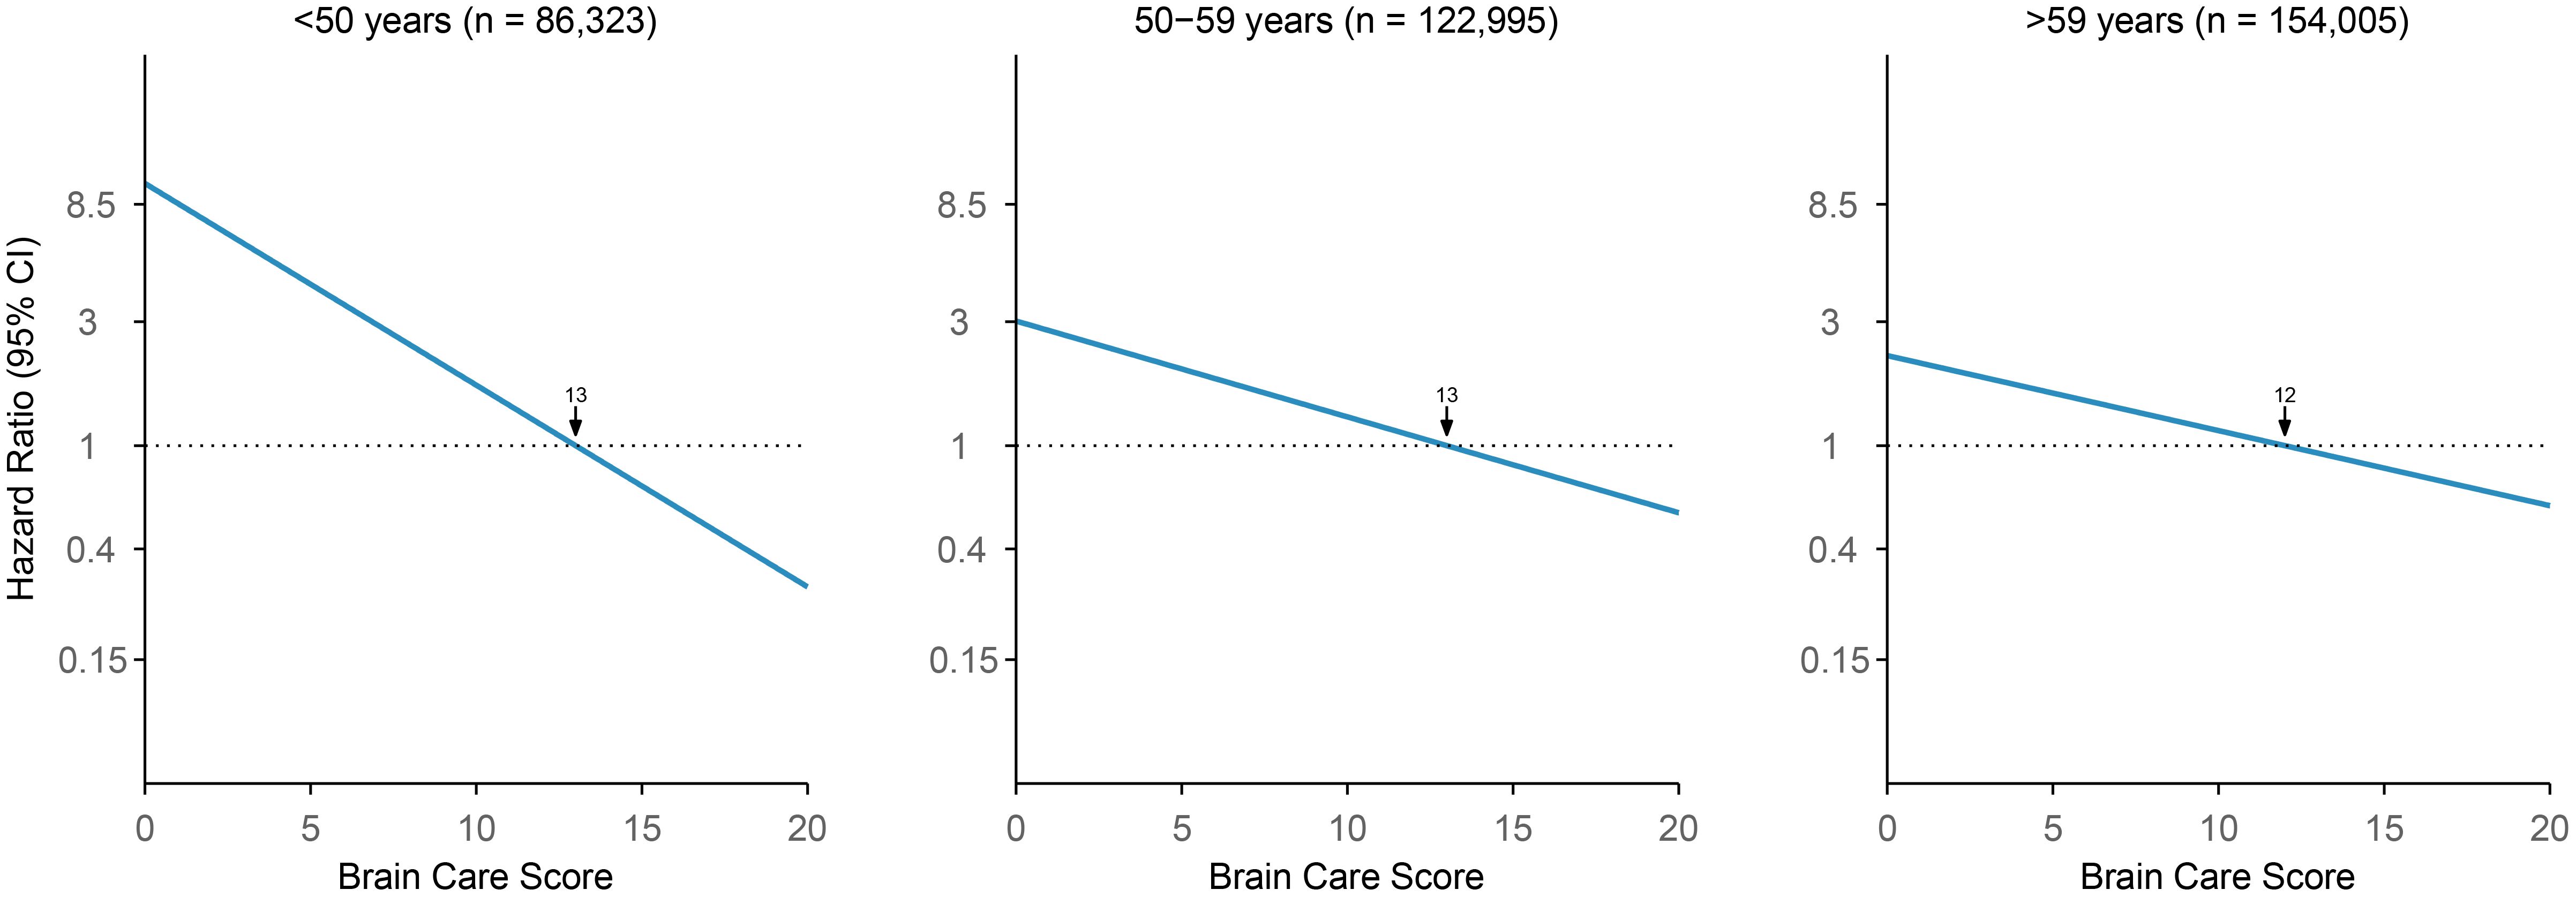
Figure 4. Association of Brain Care Score at baseline with incidence of late-life depression, stratified by age group at baseline. The thick line is the mean relative hazard curve for stroke incidence over the range of the Brain Care Score on a logarithmic scale; the shaded areas correspond to the 95% confidence intervals. The risk curves were adjusted for sex and plotted relative to the median Brain Care Score (indicated by the arrow) in the respective age group.
Given the important role of dementia and stroke as other clinical endpoints related to brain health, we also tested for association between the BCS and the composite risk of late-life depression, dementia and stroke. Of note, the associations between the BCS and the risk of incident dementia and incident stroke have been previously reported (10). In total, after excluding 50,395 UKB participants who had a mood or psychiatric disorder other than depression and 7,777 prevalent cases of dementia or stroke or depression that occurred before baseline or in the first two years of follow-up, 13,562 incident cases of incident dementia or stroke or late-life depression were recorded (n = 358,198); the cumulative incidence of dementia or stroke or late-life depression was 3.8% (95% CI: 3.7-3.8). The median time to event was 8.7 years and the median follow-up time was 12.5 years (Supplementary Information Tables S4, 5). Of the 13,562 cases, 798 occurred in participants who experienced at least two outcomes among stroke, dementia, or late-life depression. For these individuals, the date of the first diagnosis (dementia or stroke or late-life depression) was considered the time of event. Older age was significantly associated with the incidence of the combined outcome (p<0.001 when modelling age linearly). In stratified analyses, among participants aged <50 at baseline (n = 85,893), the cumulative incidence was 0.6% (95% CI: 0.6-0.7), with 518 stroke or dementia or late-life depression cases. Among those aged 50-59 years (n = 121,690), 3,589 cases of incident stroke or dementia or late-life depression were recorded corresponding to a cumulative incidence of 2.9% (95% CI: 2.9-3.0). Among participants aged >59 (n = 150,615), the cumulative incidence was 6.3% (95% CI: 6.2-6.4), with 9,455 incident stroke or incident dementia or incident late-life depression cases.
Each five-point increase in the baseline BCS was associated with a 27% lower risk of incident stroke or incident dementia or late-life depression when adjusted for age and sex, and this difference was statistically significant (HR: 0.73 [95% CI: 0.70-0.76, p-value: <0.01, c-statistic: 0.71; Supplementary Information Table S7). Age was a significant effect modifier of the association between the BCS and the composite of late-life depression, dementia and stroke (interaction p<0.001), with the BCS being associated with larger reductions in the risk of incident stroke, dementia, or late-life depression among younger persons. Among participants aged <50 years at baseline, each five-point higher BCS was associated with a 38% lower risk of an event (HR: 0.62, 95% CI: 0.52-0.74, p-value: < 0.01, c-statistic: 0.59), adjusted for sex. Among those aged 50 to 59 years at baseline, each five-point increase in the BCS was associated with a 36% lower risk of an event (HR: 0.64, 95% CI: 0.60-0.69, p-value: <0.01, c-statistic: 0.56), adjusted for sex. Finally, for participants aged >59 years at baseline, each five-point higher BCS was associated with a 22% lower risk of an event (HR: 0.78, 95% CI: 0.75-0.82, p-value: <0.01, c-statistic: 0.53), adjusted for sex. Additionally, we demonstrated the cumulative incidence of dementia, stroke, or late-life depression stratified by BCS quintile groups (first quintile vs. second to fourth quintiles vs. fifth quintile) in Figure 5.
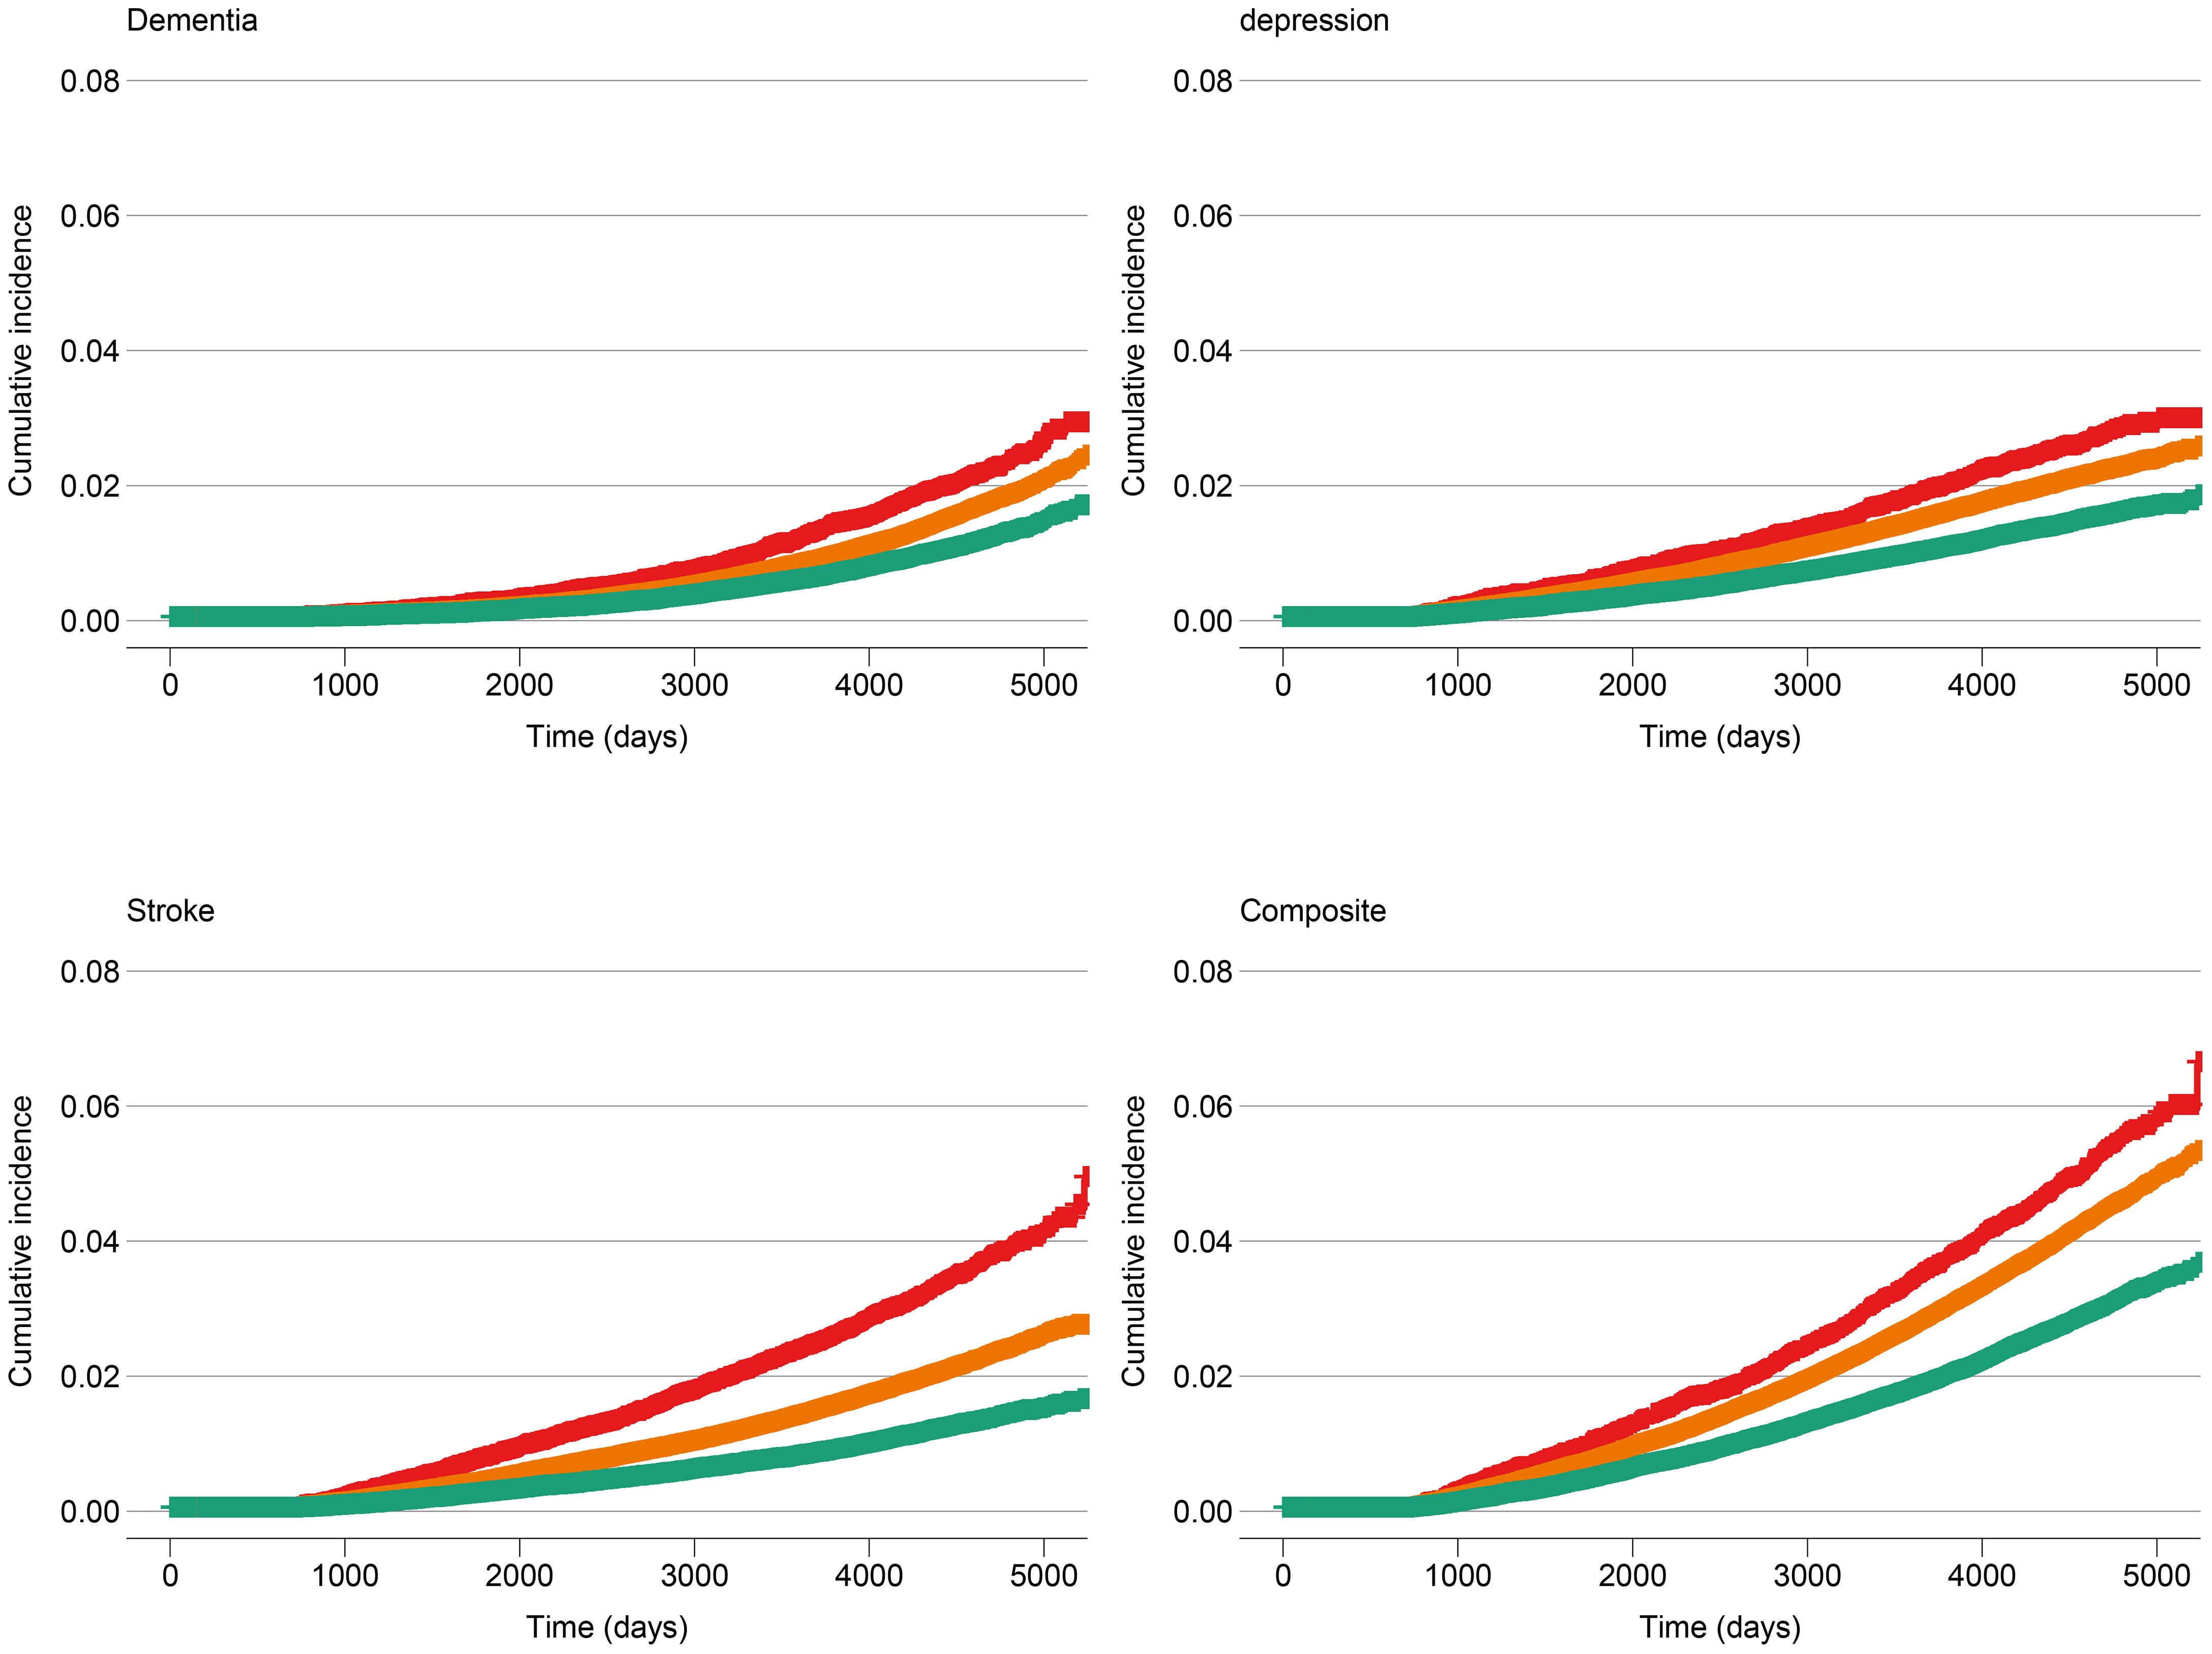
Figure 5. Cumulative incidence of dementia, stroke, late-life depression and dementia or stroke or late-life depression at baseline, stratified by Brain Care Score quintile group. The red line corresponds to the cumulative incidence of the low-scoring BCS group (1st quintile: total BCS scores from 1 to 9), the orange line corresponds to the middle three BCS quintiles (total BCS scores from 10 to 13), and the green line corresponds to the high-scoring BCS group (5th quantile: total BCS scores from 14 to 19).
Our primary analysis was replicated within a subgroup comprising 230,055 participants from the UK Biobank (UKB) for whom general-practitioner (GP) data were accessible. Of this subgroup, 192,468 participants had available BCS data, and 2,037 met the criteria for late-life depression based on READ3 codes (Supplementary Information Figure S1). Due to the timeframe of the general practitioner data collection, none of the participants who were 49 years or younger at enrolment in the UKB were given a depression code after turning 60, a prerequisite for defining late-life depression. The cumulative incidence of late-life depression within this subset was 1.1% (95% CI: 1.0-1.1%). The median time to event stood at 4.6 years, and the median follow-up duration was 12.4 years. Among those aged 50-59 years (n = 64,615), there were 597 incident cases of late-life depression, corresponding to a cumulative incidence of 0.9% (95% CI: 0.9-1.0). In participants aged over 59 years (n = 80,974), the cumulative incidence was 1.8% (95% CI: 1.7-1.8), with 1,440 recorded cases of late-life depression.
Each five-point increase in the baseline BCS was associated with a 40% lower risk of incident late-life depression when adjusted for age and sex, and this difference was statistically significant (HR: 0.60 [95% CI: 0.50-0.69], p-value: <0.01, c-statistic: 0.72; Supplementary Information Figure S2, Supplementary Information Table S11). Among those aged 50 to 59 years at baseline, each five-point increase in the BCS was associated with a 41% lower risk of late-life depression (HR: 0.59, 95% CI: 0.43-0.76, p-value: <0.01, c-statistic: 0.57), adjusted for sex. For participants aged >59 years at baseline, each five-point higher BCS was associated with a 38% lower risk of late-life depression (HR: 0.62, 95% CI: 0.50-0.73, p-value: <0.01, c-statistic: 0.56), adjusted for sex.
In sensitivity analyses, Fine and Gray subdistribution hazard models (21) were used to assess the effect of competing risk of death due to other causes. The subdistribution (cause-specific) HR estimates did not differ substantially from estimates from the main Cox regression analyses (Supplementary Information Tables S12, S13). Schoenfeld residuals were plotted in Supplementary Information Figures S3, S4: no pattern with time is visible for HR estimates, although some of the associated p-values indicated statistical significance, which was unsurprising given the sample sizes.
Herewith, we present clinically relevant and statistically significant associations between the BCS, a novel tool to promote brain care, and late-life depression using hospital-based data and GP data from the UKB cohort. In addition, the BCS strongly associates with a composite trait of major brain health outcomes: stroke, dementia and late-life depression. The associations between BCS and late-life depression, as well as the brain health composite trait, were consistent across all included age groups. Furthermore, these associations were verified with a different ascertainment of late-life depression using data from general practitioners within a subset of the UKB cohort.
The strengths and weaknesses of the BCS as a novel tool to be implemented into routine primary care have been described before (10). For the currently presented analyses, multiple strengths include our well-powered sample, outcome ascertainment for late-life depression in both hospital-based and GP datasets, and the close approximation of BCS factors found in the UKB. However, several limitations of the current analyses should be addressed as well. First, there is an ongoing debate on the causality and directionality between some of the individual components of the BCS with late-life depression (e.g., the social-emotional components). One of the drawbacks is that the mechanisms as to which social-emotional stressors lead to vascular disease or neurodegeneration remain largely unknown, although hypotheses on the roles of amygdalar activity (25–27) and/or neurobiological resistance (28) have been published. There may be risk factors for late-life depression that are not risk factors for dementia and stroke (and therefore not included in the BCS) such as abuse or trauma during childhood (29). However, no consensus has been achieved on the role of all psychiatric orders being risk factors for dementia. For example, recent compelling data has been published on the relationship between post-traumatic stress syndrome (PTSD), psychotic disorders and bipolar disorder (BPD) with onset of dementia (30–32). Furthermore, we acknowledge the existence of several diagnostic instruments specifically designed for the detection of depression in geriatric populations. These include the Beck’s depression inventory-II (BDI-II) (33), the Center for Epidemiologic Studies Depression Scale (CES-D) (34), the Hamilton depression scale (HAM-D) (35) and the geriatric depression scale (GDS) (36). The BCS, however, was primarily developed to incorporate brain care in routine primary practice, rather than serving as a diagnostic tool. In addition, to our knowledge, there is currently no clinical tool to predict late-life depression, and the concordance statistics we obtained suggest that the BCS has strong predictive abilities. Consequently, we refrain from drawing direct comparisons between the BCS and the aforementioned depression scales – as the aims and implementation of these scores differ significantly.
Regarding outcome ascertainment within the hospital-based and GP-based UK Biobank (UKB) cohort, the application of a well-validated ICD-code-based ascertainment of late-life depression (15, 16) yielded highly consistent results with an ascertainment derived from a GP-based dataset. It is worth noting that GPs frequently act as the first point of contact for diagnosing depression (37, 38), with a substantial proportion of patients primarily seeking their GPs’ assistance in managing depressive symptoms, rather than consulting psychiatric specialists. This replication strategy strengthens our findings by ensuring they apply not only to those diagnosed in a hospital setting but also to a broader population of individuals who primarily interact with the general healthcare system.
Importantly, emerging evidence suggests that depression is a risk factor for cognitive decline and dementia (39–42). A recent review proposed the following biological explanation for this: depression activates pro-inflammatory mediators, leading to cerebral small vessel disease (SVD) with reduced cerebral blood flow: the latter being a well-studied precedent of cognitive decline and dementia (41). The incidence of depression is rising, with adolescents reported to be at the highest risk of developing a depression, and with the onset of depression occurring at increasingly earlier ages (41, 43–45). The US department of Health and Human Services reported in 2020 that the age groups suffering most from depression symptoms were people aged 18–29 (21%), followed by 45–64 years and >65 years (18%), and 30–44 years (17%). Women are more likely to be diagnosed with depression compared to men across all age categories (46). Although no global consensus has been established on this, early-life depression has oftentimes been proposed as a risk factor for dementia (47–49), and late-life depression as a prodrome of dementia (40, 47, 48). Prevention and adequate treatment of early-life (and potentially late-life) depression may not only be effective in reducing people’s suffering directly, but could also indirectly lower the incidence of cognitive decline and dementia (40). Additional research is needed to establish the causality between depression prevention/treatment and lower dementia incidence.
Hence, implementation of the BCS into routine primary care, and thus stimulating people from all ages to take better care of their brains (subsequently leading to health behaviours that reduce the risk of dementia, stroke and depression) could be an effective way to holistically improve quality of life for middle-aged individuals. There may be a wide range of positive consequences of implementing the use of the BCS in primary prevention worldwide. Importantly, it could educate both patients and practitioners on the preventability and modifiable risk factors for dementia, stroke, and depression. Ultimately, this could lead to a “snowballing effect” of the BCS as a simple presentation of the modifiable risk factors for these brain diseases to the general population. In the future, we aim to validate the BCS in different settings (languages, cultures, geographical locations etc). The definitions (e.g., dietary component) of some of the individual components may need to be adjusted based on a specific different setting, as well as the weighing (e.g., different effects of BMI for different ethnicities).
To conclude, we present the first-ever analyses between the BCS and incident late-life depression and a brain health composite trait in 358,198 individuals from the UKB – in line with previously published data on the BCS with dementia and stroke incidence in UKB. Continuous revision and optimisation of the BCS needs to be routinely performed via a cycle, based on ongoing research on individual BCS components and its associations with dementia, stroke, and late-life depression (leading to different weighing of individual components, as well as adding or removing components as the scientific evidence grows), as well as expert consensus (e.g., via the Delphi process). Importantly, research on the motivational aspects of the BCS for different age groups and populations is warranted if we are to be successful in achieving sustainable behaviour changes towards risk factor reduction of brain diseases. The primary and secondary prevention of dementia, stroke and depression through risk factor modification and behaviour change is fundamental to improve populations’ brain health, reduce health inequalities, and contain healthcare costs worldwide (13). The BCS is a prototype tool to achieve these goals via implementation into routine primary care.
Publicly available datasets were analysed in this study. This data can be found here: https://www.ukbiobank.ac.uk. This analysis was approved by the UK Biobank access committee as part of project 58743.
The studies involving humans were approved by Northwest Multi-Centre Research Ethics Committee (reference number 06/MRE08/65). The studies were conducted in accordance with the local legislation and institutional requirements. The participants provided their written informed consent to participate in this study.
SS: Conceptualization, Data curation, Formal analysis, Investigation, Methodology, Project administration, Resources, Validation, Visualization, Writing – original draft, Writing – review & editing. CR: Conceptualization, Data curation, Formal analysis, Investigation, Methodology, Project administration, Resources, Validation, Visualization, Writing – original draft, Writing – review & editing. KP: Conceptualization, Writing – review & editing. ZC: Methodology, Writing – review & editing. LG-M: Conceptualization, Methodology, Writing – review & editing. LP: Writing – review & editing. EM: Data curation, Formal analysis, Writing – review & editing. JS: Data curation, Formal analysis, Writing – review & editing. SC: Formal analysis, Writing – review & editing. CN: Writing – review & editing. AN: Writing – review & editing. AO: Writing – review & editing. MW: Conceptualization, Writing – review & editing. RT: Conceptualization, Funding acquisition, Writing – review & editing. RL: Writing – review & editing. AP: Writing – review & editing. SI: Writing – review & editing. HBB: Writing – review & editing. VJH: Writing – review & editing. GH: Writing – review & editing. NY: Writing – review & editing. TL: Writing – review & editing. KS: Conceptualization, Data curation, Formal analysis, Funding acquisition, Investigation, Methodology, Project administration, Resources, Software, Supervision, Validation, Visualization, Writing – original draft, Writing – review & editing. JR: Conceptualization, Data curation, Formal analysis, Funding acquisition, Investigation, Methodology, Project administration, Resources, Software, Supervision, Validation, Visualization, Writing – review & editing. GF: Conceptualization, Data curation, Formal analysis, Funding acquisition, Investigation, Methodology, Project administration, Resources, Software, Supervision, Validation, Visualization, Writing – review & editing. CA: Conceptualization, Data curation, Formal analysis, Funding acquisition, Investigation, Methodology, Project administration, Resources, Software, Supervision, Validation, Visualization, Writing – original draft, Writing – review & editing. GJF: Visualization, Conceptualization, Data curation, Formal analysis, Funding acquisition, Investigation, Methodology, Project administration, Supervision, Writing – original draft, Writing – review & editing, Resources, Software, Validation.
The author(s) declare financial support was received for the research, authorship, and/or publication of this article. CA receives sponsored research support from the US National Institutes of Health, the American Heart Association, and Bayer AG, and has consulted for ApoPharma. KP is supported by the Wellcome Trust, Our Planet Our Health (Livestock, Environment and People—LEAP) (grant number 205212/Z/16/Z) and Cancer Research UK (grant C570/A16491 and A29186). JR receives sponsored research support from the US National Institutes of Health and the American Heart Association, as well as consulting fees from the National Football League and Takeda Pharmaceuticals. GJF is supported by the National Institutes of Health (P30AG021342), the American Heart Association (18IDDG34280056 and 817874) and the Neurocritical Care Society Research Fellowship. CAR is supported by the American Heart Association (817874) and the AAN/AHA Ralph L. Sacco Scholars Fellowship (https://doi.org/10.58275/AHA.24RSSPOST1328228.pc.gr.197089). KP is funded by Cancer Research UK (C570/A16491 and A29186). AP receives research support from the Canadian Institute of Health Research ( CIHR Operating Grant: BHCIA #503560), the Innovation Fund - Ministry of Health Ontario (IFPOC-AMO #102024) and sponsored support from the JS Sonshine Chair in Stroke Prevention and Cerebrovascular Brain Health at the University of Toronto/UHN/KBI.
CA receives sponsored research support from the US National Institutes of Health, the American Heart Association, and Bayer AG, and has consulted for ApoPharma. GF receives sponsored research support from the National Institute of Mental Health Clinical Global Mental Health Research T32 Fellowship, receives royalties or licenses from Johns Hopkins University Press, University of Chicago Press, Belvoir Press, and the American Psychiatric Press, is on a Data Safety Monitoring Board or Advisory Board of Healthy Hearts Healthy Minds DSMB, is a Board of Directors member at the Rosalynn Carter Institute, and has stock or stock options from Revival Therapeutics Consultant. LG-M receives sponsored research support from the American Heart grant number 963719. JR receives sponsored research support from the US National Institutes of Health and the American Heart Association, and receives payments for expert testimony and consulting fees from the National Football League. EM is an employee of Regeneron Genetics Center. MW has private equity as co-founder of Beacon Biosignals and receives compensation for consulting and scientific advisory roles.
The remaining authors declare that the research was conducted in the absence of any commercial or financial relationships that could be construed as a potential conflict of interest.
The author(s) declared that they were an editorial board member of Frontiers, at the time of submission. This had no impact on the peer review process and the final decision.
All claims expressed in this article are solely those of the authors and do not necessarily represent those of their affiliated organizations, or those of the publisher, the editors and the reviewers. Any product that may be evaluated in this article, or claim that may be made by its manufacturer, is not guaranteed or endorsed by the publisher.
The Supplementary Material for this article can be found online at: https://www.frontiersin.org/articles/10.3389/fpsyt.2024.1373797/full#supplementary-material
1. Vos T, Lim SS, Abbafati C, Abbas KM, Abbasi M, Abbasifard M, et al. Global burden of 369 diseases and injuries in 204 countries and territories, 1990–2019: a systematic analysis for the Global Burden of Disease Study 2019. Lancet. (2020) 396:1204–22. doi: 10.1016/S0140-6736(20)30925-9
2. Herrman H, Patel V, Kieling C, Berk M, Buchweitz C, Cuijpers P, et al. Time for united action on depression: a Lancet-World Psychiatric Association Commission. Lancet. (2022) 399:957–1022. doi: 10.1016/S0140-6736(21)02141-3
3. Rodda J, Walker Z, Carter J. Depression in older adults. BMJ. (2011) 343:d5219. doi: 10.1136/bmj.d5219
4. Saczynski JS, Beiser A, Seshadri S, Auerbach S, Wolf PA, Au R. Depressive symptoms and risk of dementia: the Framingham Heart Study. Neurology. (2010) 75:35–41. doi: 10.1212/WNL.0b013e3181e62138
5. Feigin VL, Stark BA, Johnson CO, Roth GA, Bisignano C, Abady GG, et al. Global, regional, and national burden of stroke and its risk factors, 1990–2019: a systematic analysis for the Global Burden of Disease Study 2019. Lancet Neurology. (2021) 20:795–820. doi: 10.1016/S1474-4422(21)00252-0
6. Lund C, Brooke-Sumner C, Baingana F, Baron EC, Breuer E, Chandra P, et al. Social determinants of mental disorders and the Sustainable Development Goals: a systematic review of reviews. Lancet Psychiatry. (2018) 5:357–69. doi: 10.1016/S2215-0366(18)30060-9
7. Luger TM, Suls J, Vander Weg MW. How robust is the association between smoking and depression in adults? A meta-analysis using linear mixed-effects models. Addict Behav. (2014) 39:1418–29. doi: 10.1016/j.addbeh.2014.05.011
8. Li Y, Lv MR, Wei YJ, Zhang JX, Zhang HG. Dietary patterns and depression risk: A meta-analysis. Psychiatry Res. (2017) 253:373–82. doi: 10.1016/j.psychres.2017.04.020
9. Schuch FB, Vancampfort D, Firth J, Rosenbaum S, Ward PB, Silva ES, et al. Physical activity and incident depression: A meta-analysis of prospective cohort studies. Am J Psychiatry. (2018) 175:631–48. doi: 10.1176/appi.ajp.2018.17111194
10. Singh S, Oreskovic T, Carr S, Papier K, Conroy M, Senff JR, et al. The Predictive Validity of a Brain Care Score for Dementia and Stroke: data from the UK Biobank cohort. Front Neurol. (2023) 14:1291020. doi: 10.3389/fneur.2023.1291020
11. Singh SD, Gutierrez-Martinez L, Newhouse A, Sonni A, Chemali Z, Rosand J. Brain health begins with brain care. Lancet Neurology. (2022) 21:961–2. doi: 10.1016/S1474-4422(22)00397-0
12. Collins R. UK Biobank: Protocol for a large-scale prospective epidemiological resource, United Kingdom: UK Biobank. (2017) Available at: https://policycommons.net/artifacts/1774896/uk-biobank/2506542/ on 08 Jul 2024. CID: 20.500.12592/b91h3n.
13. Lazar RM, Howard VJ, Kernan WN, Aparicio HJ, Levine DA, Viera AJ, et al. A primary care agenda for brain health: A scientific statement from the american heart association. Stroke. (2021) 52:e295–308. doi: 10.1161/STR.0000000000000367
14. McIntosh MJ, Morse JM. Situating and constructing diversity in semi-structured interviews. Glob Qual Nurs Res. (2015) 2:2333393615597674. doi: 10.1177/2333393615597674
15. Cai N, Revez JA, Adam MJ, Andlauer TFM, Breen G, Byrne EM, et al. Minimal phenotyping yields genome-wide association signals of low specificity for major depression. Nat Genet. (2020) 52:437–47. doi: 10.1038/s41588-020-0594-5
16. Howard DM, Adams MJ, Shirali M, Clarke TM, Marioni RE, Davies G, et al. Genome-wide association study of depression phenotypes in UK Biobank identifies variants in excitatory synaptic pathways. Nat Commun. (2018) 9:1470. doi: 10.1038/s41467-018-03819-3
17. Sattar N, Preiss D. Reverse causality in cardiovascular epidemiological research: more common than imagined? Circulation. (2017) 135:2369–72. doi: 10.1161/CIRCULATIONAHA.117.028307
18. Austin PC, Fine JP. Practical recommendations for reporting Fine-Gray model analyses for competing risk data. Stat Med. (2017) 36:4391–400. doi: 10.1002/sim.7501
19. King G, Tomz M, Wittenberg J. Making the most of statistical analyses: improving interpretation and presentation. Am J Political Science. (2000) 44:347–61. doi: 10.2307/2669316
20. Denaxas S, Liu G, Feng Q, Fatemifar G, Basterache L, Kerchberger E. Mapping the Read2/CTV3 controlled clinical terminologies to Phecodes in UK Biobank primary care electronic health records: implementation and evaluation. AMIA Annu Symp Proc. (2022) 2021:362–71. Available at: https://www.ncbi.nlm.nih.gov/pmc/articles/pmid/35308936/.
21. Fine JP, Gray RJ. A proportional hazards model for the subdistribution of a competing risk. J Am Stat Assoc. (1999) 94:496–509. doi: 10.1080/01621459.1999.10474144
22. Team RDC. R: A language and environment for statistical computing. In: . R Foundation for Statistical Computing (2012). Available at: http://www.R-project.org/.
23. Beekman AT, Copeland JR, Prince MJ. Review of community prevalence of depression in later life. Br J Psychiatry. (1999) 174:307–11. doi: 10.1192/bjp.174.4.307
24. Blazer DG. Depression in late life: review and commentary. Journals Gerontology: Ser A. (2003) 58:M249–65. doi: 10.1093/gerona/58.3.M249
25. Tawakol A, Ishai A, Takx RA, Figueroa AL, Ali A, Kaiser Y, et al. Relation between resting amygdalar activity and cardiovascular events: a longitudinal and cohort study. Lancet. (2017) 389:834–45. doi: 10.1016/S0140-6736(16)31714-7
26. Tawakol A, Osborne MT, Wang Y, Hammed B, Tung B, Patrick T, et al. Stress-associated neurobiological pathway linking socioeconomic disparities to cardiovascular disease. J Am Coll Cardiol. (2019) 73:3243–55. doi: 10.1016/j.jacc.2019.04.042
27. Dar T, Radfar A, Abohashem S, Pitman RK, Tawakol A, Osborne MT. Psychosocial stress and cardiovascular disease. Curr Treat Options Cardiovasc Med. (2019) 21:23. doi: 10.1007/s11936-019-0724-5
28. Dar T, Osborne MT, Abohashem S, Abbasi T, Choi KW, Ghoneem A, et al. Greater neurobiological resilience to chronic socioeconomic or environmental stressors associates with lower risk for cardiovascular disease events. Circ Cardiovasc Imaging. (2020) 13:e010337. doi: 10.1161/CIRCIMAGING.119.010337
29. Comijs HC, van Exel E, van der Mast RC, Paauw A, Oude Voshaar R, Stek ML. Childhood abuse in late-life depression. J Affect Disord. (2013) 147:241–6. doi: 10.1016/j.jad.2012.11.010
30. Stafford J, Chung WT, Sommerlad A, Kirkbride JB, Howard R. Psychiatric disorders and risk of subsequent dementia: systematic review and meta-analysis of longitudinal studies. Int J Geriatr Psychiatry. (2022) 37(5):10.1002/gps.5711. doi: 10.1002/gps.5711
31. Kuring JK, Mathias JL, Ward L. Risk of Dementia in persons who have previously experienced clinically-significant Depression, Anxiety, or PTSD: A Systematic Review and Meta-Analysis. J Affect Disord. (2020) 274:247–61. doi: 10.1016/j.jad.2020.05.020
32. Luo J, Beam CR, Gatz M. Is stress an overlooked risk factor for dementia? A systematic review from a lifespan developmental perspective. Prev Sci 24(5):936–49. doi: 10.1007/s11121-022-01385-1
33. Beck AT, Steer RA, Brown G. Beck depression inventory–II. (San Antonio, TX: Psychological Corporation) (1996). doi: 10.1037/t00742-000.
34. Radloff LS. The CES-D scale: A self-report depression scale for research in the general population. Appl psychol Measurement. (1977) 1:385–401. doi: 10.1177/014662167700100306
35. Hamilton M. A rating scale for depression. J Neurol Neurosurg Psychiatry. (1960) 23:56–62. doi: 10.1136/jnnp.23.1.56
36. Yesavage JA, Brink TL, Rose TL, Lum O, Huang V, Adey M, et al. Development and validation of a geriatric depression screening scale: a preliminary report. J Psychiatr Res. (1982) 17:37–49. doi: 10.1016/0022-3956(82)90033-4
37. Tardieu S, Bottero A, Blin P, Bohbot M, Goni S, Gerard WA, et al. Roles and practices of general practitioners and psychiatrists in management of depression in the community. BMC Family Practice. (2006) 7:5. doi: 10.1186/1471-2296-7-5
38. Raney LE. Integrating primary care and behavioral health: the role of the psychiatrist in the collaborative care model. AJP. (2015) 172:721–8. doi: 10.1176/appi.ajp.2015.15010017
39. Richmond-Rakerd LS, D’Souza S, Milne BJ, Caspi A, Moffitt TE. Longitudinal associations of mental disorders with dementia: 30-year analysis of 1.7 million New Zealand citizens. JAMA Psychiatry. (2022) 79:333–40. doi: 10.1001/jamapsychiatry.2021.4377
40. Holmquist S, Nordström A, Nordström P. The association of depression with subsequent dementia diagnosis: A Swedish nationwide cohort study from 1964 to 2016. PloS Med. (2020) 17:e1003016. doi: 10.1371/journal.pmed.1003016
41. Hakim A. Perspectives on the complex links between depression and dementia. Front Aging Neurosci. (2022) 14:821866. doi: 10.3389/fnagi.2022.821866
42. Almeida OP, Hankey GJ, Yeap BB, Golledge J, Flicker L. Depression as a modifiable factor to decrease the risk of dementia. Transl Psychiatry. (2017) 7:e1117. doi: 10.1038/tp.2017.90
43. Compton WM, Conway KP, Stinson FS, Grant BF. Changes in the prevalence of major depression and comorbid substance use disorders in the United States between 1991–1992 and 2001–2002. AJP. (2006) 163:2141–7. doi: 10.1176/ajp.2006.163.12.2141
44. Twenge JM, Gentile B, DeWall CN, Ma D, Lacefield K, Schurtz DR. Birth cohort increases in psychopathology among young Americans, 1938-2007: A cross-temporal meta-analysis of the MMPI. Clin Psychol Rev. (2010) 30:145–54. doi: 10.1016/j.cpr.2009.10.005
45. Hidaka BH. Depression as a disease of modernity: explanations for increasing prevalence. J Affect Disord. (2012) 140:205–14. doi: 10.1016/j.jad.2011.12.036
46. Villarroel MA, Terlizzi EP. Symptoms of depression among adults: United States, 2019. NCHS Data Brief. (Hyattsville, MD: National Center for Health Statistics) (2020) 379:1–8.
47. Bennett S, Thomas AJ. Depression and dementia: cause, consequence or coincidence? Maturitas. (2014) 79:184–90. doi: 10.1016/j.maturitas.2014.05.009
48. Kessing LV. Depression and the risk for dementia. Curr Opin Psychiatry. (2012) 25:457–61. doi: 10.1097/YCO.0b013e328356c368
Keywords: depression - epidemiology, prevention, risk factor, brain health, stroke, dementia
Citation: Singh SD, Rivier CA, Papier K, Chemali Z, Gutierrez-Martinez L, Parodi L, Mayerhofer E, Senff J, Clocchiatti-Tuozzo S, Nunley C, Newhouse A, Ouyang A, Westover MB, Tanzi RE, Lazar RM, Pikula A, Ibrahim S, Brouwers HB, Howard VJ, Howard G, Yechoor N, Littlejohns T, Sheth KN, Rosand J, Fricchione G, Anderson CD and Falcone GJ (2024) The predictive validity of a Brain Care Score for late-life depression and a composite outcome of dementia, stroke, and late-life depression: data from the UK Biobank cohort. Front. Psychiatry 15:1373797. doi: 10.3389/fpsyt.2024.1373797
Received: 20 January 2024; Accepted: 01 July 2024;
Published: 23 July 2024.
Edited by:
Cristiano Capurso, University of Foggia, ItalyReviewed by:
Anna Rita Atti, University of Bologna, ItalyCopyright © 2024 Singh, Rivier, Papier, Chemali, Gutierrez-Martinez, Parodi, Mayerhofer, Senff, Clocchiatti-Tuozzo, Nunley, Newhouse, Ouyang, Westover, Tanzi, Lazar, Pikula, Ibrahim, Brouwers, Howard, Howard, Yechoor, Littlejohns, Sheth, Rosand, Fricchione, Anderson and Falcone. This is an open-access article distributed under the terms of the Creative Commons Attribution License (CC BY). The use, distribution or reproduction in other forums is permitted, provided the original author(s) and the copyright owner(s) are credited and that the original publication in this journal is cited, in accordance with accepted academic practice. No use, distribution or reproduction is permitted which does not comply with these terms.
*Correspondence: Christopher D. Anderson, Y2RhbmRlcnNvbkBtZ2Iub3Jn; Guido J. Falcone, Z3VpZG8uZmFsY29uZUB5YWxlLmVkdQ==
†Present address: Keren Papier, Cancer Epidemiology Unit, Nuffield Department of Population Health, Oxford, United Kingdom
‡These authors have contributed equally to this work
Disclaimer: All claims expressed in this article are solely those of the authors and do not necessarily represent those of their affiliated organizations, or those of the publisher, the editors and the reviewers. Any product that may be evaluated in this article or claim that may be made by its manufacturer is not guaranteed or endorsed by the publisher.
Research integrity at Frontiers
Learn more about the work of our research integrity team to safeguard the quality of each article we publish.