
94% of researchers rate our articles as excellent or good
Learn more about the work of our research integrity team to safeguard the quality of each article we publish.
Find out more
ORIGINAL RESEARCH article
Front. Psychiatry, 24 June 2024
Sec. Molecular Psychiatry
Volume 15 - 2024 | https://doi.org/10.3389/fpsyt.2024.1365231
This article is part of the Research TopicToward an Understanding Of Neurodevelopmental Disorders: Novel Insights From Molecular, Behavioural and Neuroinflammatory MechanismsView all 5 articles
 Stephanie E. Brown1
 Ziyi (Zephyr) Wang2
 Emily L. Newman3,4
 Elif Engin2,3Sabina Berretta3,5Darrick T. Balu1,3†
 Oluwarotimi O. Folorunso1,3,5*
Background: Neurodevelopmental disorders (NDDs) can cause debilitating impairments in social cognition and aberrant functional connectivity in large-scale brain networks, leading to social isolation and diminished everyday functioning. To facilitate the treatment of social impairments, animal models of NDDs that link N- methyl-D-aspartate receptor (NMDAR) hypofunction to social deficits in adulthood have been used. However, understanding the etiology of social impairments in NDDs requires investigating social changes during sensitive windows during development.
Methods: We examine social behavior during adolescence using a translational mouse model of NMDAR hypofunction (SR-/-) caused by knocking out serine racemase (SR), the enzyme needed to make D-serine, a key NMDAR coagonist. Species-typical social interactions are maintained through brain-wide neural activation patterns; therefore, we employed whole-brain cFos activity mapping to examine network-level connectivity changes caused by SR deletion.
Results: In adolescent SR-/- mice, we observed disinhibited social behavior toward a novel conspecific and rapid social habituation toward familiar social partners. SR-/- mice also spent more time in the open arm of the elevated plus maze which classically points to an anxiolytic behavioral phenotype. These behavioral findings point to a generalized reduction in anxiety-like behavior in both social and non-social contexts in SR-/- mice; importantly, these findings were not associated with diminished working memory. Inter-regional patterns of cFos activation revealed greater connectivity and network density in SR-/- mice compared to controls.
Discussion: These results suggest that NMDAR hypofunction – a potential biomarker for NDDs – can lead to generalized behavioral disinhibition in adolescence, potentially arising from disrupted communication between and within salience and default mode networks.
Neurodevelopmental disorders (NDDs) such as schizophrenia (SZ) or autism spectrum disorder (ASD) share a range of social cognitive deficits that become apparent during development and can predict symptom severity in adulthood. To understand and treat social deficits in adulthood, it is important to examine the neurobiological changes that support social development during childhood and adolescence. In NDDs, the lack of social motivation or altered internal states may limit or enhance social play and dysregulate sociability during adolescence (1). For example, children with ASD may have problems initiating social interaction (2), children likely to develop schizophrenia may have issues inferring social cues (3), while children with William-Beuren syndrome (WBS) may show an increase in social drive (4). The ability to engage in productive social interactions depends on the solidification of essential neural pathways during adolescence, a sensitive period of development coinciding with peaks in synaptic pruning (5). Understanding the molecular and neural basis of social behavior and its disruption in NDDs will be crucial for developing interventions that can improve outcomes for these disorders. Patients with SZ or ASD experience symptoms tied to deficits in functional connectivity within the large-scale brain networks that uphold sociability including the default mode network (DMN; self-reflection) and salience network (SN; external or internal stimuli (1). Brain regions important for social functioning are high represented in the DMN (6). In adolescence, changes in DMN are concomitant with the severity of social impairment (6).
Adaptive and effective neuronal communication relies heavily on excitation-inhibition (E-I) balance (7), and significant evidence points to developmental E-I imbalances as an underlying cause of NDDs. Maintenance of E-I balance relies upon amino acid neurotransmission including the careful regulation of excitatory glutamatergic signaling via N-methyl-D-aspartate receptors (NMDARs). Genome-wide association studies (GWAS) in humans with schizophrenia or ASD have implicated genes and pathways important for glutamatergic signaling (8, 9) in these NDDs. Preclinical rodent studies that pharmacologically ablate NMDAR-mediated neurotransmission yield notable social deficits and reduced inhibitory neurotransmission in the medial PFC (10). Deletion of NMDARs in corticolimbic (striatum, cortex, hippocampus) interneurons during adolescence – but not adulthood – promotes aberrant sociability (11–13). In sum, these findings suggest a developmental role of NMDAR activity and point to E/I imbalance during development as a potential mechanism by which NDDs yield persistent dysregulation within the functional brain networks that uphold adaptive sociability.
Binding of glutamate and a coagonist is required for NMDAR-mediated signaling and for maintenance of E/I balance. D-serine has gained recognition as the primary NMDAR coagonist in cortico-limbic pathways that comprise the DMN and SN (14). L-serine is synthesized by astrocytes and then transported by neurons to be converted to D-serine by serine racemase (SR). As such, mice harboring a constitutive SR knockout (SR-/-) exhibit significant deficits in NMDAR-mediated signaling and plasticity in the hippocampus and dentate gyrus (15–21).
In our previous work, we demonstrated that adult SR-/- mice exhibit social deficit and impairments in social task-elicited frontal cortical gamma power, which is important for E/I balance (22). We also showed that juvenile SR-/- mice display fewer cortical interneurons and reduced prelimbic inhibitory neurotransmission (23). We observed a marked a spatio-temporal developmental increase in SR expression in the prefrontal cortex, amygdala, and nucleus accumbens areas comprising the brain networks that reinforce adaptive forms of sociability (24). Administration of D-serine rescued social deficits in NDD models with NMDAR hypofunction (25). While these findings demonstrate a critical role for D-serine signaling during social interactions in adulthood, it remains unclear whether the effects of constitutive SR-/- can be traced back to developmental social deficits during adolescence. As such, in the present work, we examine how adolescent social interactions are affected by SR-knockout-induced glutamatergic hypofunction, a model of NDD-associated E/I imbalance.
Homozygous WT or SR-/- offspring of SR+/- parents served as experimental animals. Heterozygous offspring were also employed to examine potential gene-dosing effects in a subset of pilot studies (see Supplement). Mice were weaned at post-natal day (PND) 21 and then grouped-housed with same-sex littermates (n=2–5/cage). Mice were maintained on a 12h light/dark cycle in a temperature (22C)- and humidity-controlled vivarium. Animals were given access to food and water ad libitum. All experiments complied with ethical regulations for animal testing and research. The McLean Hospital Institutional Animal Care and Use Committee approved all animal procedures. All behavioral tests were conducted with ambient lighting at approximately 10 lux and were recorded using Ethovision XT 15 (Noldus).
Sociability and social novelty preference tests were examined in a 3-chamber apparatus using protocols adapted from DeVito et al. (26). SR-/- and WT littermates (PND 27–30; n = 14 males/genotype; n = 5–7 females/genotype) were habituated to the test room for at least 60 minutes. After habituating to the testing room, each mouse habituated to the entire apparatus for five minutes and then to just the center chamber for five minutes.
Following 10-minute apparatus habituation, mice were tested for sociability, or pereference for a social vs. non-social stimulus. An unfamiliar age-matched WT stimulus mouse was placed in a small wire mesh cage on one side of the chamber while an unfamiliar object was placed in the small wire mesh cage within the opposite chamber. Social and non-socail stimulus sides were counterbalanced such that half of experimental mice received the social stimulus in the far-right chamber and half received the social stimulus in the far-left chamber of the 3-chamber apparatus. The sociability test commenced when the experimental animal was released from the center chamber and permitted to explore the entire apparatus for 10 minutes. After 10 minutes, the experimental mouse was ushered back to the center chamber. Five-minute evaluations of social novelty preference were conducted thereafter to examine how much time each experimental mouse spent investigating the now-familiar social stimulus mouse that was previously presented during the sociability test (mouse 1) vs. time spent engaging with an unfamiliar social stimulus (mouse 2). Social and non-social investigation were quantified as time spent within a circular zone extending 3-cm past the each small cage (Noldus Ethovision XT 15). The sociability preference index was calculated by subtracting the time spent with the object from the time spent with the stimulus mouse (novel mouse “1”) and then dividing that value by the combined time spent interacting with both the mouse and the object. The social novelty preference index was calculated by subtracting the time spent with the familiar mouse (novel mouse “1”) from the time spent with the novel mouse (novel mouse “2”) and then dividing that value by the combined time spent interacting with both mice. (27).
Social memory was tested in male mice (PND30; n = 7/genotype; 28). In brief, mice were habituated to the testing room in their home cages for at least 60 minutes. Experimental mice were then placed in the center of the empty testing arena to habituate for five minutes. An unfamiliar age-matched stimulus mouse in a small wire mesh cage was placed in the center of the arena and the experimental animal was permitted to investigate for five minutes. Thirty minutes later, the experimental mouse was permitted to investigate the same caged social stimulus animal for an additional five minutes. The time the experimental mouse spent within the 3-cm interaction zone was quantified (Noldus Ethovision XT 15).
Spontaneous alternations in a Y-maze task were measured to assess spatial and working memory. The Y-maze used in the present study consisted of three arms (A, B, and C), all (83 x 66.5 cm), and an equilateral triangular center. Male mice (PND 33–38; n = 7–9/genotype) habituated to the testing room for at least 30 minutes. Subsequently, mice were placed in arm “A,” facing the center of the maze and allowed to move freely through the maze for five minutes. A spontaneous alternation in this task consists of consecutive entries into each of the three arms in the maze, representing the most efficient exploratory strategy. The alternation percentage was calculated by dividing the number of alternations by the number of total possible alternations. Total possible alternations were calculated by subtracting two from the total number of arm visits.
We assessed anxiolytic behavior using the standard EPM appartus, which consisted of two ‘closed’ and two ‘open’ arms (12 L x 2.5 W inches) crossed at a ninety-degree angle and elevated (32.5 inches) above the ground. Mice were placed in the center facing the open arm to start the five-minute trial. Before testing, mice (males PND 35; n = 10–13 per genotype) were habituated to the testing room for at least 30 minutes. The ratio of time spent in the open arms was calculated by dividing the total time spent in the open arms by the total time spent in the closed arms.
Paraformaldehyde-fixed brains were preserved using SHIELD reagents (LifeCanvas Technologies) following the manufacturer’s instructions (29). Samples underwent LifeCanvas Technologies Clear+ de-lipidation and immunolabeling (cFos abcam ab214672; NeuN Encor MCA) using eFLASH (30) technology, which integrates stochastic electrotransport (31) and SWITCH (32) using a SmartBatch+ device (LifeCanvas Technologies). After immunolabeling, samples were incubated in 50% EasyIndex (RI = 1.52, LifeCanvas Technologies) overnight at 37 degrees C, followed by 1-day incubation in 100% EasyIndex for refractive index matching. After index matching, the samples were imaged using a SmartSPIM light sheet microscope using a 3.6x (0.2 NA) using 488 and 642 nm lasers (LifeCanvas Technologies).
Samples were registered to the Allen Brain Atlas (Allen Institute: https://portal.brain-map.org/) using an automated process (alignment performed by LifeCanvas Technologies). A NeuN channel for each brain was registered to an average NeuN atlas (generated by LCT using previously registered samples). Registration was performed using successive rigid, affine, and b-spline warping algorithms (SimpleElastix: https://simpleelastix.github.io/).
Automated cell detection was performed by LifeCanvas Technologies using a custom convolutional neural network created with the Tensorflow python package (Google). The cell detection was performed by two networks in sequence. First, a fully-convolutional detection network (https://arxiv.org/abs/1605.06211v1) based on a U-Net architecture (https://arxiv.org/abs/1505.04597v1) was used to find possible positive locations. Second, a convolutional network using a ResNet architecture (https://arxiv.org/abs/1512.03385v1) was used to classify each location as positive or negative. Using the previously calculated Atlas Registration, each cell location was projected onto the Allen Brain Atlas in order to count the number of cells for each atlas-defined region.
We analyzed 196 regions spanning iso-cortex, cortical plate, cortical subplate, striatum, pallidum, thalamus, hypothalamus, midbrain, pons, and medulla.
We assessed the network density, which indicates the level of interconnectedness among the brain regions by measuring the proportion of actual connections relative to the total potential connections (33). Apart from looking at all the regions in an unsupervised approach, we conducted independent analyses focused on brain regions comprising functional brain networks including the social, salience, lateral cortical, and default mode networks (34–36). We constructed a binary adjacency matrix for network analysis, values in the resulting matrix were set to 1 if they exceeded the chosen threshold, and 0 otherwise.
We used GraphPad Prism (San Diego, California, USA) and Excel for the statistical analyses performed on the behavioral assays. For comparisons between groups, we used either unpaired two-tailed t-tests, two-way analyses of variance (ANOVA), or repeated measure two-way ANOVA. One-sample t-tests were used to compare preference indexes to a null hypothesis. The bar graphs depict group mean ± SEM.
For cFos density data, we used Python SciPy (37) and statsmodels (38) packages for statistical analysis. We conducted Shapiro-Wilk test to ensure the normal distribution within brain regions (Supplementary Table 1) as well as at the whole brain level, and performed multiple unpaired t-tests with Benjamini and Hochberg FDR correction. To understand the potential co-activation patterns and address the uneven sample size between groups, we calculated non-parametric Spearman’s rank correlation coefficients (ρ values) between the cFos density measurements using seaborn package in Python (39). To identify connections that exhibit a strong level of coactivation, the adjacency matrix was used a threshold based on the absolute effect size (|ρ| ≥ 0.8) (40). We also applied p-value with correction using Benjamini and Hochberg false discovery rate (5% FDR) as a threshold to investigate the significantly correlated regions.
Neither male nor female adolescent SR-/- and WT mice preferred social stimuli over non-social stimuli (Figures 1A, B, H, I). WT and SR-/- males and SR-/- females preferred to interact with a novel social stimulus as compared to a familiar social stimulus (Figure 1C; WT males: t[13] = 2.943, p = 0.0114; SR-/- males: t[13] = 3.461, p = 0.0042), in the females, SR-/- mice showed this preference (Figure 1J; t[6] = 2.686, p = 0.0362). Examining time-binned behavior over the course of the social novelty test revealed that male and female adolescent SR-/- mice spent more time with a novel social partner compared with their WT counterparts (Figure 1D; males: F[1,27] = 5.097, Hedge’s g = 0.126, η2 p = 0.061, p = 0.032; Figure 1K; females: F[1, 9] = 5.636, Hedge’s g = 0.248, η2 p = 0.254, p = 0.042). Although we did not observe a social preference in the WT female mice, the interaction time with the novel mouse was similar to those observed in the male WT mice. Exploring social interaction bouts revealed that male SR-/- mice took significantly longer to interact with the familiar mouse (Figure 1E; t[27] = 2.622, p = 0.032) and had longer bouts of continuous interaction with the novel mouse (Figure 1F; t[27] = 2.520, p = 0.018) within the first minute of the social novelty test. These differences were not seen in the female mice (Figures 1L, M). There were no differences in distance traveled between the genotypes (Figures 1G, N) or any apparent gene-dosing effects when heterozygous mice were included in pilot analyses of WT, SR+/-, and SR-/- mice (Supplementary Figure 1). As such, we chose to examine only WT and SR-/- mice in subsequent experiments. In females, only the SR-/- displayed a significant social novelty preference (Supplementary Figure 1G; t(6) = 2.87, p = 0.03). However, similar to the males, there were no significant differences between the genotypes in the time spent with the novel mouse (Supplementary Figure 1H).
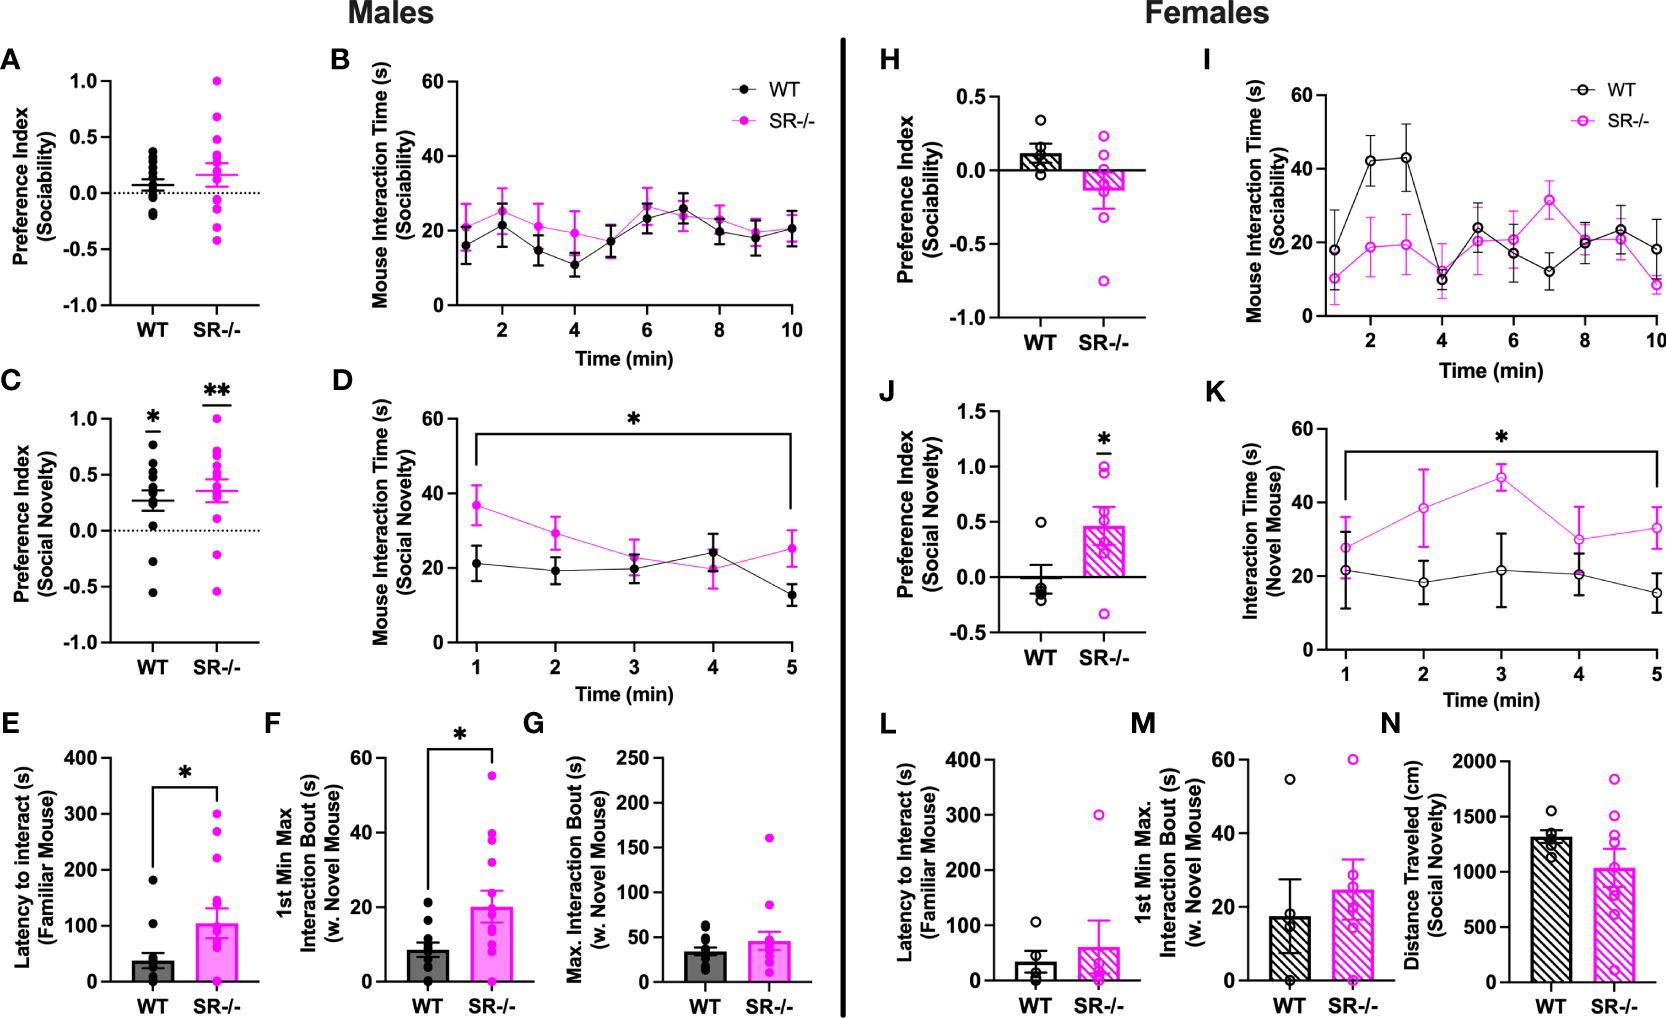
Figure 1 Male and female adolescent (PND27–30) SR-/- mice show an increase in social interaction with a novel mouse. (A, H) Graphs show the sociability preference indexes. (B, I) Graphs show the time in seconds spent interacting with the stimulus mouse in the sociability trial. (C, J) Graphs show the social novelty preference indexes and the results of one-sample t-tests comparing the observed means to a hypothetical mean. (D, K) Graphs show the time in seconds spent interacting with the novel mouse in the social novelty trial. (E, L) Graphs show latency to interaction with the familiar mouse in the social novelty trial. (F, M) Graphs show the maximum interaction bout with the novel mouse in the first minute of the social novelty trial. (G, N) Graphs show the distance traveled by each genotype in the social novelty trial. Males: n = 14 (both genotypes); females: WT: n = 5; SR-/-: n = 7. *p < 0.05, **p < 0.01. One-sample t-test, unpaired t-test, and repeated measure ANOVA.
To determine whether the preference for a novel social stimulus in SR-/- adolescent mice was due to impaired social recognition or social memory, we performed a two-trial social memory test. Notably, in trial two, both groups showed: (1) a lack of familiarity preference, calculated by using a one-sample t-test to compare the mean preference against a hypothetical mean of one (Figure 2A; WT: t[6] =15.15, p < 0.001; SR-/-: t[6] = 10.72, p < 0.001); (2) expedited social habituation as supported by diminished social interaction time with the familiar social partner over time compared to WT controls (Figure 2B; F[4.737, 56.84] = 6.194, Hedge’s g = 0.334, η2 p = 0.340, p < 0.0002); and fewer zone entries (Figure 2C; F[1, 12] = 20.77, Hedge’s g = 0.592, η2 p = 0.634, p = 0.0007); (3) a trend toward an increased latency to interact with the stimulus mouse (Figure 2D; F[1, 12] = 4.482, Hedge’s g = 0.253, η2 p = 0.272, p = 0.0558) and; (4) a reduction in overall distance traveled (Figure 2E; F[1, 12] = 28.44, Hedge’s g = 0.655, η2 p = 0.703, p = 0.0002). In accordance, the SR-/- mice had a significantly lower familiarity preference than the WT mice (Figure 2A; t[12] = 4.204, p = 0.0012) and spent significantly less time with the stimulus mouse in the second trial than the WT mice (Figure 2B; F [9, 108] = 2.291, Hedge’s g = 0.159, η2 p = 0.160, p = 0.025).
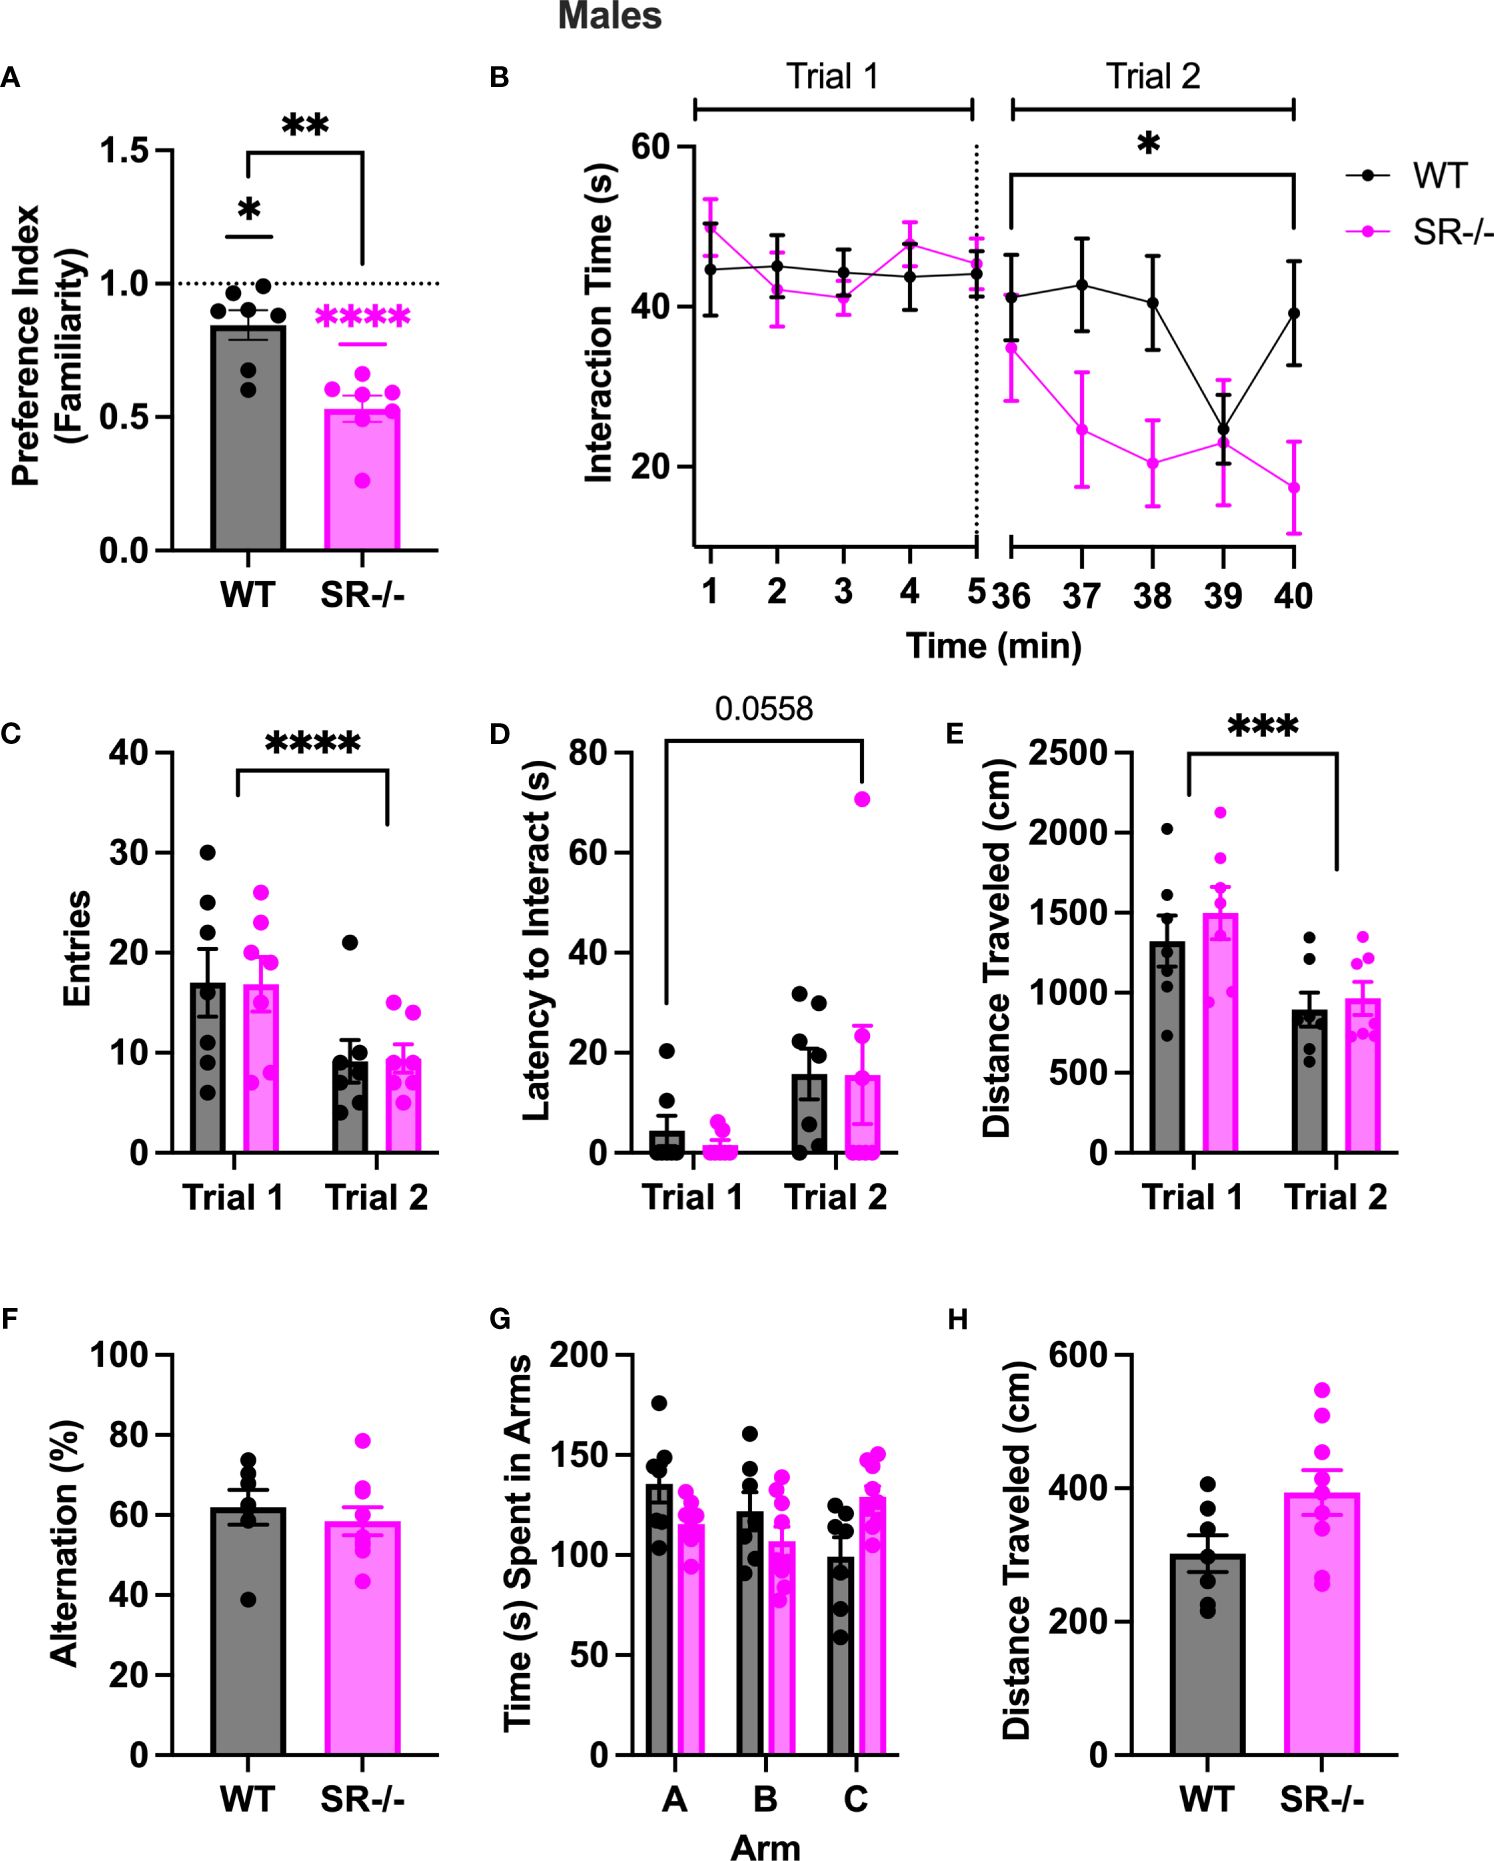
Figure 2 Adolescent (PND30) male SR-/- mice spend less time with a familiar mouse in a two-trial sociability test. (A) Graph shows familiarity preferences in both genotypes (B) Graph shows the time in seconds spent interacting with a stimulus mouse (trial 1) and the same mouse after a 30-minute interval (trial 2). (C) Graph shows the number of entries to the interaction zone with the stimulus mouse in both trials. (D) Graph shows the latency, in seconds, the first entry of the interaction with the stimulus mouse in both trials. (E) Graph shows the distance traveled, in centimeters, of the test mouse in trial 1 and trial 2. (F) Graph shows the percentage of successful alternations completed by each genotype in the Y-maze task. (G) Graph shows the time, in seconds, spent in each arm of the Y maze. (H) Graph shows the distance traveled in the Y-maze. Two trial sociability test: WT n = 7 for both genotypes; Y-Maze: WT: n = 7; SR/- n: 9. *p < 0.05, **p < 0.01, ****p < 0.0001. One-sample t-test, unpaired t-test, and repeated measure ANOVA.
To determine if the differences in social novelty preference and repeated social interaction were due to differences in spatial working memory between WT and SR-/- adolescent mice, we then subjected both genotypes to a spontaneous alternation Y-maze task. No difference in alternation percentage, time spent in the arms, or distance traveled was observed between the SR-/- to WT mice (Figures 2F–H).
Compared to the WT, SR-/- males spent a significantly higher ratio of time in the open arms of the EPM (Figure 3A, t[21] = 3.784, p = 0.011). Additionally, they also displayed a significantly higher number of entries to the open arms (Figure 3B, t[21] = 2.605, p = 0.0165). We did not observe any differences between genotypes in the latency to the open arms (Figure 3C) and the distance traveled in the arena (Figure 3D). The increase in time spent in and entries to the open arms was only seen in the SR-/- and not SR +/- mice (Supplementary Figures 2A, B; F[2, 32] = 6.698, Hedge’s g = 0.286, η2 p = 0.295, p = 0.0037, F[2, 32] = 3.824, Hedge’s g = 0.188, η2 p = 193, p = 0.0324).
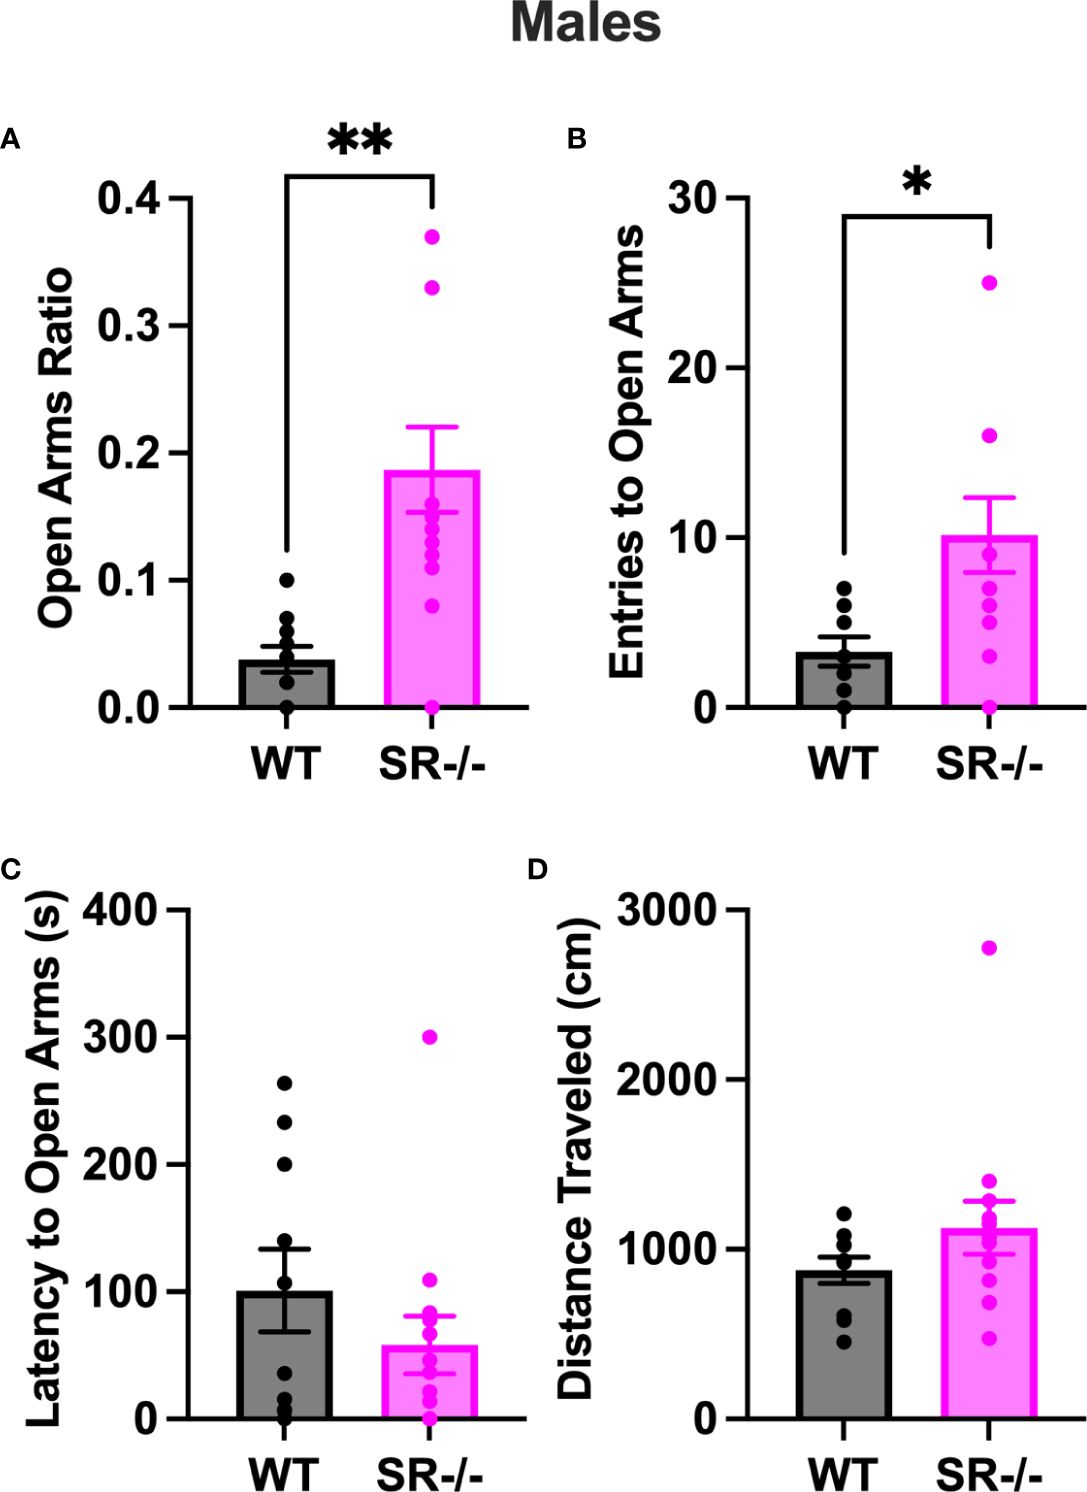
Figure 3 SR-/- adolescent male mice show an increase in exploratory behavior. (A) Graph shows ratio of time spent in the open arms of an elevated plus maze. (B) Graph shows the number of entries to the open arms of the maze. (C) Graph shows the latency in seconds before first entry to the open arms. (D) Graph shows the distance traveled in the maze. WT: n = 10, SR-/-: n = 13. *p < 0.05, **p < 0.01. Unpaired t-test.
To assess the impact of SR deletion on brain network activation, we utilized whole-brain cFos expression induced during the first 90 seconds of the social novelty task. We hypothesized that we would see cFos density changes in social brain networks. We constructed a comprehensive brain network comprising of 196 brain regions (Figure 4A) and generated correlation matrices using different thresholds and the adjusted p-value. We show images and heatmaps for cFos detection in WT and SR-/- sections (Figure 4B). Figure 4C shows the interaction with the novel mouse used for c-Fos whole brain imaging and the total cFos densities for the 196 brain regions. There was a distinctive pattern of cFos expression in SR-/- compared to WT (Figures 4D, E) mice. To determine if these correlations are not by chance, we applied multiple effect size thresholds. We show an increase in the network density (# correlation/# possible correlations) using multiple (0.7, 0.8, 0.9) thresholds (Figure 4F). We next plotted the correlation matrices using 0.8 as an exploratory threshold due to the number of correlations identified and sample size (Figures 4G, H). We show that both the positive and negative correlated areas are increased after thresholding in the SR-/- compared to the WT brains (Figure 4I). We converted the correlation matrix to an adjacency matrix (conversion to a binary number based on |ρ| ≥ 0.8) to develop functional connectivity plots. We analyzed the default mode, salience, social, and lateral cortical networks independently (Figures 4J, K). There was an increase in connections and changes in the predicted connectivity in SR-/- in the default network and a decrease in the salience network compared to WT brains (Figures 4J, K; Table 1). After adjusting for both the number of brain regions (Figures 5A, B), we still observed an increase in network density (Figure 5C) in SR-/- compared to WT brains. For cFos cell density in each brain regions, we see a significant increase in ventral tegmental area (Supplementary Figure 3C, t[8.909] = 3.372, p = 0.008347, q = 0.082640). There were no significant changes in other brain regions within these networks after FDR correction (Supplementary Figures 3A, B, D).
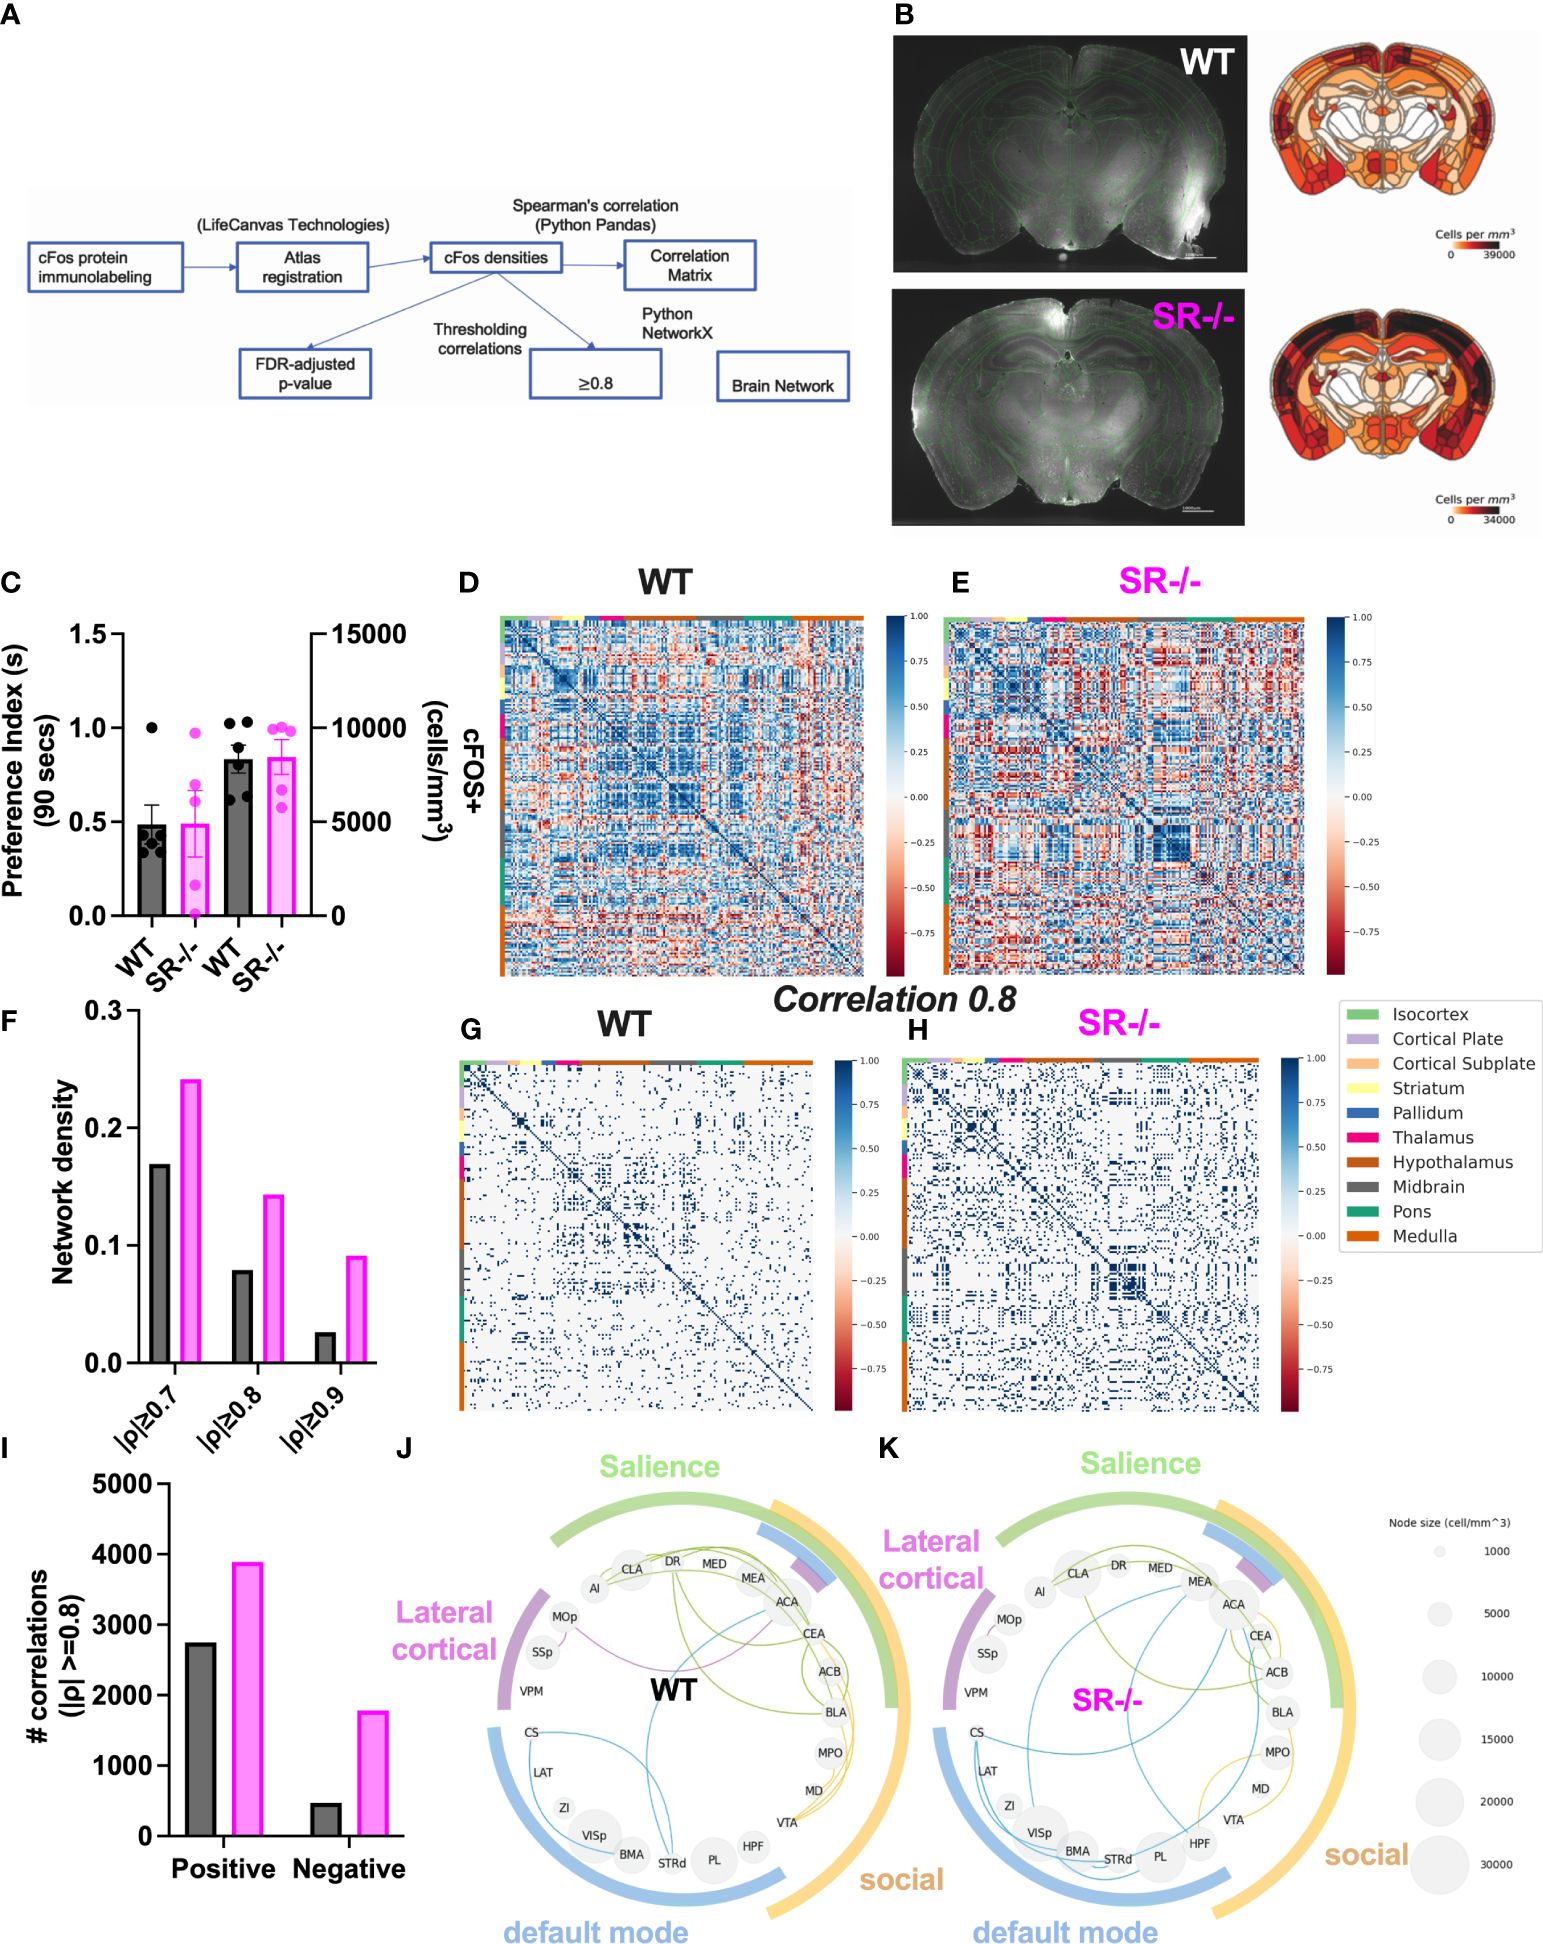
Figure 4 Increase in cFos network density in male SR-/- mice. (A) Whole-brain cFos analysis strategy (B) Representative cFos staining and heatmaps from WT and SR-/- sections (C) Total cFos densities and preference for a novel social stimulus animal in the three-chambered social interaction paradigm in adolescent (PND28) WT (grey) and SR-/- (magenta) mice. (D, E) All correlations between 196 brain regions. (F) Network densities with increasingly stringent thresholding (G, H) Correlations that survive moderately stringent thresholding (||0.8 threshold in WT and SR-/- respectively. (I) Number of positive and negative correlations after Spearman’s |ρ| ≥ 0.8 thresholding. (J, K) cFos analyses in functional brain networks including the Default Mode (blue), Salience (green), Social (yellow) and Lateral cortical (purple) networks. Circle plots showing the correlations between regions within each functional network (|ρ| ≥ 0.8). Node size indicates regional cFos density (WT: n = 6, SR-/-: n = 5).
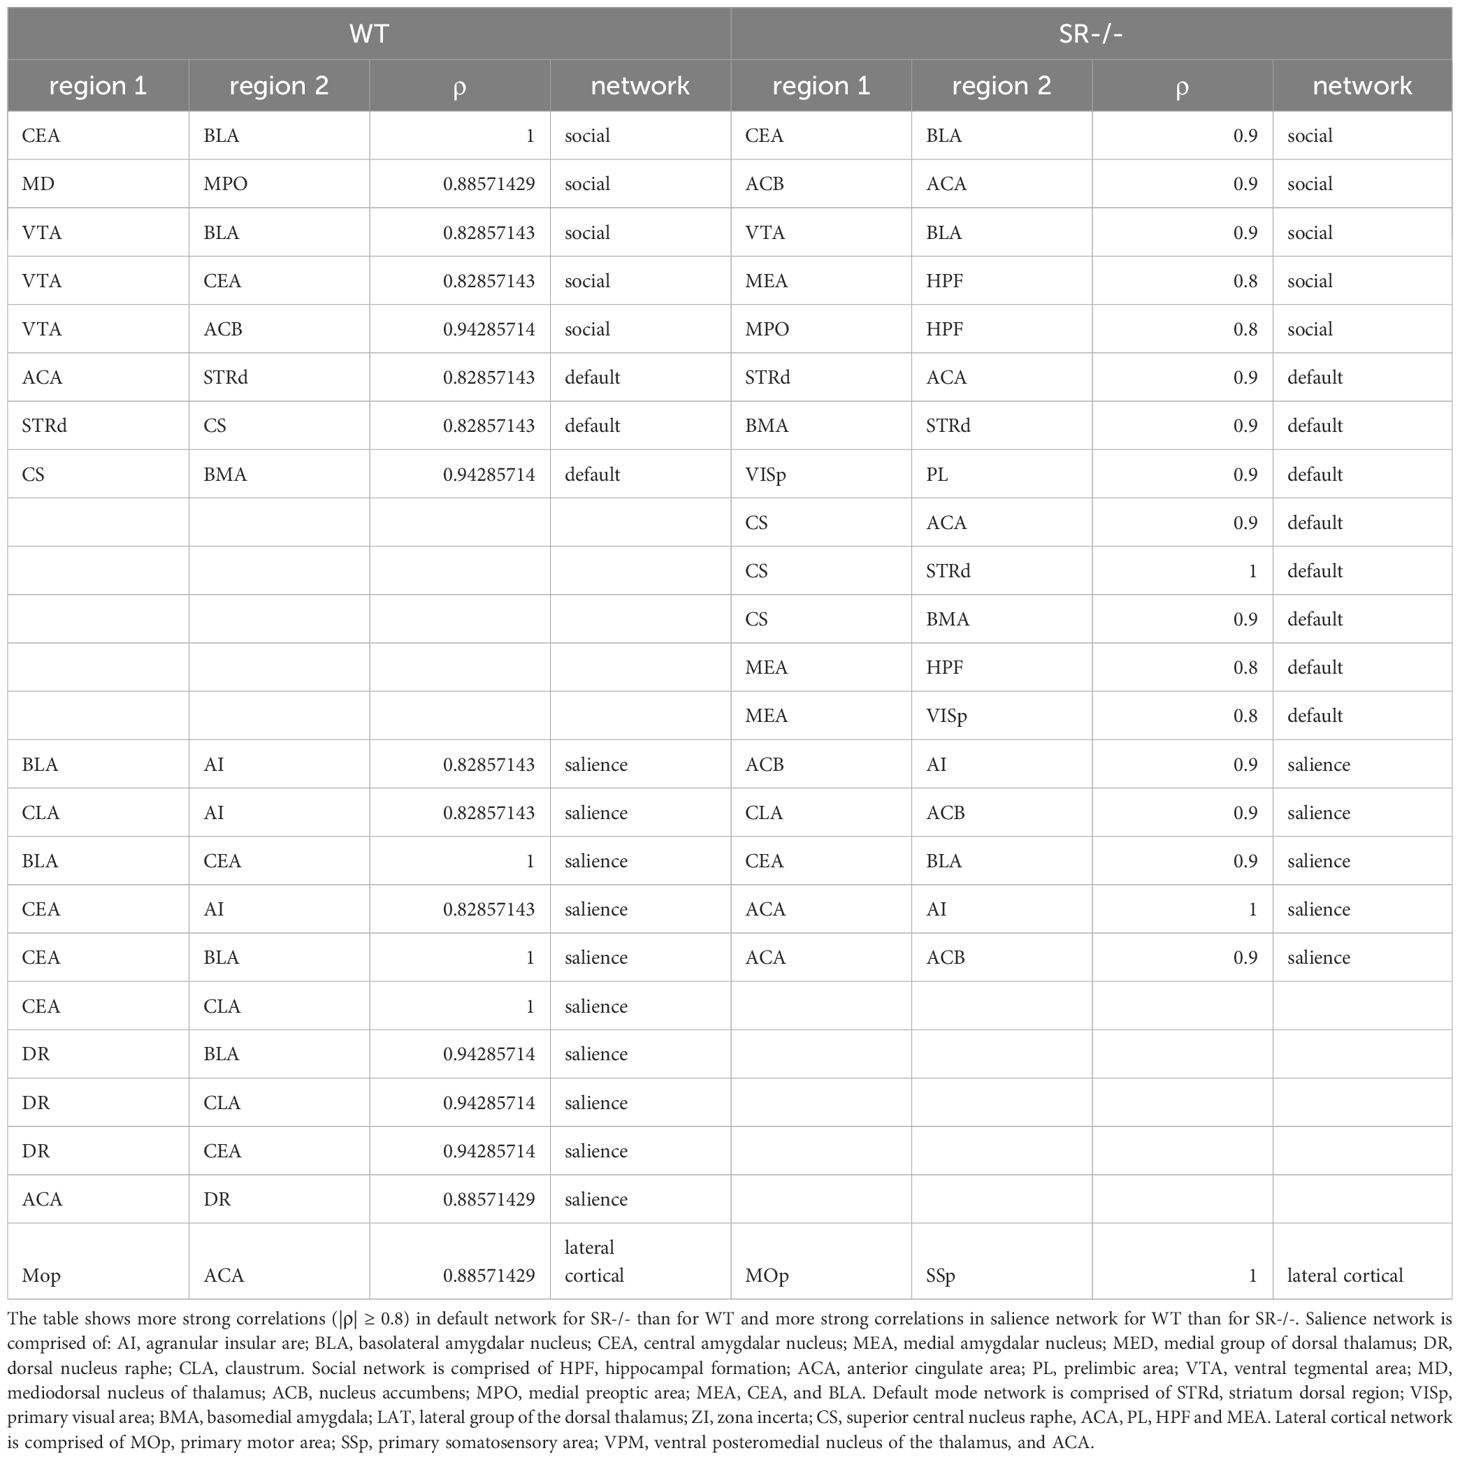
Table 1 Correlations between brain regions within the salience, social, default mode and lateral cortical networks.
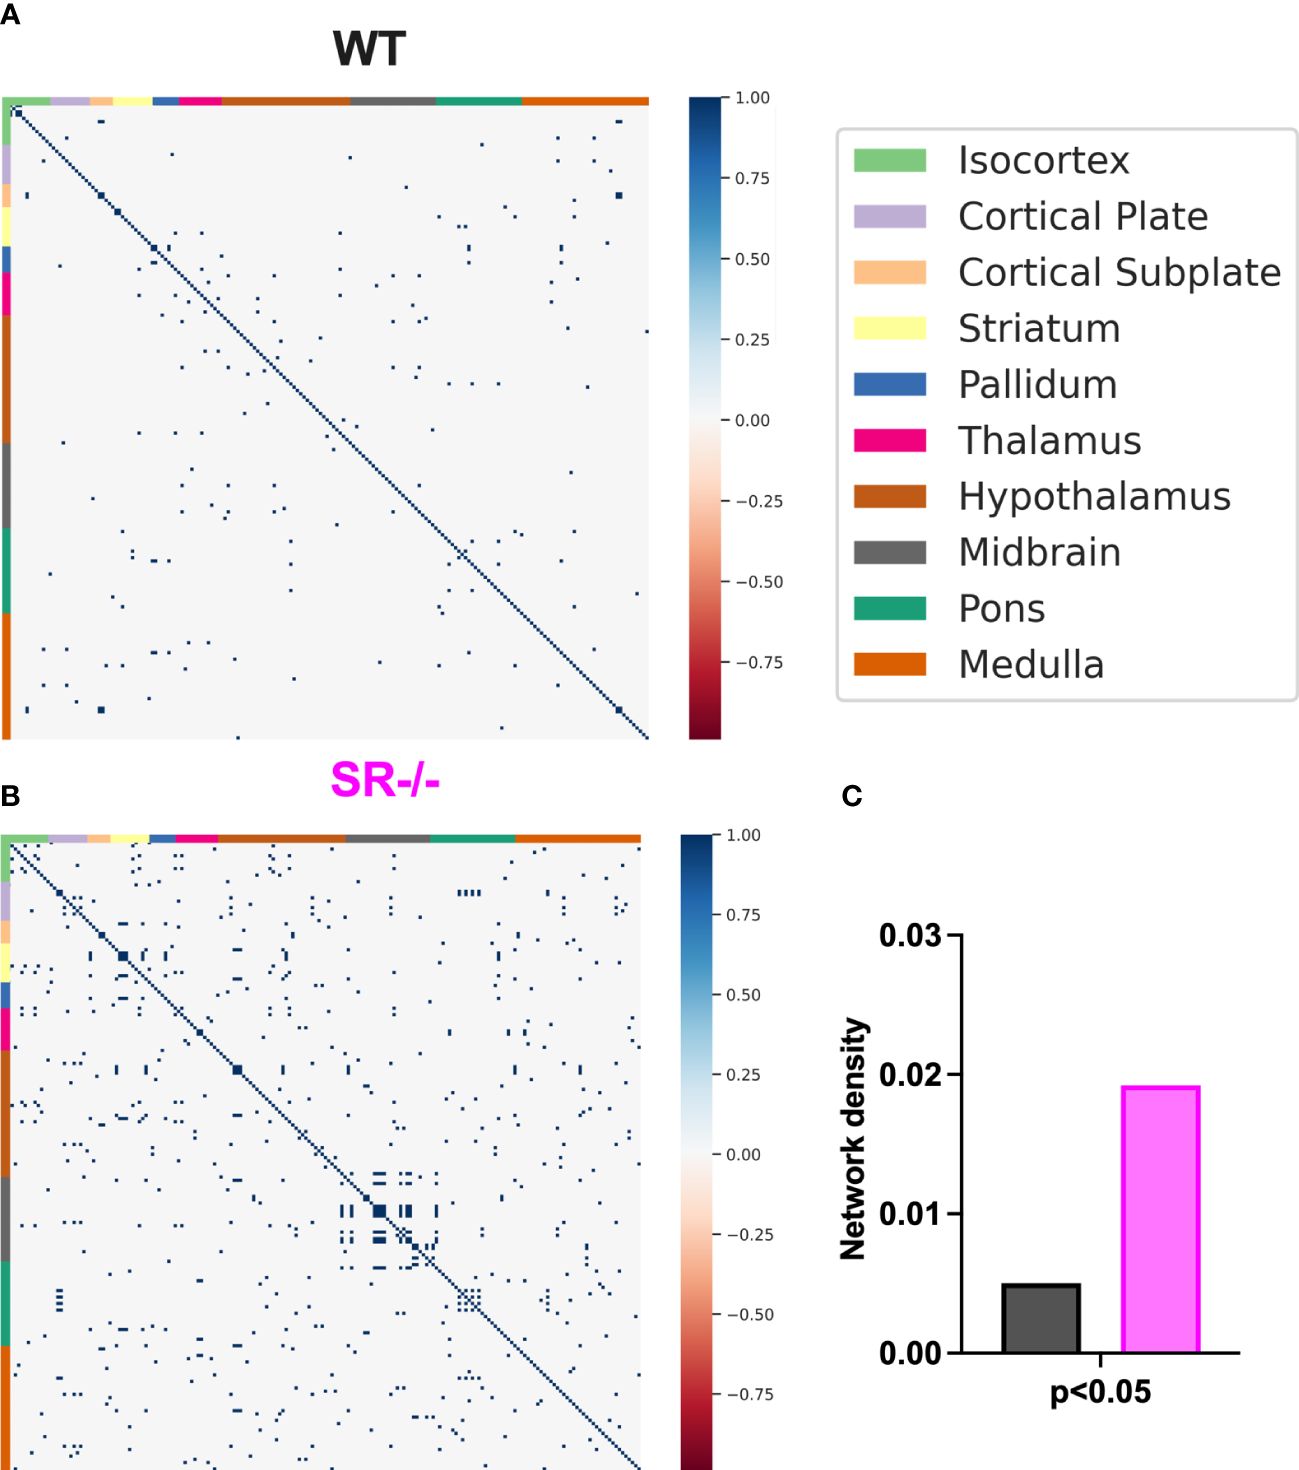
Figure 5 Correlations and network density in male adolescent mice after adjusting for the number of brain regions. (A, B) Correlation matrices after adjusting for the 196 brain regions. (C) WT (n=6) and SR-/- (n=5) network density. Spearman’s rank correlation coefficients with FDR correction.
In this study, we found that both male and female adolescent SR-/- displayed increased social interaction with novel conspecific mice, compared to WT mice. We examined male mice further because of the immediate increase in social exploratory behavior. In male SR-/- mice, there was a rapid decrease in interaction with the familiar mouse in the second trial of the repeat social interaction test and reduced anxiety-related exploratory elevated plus maze paradigm. We show an increase in social novelty-induced cFos network density in the SR-/- compared to WT across the 196 brain regions analyzed in male mice. There was an increase in connectivity in the default-mode network and a decrease in the salience network in the SR-/- mice compared to WT. Overall, our phenotype in adolescence is similar to models of William-Beuren syndrome that display sociability disinhibition and less anxiety (41).
The increased social novelty behavior we observed in the adolescent SR-/- mice is similar to adolescent Grin1 hypomorph mice with near-complete loss of Grin1 expression (42). Adolescent (PND 34–38) Grin1 hypomorph male mice showed a considerable increase in social novelty behavior (42), while adult mouse models of NMDAR hypofunction display social deficits (13, 43, 44). Our previous studies have shown that adult SR-/- mice display NMDAR hypofunction, including reduced NMDAR currents and NMDAR induced postsynaptic potential or current and neurotransmission (15–21). These data suggest that changes in social behavior in SR-/- mice could be through changes in NMDAR activity. However, further investigation is needed to exclude any NMDAR-independent mechanisms during adolescence.
Our results show that SR-/- adolescent mice display a disinhibited exploratory behavior in the EPM paradigm. These effects were not due to an increase in locomotion in the SR-/- male mice. D-serine has been found to play a critical role in regulating glutamatergic neurotransmission, neuronal excitability, and synaptic plasticity in the prefrontal cortex (PFC) via modulating dopamine action at D1-type and D3-type receptors (21). Modulation of dopamine receptors was able to regulate effects of NMDAR hypofunction on impulsive behaviors (45). Furthermore, juvenile stroke-prone spontaneous hypertensive rats (SHRSP/Ezo) display NMDAR dysfunction and abnormal d-serine metabolism in the mPFC. Administration of D-amino acid oxidase (DAAO, d-serine degrading enzyme) inhibitor rescued attention-deficit/hyperactivity disorder (AD/HD) symptoms (46). NMDAR hypofunction, a hallmark of the SR-/- model, has also been linked to increased exploratory and novelty seeking (47, 48). Lastly, D-serine is important for fear learning (49). In future studies, it would be important to determine if SR-/- mice display risk-taking or impulsive behavior. We used cFos activation correlations between brain areas as a means to predict functional connectivity in the social, salience, lateral cortical, and default mode networks similiar to functional magnetic resonance imaging (fMRI) in humans. We observed increased cFos network density and dysfunctional connectivity (Table 1) within human networks and social regions in SR-/- male mice. In multiple networks, there was more cFos coactivation between the anterior cingulate, hippocampal formation regions, and other subcortical regions (Table 1). These data are supported by human studies and NMDAR-hypofunction models in mice. Administration of phencyclidine, an NMDAR antagonist, increased activation of frontal-hippocampal regions and the functional connectivity within thalamic networks using EEG and fMRI (50). Resting-state fMRI in adult mice exposed to human recombinant monoclonal NR1 antibody in utero showed a reduction in hippocampal functional connectivity (51). In humans, the administration of ketamine (NMDAR antagonist) alters the connectivity of the default mode and salience networks (52) and increases connectivity between thalamic and sensory regions in healthy individuals (53). Patients with schizophrenia who have the disease-associated GRIN2A (NMDAR subunit) variant exhibit increased connectivity in striato-pallido-thalamic regions (54). We observed an increase in connectivity in the default-mode network and a decrease in the salience network in the SR-/- mice compared to WT (Table 1). Interestingly, in the SR-/- brains, we observed less cFos correlations in the amygdala (BLA, CEA) and VTA and more in the cortical (ACA), hippocampal, nucleus accumbens areas, which are important for social cognition and reward (Table 1). This data suggests that SR deletion may disrupt functional brain networks. However, future studies will be needed to determine if SR deletion alters anatomical connections between areas involved in these networks.
Our study highlights the importance of D-serine availability for proper social behavior and neural connectivity. Future studies exploring the contribution of cell-specific D-serine signaling to NMDAR function, synaptogenesis, excitatory/inhibitory (E/I) balance, and neuronal connectivity will enhance our understanding of the molecular mechanisms of the development of social cognition. More studies are also needed to understand social behavior in SR female adolescent and adult mice.
The original contributions presented in the study are included in the article/Supplementary Material. Further inquiries can be directed to the corresponding author.
The animal studies were approved by McLean Hospital Institutional Animal Care and Use Committee. The studies were conducted in accordance with the local legislation and institutional requirements. Written informed consent was obtained from the owners for the participation of their animals in this study.
SEB: Data curation, Writing – review & editing, Writing – original draft, Visualization, Methodology, Investigation, Formal analysis, Conceptualization. EN: Writing – review & editing, Visualization, Supervision, Methodology, Formal analysis, Conceptualization. ZW: Writing – review & editing, Writing – original draft, Visualization, Methodology, Formal analysis, Data curation. EE: Writing – review & editing, Visualization, Supervision, Funding acquisition. SB: Writing – review & editing, Supervision, Funding acquisition. DB: Writing – review & editing, Supervision, Funding acquisition, Conceptualization. OF: Visualization, Funding acquisition, Writing – review & editing, Writing – original draft, Supervision, Methodology, Investigation, Formal analysis, Data curation, Conceptualization.
The author(s) declare financial support was received for the research, authorship, and/or publication of this article. This work was supported by the BrightFocus Foundation #A2019034S (DB), 1R03AG063201–01 (DB), US-Israel Binational Science Foundation Grant #2019021 (DB, OF), T32MH125786 (OF), McLean Presidential Award (OF), F32MH125634 and K99MH133869 (EN), R01HD104656 (EE).
The authors declare that the research was conducted in the absence of any commercial or financial relationships that could be construed as a potential conflict of interest.
All claims expressed in this article are solely those of the authors and do not necessarily represent those of their affiliated organizations, or those of the publisher, the editors and the reviewers. Any product that may be evaluated in this article, or claim that may be made by its manufacturer, is not guaranteed or endorsed by the publisher.
The Supplementary Material for this article can be found online at: https://www.frontiersin.org/articles/10.3389/fpsyt.2024.1365231/full#supplementary-material
Supplementary Figure 1 | SR+/- mice display similar social interaction behavior to WT mice. (A, E) Graphs show the sociability preference indexes. (B, F) Graphs show the time in seconds spent interacting with the stimulus mouse and the novel object in the sociability trial. (C, G). Graphs show the social novelty preference indexes and the results of one-sample t-tests comparing the observed means to a hypothetical mean. (D, H) Graphs show the time in seconds spent interacting with the novel mouse and the familiar mouse in the social novelty trial. Males: N = 7-14; females: N = 5-6. * p < 0.05, ** p < 0.01. One-sample t-test, unpaired t-test and ANOVA.
Supplementary Figure 2 | No significant difference in exploratory behavior in adolescent SR+/- mice compared to WT or SR-/-. (A) Graph shows the ratio of time spent in the open arms of an elevated plus maze (EPM). (B) Graph shows the number of entries to the open arms of the EPM. (C) Graph shows the latency in seconds before the first entry to the open arms. (D) Graph shows the distance traveled in the maze. N = 10 - 13. * p < 0.05. ANOVA.
Supplementary Figure 3 | cFos densities within default-mode, salience, social, lateral cortical network. Graphs show average cFos density in brain areas within the (A) Default-mode network (B) Salience network (C) Social network (D) Lateral cortical network. WT: N = 6, SR-/-: N = 5. * p<0.05, q<0.1. Unpaired t-test with Welch correction and FDR correction. Data is presented as Mean ± SEM.
1. Jutla A, Foss-Feig J, Veenstra-VanderWeele J. Autism spectrum disorder and schizophrenia: An updated conceptual review. Autism Res. (2022) 15:384–412. doi: 10.1002/aur.2659
2. Ibanez LV, Grantz CJ, Messinger DS. The development of referential communication and autism symptomatology in high-risk infants. Infancy. (2013) 18. doi: 10.1111/j.1532–7078.2012.00142.x
3. Bigelow NO, Paradiso S, Adolphs R, Moser DJ, Arndt S, Heberlein A, et al. Perception of socially relevant stimuli in schizophrenia. Schizophr Res. (2006) 83:257–67. doi: 10.1016/j.schres.2005.12.856
4. Jones W, Bellugi U, Lai Z, Chiles M, Reilly J, Lincoln A, et al. II. Hypersociability in williams syndrome. J Cognit Neurosci. (2000) 12 Suppl 1:30–46. doi: 10.1162/089892900561968
5. Blakemore SJ, Choudhury S. Development of the adolescent brain: implications for executive function and social cognition. J Child Psychol Psychiatry. (2006) 47:296–312. doi: 10.1111/j.1469-7610.2006.01611.x
6. Nair A, Jolliffe M, Lograsso YSS, Bearden CE. A review of default mode network connectivity and its association with social cognition in adolescents with autism spectrum disorder and early-onset psychosis. Front Psychiatry. (2020) 11:614. doi: 10.3389/fpsyt.2020.00614
7. Tatti R, Haley MS, Swanson OK, Tselha T, Maffei A. Neurophysiology and regulation of the balance between excitation and inhibition in neocortical circuits. Biol Psychiatry. (2017) 81:821–31. doi: 10.1016/j.biopsych.2016.09.017
8. Singh T, Poterba T, Curtis D, Akil H, Al Eissa M, Barchas JD, et al. Rare coding variants in ten genes confer substantial risk for schizophrenia. Nature. (2022) 604:509–16. doi: 10.1038/s41586–022-04556-w
9. Trubetskoy V, Pardinas AF, Qi T, Panagiotaropoulou G, Awasthi S, Bigdeli TB, et al. Mapping genomic loci implicates genes and synaptic biology in schizophrenia. Nature. (2022) 604:502–8. doi: 10.1038/s41586–022-04434–5
10. Luessen DJ, Gallinger IM, Ferranti AS, Foster DJ, Melancon BJ, Lindsley CW, et al. mGlu(1)-mediated restoration of prefrontal cortex inhibitory signaling reverses social and cognitive deficits in an NMDA hypofunction model in mice. Neuropsychopharmacology. (2022) 47:1826–35. doi: 10.1038/s41386–022-01350–0
11. Belforte JE, Zsiros V, Sklar ER, Jiang Z, Yu G, Li Y, et al. Postnatal NMDA receptor ablation in corticolimbic interneurons confers schizophrenia-like phenotypes. Nat Neurosci. (2010) 13:76–83. doi: 10.1038/nn.2447
12. Saunders JA, Tatard-Leitman VM, Suh J, Billingslea EN, Roberts TP, Siegel SJ. Knockout of NMDA receptors in parvalbumin interneurons recreates autism-like phenotypes. Autism Res. (2013) 6:69–77. doi: 10.1002/aur.1264
13. Billingslea EN, Tatard-Leitman VM, Anguiano J, Jutzeler CR, Suh J, Saunders JA, et al. Parvalbumin cell ablation of NMDA-R1 causes increased resting network excitability with associated social and self-care deficits. Neuropsychopharmacology. (2014) 39:1603–13. doi: 10.1038/npp.2014.7
14. Coyle JT, Balu D, Wolosker H. D-Serine, the Shape-Shifting NMDA Receptor Co-agonist. Neurochem Res. (2020) 45:1344–53. doi: 10.1007/s11064-020-03014-1
15. Basu AC, Tsai GE, Ma CL, Ehmsen JT, Mustafa AK, Han L, et al. Targeted disruption of serine racemase affects glutamatergic neurotransmission and behavior. Mol Psychiatry. (2009) 14:719–27. doi: 10.1038/mp.2008.130
16. Benneyworth MA, Li Y, Basu AC, Bolshakov VY, Coyle JT. Cell selective conditional null mutations of serine racemase demonstrate a predominate localization in cortical glutamatergic neurons. Cell Mol Neurobiol. (2012) 32:613–24. doi: 10.1007/s10571–012-9808–4
17. Balu DT, Li Y, Puhl MD, Benneyworth MA, Basu AC, Takagi S, et al. Multiple risk pathways for schizophrenia converge in serine racemase knockout mice, a mouse model of NMDA receptor hypofunction. Proc Natl Acad Sci U.S.A. (2013) 110:E2400–2409. doi: 10.1073/pnas.1304308110
18. Balu DT, Li Y, Takagi S, Presti KT, Ramikie TS, Rook JM, et al. An mGlu5-Positive allosteric modulator rescues the neuroplasticity deficits in a genetic model of NMDA receptor hypofunction in schizophrenia. Neuropsychopharmacology. (2016) 41:2052–61. doi: 10.1038/npp.2016.2
19. Perez EJ, Tapanes SA, Loris ZB, Balu DT, Sick TJ, Coyle JT, et al. Enhanced astrocytic d-serine underlies synaptic damage after traumatic brain injury. J Clin Invest. (2017) 127:3114–25. doi: 10.1172/jci92300
20. Wong JM, Folorunso OO, Barragan EV, Berciu C, Harvey TL, Coyle JT, et al. Postsynaptic serine racemase regulates NMDA receptor function. J Neurosci. (2020) 40:9564–75. doi: 10.1523/JNEUROSCI.1525–20.2020
21. Dallerac G, Li X, Lecouflet P, Morisot N, Sacchi S, Asselot R, et al. Dopaminergic neuromodulation of prefrontal cortex activity requires the NMDA receptor coagonist d-serine. Proc Natl Acad Sci U.S.A. (2021) 118. doi: 10.1073/pnas.2023750118
22. Aguilar DD, Radzik LK, Schiffino FL, Folorunso OO, Zielinski MR, Coyle JT, et al. Altered neural oscillations and behavior in a genetic mouse model of NMDA receptor hypofunction. Sci Rep. (2021) 11:9031. doi: 10.1038/s41598–021-88428–9
23. Folorunso OO, Brown SE, Baruah J, Harvey TL, Jami SA, Radzishevsky I, et al. D-serine availability modulates prefrontal cortex inhibitory interneuron development and circuit maturation. Sci Rep. (2023) 13:9595. doi: 10.1038/s41598–023-35615–5
24. Folorunso OO, Harvey TL, Brown SE, Cruz C, Shahbo E, Ajjawi I, et al. Forebrain expression of serine racemase during postnatal development. Neurochem Int. (2021) 145:104990. doi: 10.1016/j.neuint.2021.104990
25. Arizanovska D, Emodogo JA, Lally AP, Palavicino-Maggio CB, Liebl DJ, Folorunso OO. Cross species review of the physiological role of D-serine in translationally relevant behaviors. Amino Acids. (2023) 1501–17. doi: 10.1007/s00726–023-03338–6
26. DeVito LM, Balu DT, Kanter BR, Lykken C, Basu AC, Coyle JT, et al. Serine racemase deletion disrupts memory for order and alters cortical dendritic morphology. Genes Brain Behav. (2011) 10(2):210–22. doi: 10.1111/j.1601-183X.2010.00656.x
27. Baronio D, Castro K, Gonchoroski T, de Melo GM, Nunes GD, Bambini-Junior V, et al. Effects of an H3R antagonist on the animal model of autism induced by prenatal exposure to valproic acid. PloS One. (2015) 10:e0116363. doi: 10.1371/journal.pone.0116363
28. Bian WJ, Brewer CL, Kauer JA, de Lecea L. Adolescent sleep shapes social novelty preference in mice. Nat Neurosci. (2022) 25:912–23. doi: 10.1038/s41593-022-01076-8
29. Park YG, Sohn CH, Chen R, McCue M, Yun DH, Drummond GT, et al. Protection of tissue physicochemical properties using polyfunctional crosslinkers. Nat Biotechnol. (2019) 37:73–83. doi: 10.1038/nbt.4281
30. Yun DH, Park Y-G, Cho JH, Kamentsky L, Evans NB, Albanese A, et al. Ultrafast immunostaining of organ-scale tissues for scalable proteomic phenotyping. bioRxiv. (2019), 660373. doi: 10.1101/660373
31. Kim SY, Cho JH, Murray E, Bakh N, Choi H, Ohn K, et al. Stochastic electrotransport selectively enhances the transport of highly electromobile molecules. Proc Natl Acad Sci U.S.A. (2015) 112:E6274–6283. doi: 10.1073/pnas.1510133112
32. Murray E, Cho JH, Goodwin D, Ku T, Swaney J, Kim SY, et al. Simple, scalable proteomic imaging for high-dimensional profiling of intact systems. Cell. (2015) 163:1500–14. doi: 10.1016/j.cell.2015.11.025
33. Rubinov M, Sporns O. Complex network measures of brain connectivity: uses and interpretations. Neuroimage. (2010) 52:1059–69. doi: 10.1016/j.neuroimage.2009.10.003
34. Farahani FV, Karwowski W, Lighthall NR. Application of graph theory for identifying connectivity patterns in human brain networks: A systematic review. Front Neurosci. (2019) 13:585. doi: 10.3389/fnins.2019.00585
35. Mague SD, Talbot A, Blount C, Walder-Christensen KK, Duffney LJ, Adamson E, et al. Brain-wide electrical dynamics encode individual appetitive social behavior. Neuron. (2022) 110:1728–1741 e1727. doi: 10.1016/j.neuron.2022.02.016
36. Mandino F, Vrooman RM, Foo HE, Yeow LY, Bolton TAW, Salvan P, et al. A triple-network organization for the mouse brain. Mol Psychiatry. (2022) 27:865–72. doi: 10.1038/s41380–021-01298–5
37. Virtanen P, Gommers R, Oliphant TE, Haberland M, Reddy T, Cournapeau D, et al. SciPy 1.0: fundamental algorithms for scientific computing in Python. Nat Methods. (2020) 17:261–72. doi: 10.1038/s41592–019-0686–2
38. Seabold S, Perktold J. Statsmodels: Econometric and statistical modeling with python. SciPy. (2010) 7:1.
39. Waskom1 ML. seaborn: statistical data visualization. J Open Source Software. (2021) 6. doi: 10.21105/joss.03021
40. Mukaka MM. Statistics corner: A guide to appropriate use of correlation coefficient in medical research. Malawi Med J. (2012) 24:69–71.
41. Giannoccaro S, Ferraguto C, Petroni V, Marcelly C, Nogues X, Campuzano V, et al. Early neurobehavioral characterization of the CD mouse model of williams-beuren syndrome. Cells. (2023) 12:391. doi: 10.3390/cells12030391
42. Moy SS, Nikolova VD, Riddick NV, Baker LK, Koller BH. Preweaning sensorimotor deficits and adolescent hypersociability in Grin1 knockdown mice. Dev Neurosci. (2012) 34:159–73. doi: 10.1159/000337984
43. Barkus C, Feyder M, Graybeal C, Wright T, Wiedholz L, Izquierdo A, et al. Do GluA1 knockout mice exhibit behavioral abnormalities relevant to the negative or cognitive symptoms of schizophrenia and schizoaffective disorder? Neuropharmacology. (2012) 62:1263–72. doi: 10.1016/j.neuropharm.2011.06.005
44. Luessen DJ, Gallinger IM, Ferranti AS, Foster DJ, Melancon BJ, Lindsley CW, et al. mGlu(1)-mediated restoration of prefrontal cortex inhibitory signaling reverses social and cognitive deficits in an NMDA hypofunction model in mice. Neuropsychopharmacology. (2022) 47:1826–35. doi: 10.1038/s41386–022-01350–0
45. Carli M, Invernizzi RW. Serotoninergic and dopaminergic modulation of cortico-striatal circuit in executive and attention deficits induced by NMDA receptor hypofunction in the 5-choice serial reaction time task. Front Neural Circuits. (2014) 8:58. doi: 10.3389/fncir.2014.00058
46. Shindo T, Shikanai H, Watarai A, Hiraide S, Iizuka K, Izumi T. D-serine metabolism in the medial prefrontal cortex, but not the hippocampus, is involved in AD/HD-like behaviors in SHRSP/Ezo. Eur J Pharmacol. (2022) 923:174930. doi: 10.1016/j.ejphar.2022.174930
47. Brown JA, Ramikie TS, Schmidt MJ, Baldi R, Garbett K, Everheart MG, et al. Inhibition of parvalbumin-expressing interneurons results in complex behavioral changes. Mol Psychiatry. (2015) 20:1499–507. doi: 10.1038/mp.2014.192
48. Qin L, Liu W, Ma K, Wei J, Zhong P, Cho K, et al. The ADHD-linked human dopamine D4 receptor variant D4.7 induces over-suppression of NMDA receptor function in prefrontal cortex. Neurobiol Dis. (2016) 95:194–203. doi: 10.1016/j.nbd.2016.07.024
49. Balu DT, Presti KT, Huang CCY, Muszynski K, Radzishevsky I, Wolosker H, et al. Serine racemase and D-serine in the amygdala are dynamically involved in fear learning. Biol Psychiatry. (2018) 83:273–83. doi: 10.1016/j.biopsych.2017.08.012
50. Montani C, Canella C, Schwarz AJ, Li J, Gilmour G, Galbusera A, et al. The M1/M4 preferring muscarinic agonist xanomeline modulates functional connectivity and NMDAR antagonist-induced changes in the mouse brain. Neuropsychopharmacology. (2021) 46:1194–206. doi: 10.1038/s41386–020-00916–0
51. Kuchling J, Jurek B, Kents M, Kreye J, Geis C, Wickel J, et al. Impaired functional connectivity of the hippocampus in translational murine models of NMDA-receptor antibody associated neuropsychiatric pathology. Mol Psychiatry. (2023) 29:85–96. doi: 10.1038/s41380–023-02303–9
52. de la Salle S, Choueiry J, Shah D, Bowers H, McIntosh J, Ilivitsky V, et al. Resting-state functional EEG connectivity in salience and default mode networks and their relationship to dissociative symptoms during NMDA receptor antagonism. Pharmacol Biochem Behav. (2021) 201:173092. doi: 10.1016/j.pbb.2020.173092
53. Abram SV, Roach BJ, Fryer SL, Calhoun VD, Preda A, van Erp TGM, et al. Validation of ketamine as a pharmacological model of thalamic dysconnectivity across the illness course of schizophrenia. Mol Psychiatry. (2022) 27:2448–56. doi: 10.1038/s41380–022-01502–0
Keywords: D-serine, social novelty, cFos, adolescence, brain networks
Citation: Brown SE, Wang Z(Z), Newman EL, Engin E, Berretta S, Balu DT and Folorunso OO (2024) Serine racemase deletion alters adolescent social behavior and whole-brain cFos activation. Front. Psychiatry 15:1365231. doi: 10.3389/fpsyt.2024.1365231
Received: 04 January 2024; Accepted: 06 May 2024;
Published: 24 June 2024.
Edited by:
Giovanni Provenzano, University of Trento, ItalyReviewed by:
Barbara Gisabella, University of Mississippi Medical Center, United StatesCopyright © 2024 Brown, Wang, Newman, Engin, Berretta, Balu and Folorunso. This is an open-access article distributed under the terms of the Creative Commons Attribution License (CC BY). The use, distribution or reproduction in other forums is permitted, provided the original author(s) and the copyright owner(s) are credited and that the original publication in this journal is cited, in accordance with accepted academic practice. No use, distribution or reproduction is permitted which does not comply with these terms.
*Correspondence: Oluwarotimi O. Folorunso, b2ZvbG9ydW5zb0BtY2xlYW4uaGFydmFyZC5lZHU=
†Present address: Darrick T. Balu, Entheos Labs, Inc., Boston, MA, United States
Disclaimer: All claims expressed in this article are solely those of the authors and do not necessarily represent those of their affiliated organizations, or those of the publisher, the editors and the reviewers. Any product that may be evaluated in this article or claim that may be made by its manufacturer is not guaranteed or endorsed by the publisher.
Research integrity at Frontiers
Learn more about the work of our research integrity team to safeguard the quality of each article we publish.