 Fangwei Zhou
 Yan Yang†
 Guodong Yu
- Department of Otorhinolaryngology Head and Neck Surgery, Affiliated Hospital of Guizhou Medical University, Guiyang, China
Background: The causative relationship between chronic rhinosinusitis (CRS) and depression remains unclear. Herein we employed Mendelian randomization (MR) coupled with single-cell analysis to investigate the causality between CRS and depression.
Methods: Data pertaining to CRS and depression were mined from the genome-wide association study database, and a single-cell dataset was sourced from the literature. To explore causality, we conducted bidirectional MR analysis using MR-Egger, weighted median, inverse variance weighted (IVW), simple mode, and weighted mode, with IVW representing the most important method. Further, sensitivity analysis was performed to evaluate the robustness of MR analysis results. Candidate genes were analyzed via single-cell combined MR analysis.
Results: Forward MR analysis indicated depression as a risk factor for CRS when depression was the exposure factor and CRS was the outcome (OR = 1.425, P < 0.001). Reverse MR analysis revealed the same positive relationship between CRS and depression when CRS was the exposure factor and depression was the outcome (OR = 1.012, P = 0.038). Sensitivity analysis validated the robustness of bidirectional MR analysis results. Ten cell types (endothelial, ciliated, basal, myeloid, mast, apical, plasma, glandular, fibroblast, and T cells) were identified in the single-cell dataset. The network of receptor–ligand pairs showed that in normal samples, cell–cell interactions were present among various cell types, such as epithelial, mast, myeloid, and endothelial cells. In contrast, CRS samples featured only one specific receptor–ligand pair, confined to myeloid cells. TCF4 and MEF2C emerged as potentially crucial for CRS-associated depression development.
Conclusions: Our findings suggest a bidirectional causal relationship between CRS and depression, offering a new perspective on the association between CRS and depression.
1 Background
Chronic rhinosinusitis (CRS) is one of the most prevalent chronic nasal diseases characterized by prolonged inflammation of the nose and paranasal sinus, with symptoms persisting for more than 12 weeks (1). The main symptoms of CRS include nasal obstruction, nasal discharge, olfactory dysfunction, and facial pain/pressure (2). Furthermore, CRS is evidently associated with several non-sinonasal symptoms, including cognitive dysfunction, sleep dysfunction, and significantly low productivity levels (3). Its global prevalence is estimated to be >10%, with varying rates in different regions, such as approximately 5% in Canada, 7% in South Korea, 11% in Europe, 12% in the United States, and 13% in China (4, 5). The diagnosis of CRS is a comprehensive process, typically relying on clinical symptoms, imaging results, and nasal endoscopy, all evaluated using globally recognized criteria. Variations or broader diagnostic standards may result in disparities in the reported prevalence of CRS among various studies. The economic burden of CRS remains substantial, with direct costs ranging from 10 to 13 billion dollars annually and indirect costs exceeding 20 billion dollars (6). Some patients continue to experience symptoms despite optimal medical treatments and appropriate surgical interventions, which can be challenging. In such cases, subjective symptoms of sinusitis persist even when radiologic or endoscopic evidence suggests improvement, and these symptoms may be influenced by various factors, such as mental and physical capabilities (7).
A recent cohort study revealed a significant association between CRS and an increased risk of depression, indicating that patients with CRS are 1.51 times more likely to develop depression compared to the general population (8). Depression is a prevalent disorder that not only significantly affects patient quality of life and productivity but also amplifies the perceived burden of chronic illnesses. Moreover, depression can influence the degree of improvement achieved following surgical interventions (9). Notably, the coexistence of depression with other health conditions often heightens the risk of adverse health outcomes (10). Comorbid depression, unfortunately, frequently goes undiagnosed in patients with chronic disorders, including CRS. This could be attributed to the fact that healthcare providers primarily focused on treating the primary chronic condition might not give adequate attention to or recognize the significance of underlying depression. Accurate diagnosis of comorbid depression may also serve as an important prognostic indicator for CRS treatment outcomes. However, the precise relationship between depression and CRS is still largely unknown.
Mendelian randomization (MR) is a powerful tool to investigate causal associations by employing common genetic variants as unconfounded and unbiased proxies (11). Unlike observational studies, MR is a statistical approach that utilizes single nucleotide polymorphisms (SNPs), which remain independent of confounding factors due to the random allocation of alleles from parental to filial generations and the unidirectional flow from genotype to phenotype. These SNPs function as instrumental variables (IVs) to evaluate the causal relationship between an exposure and an outcome (12). Genome-wide association studies (GWAS) focused on diverse complex traits have emphasized that genetic variants are notably enriched in non-coding regions with cis-regulatory activities, and these regions are further enriched in expression quantitative trait loci (eQTL) (13). By combining genetic data with bulk RNA sequencing, downstream effects of genetic risk factors associated with diseases have been linked to eQTL (14). This novel analytical framework, which integrates eQTL and GWAS data, has been successful in determining gene expressions that are pleiotropically or potentially causally linked to different phenotypes. This approach holds promise as a prospective tool to explore genes with pleiotropic associations with complex traits (15).
Despite its relevance to various chronic disease processes, depression has not been thoroughly investigated as a risk factor for CRS. Considering the existing uncertainty regarding the causal relationship between depression and CRS, herein we first performed a bidirectional MR analysis that integrated GWAS data on depression and CRS to evaluate the causal relationship between these conditions. Besides, we performed single-cell analyses of CRS in conjunction with MR to investigate the role of SNPs in gene expression in a single-cell dataset. Our findings hold significant implications for enhancing our understanding of the causal relationship between depression and CRS. This knowledge can aid healthcare providers and policymakers in designing more effective treatment and management strategies for CRS.
2 Methods
2.1 Data source
We downloaded the finn-b-J10_CHRONSINUSITIS dataset for CRS, containing 16,380,288 SNPs from 176,373 samples, and the ieu-b-102 dataset for depression, containing 500,199 samples, from the IEU Open GWAS database (https://gwas.mrcieu.ac.uk/). A single-cell dataset for CRS was sourced from the literature (16).
2.2 Data pre-processing
Exposure factors were extracted and filtered using the “extract instruments” function of the TwoSampleMR package (17), with P < 5×10⁻⁸ for forward and P < 5×10⁻⁵ for reverse MR analyses. The initial analysis indicated that, using a strict threshold (P < 5×10⁻⁸), the number of IVs was exceedingly limited. Thus, we adopted a less restrictive threshold (P < 5×10⁻⁵) to acquire a broader range of IVs, striving for comprehensive outcomes. IVs in linkage disequilibrium were removed to ensure independence, with the criteria set at r2 = 0.001 and kb = 10000 for both forward and reverse MR analyses. We retained IVs with strong correlations with exposure factors. Three fundamental assumptions underlie MR studies (18): (1) a robust and noteworthy relationship between IVs and exposure; (2) IVs are unrelated to confounding factors; and (3) IVs exclusively influence outcomes through exposure, not through other channels.
2.3 Bidirectional MR analysis
Following IV filtering, we obtained input data for both forward and reverse MR analyses. We conducted bidirectional MR analysis using MR-Egger, weighted median, inverse variance weighted (IVW), simple mode, and weighted mode, with IVW being the most important method (19). For our analysis, odds ratio (OR) > 1 indicated a risk factor and OR < 1 indicated a protective factor. Scatter, forest, and funnel plots were used for result visualization.
2.4 Sensitivity assessment of bidirectional MR analysis
To assess the reliability of our forward and reverse MR analysis results, we performed sensitivity analysis. First, we conducted a heterogeneity test, with Q_pval > 0.05 indicating no heterogeneity. Next, we performed a horizontal pleiotropy test using the TwoSampleMR function “mr_pleiotropy_test” in R; P > 0.05 indicated no horizontal pleiotropy, implying no confounding factors. Finally, we implemented the leave-one-out (LOO) method by iteratively excluding each SNP. If the effect of the remaining SNPs on the outcome variable did not markedly change, it indicated the reliability of the MR analysis results.
2.5 Single-cell data analysis
Single-cell analysis was performed using the Seurat package on a single-cell dataset for CRS (with nasal polyps) (20). Before analyzing single-cell gene expression data, we first need to filter out low-quality cells. The purpose of filtering out low-quality cells is to ensure that counting errors do not affect downstream analysis. Cells with too small or too large libraries, or with excessively low or high feature expression levels, are inferred as low-quality cells. Such cells may correspond to dead cells, membrane-damaged cells, or doublets, which can affect downstream analysis. For example, this group of low-quality cells may cluster together and then influence our judgment of cell subpopulations. Low-quality cells typically have smaller libraries, and a normalization of the library size is usually performed before differential analysis. We initiated the analysis by performing quality control on library size and total gene count distribution. Subsequently, highly variable genes in the log-normalized data were retrieved using the “vst” method in the FindVariableFeatures function. Principal components (PCs) were then selected by downscaling analysis using the ScaleData function. Unsupervised cluster analysis of the filtered cells was then performed using the FindNeighbors and FindClusters functions, and the results were visualized using t-SNE and UMAP. We also explored marker cell expression for each cluster in the single-cell dataset and determined the cell type of each cluster. The number of cells and differentially expressed genes (DEGs) in normal and CRS samples were then counted. Cell communication and interactions were analyzed using CellPhoneDB.
2.6 Single-cell combined MR analysis
Phenotype-related candidate genes were identified based on single-cell eQTLs and SNPs associated with depression obtained from forward MR analysis. We collected genes with remarkable differences in expression across various cell types, and the expression patterns of these candidate genes were analyzed.
3 Results
3.1 Depression as a risk factor for CRS
We identified 49 SNPs as IVs (Supplementary Table S1). Subsequently, we performed forward MR analysis to determine the effect of depression on CRS, with depression being the exposure factor and CRS being the outcome. Our results demonstrated that depression (P < 0.001) had a causal association with CRS (Table 1) based on IVW, with OR of 1.425, signifying that depression was a risk factor for CRS. The scatter plot showed a positive slope for depression, revealing that depression led to increased risk of CRS (Figure 1A). The forest plot showed that all-IVW was on the right, which further supported depression as a risk factor for CRS (Figure 1B). Finally, the funnel plot revealed that MR conformed to Mendel’s second law of random grouping (Figure 1C).
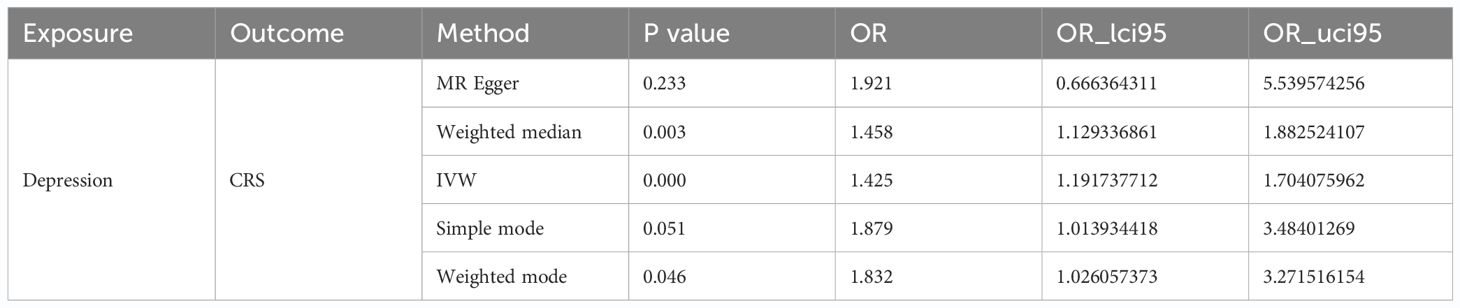
Table 1 Causal effects of depression on CRS.

Figure 1 Causal effects of depression on CRS. (A) Scatter plot illustrating the association between depression and CRS. (B) Forest plot showing the causal effects of depression-associated SNPs on CRS. (C) Funnel plot testing the significance of observed associations for heterogeneity. (D) Leave-one-out analysis evaluating the effect of each SNP on causality.
Sensitivity analysis was performed to determine the reliability of MR analysis results. The heterogeneity test yielded a Q_pval of 0.518, suggesting no heterogeneity among the samples (Table 2). Horizontal pleiotropy testing also indicated no horizontal pleiotropic effects (P = 0.578) between depression and CRS. Further, LOO analysis results were consistent with IVW analysis results, reinforcing the reliability of our findings (Figure 1D). In conclusion, depression was causally related to CRS development, with depression serving as a risk factor.
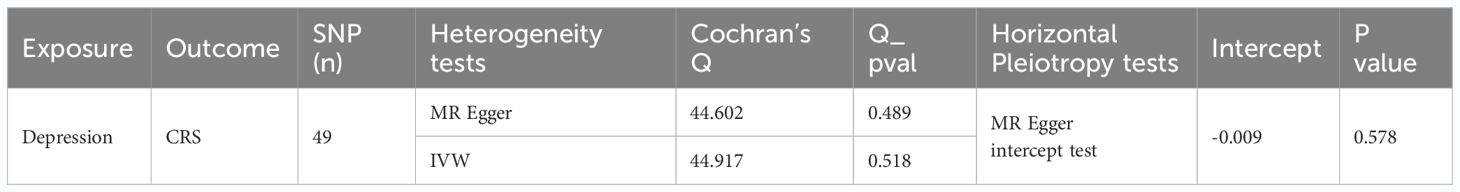
Table 2 Sensitivity analyses of the forward MR study.
3.2 CRS as a risk factor for depression
Following screening, we identified 117 SNPs as IVs (Supplementary Table S2). In reverse MR analysis, with CRS as the exposure factor and depression as the outcome, our results showed that CRS was a risk factor for depression (IVW: P = 0.038 and OR = 1.012) (Table 3). The scatter plot exhibited a positive IVW slope, indicating an increased risk of depression due to CRS (Figure 2A). The funnel plot showed that MR conformed to Mendel’s second law of random grouping (Figure 2B). The forest plot indicated that all-IVW was on the right, supporting CRS as risk factor for depression (Figure 2C).
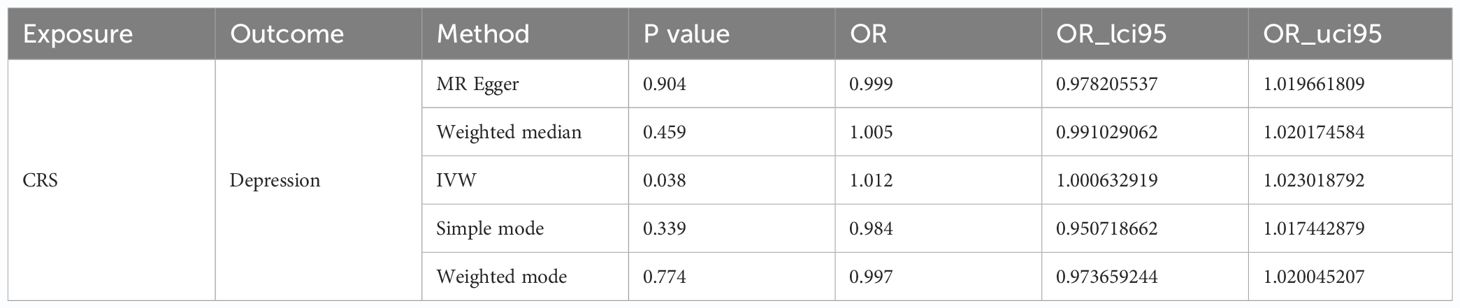
Table 3 Causal effects of CRS on depression.

Figure 2 Causal effects of CRS on depression. (A) Scatter plot illustrating the association between CRS and depression. (B) Funnel plot testing the significance of observed associations for heterogeneity. (C) Forest plot showing the causal effects of CRS-associated SNPs on depression. (D) Leave-one-out analysis evaluating the effect of each SNP on causality.
Sensitivity analysis for reverse MR also showed promising results. The heterogeneity test yielded a Q_pval of 0.076 and P for IVW was >0.05, indicating no heterogeneity among the samples (Table 4). Horizontal pleiotropy testing also indicated no horizontal pleiotropic effects between CRS and depression (P = 0.151). In addition, LOO analysis results verified that the results were reliable (Figure 2D). In summary, CRS was causally related to the occurrence of depression, with CRS leading to an increased risk of depression.
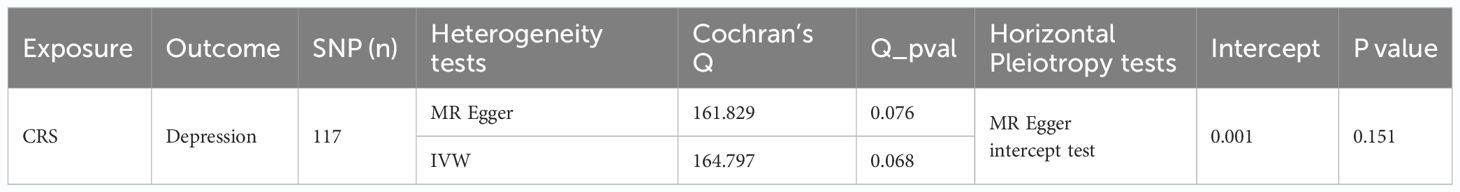
Table 4 Sensitivity analyses of the reverse MR study.
3.3 Identification of 10 cell types in normal and CRS samples
Figure 3 shows the characteristics of the single-cell dataset, such as distribution of library size, gene counts, and mitochondria percent. Overall, we identified 2,000 highly variable genes and selected 20 PCs for subsequent analyses (Figures 4, 5). Visualization through t-SNE and UMAP graphs revealed 26 cell clusters in the polyp and healthy samples (Figure 6). By evaluating marker gene expression in these clusters (Figure 7), we identified 10 cell types: endothelial, ciliated, basal, myeloid, mast, apical, plasma, glandular, fibroblast, and T cells (Figure 8). The levels of plasma, glandular, myeloid, mast, and T cells were significantly different between normal and CRS samples (Figure 8). We then conducted differential expression analysis to determine the number of significantly DEGs in these 10 cell types, as shown in Supplementary Table S3.

Figure 3 Distribution of library size and total number of genes. (A) Distribution of library size. (B) Distribution of library size, gene counts, mitochondria percent, and HB percent. (C) Distribution of UMI counts, gene counts, mitochondria percent, and HB percent in feature scatter.

Figure 4 Selection of genes with high variability. (A) Highly variable and (B) PCA-related genes (top9 dimensions).

Figure 5 Selection of genes with high variability. (A) Heatmap of PCA-related genes (top9 dimensions). (B) PCA results with elbow plot.

Figure 6 Clustering of cell groups. (A) Clustering map of cells (t-SNE). (B) Clustering map of cells (UMAP). (C) Clustering of cells between groups (t-SNE). (D) Clustering of cells between groups (UMAP).

Figure 7 Identification of each cluster cell type. (A) Heatmap of genes. (B) Clustering map of cells after naming (t-SNE). (C) Clustering map of cells after naming (UMAP).

Figure 8 Single-cell analysis of CRS. (A) Heatmap of genes. (B) Proportional bar chart of cells. (C) Proportional boxplot graph of cells. **P < 0.01, ns, no significance.
The normal samples exhibited a noteworthy presence of 18 specific receptor–ligand pairs, which mediated communication between 45 cell types (Supplementary Figure S1A). The network of receptor–ligand pairs between these various cell types in normal samples revealed a rich landscape of cell–cell interactions, involving various cell types, such as epithelial, mast, myeloid, and endothelial cells (Supplementary Figures S1B, C). In contrast, CRS samples featured only one specific receptor–ligand pair, confined to myeloid cells (Supplementary Figures S1D, E).
3.4 Single-cell combined MR analysis revealed 15 candidate genes with remarkable differences in various cell types
Leveraging the 49 SNPs associated with depression from forward MR analysis, we identified 121 phenotype-related candidate genes based on single-cell eQTLs and the GWAS database. These candidate genes were assessed for their expression across 10 cell types (Figure 9A). Fifteen of them exhibited significant differences in expression across more than five cell types (Figure 9B). TMEM258, NAA38, and EIF5 were expressed across almost all cell types, indicating limited cell specificity for these three genes. TCF4 was more highly expressed in endothelial cells in healthy samples and in fibroblasts in patient samples. MEF2C was more highly expressed in endothelial cells in healthy samples. These findings suggested that TCF4 and MEF2C might play a vital in development of CRS with depression.

Figure 9 Identification of key genes. (A) Upset map of differential genes. (B) Bubble map of candidate genes.
4 Discussion
The prevalence of depression among patients with CRS is high and considerably exceeds the level observed in the general population (21). The exact underlying mechanisms remain unknown. A myriad of non-sinonasal symptoms experienced by these patients, such as chronic pain, sleep dysfunction, frustration, cognitive impairment, and embarrassment, may contribute to the onset of depression (22). Similar to many chronic conditions, the loss of leisure time spent caring for CRS can be burdensome as well as expensive, leading to heightened anxiety and depression. Moreover, elevated systemic inflammatory cytokine levels seem to contribute to the development of depression. While treatment for comorbid depression may not directly affect the specific quality of life related to CRS, a holistic approach to managing related comorbidities can enhance overall patient care (23).
Most previous epidemiologic studies have employed a case-control design with a vague temporal sequence, making causal inferences difficult. Furthermore, previous observational studies have often struggled with avoiding the interference of confounding risk factors. In contrast, in this study, we leveraged MR methods to elucidate causality while mitigating bias (24, 25). MR analysis is a powerful tool for discerning potential causal relationships between various exposures (risk factors) and disease outcomes (26). Earlier MR analyses have suggested a causal relationship between depression and several chronic diseases, including inflammatory bowel disease, metabolic syndrome, atopic dermatitis, and type 2 diabetes mellitus (25–27).
To date, the causal relationship between CRS and psychiatric disorders remains poorly understood. It is unclear whether depression and anxiety exacerbate CRS symptoms or if these symptoms are a consequence of CRS. Herein we report robust evidence for a bidirectional causal relationship between CRS and depression. As research delves deeper into chronic inflammatory diseases, co-occurring psychiatric disorders are increasingly recognized. A dynamic link is believed to exist between chronic inflammatory diseases and psychiatric disorders, with respiratory inflammation potentially originating at the site of the disease and gradually spreading to other areas (e.g., the central nervous system) (28). Nasal congestion, runny nose, and mucosal lesions are reportedly more severe in CRS patients with comorbid depression than in those without depression (29). This could be because severe nasal symptoms can induce adverse emotional experiences, such as discomfort and lowered self-esteem (30), which can eventually lead to depression. In addition, the nasal congestion or runny nose phenomena involve crucial central mechanisms that merit consideration. These mechanisms are finely tuned by trigeminal autonomic reflexes, whose significance becomes evident, for instance, in specific primary headache disorders (31). Such disorders, interestingly, bear a strong correlation with depression (32). Furthermore, depression can lead to immune dysfunction, causing an increase in inflammatory cytokines in peripheral blood, which may serve as a potential factor contributing to the onset of CRS. However, the specific mechanism behind this remains to be further explored.
Herein our single-cell combined MR analysis led to the identification of two novel genes that may be associated with CRS-associated depression. TCF4 is a basic helix-loop-helix transcription factor involved in early neuronal differentiation, cognitive functions, and immune responses in the brain (33). TCF4 has been associated with several psychiatric conditions, such as major depressive disorder, schizophrenia, and autism spectrum disorders. Further, its expression at the mRNA and protein levels evidently plays a key role in the pathogenic mechanism of recurrent depression (34). MEF2C is a critical member of the myocyte enhancer factor family, integral to early brain development as well as to neuronal development and electrical activity (35). Mutations or dysfunctions in MEF2C have been reported to cause, for example, autism-like symptoms, intellectual deficits, and epilepsy (36). The association between MEF2C and cognitive disorders is extremely similar to the role of MEF2C in autism spectrum disorders and Alzheimer’s disease (37). At present, no study has reported on TCF4 and MEF2C in CRS-related research. We aim to conduct further investigations to comprehensively explore the role of TCF4B and MEF2C in CRS-associated depression.
This study has several strengths. It represents the first bidirectional MR analysis exploring the causal relationship between depression and CRS. Our study design is the closest approximation to a randomized controlled trial, ensuring random allocation based on genotype. By avoiding the limitations of conventional observational studies, such as confounding factors and reverse causality, MR analysis offers a more accurate assessment of causality. Further, we leveraged large sample sizes from the included studies as well as IVs closely related to depression. MR-Egger analysis suggested that all observed causal relationships were unaffected by directional pleiotropy. We also performed sensitivity analyses to determine the impact of pleiotropy on causality estimates, and our results remained robust throughout these various tests.
Some limitations should also be acknowledged. First, all participants included in this study were from Europe, necessitating further research to confirm the generalizability of our findings to other populations. Second, although MR analysis has been demonstrated to be a powerful approach to evaluate causality, its results require validation through additional studies incorporating experimental evidence. Finally, data related to CRS subtypes, disease severity, and comorbidities were not available in the utilized databases, limiting our exploration of factors influencing depression in CRS. CRS manifests in diverse phenotypes that exhibit distinct biological characteristics. Specifically, type 2 CRS (characterized by the presence of polyps) differs significantly from non-type 2 CRS in terms of its immune mechanisms and underlying genetic factors (38). That limits the application of the results presented in this study, especially in regard to cells lines analysis (only CRS with polyps included).
5 Conclusions
To summarize, our MR analysis revealed a bidirectional causal relationship between depression and CRS. TCF4 and MEF2C are potential therapeutic targets for CRS with depression. Further studies are warranted to validate our findings. Future evidence from more randomized controlled trials and basic experimental studies can further enhance our understanding of the role of depression in CRS prevention and treatment.
Data availability statement
The original contributions presented in the study are included in the article/Supplementary Material. Further inquiries can be directed to the corresponding authors.
Author contributions
FZ: Writing – original draft, Methodology, Formal Analysis, Data curation, Conceptualization. YY: Writing – original draft, Software, Investigation, Formal Analysis, Data curation. JL: Writing – original draft, Supervision, Software. YJ: Writing – original draft, Software, Methodology, Investigation. TZ: Writing – review & editing, Visualization, Validation, Supervision, Resources, Project administration, Conceptualization. GY: Writing – review & editing, Visualization, Validation, Supervision, Resources, Project administration, Funding acquisition.
Funding
The author(s) declare financial support was received for the research, authorship, and/or publication of this article. This work was supported by the National Natural Science Foundation of China (No. 82260219), the Guizhou Provincial Science and Technology Projects (QKHJC-ZK [2023]YB365), the Doctoral Research Start-up Fund Project of the Affiliated Hospital of Guizhou Medical University (gyfybsky-2022-19), the National Natural Science Foundation Cultivation Project of Affiliated Hospital of Guizhou Medical University (gyfynsfc-2021-31), and the Science and Technology Fund project of Guizhou Provincial Health Commission (gzwkj2022-155 and gzwkj2022-157).
Conflict of interest
The authors declare that the research was conducted in the absence of any commercial or financial relationships that could be construed as a potential conflict of interest.
Publisher’s note
All claims expressed in this article are solely those of the authors and do not necessarily represent those of their affiliated organizations, or those of the publisher, the editors and the reviewers. Any product that may be evaluated in this article, or claim that may be made by its manufacturer, is not guaranteed or endorsed by the publisher.
Supplementary material
The Supplementary Material for this article can be found online at: https://www.frontiersin.org/articles/10.3389/fpsyt.2024.1342376/full#supplementary-material
References
1. Fokkens WJ, Lund VJ, Hopkins C, Hellings PW, Kern R, Reitsma S, et al. European position paper on rhinosinusitis and nasal polyps 2020. Rhinology. (2020) 58:1–464. doi: 10.4193/Rhin
2. Fokkens WJ, Viskens AS, Backer V, Conti D, De Corso E, Gevaert P, et al. EPOS/EUFOREA update on indication and evaluation of Biologics in Chronic Rhinosinusitis with Nasal Polyps 2023. Rhinology. (2023) 61:194–202. doi: 10.4193/Rhin
3. Adams KN, Schuman TA, Ebert CS, You W, Tomoum MO, Senior BA. Self-reported anxiety and depression unchanged after endoscopic sinus surgery for chronic rhinosinusitis. Rhinology. (2018) 56:234–40. doi: 10.4193/Rhin
4. Chen F, Liu L, Wang Y, Hu K, Ma B, Chi J. Prevalence of depression and anxiety in patients with chronic rhinosinusitis: A systematic review and meta-analysis. Otolaryngol Head Neck Surg. (2023) 168:143–53. doi: 10.1177/01945998221082538
5. Albu S. Chronic rhinosinusitis-an update on epidemiology, pathogenesis and management. J Clin Med. (2020) 9:2285. doi: 10.3390/jcm9072285
6. Rudmik L, Smith TL, Schlosser RJ, Hwang PH, Mace JC, Soler ZM. Productivity costs in patients with refractory chronic rhinosinusitis. Laryngoscope. (2014) 124:2007–12. doi: 10.1002/lary.24630
7. Bhattacharyya N. Contemporary assessment of the disease burden of sinusitis. Am J Rhinol Allergy. (2009) 23:392–5. doi: 10.2500/ajra.2009.23.3355a
8. Le PT, Soler ZM, Jones R, Mattos JL, Nguyen SA, Schlosser RJ. Systematic review and meta-analysis of SNOT-22 outcomes after surgery for chronic rhinosinusitis with nasal polyposis. Otolaryngol Head Neck Surg. (2018) 159:414–23. doi: 10.1177/0194599818773065
9. Wasan A, Fernandez E, Jamison RN, Bhattacharyya N. Association of anxiety and depression with reported disease severity in patients undergoing evaluation for chronic rhinosinusitis. Ann Otol Rhinol Laryngol. (2007) 116:491–7. doi: 10.1177/000348940711600703
10. van der Zwaan GL, van Dijk SEM, Adriaanse MC, van Marwijk HWJ, van Tulder MW, Pols AD, et al. Diagnostic accuracy of the Patient Health Questionnaire-9 for assessment of depression in type II diabetes mellitus and/or coronary heart disease in primary care. J Affect Disord. (2016) 190:68–74. doi: 10.1016/j.jad.2015.09.045
11. Wang R. Mendelian randomization study updates the effect of 25-hydroxyvitamin D levels on the risk of multiple sclerosis. J Transl Med. (2022) 20:3. doi: 10.1186/s12967-021-03205-6
12. Gu Y, Jin Q, Hu J, Wang X, Yu W, Wang Z, et al. Causality of genetically determined metabolites and metabolic pathways on osteoarthritis: a two-sample mendelian randomization study. J Transl Med. (2023) 21:357. doi: 10.1186/s12967-023-04165-9
13. Chen Y, Xu X, Wang L, Li K, Sun Y, Xiao L, et al. Genetic insights into therapeutic targets for aortic aneurysms: A Mendelian randomization study. EBioMedicine. (2022) 83:104199. doi: 10.1016/j.ebiom.2022.104199
14. Yazar S, Alquicira-Hernandez J, Wing K, Senabouth A, Gordon MG, Andersen S, et al. Single-cell eQTL mapping identifies cell type-specific genetic control of autoimmune disease. Science. (2022) 376:3041. doi: 10.1126/science.abf3041
15. Sallam A, Eltaher S, Alqudah AM, Belamkar V, Baenziger PS. Combined GWAS and QTL mapping revealed candidate genes and SNP network controlling recovery and tolerance traits associated with drought tolerance in seedling winter wheat. Genomics. (2022) 114:110358. doi: 10.1016/j.ygeno.2022.110358
16. Ordovas-Montanes J, Dwyer DF, Nyquist SK, Buchheit KM, Vukovic M, Deb C, et al. Allergic inflammatory memory in human respiratory epithelial progenitor cells. Nature. (2018) 560:649–54. doi: 10.1038/s41586-018-0449-8
17. Xia K, Wang Y, Zhang L, Tang L, Zhang G, Huang T, et al. Dietary-derived essential nutrients and amyotrophic lateral sclerosis: A two-sample mendelian randomization study. Nutrients. (2022) 14:920. doi: 10.3390/nu14050920
18. Skrivankova VW, Richmond RC, Woolf BAR, Yarmolinsky J, Davies NM, Swanson SA, et al. Strengthening the reporting of observational studies in epidemiology using mendelian randomization: the STROBE-MR statement. JAMA. (2021) 326:1614–21. doi: 10.1001/jama.2021.18236
19. Pongdee T, Bielinski SJ, Decker PA, Kita H, Larson NB. White blood cells and chronic rhinosinusitis: a Mendelian randomization study. Allergy Asthma Clin Immunol. (2022) 18:98. doi: 10.1186/s13223-022-00739-2
20. Stuart T, Butler A, Hoffman P, Hafemeister C, Papalexi E, Mauck WM, et al. Comprehensive integration of single-cell data. Cell. (2019) 177:1888–902. doi: 10.1016/j.cell.2019.05.031
21. Kim JY, Ko I, Kim MS, Yu MS, Cho BJ, Kim DK. Association of chronic rhinosinusitis with depression and anxiety in a nationwide insurance population. JAMA Otolaryngol Head Neck Surg. (2019) 145:313–9. doi: 10.1001/jamaoto.2018.4103
22. Campbell AP, Phillips KM, Hoehle LP, Feng AL, Bergmark RW, Caradonna DS, et al. Depression symptoms and lost productivity in chronic rhinosinusitis. Ann Allergy Asthma Immunol. (2017) 118:286–9. doi: 10.1016/j.anai.2016.12.012
23. Smith KA, Alt JA. The relationship of chronic rhinosinusitis and depression. Curr Opin Otolaryngol Head Neck Surg. (2020) 28:1–5. doi: 10.1097/MOO.0000000000000595
24. Hartwig FP, Borges MC, Horta BL, Bowden J, Davey Smith G. Inflammatory biomarkers and risk of schizophrenia: A 2-sample mendelian randomization study. JAMA Psychiatry. (2017) 74:1226–33. doi: 10.1001/jamapsychiatry.2017.3191
25. Zhang M, Chen J, Yin Z, Wang L, Peng L. The association between depression and metabolic syndrome and its components: a bidirectional two-sample Mendelian randomization study. Transl Psychiatry. (2021) 11:633. doi: 10.1038/s41398-021-01759-z
26. Luo J, Xu Z, Noordam R, van Heemst D, Li-Gao R. Depression and inflammatory bowel disease: A bidirectional two-sample mendelian randomization study. J Crohns Colitis. (2022) 16:633–42. doi: 10.1093/ecco-jcc/jjab191
27. Maina JG, Balkhiyarova Z, Nouwen A, Pupko I, Ulrich A, Boissel M, et al. Bidirectional mendelian randomization and multiphenotype GWAS show causality and shared pathophysiology between depression and type 2 diabetes. Diabetes Care. (2023) 46:1707–14. doi: 10.2337/dc22-2373
28. Lin EY, Xi W, Aggarwal N, Shinohara ML. Osteopontin (OPN)/SPP1: from its biochemistry to biological functions in the innate immune system and the central nervous system (CNS). Int Immunol. (2023) 35:171–80. doi: 10.1093/intimm/dxac060
29. Phillips KM, Sedaghat AR. Depression and anxiety: considerations for interpretation of the SNOT-22 (22-item sinonasal outcome test). Otolaryngol Head Neck Surg. (2022) 166:985–92. doi: 10.1177/01945998211059732
30. Kim JY, Ko I, Kim MS, Kim DW, Cho BJ, Kim DK. Relationship of chronic rhinosinusitis with asthma, myocardial infarction, stroke, anxiety, and depression. J Allergy Clin Immunol Pract. (2020) 8:721–7. doi: 10.1016/j.jaip.2019.09.001
31. Straburzyński M, Gryglas-Dworak A, Nowaczewska M, Brożek-Mądry E, Martelletti P. Etiology of ‘Sinus headache’-moving the focus from rhinology to neurology. A systematic review. Brain Sci. (2021) 11:79. doi: 10.3390/brainsci11010079
32. Waliszewska-Prosół M, Straburzyński M, Czapińska-Ciepiela EK, Nowaczewska M, Gryglas-Dworak A, Budrewicz S. Migraine symptoms, healthcare resources utilization and disease burden in a large Polish migraine cohort: Results from ‘Migraine in Poland’-a nationwide cross-sectional survey. J Headache Pain. (2023) 24:40. doi: 10.1186/s10194-023-01575-4
33. Li H, Zhu Y, Morozov YM, Chen X, Page SC, Rannals MD, et al. Disruption of TCF4 regulatory networks leads to abnormal cortical development and mental disabilities. Mol Psychiatry. (2019) 24:1235–46. doi: 10.1038/s41380-019-0353-0
34. Mossakowska-Wójcik J, Orzechowska A, Talarowska M, Szemraj J, Gałecki P. The importance of TCF4 gene in the etiology of recurrent depressive disorders. Prog Neuropsychopharmacol Biol Psychiatry. (2018) 80:304–8. doi: 10.1016/j.pnpbp.2017.03.014
35. Zhang Z, Zhao Y. Progress on the roles of MEF2C in neuropsychiatric diseases. Mol Brain. (2022) 15:8. doi: 10.1186/s13041-021-00892-6
36. Borlot F, Whitney R, Cohn RD, Weiss SK. MEF2C-related epilepsy: Delineating the phenotypic spectrum from a novel mutation and literature review. Seizure. (2019) 67:86–90. doi: 10.1016/j.seizure.2019.03.015
37. Tansey KE, Cameron D, Hill MJ. Genetic risk for Alzheimer’s disease is concentrated in specific macrophage and microglial transcriptional networks. Genome Med. (2018) 10:14. doi: 10.1186/s13073-018-0523-8
Keywords: chronic rhinosinusitis, depression, causality, Mendelian randomization, single-cell
Citation: Zhou F, Yang Y, Li J, Jin Y, Zhang T and Yu G (2024) Mendelian randomization and single-cell expression analyses identify the causal relationship between depression and chronic rhinosinusitis. Front. Psychiatry 15:1342376. doi: 10.3389/fpsyt.2024.1342376
Received: 27 November 2023; Accepted: 25 April 2024;
Published: 16 May 2024.
Edited by:
Marta Waliszewska-Prosół, Wroclaw Medical University, PolandReviewed by:
Marcin Straburzyński, University of Warmia and Mazury in Olsztyn, PolandUrs Heilbronner, LMU Munich University Hospital, Germany
Copyright © 2024 Zhou, Yang, Li, Jin, Zhang and Yu. This is an open-access article distributed under the terms of the Creative Commons Attribution License (CC BY). The use, distribution or reproduction in other forums is permitted, provided the original author(s) and the copyright owner(s) are credited and that the original publication in this journal is cited, in accordance with accepted academic practice. No use, distribution or reproduction is permitted which does not comply with these terms.
*Correspondence: Tian Zhang, ZW50emhhbmd0aWFuQDEyNi5jb20=; Guodong Yu, ZW50eWdkQDEyNi5jb20=
†These authors have contributed equally to this work
‡ORCID: Tian Zhang, orcid.org/0009-0003-1150-3842
Guodong Yu, orcid.org/0000-0001-9864-1313