- 1Sierra Pacific Mental Illness, Research, Education, and Clinical Center, Veterans Administration Palo Alto Health Care System, Palo Alto, CA, United States
- 2Department of Psychiatry and Behavioral Sciences, Stanford University, Palo Alto, CA, United States
- 3Shiley-Marcos School of Engineering, University of San Diego, San Diego, CA, United States
- 4Department of Psychology, San Jose State University, San Jose, CA, United States
- 5Department of Psychology, Bar-Ilan University, Ramat Gan, Israel
- 6Department of Biochemistry, University of Tennessee at Chattanooga, Chattanooga, TN, United States
- 7School of Psychology, The University of Queensland, Brisbane, QLD, Australia
Background: The COVID-19 pandemic has been associated with increased rates of mental health problems, particularly in younger people.
Objective: We quantified mental health of online workers before and during the COVID-19 pandemic, and cognition during the early stages of the pandemic in 2020. A pre-registered data analysis plan was completed, testing the following three hypotheses: reward-related behaviors will remain intact as age increases; cognitive performance will decline with age; mood symptoms will worsen during the pandemic compared to before. We also conducted exploratory analyses including Bayesian computational modeling of latent cognitive parameters.
Methods: Self-report depression (Patient Health Questionnaire 8) and anxiety (General Anxiety Disorder 7) prevalence were compared from two samples of Amazon Mechanical Turk (MTurk) workers ages 18–76: pre-COVID 2018 (N = 799) and peri-COVID 2020 (N = 233). The peri-COVID sample also completed a browser-based neurocognitive test battery.
Results: We found support for two out of three pre-registered hypotheses. Notably our hypothesis that mental health symptoms would increase in the peri-COVID sample compared to pre-COVID sample was not supported: both groups reported high mental health burden, especially younger online workers. Higher mental health symptoms were associated with negative impacts on cognitive performance (speed/accuracy tradeoffs) in the peri-COVID sample. We found support for two hypotheses: reaction time slows down with age in two of three attention tasks tested, whereas reward function and accuracy appear to be preserved with age.
Conclusion: This study identified high mental health burden, particularly in younger online workers, and associated negative impacts on cognitive function.
Introduction
The global COVID-19 pandemic has had significant impacts on mental health. However, not all groups of people have been equally impacted. Younger people have reported higher rates of depression and anxiety (1, 2), substance abuse (3–5), and suicidality (3) since the beginning of the pandemic (6). Conversely, older adults have shown resilience in several large studies (2, 6–12). In this manuscript, we report results from a pre-registered study (13) of mental health and cognitive function in a diverse sample of online workers, collected before and during the COVID-19 pandemic. We show that there are significant disparities in mental health outcomes based on group demographics and extend previous work (14) by linking mental health symptoms to cognitive performance.
It is well established that in healthy people, mental health generally improves with age. This is often attributed to increased perception of control (15, 16), and attention toward positive stimuli toward the end of life, known as socioemotional selectivity theory (17, 18). This positivity effect reflects healthy engagement of pleasure and reward pathways in the brain. The integrity of these corticostriatal dopaminergic networks is essential for maintaining good mental health (19, 20). Indeed, even throughout the COVID-19 pandemic, older adults from multiple countries were at greater risk of contracting the virus, but generally have been found to have stable mental health and general wellbeing (1, 2, 7). Younger people have shown the opposite pattern (9, 11, 12). However, impacts of the pandemic on cognitive functioning in online workers remains under-characterized.
Understanding the mental health and cognitive status of the growing online workforce is timely, especially under persistent pandemic conditions necessitating wide adoption of long-term, work-from-home accommodations. Cognitive impairments are a symptom of depression (21) and neurodegenerative diseases such as dementia (22). Better understanding the cognitive performance of people working from home, in a cohort that ranges in age from 18 to 80, can aid in understanding the relationship between mood and cognition across the lifespan. For example, higher depression symptoms are associated with accelerated brain aging in mid-life, which is predictive of subsequent dementia diagnosis in later life (23, 24). Therefore, better understanding of mood-cognition relationships in a wide age range has relevance for brain health throughout the lifespan.
We preregistered our data collection and analysis plan to promote transparency, replicability, and reduce statistical degrees of freedom (13). The measures included self-report symptoms of anxiety (25), depression (26, 27), and wellbeing (28), as well as a short online neurocognitive task battery (see Study Design). Pre-registered hypotheses included the following: Hypothesis 1; reward-related behaviors will remain intact as age increases, specifically, consistently preferring immediate over delayed rewards in the Delay Discounting task (29–31), Hypothesis 2; cognition is hypothesized to decline with age, specifically resulting in slower performance on the Flanker (32–35), Visual Search (32–35), and Simon tasks (36–39), Hypothesis 3; depression (26, 27) and anxiety (25) symptoms will be higher for participants whose data is collected during the COVID-19 pandemic relative to a pre-pandemic baseline sample. We also report exploratory analyses linking latent cognitive variables to depression and anxiety symptoms.
Materials and methods
Preregistration
We designed our study in 2019 and preregistered the methods and hypotheses early in the COVID-19 pandemic. A pilot sample of n = 30 was collected, prior to preregistration using the Open Science Framework in March 2020 (13) to ascertain feasibility, quality check the data collection procedures, and assess attrition rates across the data collection platforms. Hypothesis testing for main effects of task conditions (manipulation check), and main effects of age on accuracy (validity check), were conducted with the pilot sample. The pilot data quality was found to meet criteria and was included in subsequent analyses.
H1: Reward-related behaviors will remain intact as age increases (i.e., no effect of age), including consistently preferring immediate over delayed rewards in the Delay Discounting task (29–31).
H2: Cognition is hypothesized to decline with age, specifically resulting in slower performance on the Flanker (32–35), Visual Search (32–35), and Simons tasks (36–38).
H3: Depression (26) and anxiety (25) symptoms will be higher for participants whose data is collected during the COVID-19 pandemic relative to a pre-pandemic comparison sample (14). The samples will be age-matched for 30 years and older to test this hypothesis.
Instruments
Mental and physical health measures
The Patient Health Questionnaire-8 (PHQ8) (26) was given to the 2018 sample, and the Patient Health Questionnaire-9 (PHQ9) (27) was given to the 2020 sample. Both are clinical measures of self-reported depression symptoms on a 4-point Likert scale from 0 (not at all) to 3 (nearly every day). Item nine assesses suicidality and is not included in the PHQ8 version. For direct cohort comparisons, we use PHQ8 scoring in both groups. For analyses with only the 2020 cohort, we use PHQ9 scoring. The scores are highly correlated (r (212) = 1, p < 0.001), similar to past study findings (40–42). The Generalized Anxiety Disorder-7 (GAD7) (25) is a clinical measure of seven anxiety symptoms on a 4-point Likert scale from 0 (not at all) to 3 (nearly every day). Both versions of the PHQ and the GAD7 have been normed with clinical samples (25, 27). The total scores quantify symptom severity, with above five representing elevated symptoms, and above ten indicating clinically relevant severity (25, 27). In this study, we refer to scores of 5 and above as suprathreshold, and scores of 4 and below as subthreshold.
As specified in our pre-registration, we choose to characterize mood symptoms continuously rather than dichotomizing the data into normal control group versus mental health group, in order to improve detection power and to allow the data to reflect the naturally occurring distribution in the recruited sample of online workers.
Neurocognitive tasks
Delay discounting
Delay discounting (DD) is the decline in the present value of a reward with delay to its receipt. The DD procedure is widely used to study impulsivity across a range of populations and reward types (29–31, 43). It was chosen here due to its brevity as a behavioral measure of reward preferences, in order to test one of the key tenets of socioemotional selectivity theory (17): reward related behaviors do not decline with age. Impulsivity is operationalized as preferring immediate but smaller monetary rewards over delayed but larger monetary rewards. Participants were presented with 27 trials and chose either an immediate but smaller monetary reward (“Receive $20 now”) or a delayed but larger monetary reward (“Receive $55 in 7 days”). Responses were scored using an Excel-based, automatic, Monetary Choice Questionnaire Scorer (MCQ) which summarized multiple transformations of the K parameter (overall K, small, medium, large, and composite K), discount rates, consistency scores, and proportion measures for each participant (44). The possible range of K is 0 to infinity. Smaller K-values indicate a lack of discounting and a general preference for delayed rewards, whereas the larger values indicate heavy discounting and a preference for immediate rewards (i.e., higher impulsivity).
Simon task
The Simon task (36–38) presented the words “Left” and “Right” on the left and right sides of the screen, with the word either matching the position (e.g., “left” on left side; 20 congruent trials) or mismatching (e.g., “left” on the right side; 16 incongruent trials). Large black text was presented on a white background with a black fixation cross (600 ms) between trials. Trial order was randomized. We assessed reaction time, errors, and the effect of condition (congruent vs. incongruent).
Flanker
The Flanker task (32–35) involved a row of five cartoon, orange fish as stimuli against a white background. Participants were asked to watch the middle fish and hit the “F” key for swimming left, and “J” key for swimming right. The four fish surrounding the target were facing in the same direction as the target (congruent; 24 trials) or in the opposite direction (incongruent; 24 trials). A black fixation cross against a white background was presented for 400, 800, or 1,200 ms in between trials. Trial order was randomized, and four practice trials were given at the start. We assessed reaction time, errors, and the effect of condition (congruent vs. incongruent).
Visual search
The visual search task (32–35) required participants to locate an orange “L” among arrays of 9 to 15 distractors including orange and blue letters (“F” and “L”). The blue and orange letters were presented in large font against a white background, with a black fixation cross between trials (800 ms). Participants were instructed to press “F” if the orange “L” is present (15 trials), and press “J” if the orange “L” is absent (9 trials). Trial order was randomized. We assessed reaction time, errors, and the effect of task condition.
Remote data collection environment
Both samples completed REDCap surveys (45, 46), and the 2020 sample completed a custom task battery in Gorilla Experiment Builder (47) for browser-deployed cognitive testing. Participants first completed screening questions, followed by self-report measures for anxiety (25), depression (26, 27), general physical health (48, 49), and wellness (28) using REDCap (45, 46). Then, they were linked to a cognitive task battery in Gorilla (47) assessing the following domains: impulsivity (29), reward sensitivity (29), and visuospatial attention and interference (32, 35, 38). Participants responded to stimuli presented in a web browser and used keyboard responses. A narrative form catch question along with preregistered accuracy cutoffs were used to identify low quality data from participants (e.g., lack of English proficiency, bot auto-completers, or repeaters). The study took approximately 45 min to complete and was designed to be completed only once (participants who completed more than once were removed from analysis).
Samples
Participants (N = 233) were recruited using Amazon MTurk (50) during a 4-week data collection period in Summer 2020. All participants were 18+, fluent in English, and had enough visual ability to complete the informed consent process and follow study instructions. Procedures and inclusion criteria match what were done for the comparison sample in 2018 (N = 799) (14). Our samples’ demographics (Figures 1–3) appear to resemble those found in other MTurk samples (51, 52). In a recent study, MTurk workers’ (N = 2,295) household income and household size were found to mirror the general population rates (52). Additionally, most people report MTurk income as paid leisure (56%) or a part-time job (37%), with almost 70% reporting that the income is used for non-essential expenses (52). Finally, 15% of workers reported having a disability, which is about half the amount of the general population (52).
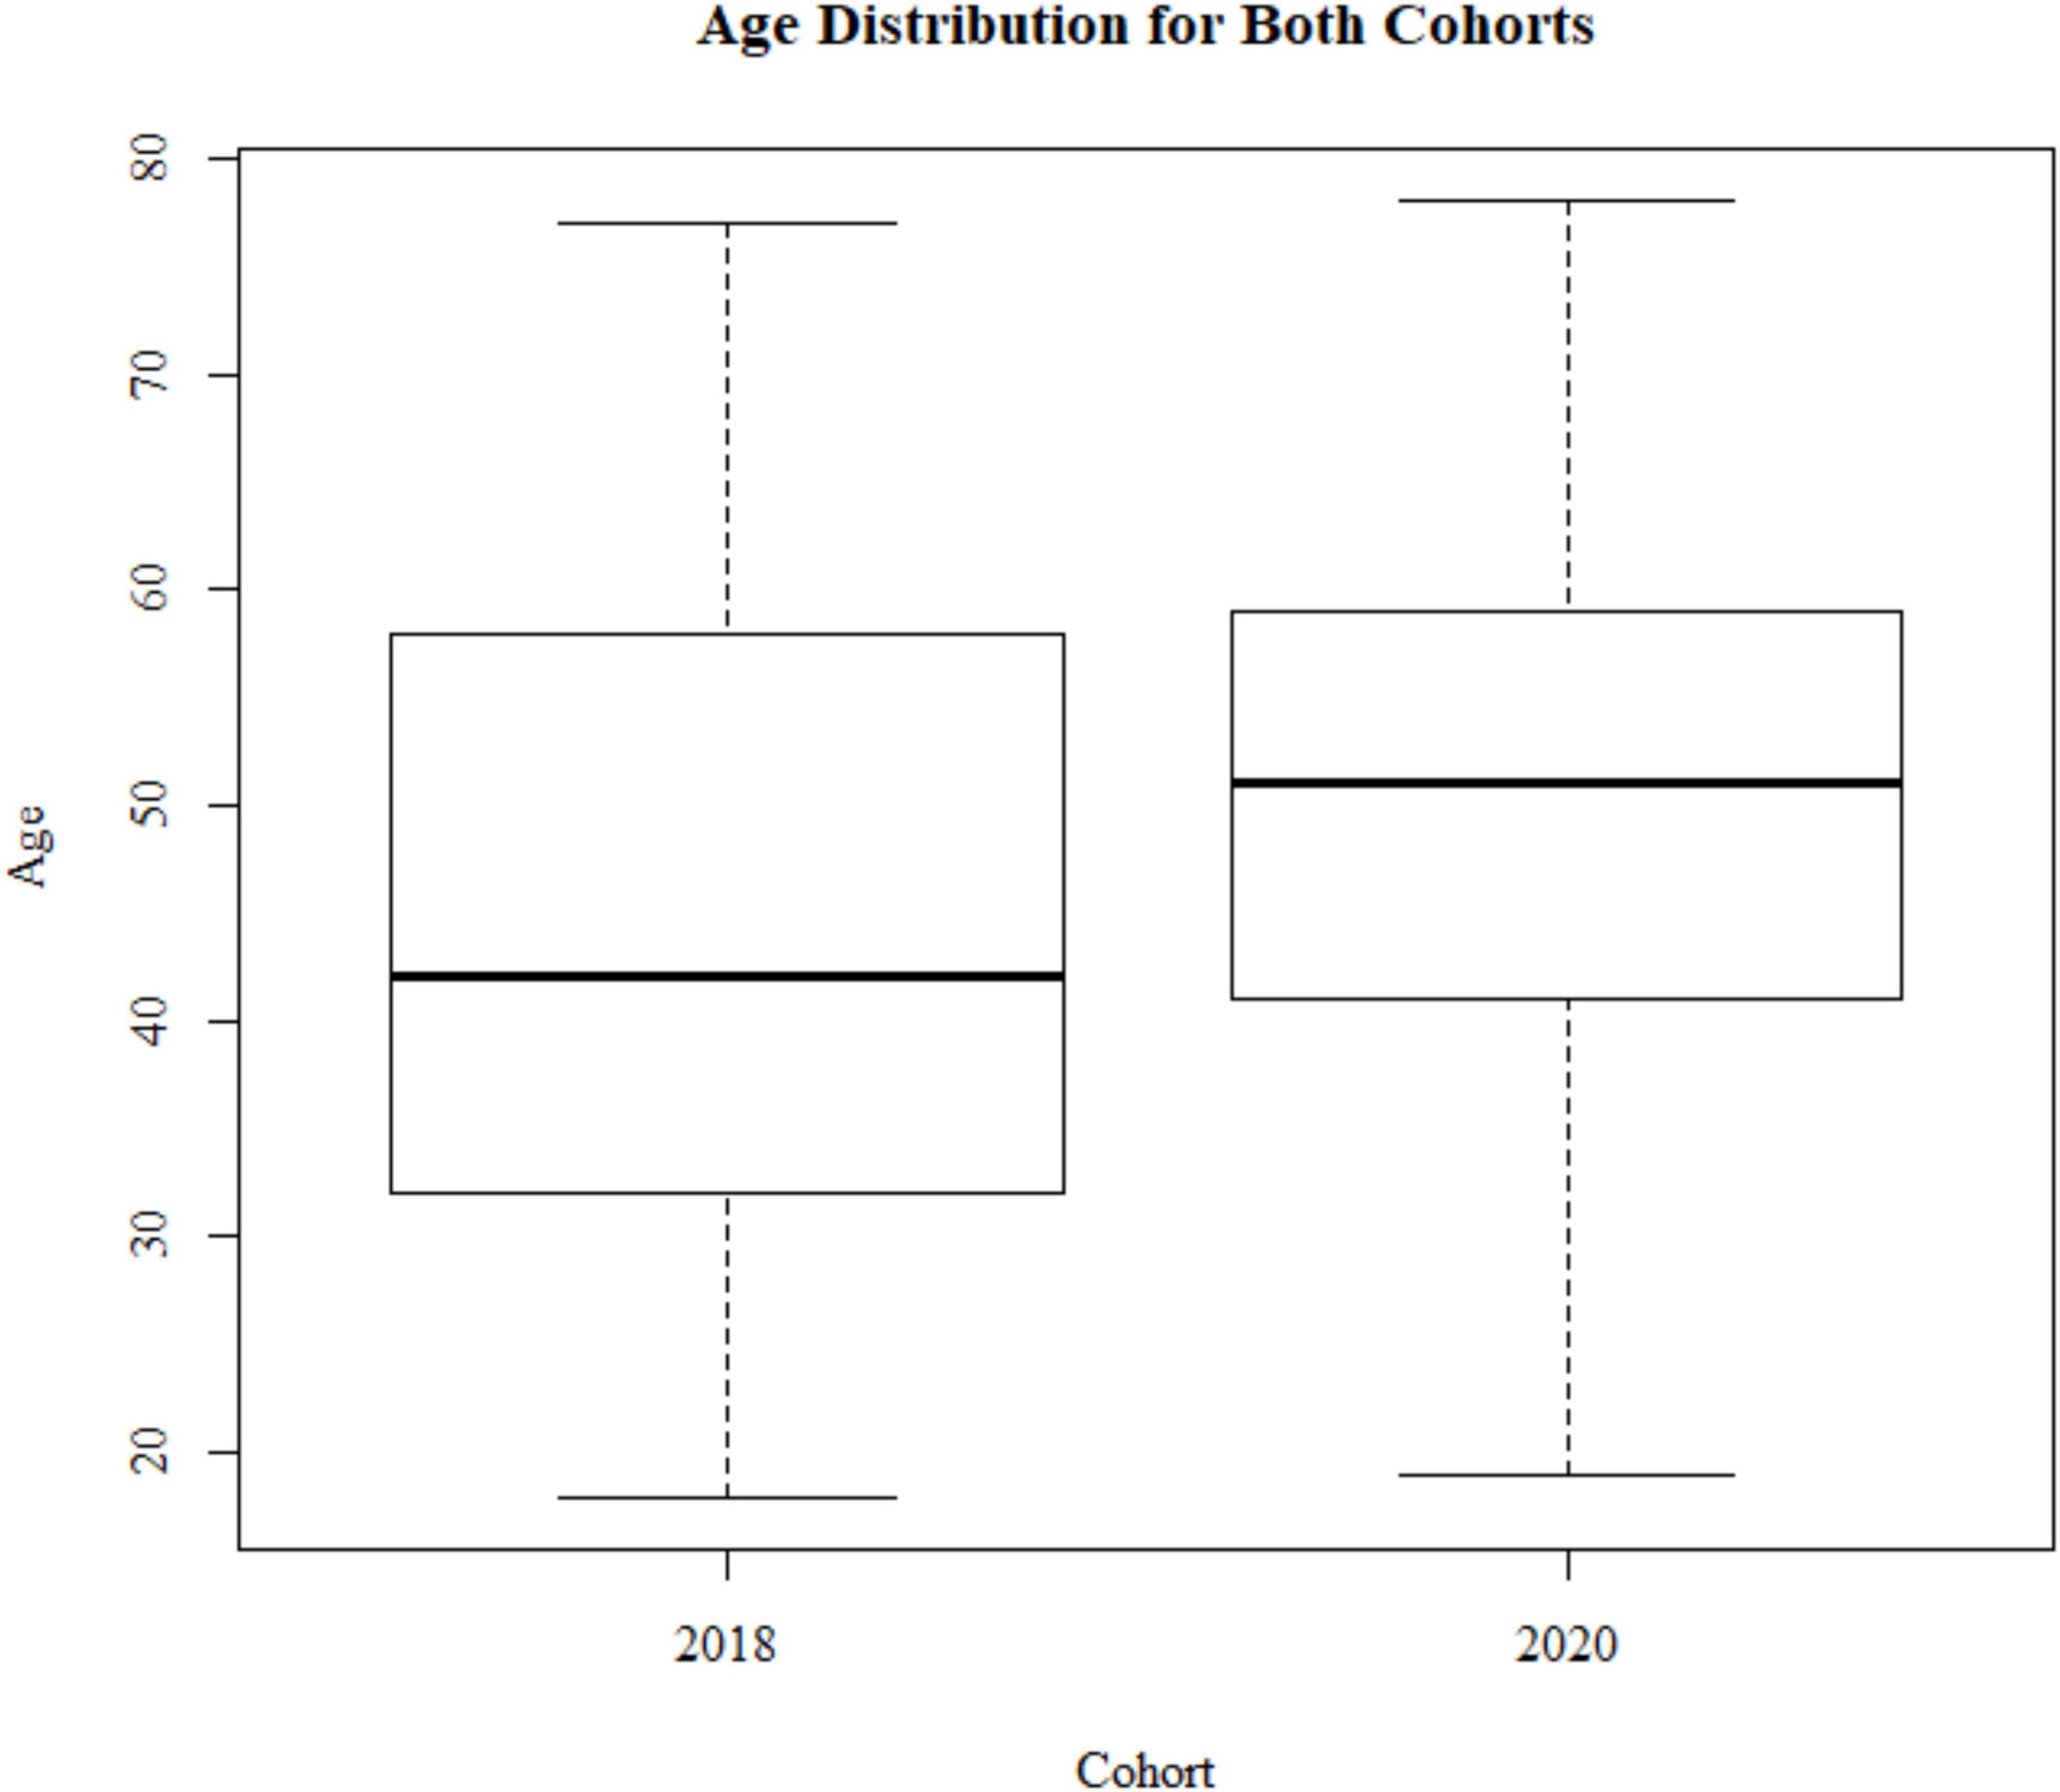
Figure 1. Sample demographics: age distribution for the 2018 cohort (N = 799) and 2020 cohort (N = 233).
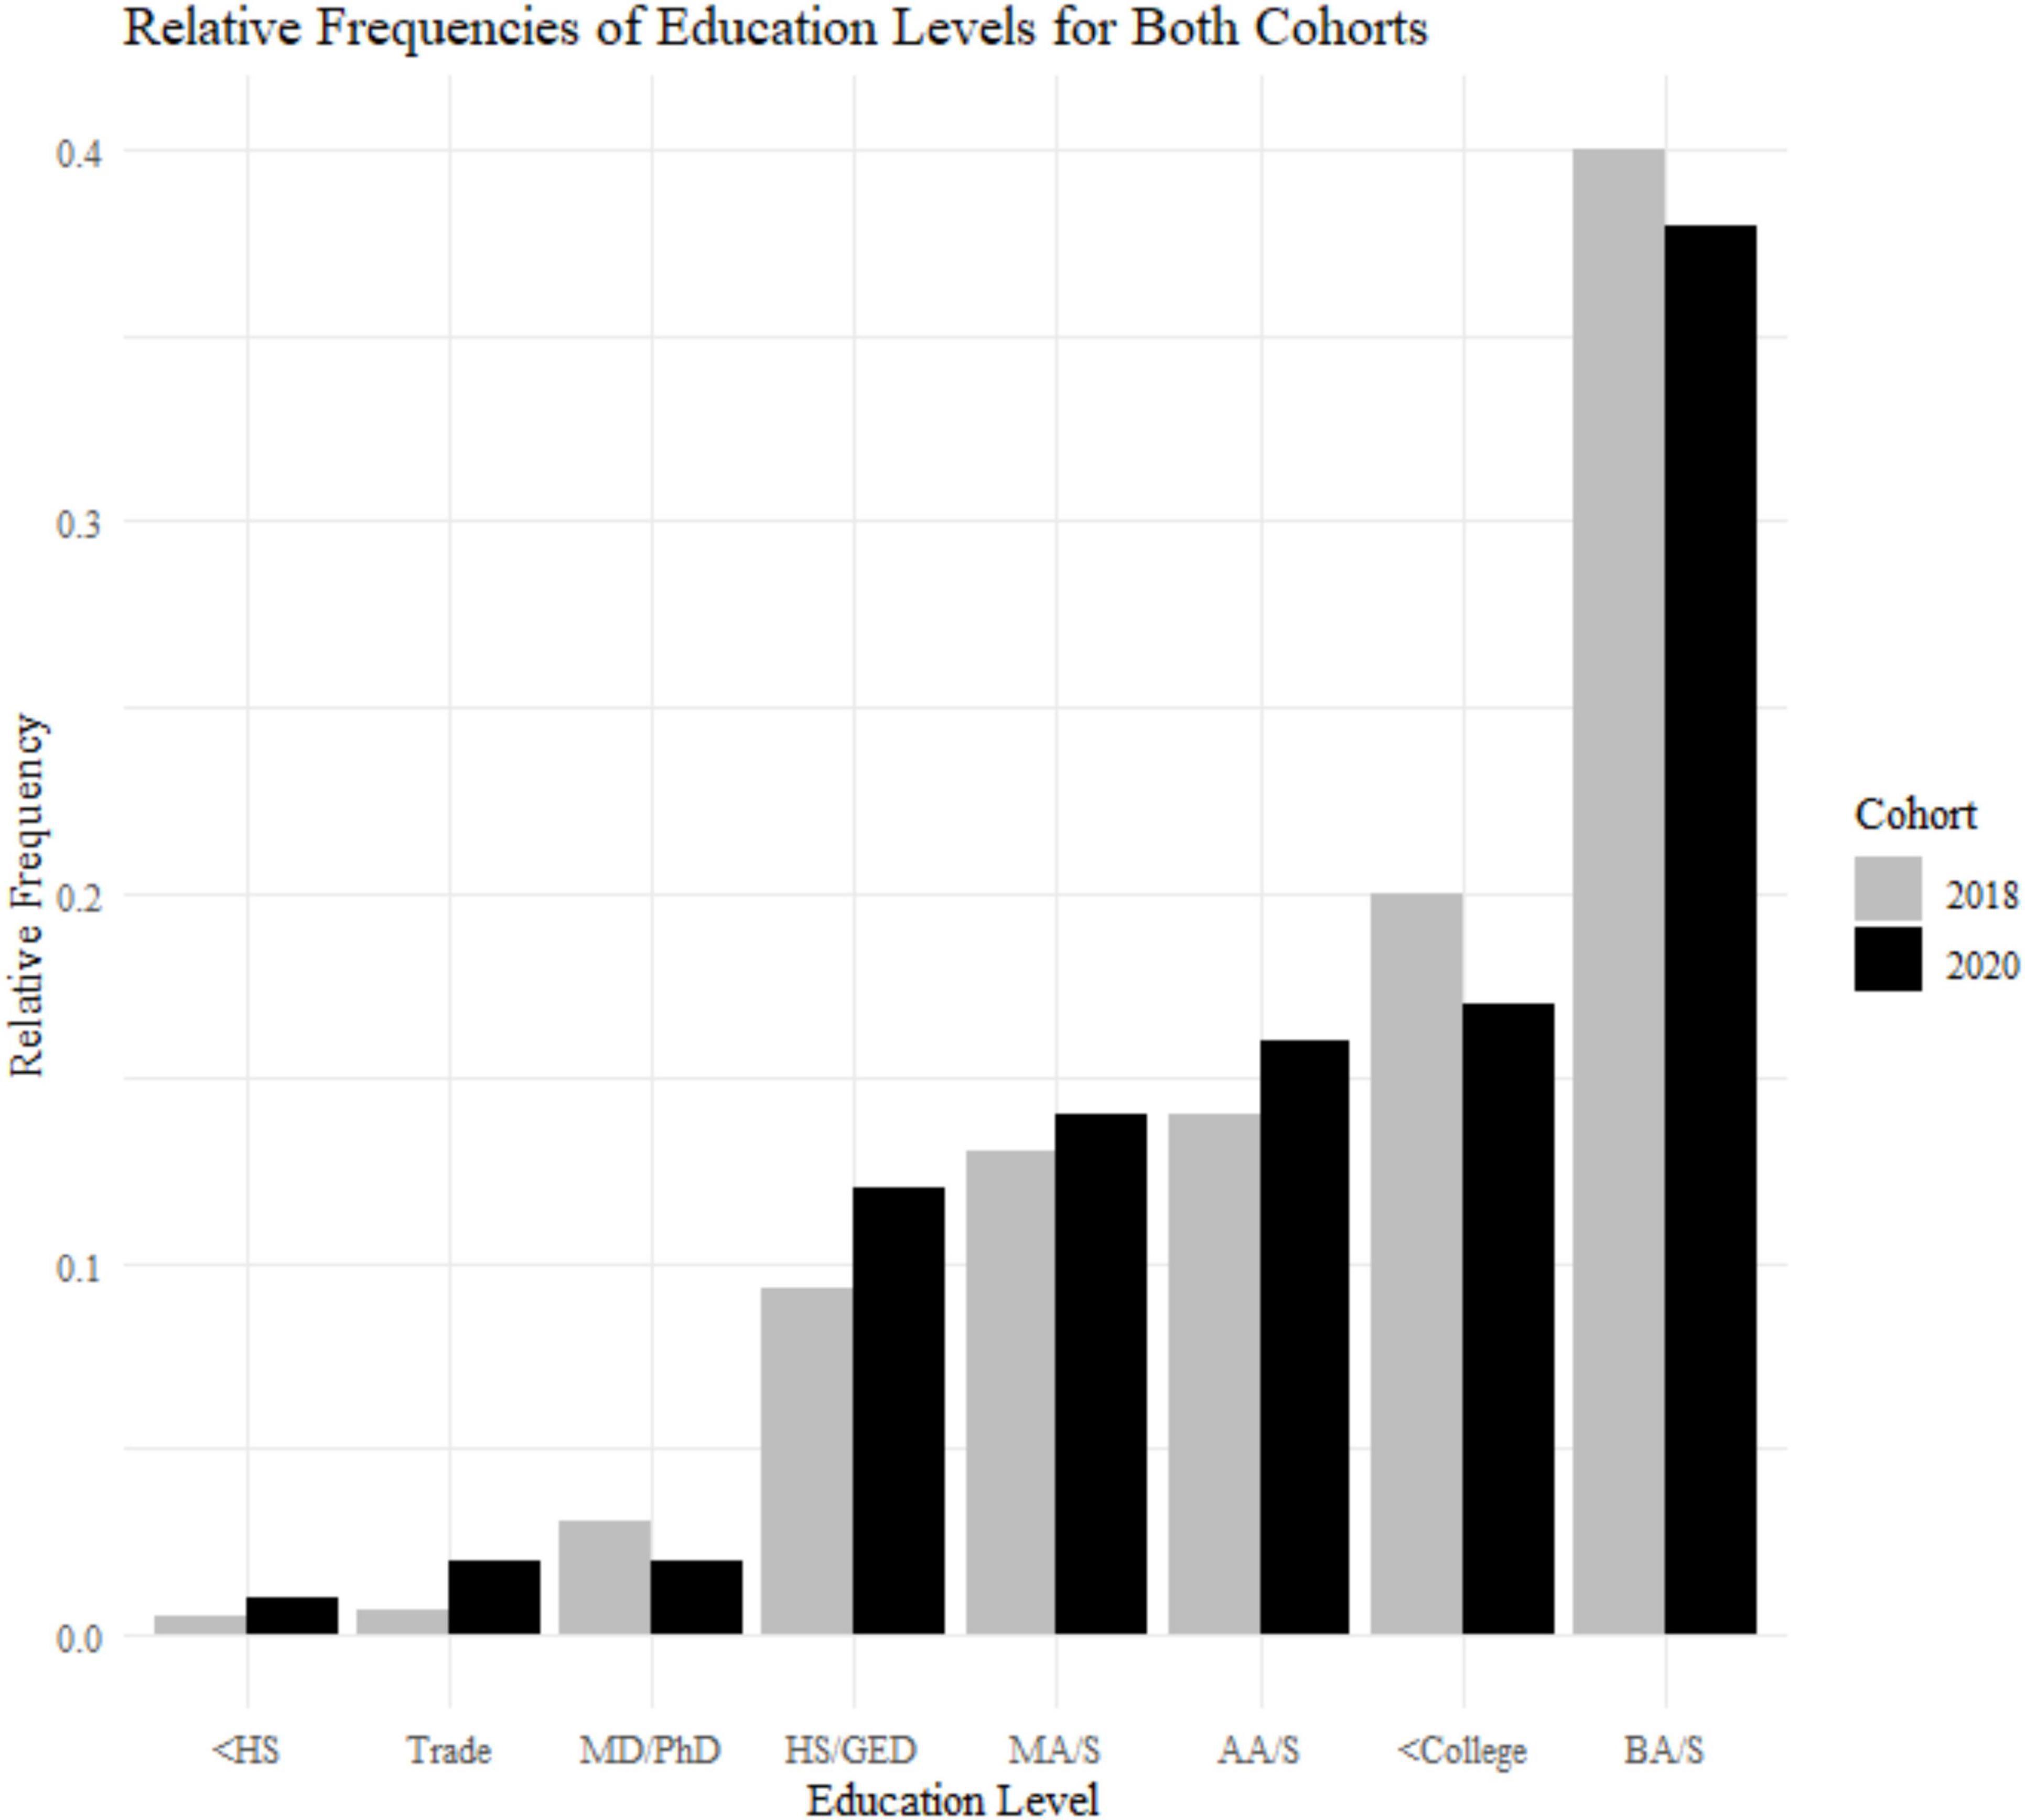
Figure 2. Sample demographics: education levels for the 2018 cohort (N = 799) and 2020 cohort (N = 233). <HS, less than high school; HS/GED, high school or general educational development; <College, some college but no degree; Trade, equivalent of trade or professional certificate; AA/S, Associate of Art or Science; BA/S, Bachelor of Art or Science; MA/S, Master of Art or Science; MD/PhD, doctoral level degree.
Although COVID-19 forced a transition to work-from-home employment for many, Amazon MTurk workers (50) had already been used to the arrangement for some time. Online gig work through platforms such as MTurk provides short term employment opportunities that can be done on a laptop at home, such as transcription or research study participation. Researchers have benefited from having a ready-made participant pool to quickly and inexpensively collect large data sets. The MTurk workforce represents general population demographics, including income, race, and ethnicity (51, 52). However, there are slightly more American women working on MTurk than American men, and they are highly educated (51, 52).
Sample descriptive statistics
A Levene test and Kruskal–Wallis test show that the two cohorts differ with respect to age variance and median [F(1) = 26.135, p < 0.001; X2(1) = 38.474, p < 0.001; Figure 1]. The 2020 cohort is older (mean age = 53.1, SD age = 10.2) compared to the 2018 cohort (mean age = 47.8, SD age = 12.6). This is due to the 2018 study having a minimum age of 18+, and the 2020 cohort having a minimum age of 30. Therefore, we used an age matched sample with a minimum of 30+ when comparing data between these two groups. The samples are different with respect to gender frequencies [X2(1) = 9.721, p = 0.0018; 2018, 52% female; 2020, 65% female]. There is no difference in education levels between the two cohorts [X2(7) = 5.678, p = 0.578; Figure 2].
Power calculations
Power calculations were based on effect size estimates derived from group differences in reaction times from a study using a similar behavioral paradigm (53), which had an effect size of Cohen d = 0.66. Note that the task domain that was the primary outcome variable at the time of preregistration was used to generate the estimates based on a within subjects test, however, analysis of that task is the subject of a separate manuscript as detailed in the section “Deviations from preregistration.” Power calculations for a within-subject one-tailed test with significance set to P = 0.05 identified that 30 participants were needed to achieve 80% power. Given the greater variability in cognitive function in older adults, exploratory aims of the study, and variable data quality and completeness resulting from online data collection, we aimed to collect 50 people for each age group (30–39, 40–49, 50–59, 60–69, 70–79, and 80+), acknowledging this was overambitious for people over 60 who have previously been less well represented on Amazon MTurk (14, 50). We aimed for the described age breakdown above, but those numbers were dependent on MTurk worker availability, attrition rates, and number of technical issues that impact study completion. We continued data collection until targets were met or exceeded, and the study budget was exhausted.
Statistical models
Statistical analyses and data visualization were completed using R version 4.0.5 (54) and the following packages: lme4 (55), hBayesDM (56), ggplot2 (57), ggpubr (58), sjPlot version 2.8.9 (59), and stats (54). Linear mixed-effect models (critical p-value of.05) were used to quantify the main effect of age on the reward, attention, and health variables to test primary hypotheses: depression (26, 27) and anxiety (25) symptoms, reaction time, and accuracy in behavior tasks as applicable. Generalized linear models (GLMs) with Gaussian links were used in cases where data did not conform to assumptions of normal distribution. They were used to quantify individual differences in the relationship between age and K-values (log geomean transformed) (29, 44). In exploratory analysis, GLMs with Poisson links were used to quantify individual differences in mood disorder symptoms and cognitive function.
Computational modeling
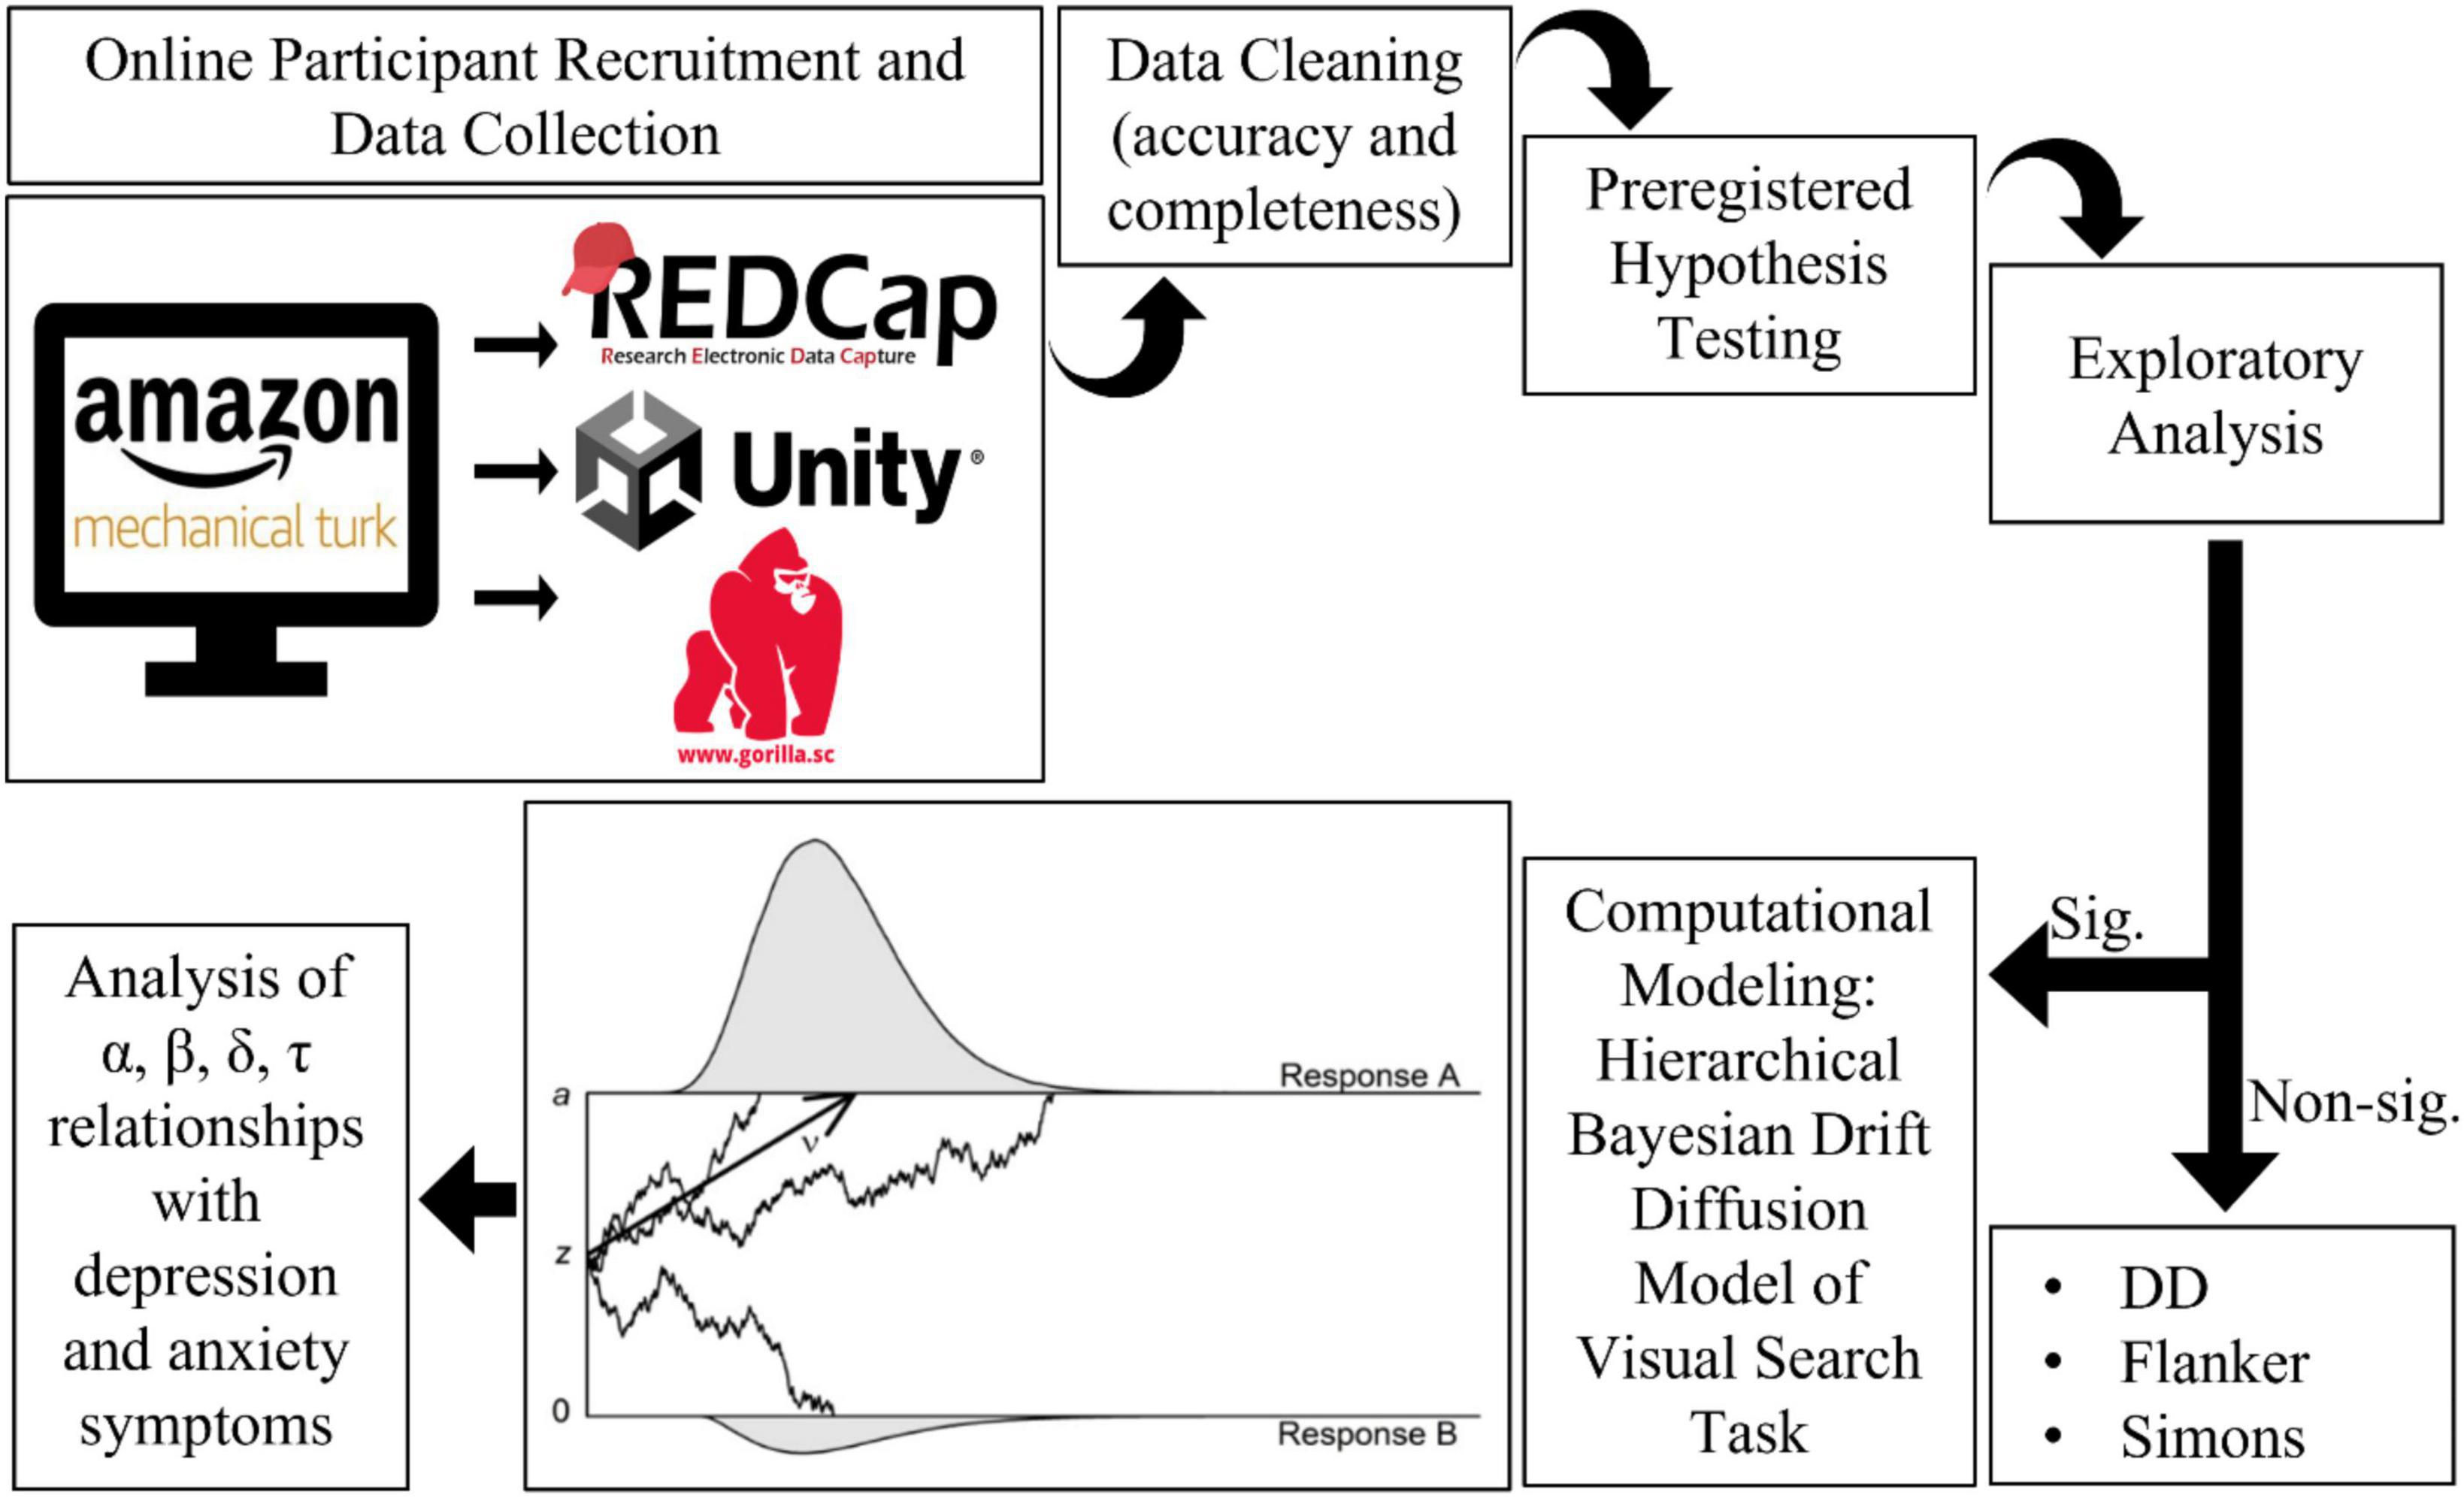
Hierarchical Bayesian drift diffusion modeling was used to generate latent cognitive parameters (60–62). Briefly, the hBayesDM package in R (56) uses a Markov Chain Monte-Carlo sampler (63) to generate a posterior distribution of parameter values seeded using the actual participant data. These distributions are used as a hyperparameter to reduce measurement error (64). In two-choice decision tasks, this improves estimation accuracy and robustness to outliers (60, 61). The model quantifies four parameters for each participant: alpha, beta, tau, and delta. Tau represents non-decision time, which is the shortest valid reaction time (excluding false positives) representing the minimum motor preparation needed before a response (button press) can occur (65). Alpha is the decision boundary, or, the amount of evidence needed to make a decision (65). Greater boundary values suggest more information is needed; having a lower boundary value indicates less information is needed. Beta represents the bias to respond, such as if participants tend to respond more to stimuli on the right side of the screen relative to the left (65). Delta, or drift rate, quantifies the rate of evidence accumulation–the speed at which the person can integrate information in favor of a decision (65).
Data exclusion
Data for this study was not excluded based on symptom or health scores. We included as much data as possible since slower task performance was hypothesized for older participants. Data with less than 70% accuracy was reviewed, and data with accuracy below chance (less than 50%) was excluded. Linear mixed-effects models allow for partially incomplete data. If a participant completed at least one-third of the battery, they were included in the respective task sub-sample.
Deviations from preregistration
The analysis plan outlined in the preregistration was followed with the exception of: excluding individual outlier trials for participants (instead using overall accuracy to minimize data loss), and the analysis of value-based attention capture (VBAC) and Willingness to Pay (WTP) data will be the subject of a separate manuscript.
Results
Analysis workflow
See Figure 3 for an overview of the analysis workflow. All p-values are reported raw and with a False Discovery Rate correction for all preregistered hypotheses (66). FDR adjusted p-values are not reported for exploratory analyses (66).
Planned analyses
Hypothesis 1
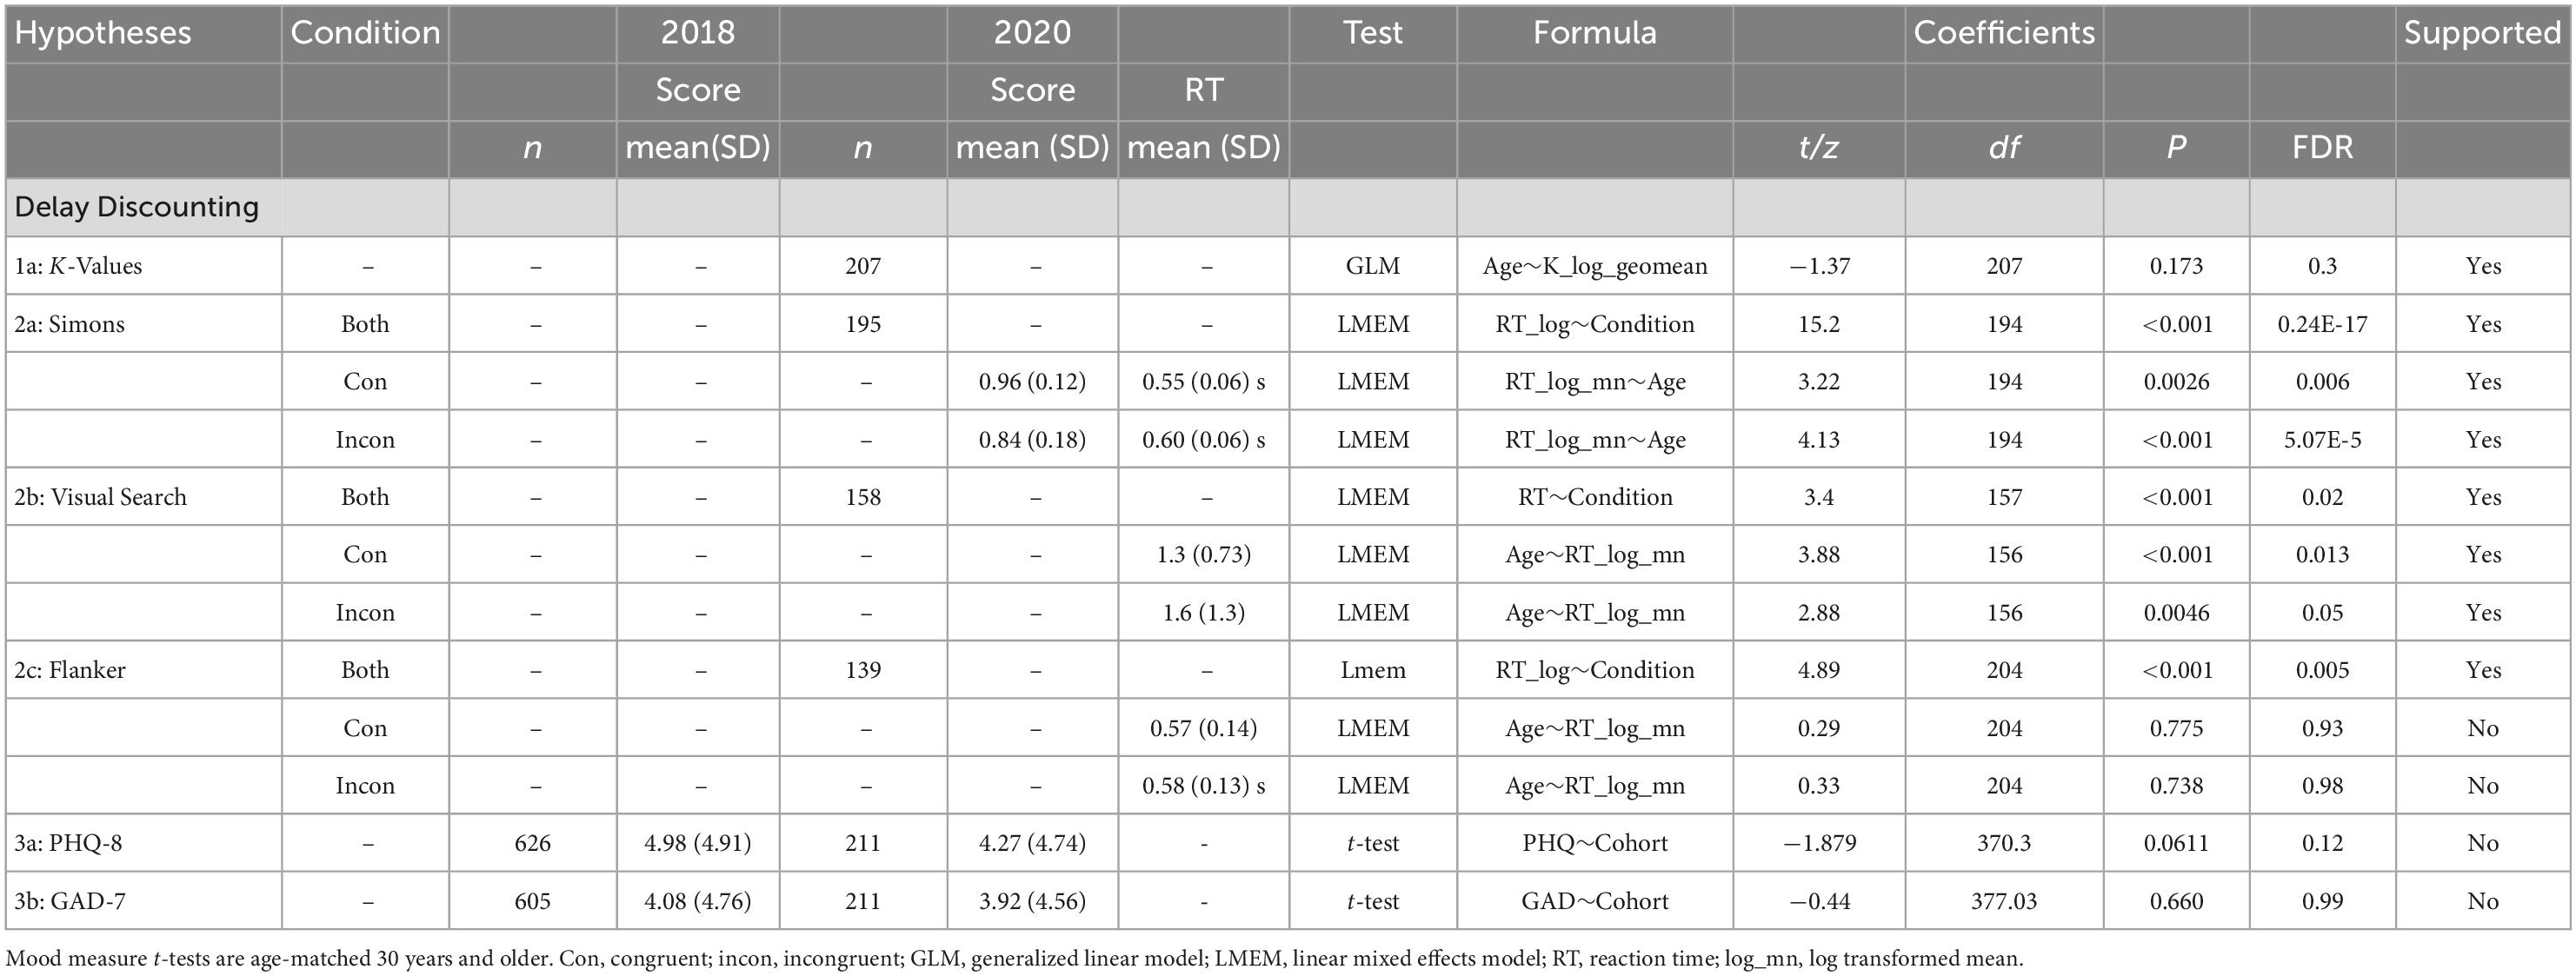
We confirmed hypothesis 1: reward-related behaviors remained intact as age increases, including consistently preferring immediate over delayed rewards in the Delay Discounting task (29). Age did not have a linear relationship with the delayed discounting variables (Table 1).

Table 1. Additional analysis of delay discounting parameters and age, using linear mixed-effect models for delayed discounting parameters in the 2020 cohort (n = 207).
Hypothesis 2
We partially confirmed hypothesis 2: cognition declined with age, specifically resulting in slower performance on the Visual Search (35) and Simons tasks (38), but not the Flanker (32). Age was not associated with changes in accuracy (Table 2). Age has a positive, linear relationship with reaction time for the Visual Search and Simons task (Table 3).
Hypothesis 3
We did not confirm hypothesis 3: depression (26) symptoms and anxiety (25) symptoms did not significantly differ between samples (Table 3).
Age and mental health scores
Mood symptom correlations pre- and peri-COVID
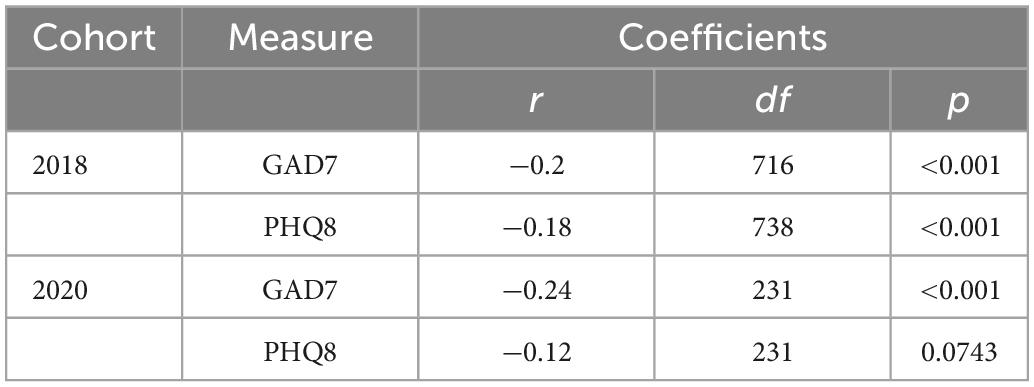
Statistically significant negative correlations (Spearman r; Table 4) between age and anxiety were replicated in both the 2020 sample (N = 233; Figure 4A) and the pre-COVID 2018 sample (n = 740 PHQ8 (26); n = 718 GAD7 (25); Figure 4B). Splitting the samples at the age-matched median (53 years) for visualization purposes highlights the elevated self-reported depression and anxiety symptoms in the younger half of participants from both cohorts. Two-sample tests for equality of proportions (all n > 26) were statistically significant for suprathreshold scores (> = 5) between younger and older participants in both samples for anxiety symptoms (2018, p < 0.001; 2020, p = 0.0013) and depression symptoms (p < 0.001 for both cohorts).
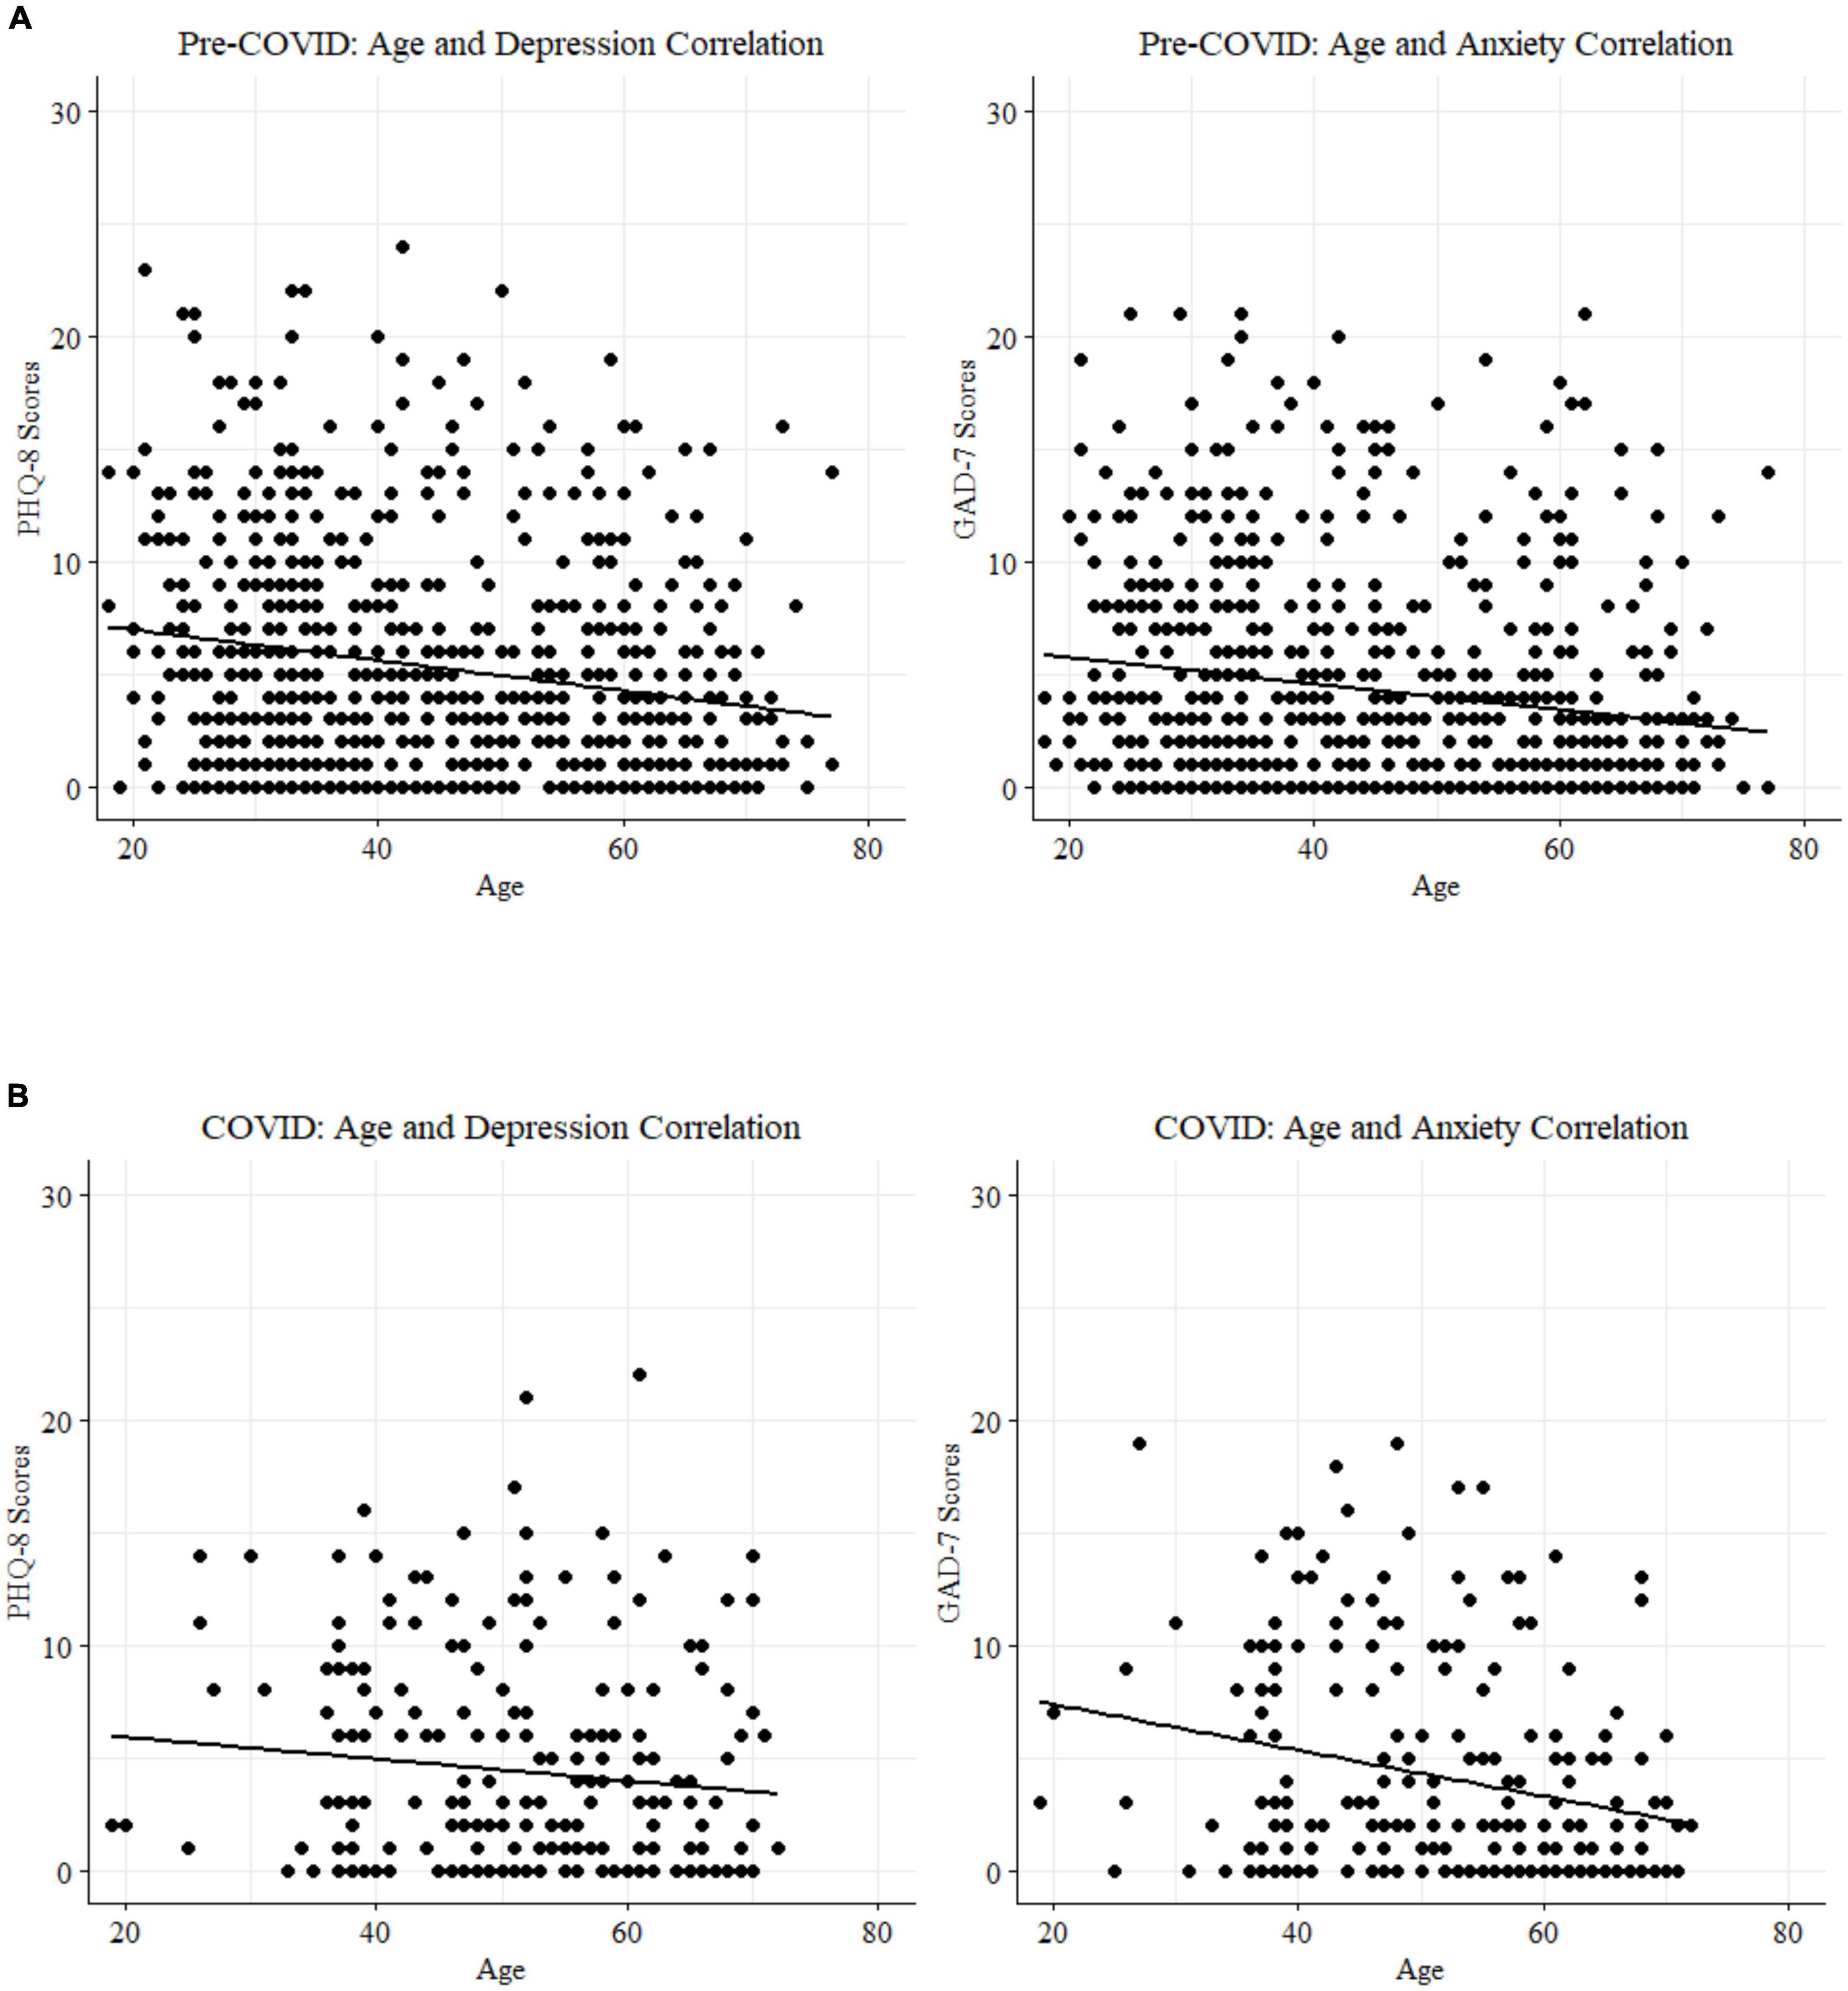
Figure 4. (A) Age and mood score correlations for the pre-COVID 2018 cohort. (B) Age and mood score correlations for the peri-COVID 2020 cohort.
Computational modeling
To reduce experimenter degrees of freedom, and increase confidence in exploratory hypothesis generating results, the following workflow logic was used to identify data for computational modeling: (1) hypothesized main effect of condition was observed, (2) hypothesized age-related reaction time slowing was observed, and (3) a statistically significant relationship between mental health and task performance was observed. Data was entered into the hBayesDM (56) model for generation of latent cognitive parameters (α–alpha, β–beta, δ–delta, and τ–tau) which were used in further analysis of mood-behavior and mood-age-behavior relationships. The only task that met these criteria was Visual Search (34, 35). We did not consider the Flanker for exploratory analysis since our original hypothesized RT∼age relationship was not confirmed and this data didn’t meet criteria for further analysis. Analysis of mood symptom-behavior relationships for the Simons task data found no significant association between PHQ9 and reaction time in the Incongruent (p = 0.2) or Congruent condition (p = 0.09) and no association between GAD7 and reaction time in Incongruent (p = 0.9) or Congruent condition (p = 0.6).
HDDM of visual search
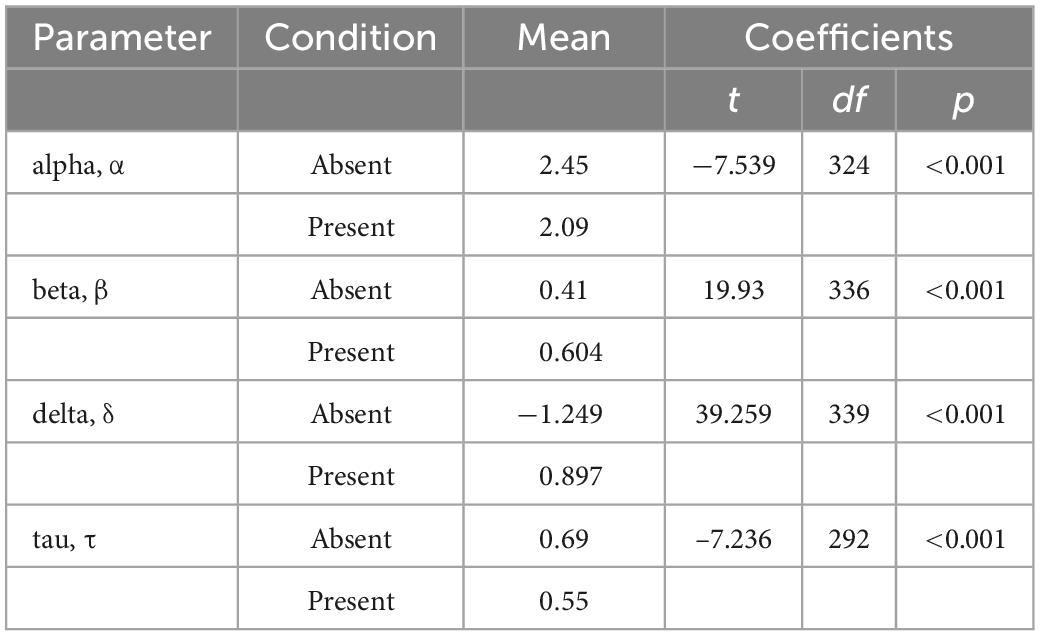
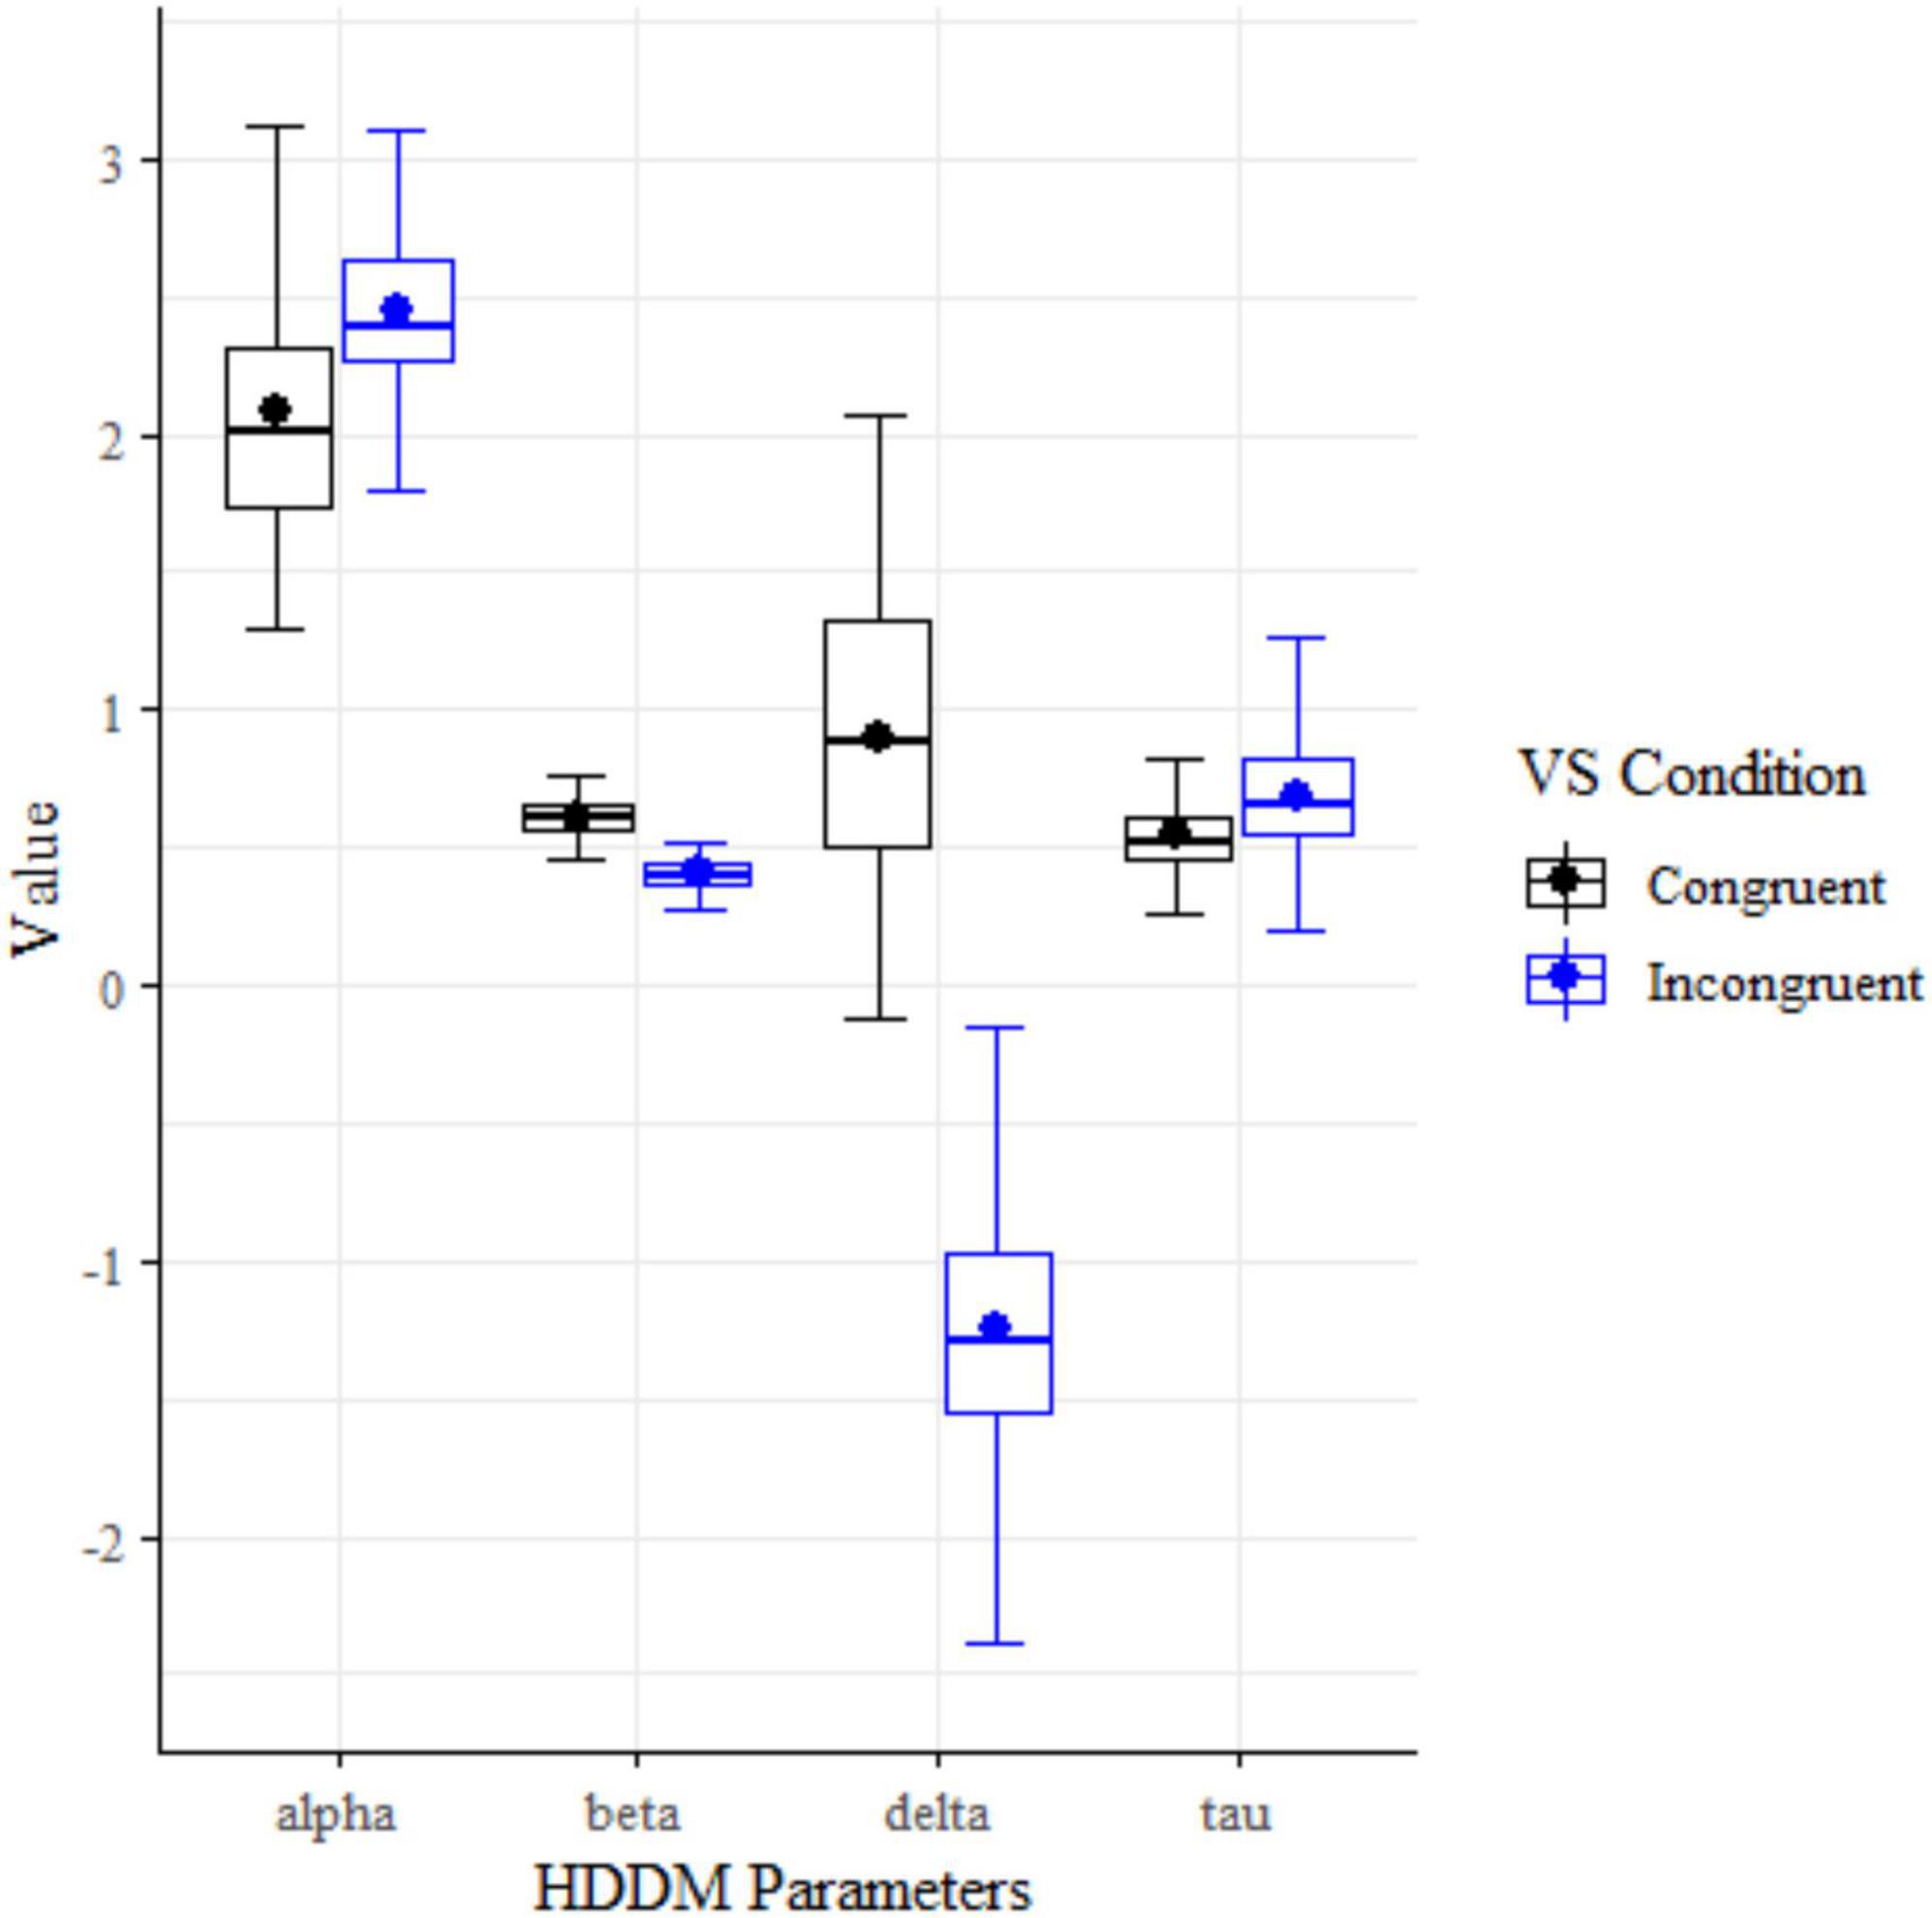
The absent (n = 172) and present (n = 169) conditions of Visual Search showed statistically significant differences in parameter means for all four drift diffusion model parameters: alpha (decision boundary), beta (bias), delta (drift rate), and tau (non-decision time) using a two-tailed t-tests (Figure 3 and Table 5).
Separable behavioral phenotypes for anxiety vs. depression
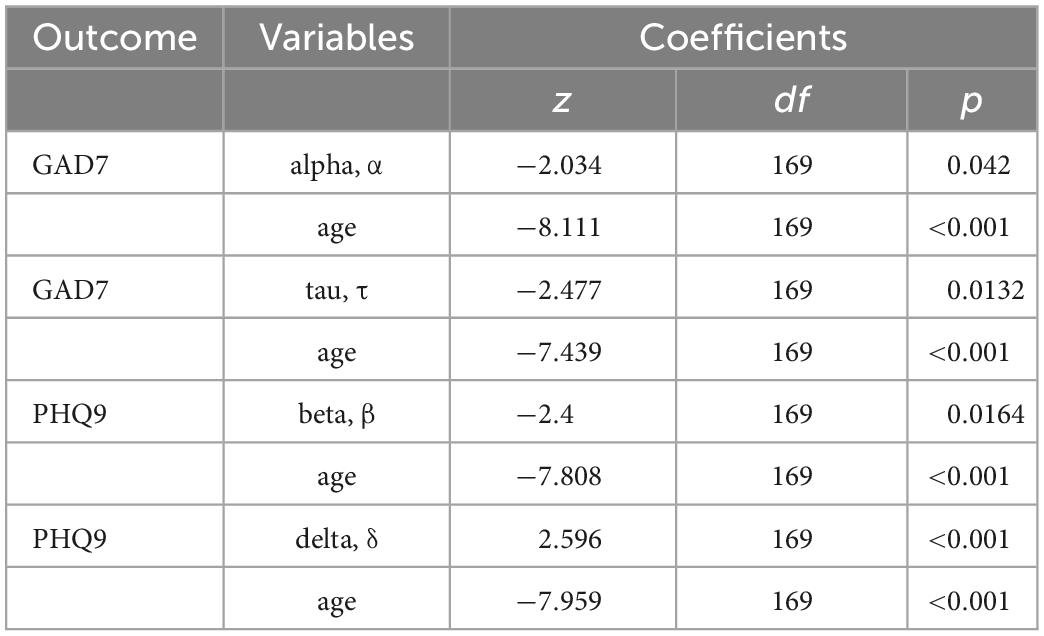
Generalized linear models identified relationships between mood symptoms and latent cognitive parameters in the incongruent condition (n = 172) of the Visual Search task (Table 6). Participants higher in anxiety were faster to respond (lower tau/shorter non-decision times), but less accurate, and incorporated less information when making decisions (lower alpha/decision boundary). Participants higher in depression were slower to accumulate evidence in favor of a decision (higher delta/drift rate), and were more biased toward a particular response (beta parameter).
Latent cognitive parameters are associated with anxiety and depression, accounting for age
Alpha (decision boundary) and tau (non-decision time) parameters in the incongruent condition are associated with higher GAD7 (25) scores (Figure 5), with age included in the GLM (Table 7). Decision boundaries were lower, and non-decision times were shorter, in those with higher anxiety. Beta (bias) and delta (drift rate) are associated with higher PHQ9 (27) scores (Figure 5); those higher in depression showed more biased responses, and a slower rate of evidence accumulation (drift rate). Age also independently predicted anxiety scores, with older age associated with lower severity of anxiety and depressive symptoms. To aid interpretation of the significant results for interactions between age and task accuracy, and age and computational modeling parameters, we utilized a median split of age for visualization purposes in Figures 5–7.
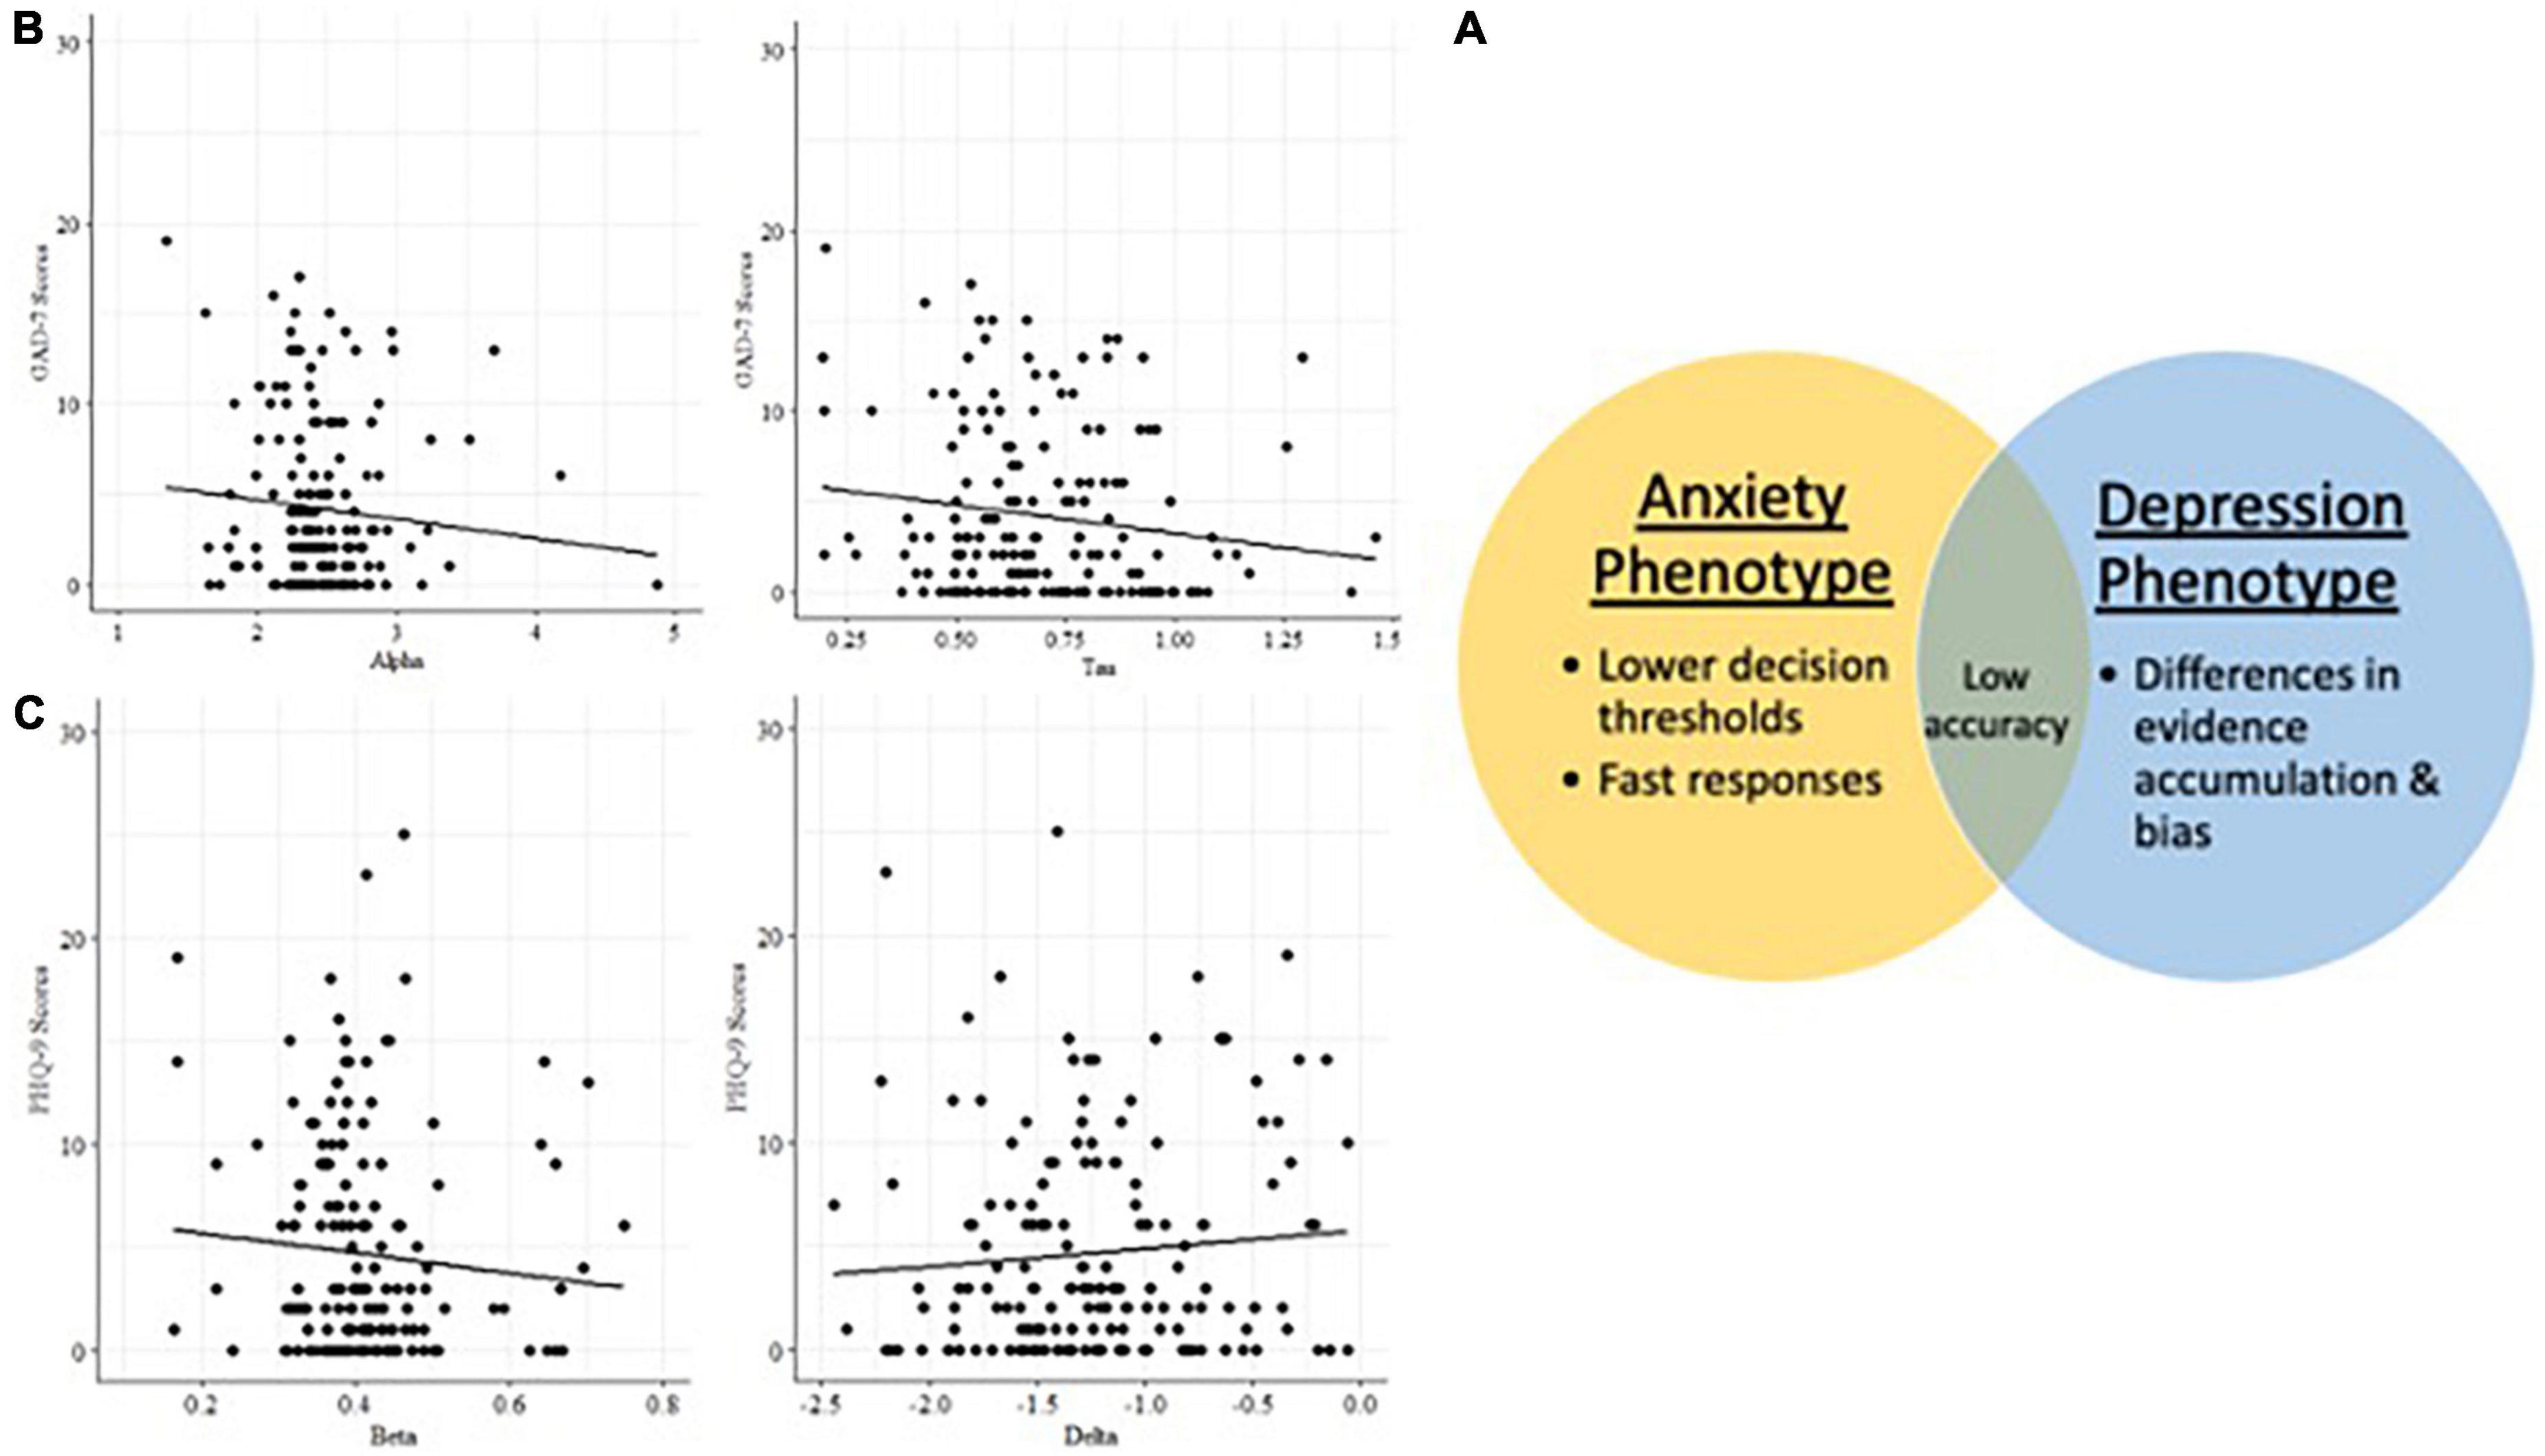
Figure 6. (A) Latent cognitive variables associated with anxiety and depression phenotypes in Visual Search. (B) Anxiety phenotype: decision boundary and non-decision time. (C) Depression phenotype: bias and drift rate.
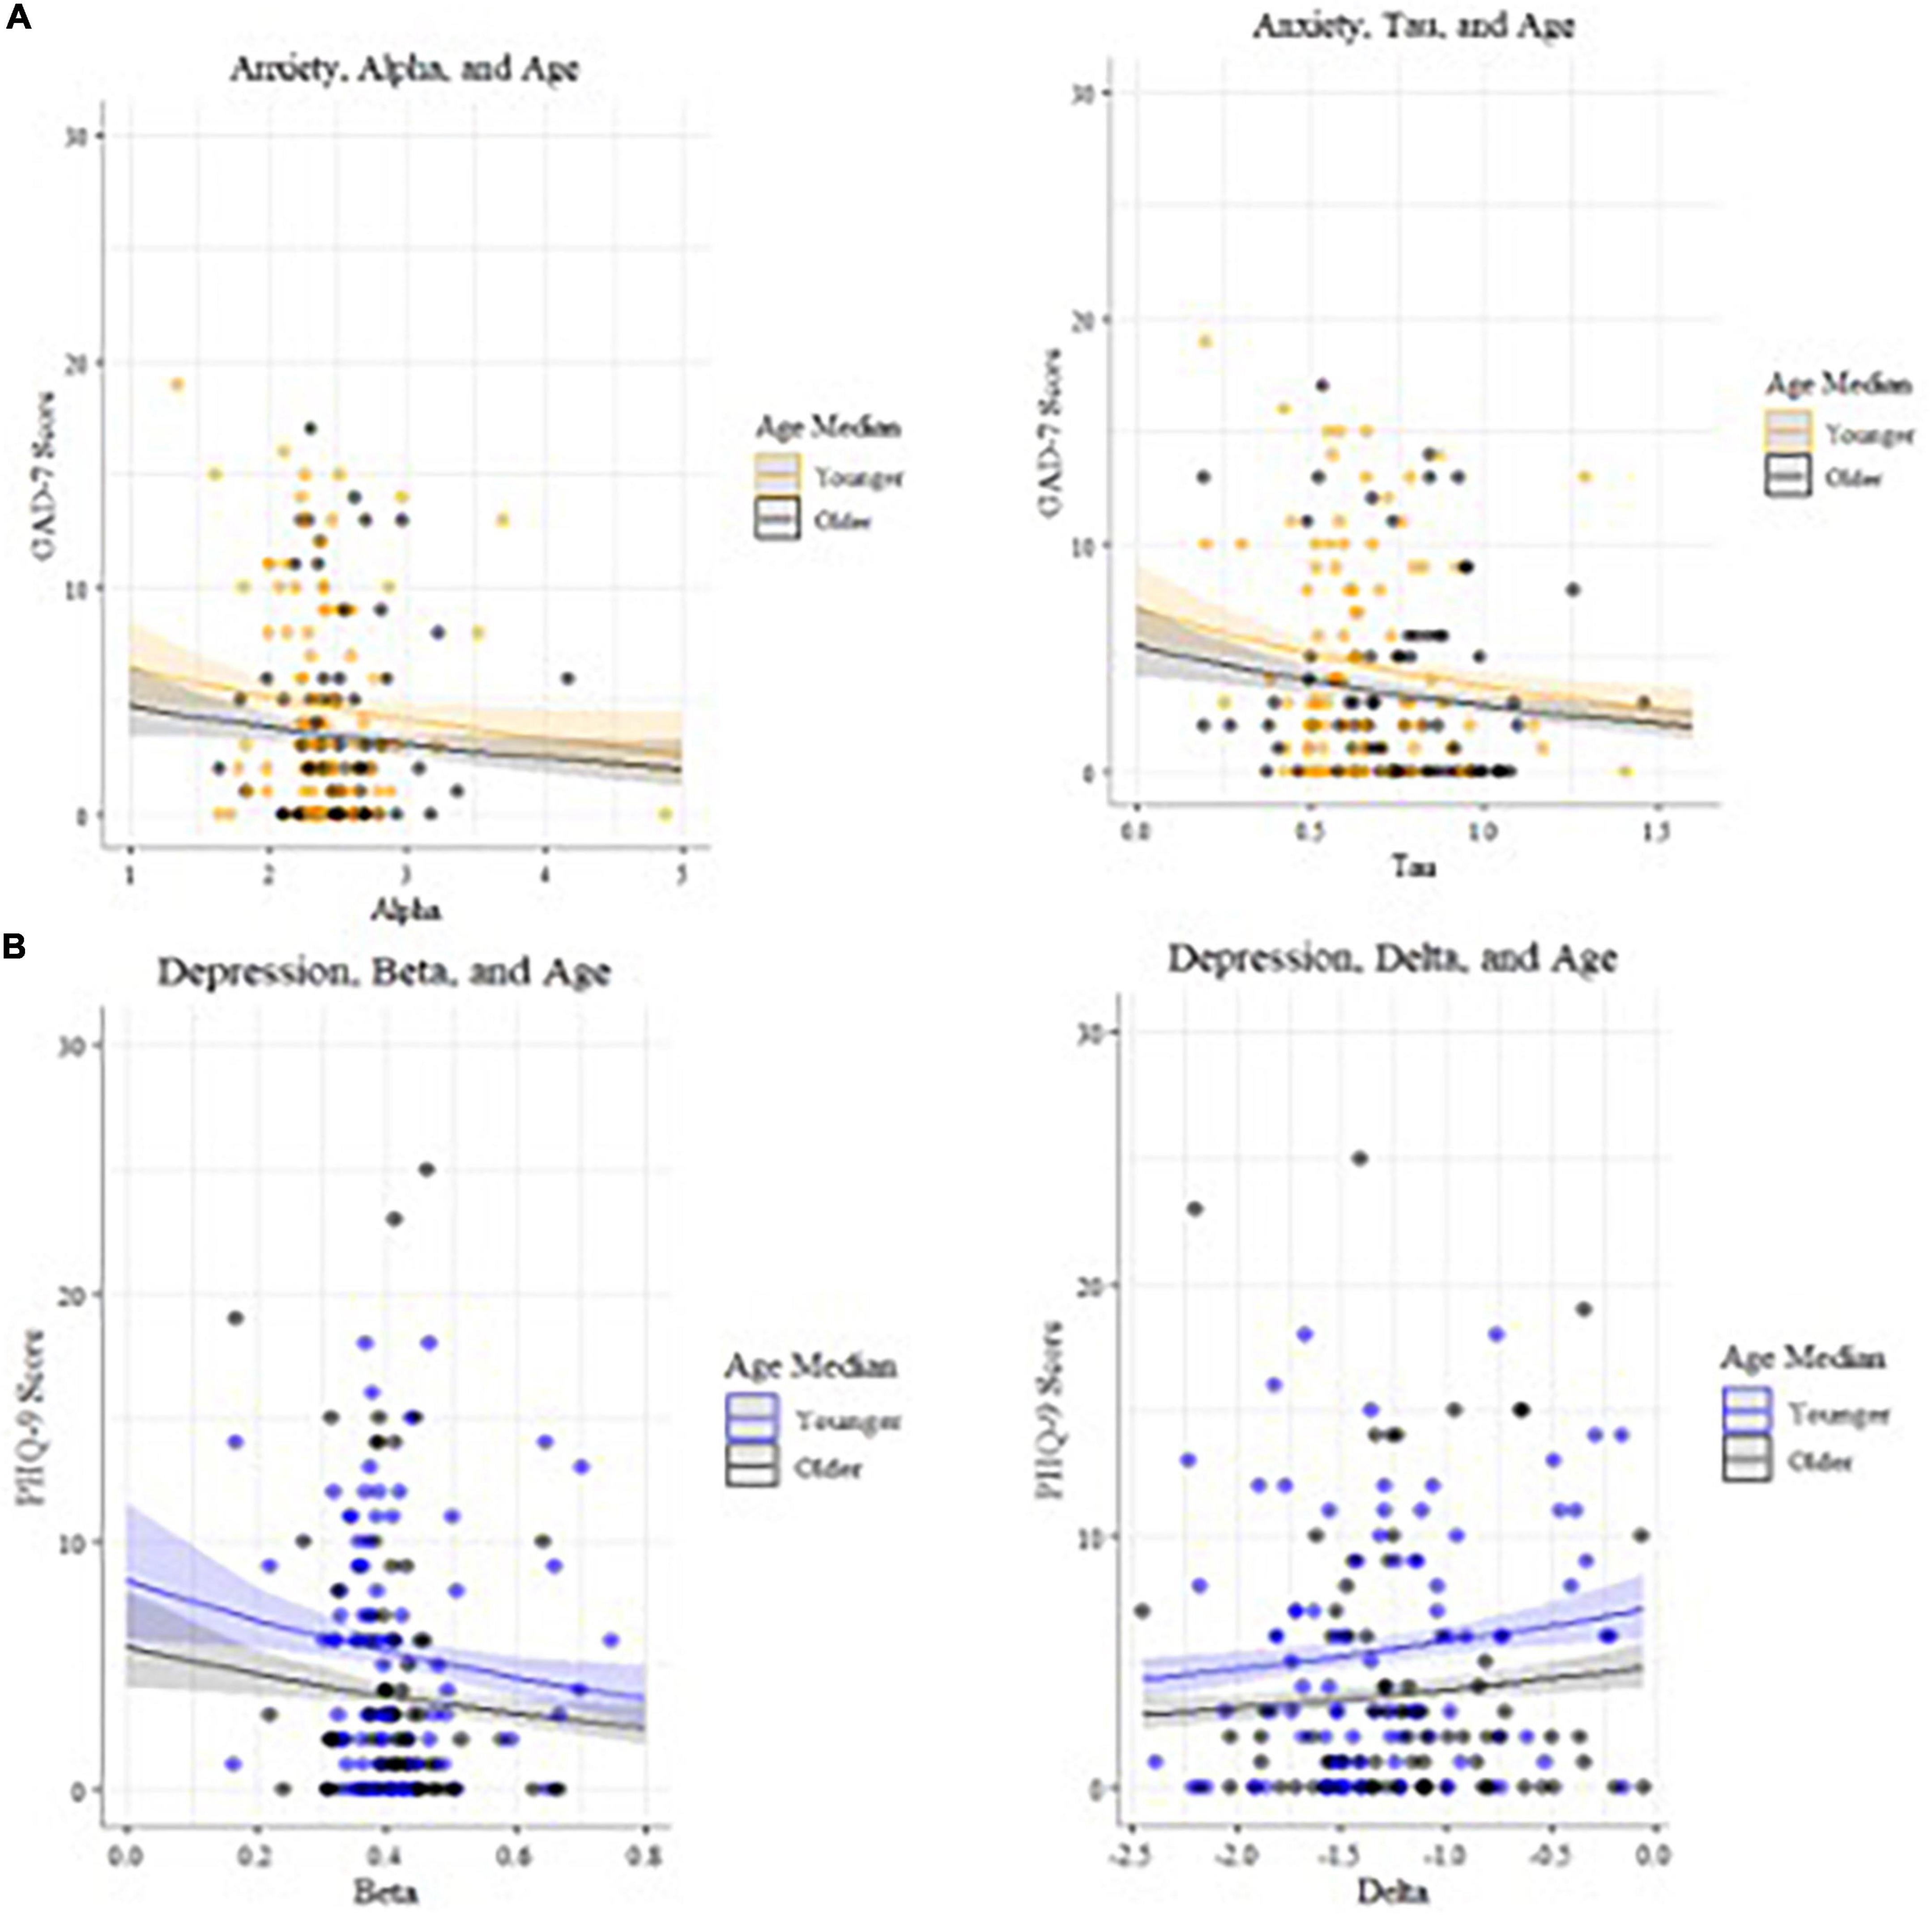
Figure 7. (A) Models of anxiety predictors, plotted by age (median split used for visualization purposes). (B) Models of depression predictors, plotted by age (median split used for visualization purposes).
Age and accuracy scores are associated with mood symptoms
In the incongruent condition (n = 172), there were statistically significant interactions (Table 8) between age and accuracy that predicted both depression (27) and anxiety (25) symptom scores (Figures 6, 8). Younger adults with higher anxiety and depression symptoms had lower accuracy. Age was split at the median (53 years) for visualization purposes.

Table 8. Generalized linear models of mood scores and associated interactions for Visual Search conditions.
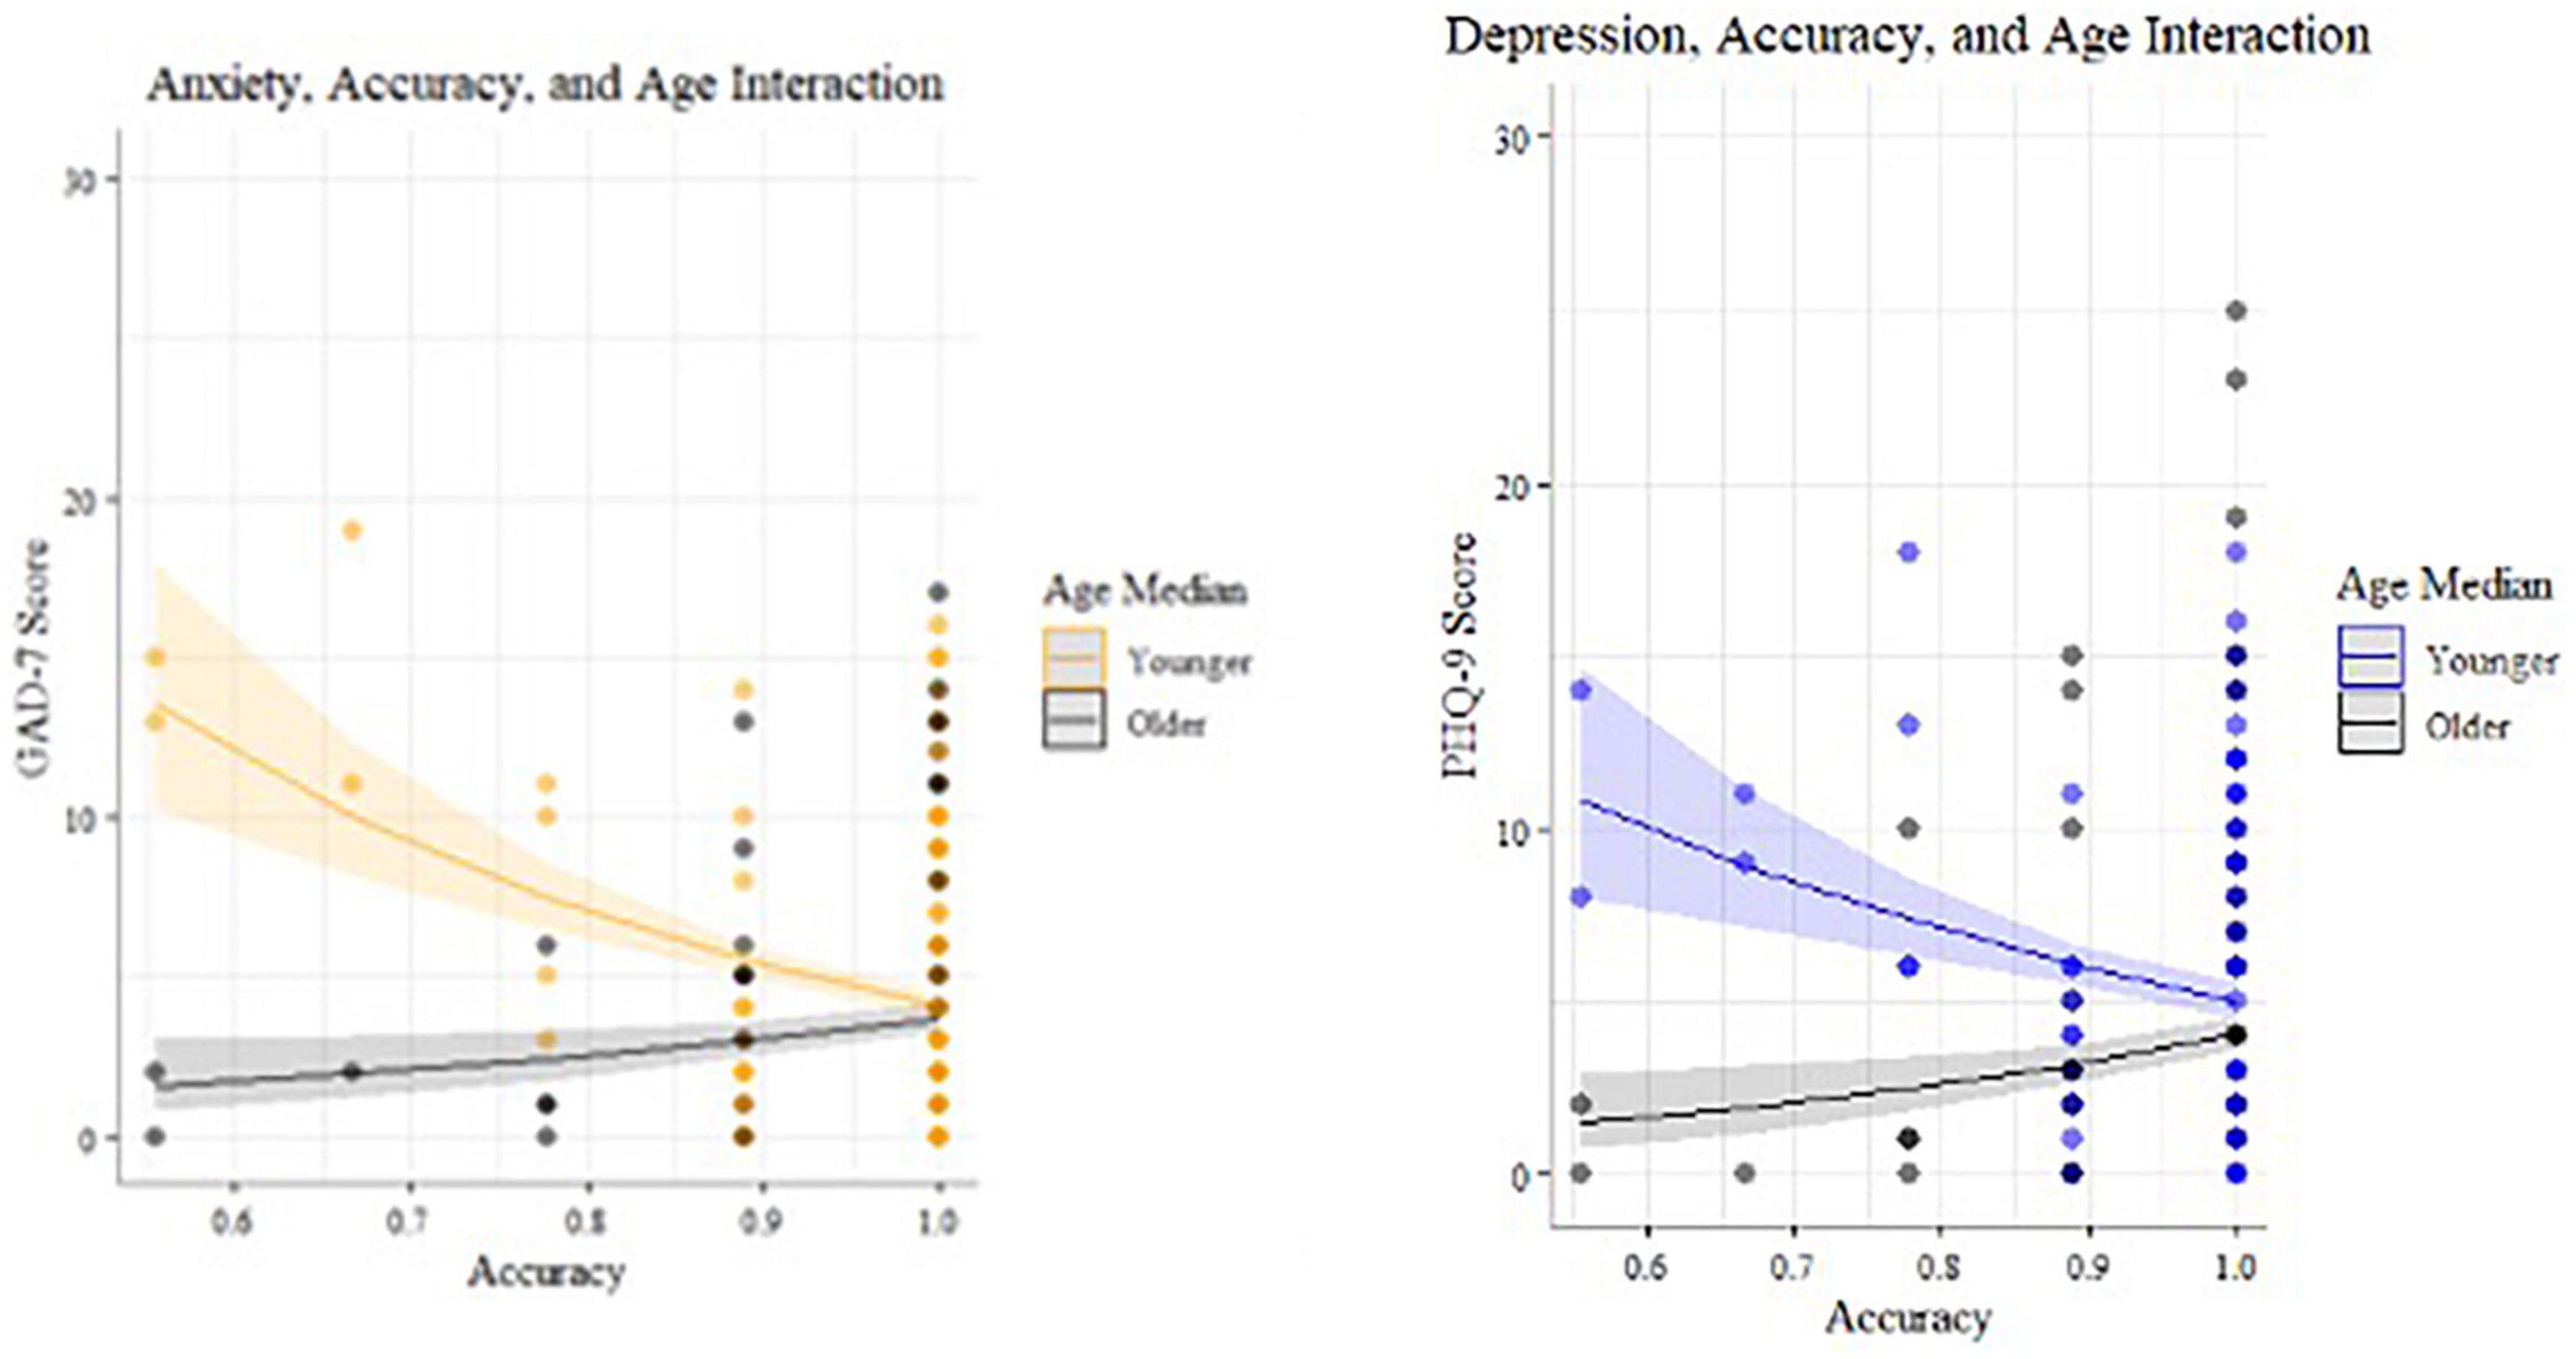
Figure 8. Statistically significant interactions predicting anxiety and depression for incongruent Visual Search (median split by age for visualization purposes).
Age and sex are associated with mood
In the 2020 pandemic sub-sample with sex data (n = 202, n = 137 female), GLMs show that sex is associated with mood symptoms, with women reporting higher anxiety (p = 0.017) and depression (p < 0.001) scores than men, when accounting for age.
Anxiety and depression comorbidity
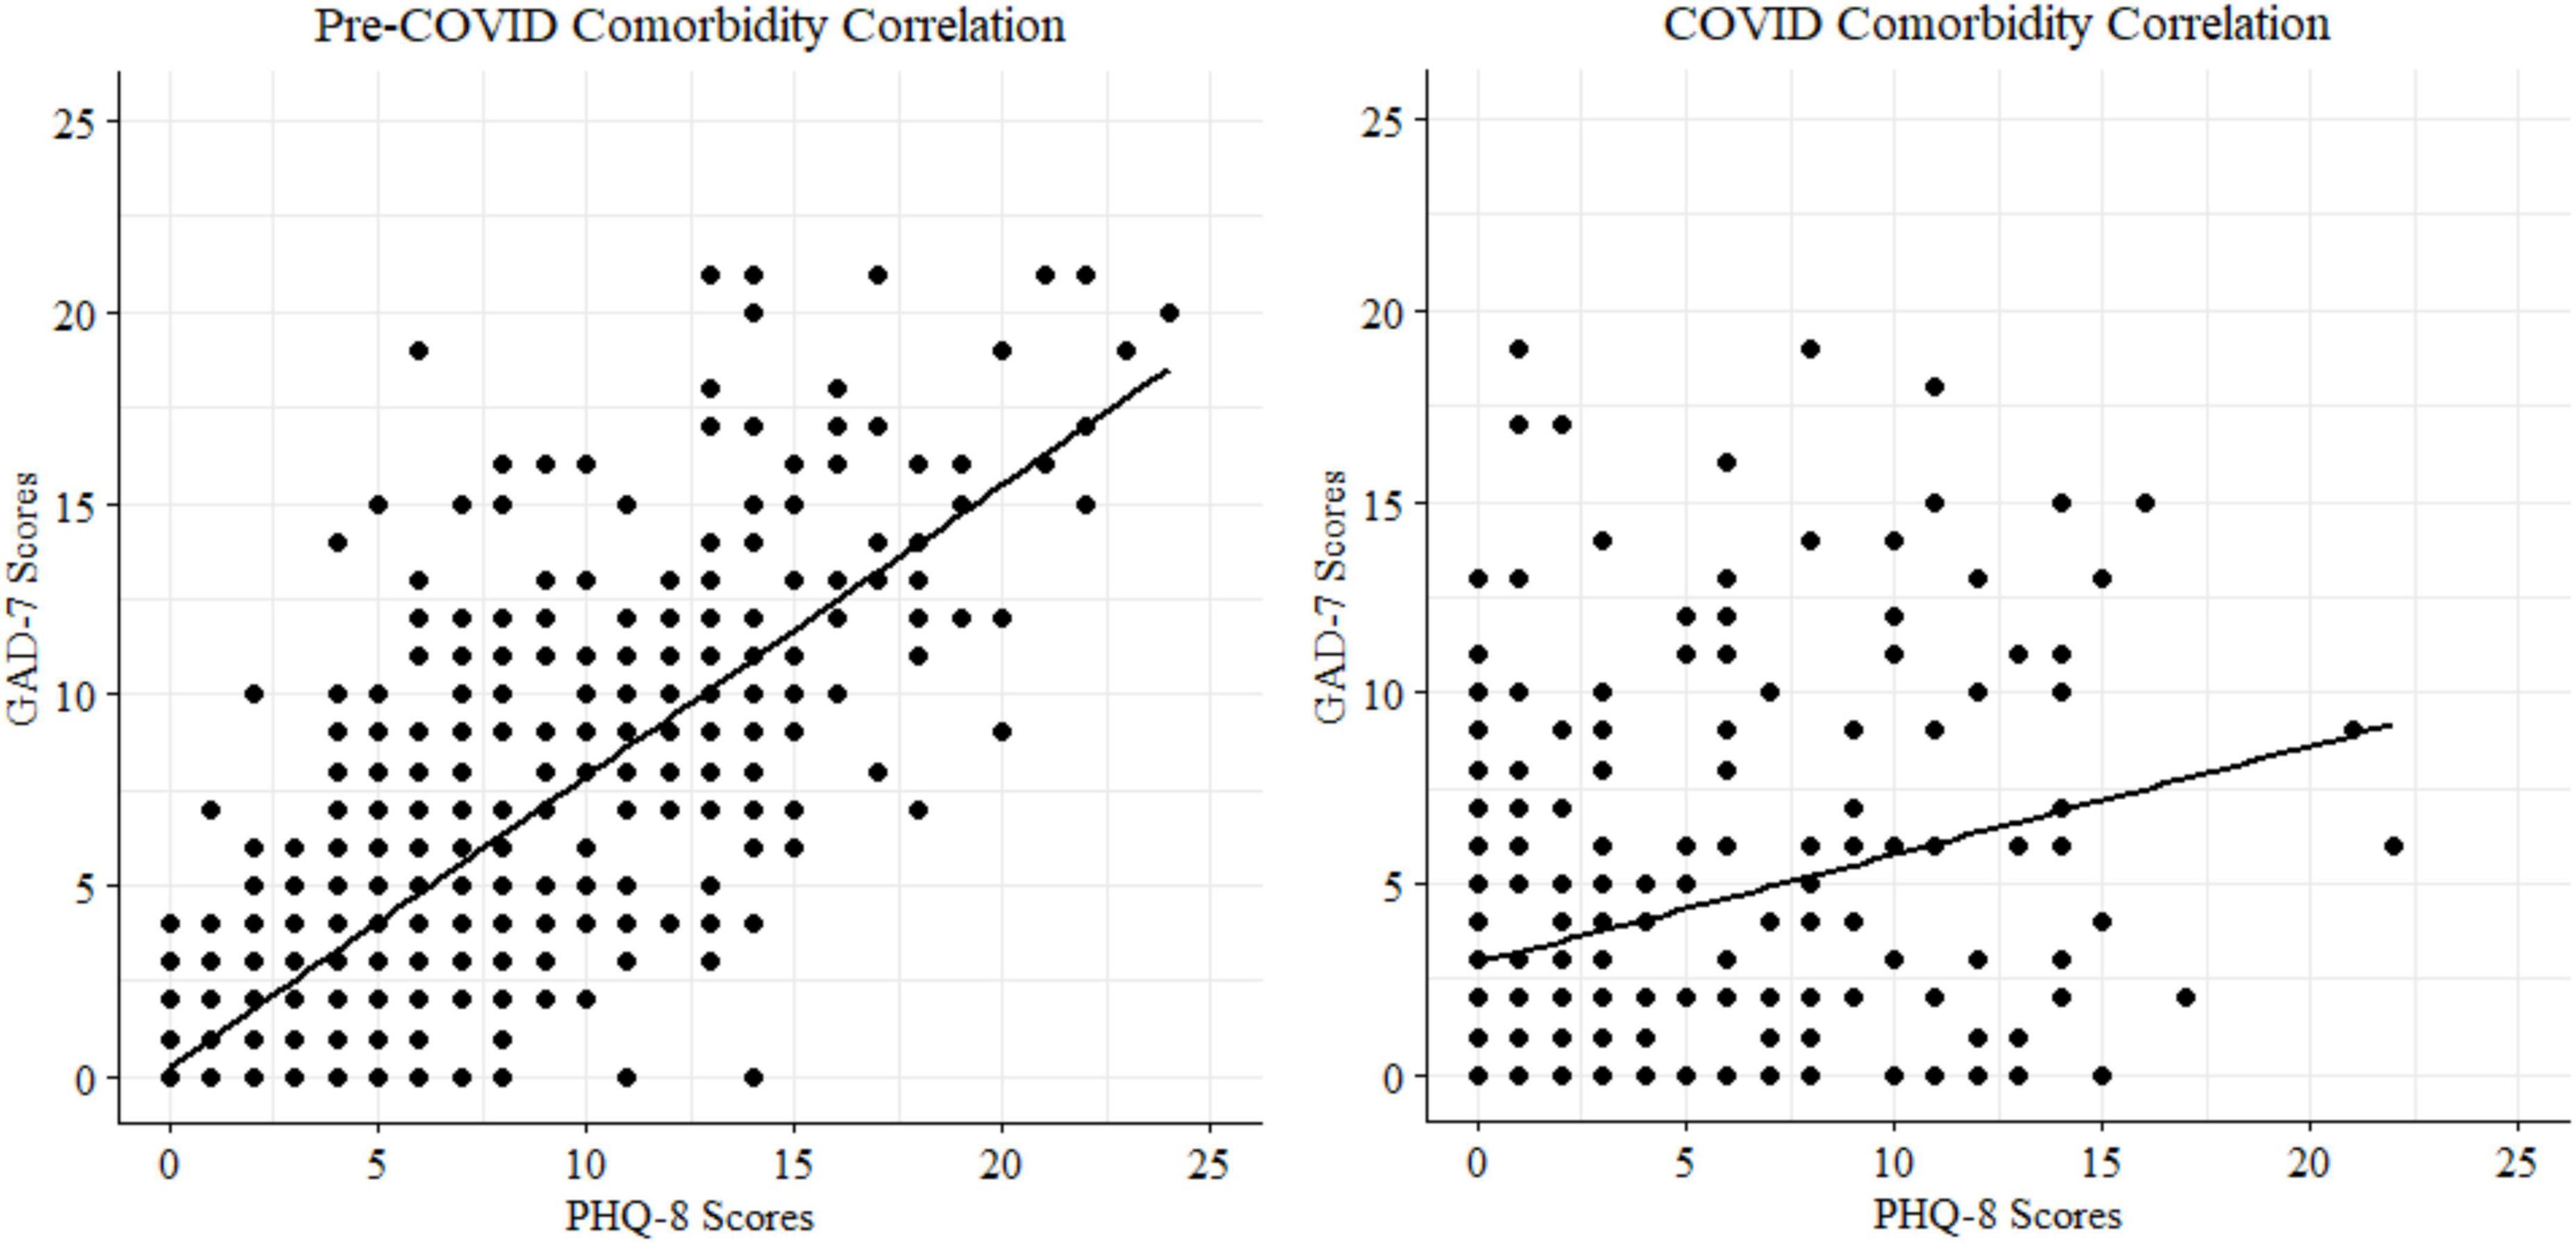
Statistically significant positive correlations (Spearman r; Figure 9) were found between depression and anxiety symptom scores for the 2018 pre-pandemic cohort [n = 716 with both PHQ8 and GAD7 datapoints; r (699) = 0.81, p < 0.001] and the 2020 pandemic cohort [N = 233; r (231) = 0.31, p < 0.001].
Discussion
This study examined mental health symptoms collected from over 1,200 online workers before and during the COVID-19 pandemic, as well as relationships between mood symptoms and cognition in the subsample collected during the pandemic. We found support for the majority of our hypotheses, including age-related slowing in response times and preserved reward function in older participants. The results replicated the mood-age interactions found in other pandemic samples (1, 7, 9, 11, 12), whereby older age is associated with lower mental health symptoms. However, analyses revealed an unexpected set of interactions: younger MTurk workers report higher mental health symptoms than older adults in the sample, which in turn negatively impacts their cognitive performance.
Perhaps the most notable finding was that compared to a pre-COVID, age-matched reference sample, there was not an increase in overall mental health symptoms (depression and anxiety) during the pandemic. This did not support hypothesis 3. Stress levels worldwide have been high during this pandemic, though lower rates have been reported in older adults in recent and past studies (2, 6, 9, 12). This resiliency may be due to higher pre-existing levels of social isolation in older adults, resulting in pandemic stay-at-home orders having a smaller impact. Social isolation may benefit older individuals because of reduced exposure to disease. Since our samples skewed older by design, this may explain the lack of difference. However, it is important to note that summer 2020 represented an early stage of the pandemic when mental health effects might not yet have become apparent in all groups. Some studies do report increases in symptoms, but trajectories differ based on demographics like gender or pre-existing health conditions (67, 68). For example, those who had a mental health diagnosis pre-pandemic were more likely to report stable mental health than those with no prior diagnoses. It is possible the already-elevated mental health symptoms in the Mturk workers we studied align with the latter set of findings. Self-reported symptoms of anxiety and depression were high in both the pre- and peri-pandemic samples (∼15–20% of the sample reporting moderate symptoms at clinical cut-offs), suggesting that online workers may generally experience higher mental health burden in a consistent manner.
Hypotheses 1 was supported, and Hypothesis 2 was partially supported (age related slowing for 2 of 3 attention tasks). We observed no effect of age on reward-related function [delay discounting task (29)]. We found statistically significant main effects of task condition: responses in the incongruent were slower than in the congruent condition, and older age was associated with slower responses during the Simons (37) and Visual Search tasks (35). These results replicate previous work showing age-related slowing during cognitive tasks in older adults (69), but preserved reward-related function (17), suggesting the data from our MTurk workforce participants bears reasonable resemblance to that of in-person lab studies (70). We did not find age related reaction time slowing for the Flanker test, possibly due to high accuracy rates/ceiling effects. The results showing no age effect on impulsivity run somewhat counter to other studies that have found changes in decision making throughout the lifespan (71), but are consistent with predictions based on socioemotional selectivity theory (17), specifically that intact reward function may be a feature of stable mental health in older adults (16).
Exploratory analysis identified a mental health-behavior relationship in the Visual Search task. There was a significant relationship between reaction time speed in the incongruent condition and anxiety symptoms, with those higher in anxiety exhibiting faster responses. Data were further analyzed using Hierarchical Bayesian Drift Diffusion modeling (56) to generate latent cognitive parameters. This analysis revealed statistically significant dissociations between symptoms of depression and anxiety. Participants higher in anxiety were faster to respond and incorporated less information when making decisions. Participants higher in depression, on the other hand, were slower to accumulate evidence in favor of a decision and more biased toward a particular response. Higher bias indicates a tendency to log the same response repetitively. It is defined for each individual based on the proportions of their responses, and therefore, at the group level, represents potentially different types of biases (e.g., a bias toward right button response and left button response cannot be differentiated). It is more analogous to the idea of “choice stickiness” and may represent deficits in set switching, specifically trouble adapting responses between congruent and incongruent trials, such as tending to over-respond that the stimulus is present when it is absent. Both depression and anxiety symptoms were related to reductions in accuracy.
These results are consistent with models of anxiety that posit that it may impact speed-accuracy tradeoffs in a manner following the Yerkes–Dodson arousal curve (72): subclinical anxiety may benefit performance, but higher anxiety decreases it. Our results showed those higher in anxiety had impairments in speed-accuracy tradeoffs, specifically shorter non-decision times, lower thresholds for making a decision (43), and less accurate decisions. The reasons for this finding deserve further study, but may be related to resolution of ambiguity aversion given that difficulty tolerating uncertainty is a vulnerability for mental health disorders, and particularly associated with anxiety (73). People with higher anxiety symptoms are more likely to interpret neutral stimuli as negative, and dislike scenarios that are more open-ended and ambiguous (73). The incongruent Visual Search condition is akin to searching for a familiar face in a crowd–one must decide when the search has been exhaustive enough to give up. This open-ended scenario may be more stressful for those with anxiety and lead to them rushing through trials, endorsing more false positives, or using guessing strategies to get through the task faster.
Conversely, higher depression symptoms were related to a pattern of responding involving lower accuracy, greater bias in responses, and slower evidence accumulation. Unlike the pattern seen with anxiety (faster/inaccurate), those higher in depression took longer to search the arrays for the missing target (accumulate evidence) in the incongruent condition. This is consistent with psychomotor slowing found in depression which is thought to be modulated by changes in dopaminergic and vascular function (19, 20, 74). These results deserve further study but suggest that in contrast to those higher in anxiety who may rush through the task, people with depression take longer to complete it because they spend more time searching for the missing target stimulus in the incongruent condition. Depression may reduce cognitive resources leading to less efficient information uptake, via impacts on fatigue, cognitive abilities, and motivation. It is not clear if people higher in depression symptoms were less capable of searching efficiently, or if they chose to take longer to search (e.g., lower motivation to complete the task efficiently), but either way it did not benefit their accuracy.
Interactions between age, mental health, and cognition were found. Younger participants reported greater mental health symptoms that negatively impacted cognition in a linear manner. This finding is notable given the recent evidence in several large scale samples that older age may be a protective factor against experiencing increased mental health symptoms during COVID (1, 7, 9, 11, 12). This study adds to this understanding by including objective behavioral evidence of cognitive dysfunction (reduced accuracy) in younger versus older adults suffering from mood symptoms. Of the participants endorsing clinically significant anxiety and depression (PHQ8 > = 10, GAD7 > = 10), two out of three were younger adults and one-third were older adults. Older adults reported lower levels of anxiety and depression on average (<5 on PHQ9 and GAD7), and those reporting slightly higher symptoms had slightly better accuracy than those with lower symptoms. These results may seem counterintuitive, however, note that the mean was higher and variance greater in younger adults. These findings suggest that subthreshold mental health symptoms may confer a benefit on some cognitive tasks in older adults, consistent with at least one study finding positive relationships between anxiety and task performance, possibly mediated by worry (75). Similarly, mild depression symptoms may benefit cognitive performance particularly in older adults; other research has shown that people who exhibit “depressive realism” tend to estimate outcomes less optimistically and therefore more accurately than those without depression (76, 77).
Finally, we observed substantial comorbidity between anxiety and depression (Spearman r of 0.81 and 0.31 for the pre- and peri-COVID samples, respectively). Model comparisons indicated that anxiety symptoms accounted for significant variance in depression scores and vice versa to similar degrees, even when accounting for age, task accuracy, and age/accuracy interactions. These findings are consistent with the high comorbidity between anxiety and depression in prior literature (78). Despite this high comorbidity, depression and anxiety symptoms were related to distinct latent cognitive parameters, suggesting that they are dissociable behaviorally.
Taken together these results reveal a dose-dependent relationship of mental health symptoms on cognitive performance, as well as age-related differences in mental health burden with significant impacts on cognitive function in younger adults.
Limitations
There are strengths and limitations to using Amazon MTurk for data collection. First, data quality control requires extra time and care when participants complete the study in unknown conditions. To mitigate these impacts, we followed pre-registered criteria for exclusions based on accuracy, resulting in removal of approximately 15–30% of each tasks’ dataset before analysis. Additionally, a narrative form question was used to screen for auto-completer bots and participants lacking proficiency in English. Finally, we removed datasets with a high rate of “false positive” button presses (<2 ms) before conducting computational modeling analysis. We utilized Bayesian methods that are more accurate and robust to outliers to further increase the reliability of our findings (60).
Cohort effects may drive the age-related differences in mood symptoms and deserve further detailed study. For example, older MTurk workers may be higher in technical proficiency than community dwelling peer samples. This may be because the MTurk workforce is more educated than the general population (51, 52). They may be closer to a “super-ager” population who engage in online work for extra income and mental stimulation (79). They may also benefit from greater economic stability during their retirement from full time work, compared to younger Mturk workers. It is also possible older MTurk workers under-report mental health symptoms due to generational differences in stigma or age-specific stress factors. Such cohort effects likely contribute to some degree to the reported disparities in mental health symptoms. However, the suprathreshold symptom counts in younger adults show a clearly negative impact on cognition: higher errors, worse speed-accuracy tradeoffs, and slow, inaccurate performance.
A potential strength of our approach is access to a geographically and demographically diverse sample (relative to student convenience samples which are unlikely to be representative of the national US population). Participants completed the study in naturalistic conditions that reflect their typical work environment, and this may result in more accurate reporting of mental health symptoms due to the lack of study demand characteristics, such as a researcher observing their behavior (80). However, note that gig economy workers such as those on Amazon MTurk, likely differ from other people working from home in more traditionally hierarchical employment, even if they match on other demographic factors such as income and education. Additionally, we generally saw higher symptom self-report than typically found in the general population, which requires additional effort for participants to report (e.g., choosing between different symptom frequencies, vs. expending minimal effort by reporting no symptoms at all). Participants have no opportunity to gain monetarily or otherwise from reporting greater symptoms. The data also replicate the results from larger samples of online and younger workers (51, 52), suggesting the self-reports are likely to be accurate. However, the demand characteristics of teleresearch settings deserve future study (80).
Additionally, the high accuracy in most task conditions suggests that the sensitivity to detect effects of mental health on task performance may have been impacted by ceiling effects. The significant results between behavior and mood when examining the Visual Search task (35) may be related to increased difficulty producing a greater range of behavior (e.g., more false positives). Future studies could use adaptive versions of the cognitive tasks to see whether this improves sensitivity to detect mood effects on cognition.
Finally, while we confirmed hypothesis 1 using the preregistered criteria of failing to reject the null while testing the age-delay discounting relationship, this is not to be considered the same as evidence in favor of the null. A more robust approach future studies could take might include a Bayes Factor to estimate the support for the null (81, 82).
Future directions
Future studies could use remote data collection of objective brain activity using an EEG array (83, 84), have participants undergo brain stimulation using a device such as transcutaneous vagus nerve stimulation (85) or transcranial direct current stimulation, or undergo fMRI scanning (86) to more directly measure relationships between brain state, mood, and cognitive performance. Future studies with a larger sample size should also enable modeling with a training set and a test set to generate more precise statistical estimates of mood symptom-behavior relationships.
Conclusion
We identified differential patterns of mood-behavior relationships in younger vs. older online workers, with younger participants reporting high rates of anxiety and depression symptoms. These mood symptoms related to dissociable patterns of cognitive dysfunction: faster/inaccurate for those reporting higher anxiety, and slower/inaccurate for those reporting higher depression symptoms. These patterns differed by age, with older adults showing relatively preserved cognitive performance (slightly slower than younger participants, as hypothesized, but not differing on accuracy), and a mildly beneficial effect of subclinical anxiety and depression symptoms. There were no significant differences in average depression and anxiety symptoms compared to an age-matched pre-COVID reference sample (14). These results suggest a stable but concerning relationship between high mental health burden and worse cognitive function in younger adults working online. Increased access to mental health services in this group could potentially mitigate the impacts of the pandemic on wellbeing, workforce participation, and long-term health outcomes. Telehealth or smartphone-based mental health services may be particularly relevant for younger online workers.
Data availability statement
The raw data supporting the conclusions of this article will be made available by the authors, without undue reservation.
Ethics statement
The studies involving human participants were reviewed and approved by the Stanford University IRB. The patients/participants provided their written informed consent to participate in this study.
Author contributions
CM-F: study design, implementation, data analysis, data visualization, and manuscript preparation. HS: data analysis, data visualization, and manuscript preparation. NH: study implementation and data collection. SN: study design and data collection. TH and RO’H: manuscript preparation. SB: manuscript preparation and data analysis. All authors contributed to the article and approved the submitted version.
Funding
This study was funded by the Gorilla Experiment Builder and Kaggle, and supported by a Veterans Administration Mental Illness Research, Education, and Clinical Care Fellowship as well as a Career Development Award Grant #: 1IK2CX001916 awarded to CM-F.
Conflict of interest
The authors declare that the research was conducted in the absence of any commercial or financial relationships that could be construed as a potential conflict of interest.
Publisher’s note
All claims expressed in this article are solely those of the authors and do not necessarily represent those of their affiliated organizations, or those of the publisher, the editors and the reviewers. Any product that may be evaluated in this article, or claim that may be made by its manufacturer, is not guaranteed or endorsed by the publisher.
References
1. Varma P, Junge M, Meaklim H, Jackson M. Younger people are more vulnerable to stress, anxiety and depression during COVID-19 pandemic: a global cross-sectional survey. Prog Neuropsychopharmacol Biol Psychiatry. (2021) 109:110236. doi: 10.1016/j.pnpbp.2020.110236
2. Nwachukwu I, Nkire N, Shalaby R, Hrabok M, Vuong W, Gusnowski A, et al. COVID-19 pandemic: age-related differences in measures of stress, anxiety and depression in Canada. Int J Environ Res Public Health. (2020) 17:6366. doi: 10.3390/ijerph17176366
3. Czeisler M, Lane R, Petrosky E, Wiley J, Christensen A, Njai R, et al. Mental health, substance use, and suicidal ideation during the COVID-19 pandemic — United States, June 24–30, 2020. MMWR Morb Mortal Wkly Rep. (2020) 69:1049–57. doi: 10.15585/mmwr.mm6932a1
4. Graupensperger S, Fleming C, Jaffe A, Rhew I, Patrick M, Lee C. Changes in young adults’ alcohol and marijuana use, norms, and motives from before to during the COVID-19 pandemic. J Adolesc Health. (2021) 68:658–65. doi: 10.1016/j.jadohealth.2021.01.008
5. Sharma P, Ebbert J, Rosedahl J, Philpot L. Changes in substance use among young adults during a respiratory disease pandemic. SAGE Open Med. (2020) 8:205031212096532. doi: 10.1177/2050312120965321
6. Na L, Yang L, Mezo P, Liu R. Age disparities in mental health during the COVID19 pandemic: the roles of resilience and coping. Soc Sci Med. (2022) 305:115031. doi: 10.1016/j.socscimed.2022.115031
7. Li F, Luo S, Mu W, Li Y, Ye L, Zheng X, et al. Effects of sources of social support and resilience on the mental health of different age groups during the COVID-19 pandemic. BMC Psychiatry. (2021) 21:16. doi: 10.1186/s12888-020-03012-1
8. MacLeod S, Musich S, Hawkins K, Alsgaard K, Wicker E. The impact of resilience among older adults. Geriatr Nurs. (2016) 37:266–72. doi: 10.1016/j.gerinurse.2016.02.014
9. Yeung D, Fung H. Age differences in coping and emotional responses toward SARS: a longitudinal study of Hong Kong Chinese. Aging Ment Health. (2007) 11:579–87. doi: 10.1080/13607860601086355
10. Chen L. Older adults and COVID-19 pandemic: resilience matters. Arch Gerontol Geriatr. (2020) 89:104124. doi: 10.1016/j.archger.2020.104124
11. Wilson J, Lee J, Shook N. COVID-19 worries and mental health: the moderating effect of age. Aging Ment Health. (2021) 25:1289–96. doi: 10.1080/13607863.2020.1856778
12. Staneva A, Carmignani F, Rohde N. Personality, gender, and age resilience to the mental health effects of COVID-19. Soc Sci Med. (2022) 301:114884. doi: 10.1016/j.socscimed.2022.114884
13. Open Science Framework,. Characterizing Attention to Reward in Healthy Aging. (2020). Available online at: https://osf.io/h4p5a/ (accessed February 3, 2022).
14. Mills-Finnerty C, Hogoboom N, Cline C, Rolle C, Naparstek S, Khadr M, et al. Aging online: characterizing attention, reward function, and mental health in older online workers. Biol Psychiatry. (2021) 89:S215. doi: 10.1016/j.biopsych.2021.02.543
15. Skinner E. A guide to constructs of control. J Pers Soc Psychol. (1996) 71:549–70. doi: 10.1037/0022-3514.71.3.549
16. Mather M, Knight M. Goal-directed memory: the role of cognitive control in older adults’ emotional memory. Psychol Aging. (2005) 20:554–70. doi: 10.1037/0882-7974.20.4.554
17. Carstensen L, Isaacowitz D, Charles S. Taking time seriously: a theory of socioemotional selectivity. Am Psychol. (1999) 54:165–81. doi: 10.1037/0003-066X.54.3.165
18. Mather M, Carstensen L. Aging and motivated cognition: the positivity effect in attention and memory. Trends Cogn Sci. (2005) 9:496–502. doi: 10.1016/j.tics.2005.08.005
19. Wengler K, Ashinoff B, Pueraro E, Cassidy C, Horga G, Rutherford B. Association between neuromelanin-sensitive MRI signal and psychomotor slowing in late-life depression. Neuropsychopharmacology. (2021) 46:1233–9. doi: 10.1038/s41386-020-00860-z
20. Bennabi D, Vandel P, Papaxanthis C, Pozzo T, Haffen E. Psychomotor retardation in depression: a systematic review of diagnostic, pathophysiologic, and therapeutic implications. BioMed Res Int. (2013) 2013:1–18. doi: 10.1155/2013/158746
21. Chen M, Chang W, Tu P, Lin W, Li C, Huang W, et al. Association of cognitive impairment and reduced cortical thickness in prefrontal cortex and anterior cingulate cortex with treatment-resistant depression. Brain Imaging Behav. (2022) 16:1854–62. doi: 10.1007/s11682-021-00613-6
22. Wang M, Greenberg M, Forkert ND, Chekouo T, Afriyie G, Ismail Z, et al. Dementia risk prediction in individuals with mild cognitive impairment: a comparison of Cox regression and machine learning models. BMC Med Res Methodol. (2022) 22:284. doi: 10.1186/s12874-022-01754-y
23. Anderson N, Murphy K, Troyer A. Living With Mild Cognitive Impairment: A Guide to Maximizing Brain Health and Reducing Risk of Dementia. Oxford: Oxford University Press (2012).
24. Korhonen K, Tarkiainen L, Leinonen T, Einiö E, Martikainen P. Association between a history of clinical depression and dementia, and the role of sociodemographic factors: population-based cohort study. Br J Psychiatry. (2022) 221:410–6. doi: 10.1192/bjp.2021.217
25. Spitzer R, Kroenke K, Williams J, Löwe B. A brief measure for assessing generalized anxiety disorder: the GAD-7. Arch Intern Med. (2006) 166:1092. doi: 10.1001/archinte.166.10.1092
26. Kroenke K, Strine T, Spitzer R, Williams J, Berry J, Mokdad A. The PHQ-8 as a measure of current depression in the general population. J Affect Disord. (2009) 114:163–73. doi: 10.1016/j.jad.2008.06.026
27. Kroenke K, Spitzer R, Williams J. The PHQ-9: validity of a brief depression severity measure. J Gen Intern Med. (2001) 16:606–13. doi: 10.1046/j.1525-1497.2001.016009606.x
28. Diener E, Emmons R, Larsen R, Griffin S. The satisfaction with life scale. J Pers Assess. (1985) 49:71–5. doi: 10.1207/s15327752jpa4901_13
29. da Matta A, Gonçalves F, Bizarro L. Delay discounting: concepts and measures. Psychol Neurosci. (2012) 5:135–46. doi: 10.3922/j.psns.2012.2.03
30. Odum A. Delay discounting: I’m a k, you’re a k. J Exp Anal Behav. (2011) 96:427–39. doi: 10.1901/jeab.2011.96-423
31. Rodzon K, Berry M, Odum A. Within-subject comparison of degree of delay discounting using titrating and fixed sequence procedures. Behav Processes. (2011) 86:164–7. doi: 10.1016/j.beproc.2010.09.007
32. Eriksen B, Eriksen C. Effects of noise letters upon the identification of a target letter in a nonsearch task. Percept Psychophys. (1974) 16:143–9. doi: 10.3758/BF03203267
33. Eriksen C. Location of objects in a visual display as a function of the number of dimensions on which the objects differ. J Exp Psychol. (1952) 44:55–61.
35. Eriksen C. Partitioning and saturation of visual displays and efficiency of visual search. J App Psychol. (1995) 39:73–7.
36. Simon J, Small A. Processing auditory information: interference from an irrelevant cue. J Appl Psychol. (1969) 53:433–5. doi: 10.1037/h0028034
37. Simon J, Wolf J. Choice reaction time as a function of angular stimulus-response correspondence and age. Ergonomics. (1963) 6:99–105. doi: 10.1080/00140136308930679
38. Cespón J, Hommel B, Korsch M, Galashan D. The neurocognitive underpinnings of the Simon effect: an integrative review of current research. Cogn Affect Behav Neurosci. (2020) 20:1133–72. doi: 10.3758/s13415-020-00836-y
39. Kornblum S, Hasbroucq T, Osman A. Dimensional overlap: cognitive basis for stimulus-response compatibility–a model and taxonomy. Psychol Rev. (1990) 97:253–70. doi: 10.1037/0033-295X.97.2.253
40. Shin C, Lee S, Han K, Yoon H, Han C. Comparison of the usefulness of the PHQ-8 and PHQ-9 for screening for major depressive disorder: analysis of psychiatric outpatient data. Psychiatry Investig. (2019) 16:300–5. doi: 10.30773/pi.2019.02.01
41. Razykov I, Ziegelstein R, Whooley M, Thombs B. The PHQ-9 versus the PHQ-8 — Is item 9 useful for assessing suicide risk in coronary artery disease patients? Data from the heart and soul study. J Psychosom Res. (2012) 73:163–8. doi: 10.1016/j.jpsychores.2012.06.001
42. Peters L, Peters A, Andreopoulos E, Pollock N, Pande R, Mochari-Greenberger H. Comparison of DASS-21, PHQ-8, and GAD-7 in a virtual behavioral health care setting. Heliyon. (2021) 7:e06473. doi: 10.1016/j.heliyon.2021.e06473
43. Xia L, Gu R, Zhang D, Luo Y. Anxious individuals are impulsive decision-makers in the delay discounting task: an ERP study. Front Behav Neurosci. (2017) 11:5. doi: 10.3389/fnbeh.2017.00005
44. Kb Lemley S, Reed D, Jarmolowicz D. 21- and 27-Item Monetary Choice Questionnaire Automated Scorer [Spreadsheet Application]. (2014). Available online at: http://hdl.handle.net/1808/15424 (accessed March 27, 2020).
45. Harris PA, Taylor R, Minor BL, Elliott V, Fernandez M, O'Neal L, et al. The REDCap consortium: building an international community of software platform partners. J Biomed Inform. (2019) 95:103208. doi: 10.1016/j.jbi.2019.103208
46. Hp Taylor R, Thielke R, Payne J, Gonzalez N, Conde J. Research electronic data capture (REDCap) – A metadata-driven methodology and workflow process for providing translational research informatics support. J Biomed Inform. (2009) 42:377–81.
47. Anwyl-Irvine A, Massonnié J, Flitton A, Kirkham N, Evershed J. Gorilla in our midst: an online behavioral experiment builder. Behav Res Methods. (2020) 52:388–407. doi: 10.3758/s13428-019-01237-x
48. Fj Krishnan E, Rose M, Lingala B, Bruce B. Improved responsiveness and reduced sample size requirements of PROMIS physical function scales with item response theory. Arthritis Res Ther. (2011) 13:R147.
49. Cella D, Riley W, Stone A, Rothrock N, Reeve B, Yount S, et al. The Patient-Reported Outcomes Measurement Information System (PROMIS) developed and tested its first wave of adult self-reported health outcome item banks: 2005–2008. J Clin Epidemiol. (2010) 63:1179–94. doi: 10.1016/j.jclinepi.2010.04.011
50. Amazon Mechanical Turk, Inc. Access a Global, On-Demand, 24x7 Workforce. (2018). Available online at: https://www.mturk.com (accessed February 3, 2022).
51. Moss A, Rosenzweig C, Robinson J, Jaffe S, Litman L. Is it ethical to use mechanical turk for behavioral research? Relevant data from a representative survey of MTurk participants and wages. PsyArXiv [Preprint]. (2020). doi: 10.31234/osf.io/jbc9d
52. Difallah D, Filatova E, Ipeirotis P. Demographics and dynamics of mechanical turk workers. In: Proceedings of the 11th ACM International Conference on Web Search and Data Mining. New York, NY: ACM (2018). p. 135–43. doi: 10.1145/3159652.3159661
53. Anderson S, Kelley K, Maxwell S. Sample-size planning for more accurate statistical power: a method adjusting sample effect sizes for publication bias and uncertainty. Psychol Sci. (2017) 28:1547–62. doi: 10.1177/0956797617723724
54. R Core Team. R: A Language and Environment for Statistical Computing. (2020). Vienna: R Core Team.
55. Bates D, Mächler M, Bolker B, Walker S. Fitting linear mixed-effects models using lme4. J Stat Softw. (2015) 67:1–48. doi: 10.18637/jss.v067.i01
56. Ahn W, Haines N, Zhang L. Revealing neurocomputational mechanisms of reinforcement learning and decision-making with the hBayesDM package. Comput Psychiatry. (2017) 1:24. doi: 10.1162/CPSY_a_00002
57. Wickham H. Ggplot2: Elegant Graphics for Data Analysis. 2nd ed. New York, NY: Springer International Publishing (2016). doi: 10.1007/978-3-319-24277-4
58. Kassambara A. ggpubr: ggplot2 Based Publication Ready Plots. (2020). Available online at: https://github.com/kassambara/ggpubr/ (accessed January 7, 2022).
59. Lüdecke D. sjPlot: Data Visualization for Statistics in Social Science. (2021). Available online at: https://www.rdocumentation.org/packages/sjPlot/versions/2.8.10 (accessed January 7, 2022).
60. Vandekerckhove J, Tuerlinckx F, Lee M. Hierarchical diffusion models for two-choice response times. Psychol Methods. (2011) 16:44–62. doi: 10.1037/a0021765
61. Ratcliff R, McKoon G. The diffusion decision model: theory and data for two-choice decision tasks. Neural Comput. (2008) 20:873–922. doi: 10.1162/neco.2008.12-06-420
62. Shiffrin R, Lee M, Kim W, Wagenmakers E. A survey of model evaluation approaches with a tutorial on hierarchical bayesian methods. Cogn Sci. (2008) 32:1248–84. doi: 10.1080/03640210802414826
63. Gamerman D, Lopes H. Markov Chain Monte Carlo: Stochastic Simulation for Bayesian Inference. 2nd ed. (2006). Milton Park: Taylor and Francis.
64. Ratcliff R, Tuerlinckx F. Estimating parameters of the diffusion model: approaches to dealing with contaminant reaction times and parameter variability. Psychon Bull Rev. (2002) 9:438–81. doi: 10.3758/BF03196302
65. Griffiths T, Kemp C, Tenenbaum J. Bayesian models of cognition. In: R Sun editor. Cambridge Handbook of Computational Cognitive Modeling. Cambridge: Cambridge University Press (2008). p. 59–100.
66. Bender R, Lange S. Adjusting for multiple testing—when and how? J Clin Epidemiol. (2001) 54:343–9. doi: 10.1016/S0895-4356(00)00314-0
67. Thorpe W, Gutman L. The trajectory of mental health problems for UK emerging adults during COVID-19. J Psychiatr Res. (2022) 156:491–7. doi: 10.1016/j.jpsychires.2022.10.068
68. Fancourt D, Steptoe A, Bu F. Trajectories of anxiety and depressive symptoms during enforced isolation due to COVID-19 in England: a longitudinal observational study. Lancet Psychiatry. (2021) 8:141–9. doi: 10.1016/S2215-0366(20)30482-X
69. Hybels C, Landerman L, Blazer D. Age differences in symptom expression in patients with major depression: age differences in depressive symptoms. Int J Geriatr Psychiatry. (2012) 27:601–11. doi: 10.1002/gps.2759
70. Krampe R, Doumas M, Lavrysen A, Rapp M. The costs of taking it slowly: fast and slow movement timing in older age. Psychol Aging. (2010) 25:980–90. doi: 10.1037/a0020090
71. Carpenter S, Yoon C. Aging and consumer decision making: Carpenter & Yoon. Ann N Y Acad Sci. (2011) 1235:E1–12. doi: 10.1111/j.1749-6632.2011.06390.x
73. Beck A, Clark D. Anxiety and depression: an information processing perspective. Anxiety Res. (1988) 1:23–36. doi: 10.1080/10615808808248218
74. Bekhbat M, Goldsmith D, Woolwine B, Haroon E, Miller A, Felger J. Transcriptomic signatures of psychomotor slowing in peripheral blood of depressed patients: evidence for immunometabolic reprogramming. Mol Psychiatry. (2021) 26:7384–92. doi: 10.1038/s41380-021-01258-z
75. Beaudreau S, Hantke N, Mashal N, Gould C, Henderson V, O’Hara R. Unlocking neurocognitive substrates of late-life affective symptoms using the research domain criteria: worry is an essential dimension. Front Aging Neurosci. (2017) 9:380. doi: 10.3389/fnagi.2017.00380
76. Alloy L, Abramson L. Judgment of contingency in depressed and nondepressed students: sadder but wiser? J Exp Psychol Gen. (1979) 108:441–85. doi: 10.1037/0096-3445.108.4.441
77. Alloy L, Abramson L. Learned helplessness, depression, and the illusion of control. J Pers Soc Psychol. (1982) 42:1114–26. doi: 10.1037/0022-3514.42.6.1114
78. Brown T, Campbell L, Lehman C, Grisham J, Mancill R. Current and lifetime comorbidity of the DSM-IV anxiety and mood disorders in a large clinical sample. J Abnorm Psychol. (2001) 110:585–99. doi: 10.1037/0021-843X.110.4.585
79. Ryff C, Heller A, Schaefer S, van Reekum C, Davidson R. Purposeful engagement, healthy aging, and the brain. Curr Behav Neurosci Rep. (2016) 3:318–27. doi: 10.1007/s40473-016-0096-z
80. McCambridge J, de Bruin M, Witton J. The effects of demand characteristics on research participant behaviours in non-laboratory settings: a systematic review. PLoS One. (2012) 7:e39116. doi: 10.1371/journal.pone.0039116
81. Dienes Z. Using Bayes to get the most out of non-significant results. Front Psychol. (2014) 5:781. doi: 10.3389/fpsyg.2014.00781
82. Leppink J, O’Sullivan P, Winston K. Evidence against vs. in favour of a null hypothesis. Perspect Med Educ. (2017) 6:115–8. doi: 10.1007/s40037-017-0332-6
83. Ke H, Chen D, Shah T, Liu X, Zhang X, Zhang L, et al. Cloud-aided online EEG classification system for brain healthcare: a case study of depression evaluation with a lightweight CNN. Softw Pract Exp. (2020) 50:596–610. doi: 10.1002/spe.2668
84. Ke H. Improving brain e-health services via high-performance EEG classification with grouping Bayesian optimization. IEEE Trans Serv Comput. (2020) 13:696–708.
85. Breit S, Kupferberg A, Rogler G, Hasler G. Vagus nerve as modulator of the brain–gut axis in psychiatric and inflammatory disorders. Front Psychiatry. (2018) 9:44. doi: 10.3389/fpsyt.2018.00044
Keywords: COVID-19, depression, anxiety, behavior and cognition, computational modeling, Bayesian analysis
Citation: Mills-Finnerty C, Staggs H, Hogoboom N, Naparstek S, Harvey T, Beaudreau SA and O’Hara R (2023) Association between mental health symptoms and behavioral performance in younger vs. older online workers. Front. Psychiatry 14:995445. doi: 10.3389/fpsyt.2023.995445
Received: 15 July 2022; Accepted: 25 January 2023;
Published: 29 March 2023.
Edited by:
Laura K. M. Han, University of Melbourne, AustraliaReviewed by:
Prerna Varma, Monash University, AustraliaJamil Palacios Bhanji, Rutgers University, United States
Fengqin Wang, Hubei Normal University, China
Copyright © 2023 Mills-Finnerty, Staggs, Hogoboom, Naparstek, Harvey, Beaudreau and O’Hara. This is an open-access article distributed under the terms of the Creative Commons Attribution License (CC BY). The use, distribution or reproduction in other forums is permitted, provided the original author(s) and the copyright owner(s) are credited and that the original publication in this journal is cited, in accordance with accepted academic practice. No use, distribution or reproduction is permitted which does not comply with these terms.
*Correspondence: Colleen Mills-Finnerty, cmfinn@stanford.edu
†ORCID: Halee Staggs, orcid.org/0000-0003-3634-8896; Nichole Hogoboom, orcid.org/0000-0003-3291-837X
 Colleen Mills-Finnerty