 Yu-Mei Li
 Kenn Konstabel
 René Mõttus
 Sakari Lemola
- 1Department of Psychology, Bielefeld University, Bielefeld, Germany
- 2National Institute of Health Development, Tallinn, Estonia
- 3Department of Psychology, University of Tartu, Tartu, Estonia
- 4Department of Psychology, University of Edinburgh, Edinburgh, United Kingdom
- 5Department of Psychology, University of Warwick, Coventry, United Kingdom
A corrigendum on
Temporal associations between objectively measured physical activity and depressive symptoms: an experience sampling study
by Li, Y.-M., Konstabel, K., Mõttus, R., and Lemola, S. (2022). Front. Psychiatry 13:920580. doi: 10.3389/fpsyt.2022.920580
The following corrections were made because of two issues. First, the daylight-saving time in autumn 2017 and spring 2018 in the sensor data of 15 participants was not adjusted, which resulted in a misalignment of plus or minus one hour between the sensor data and the ESM questionnaire data. The problem arose when data collection ran across daylight-saving time, when a sensor was set up before time change and did not automatically adjust for time change but mobile phones automatically did adjust the time. The sensor data of eight and seven participants were adjusted for the time change in autumn 2017 and spring 2018, respectively. Second, some coding mistakes in the time window calculation were found.
In the published article, there was an error in Table 1 and Figures 1, 2 as published.
In Table 1, the values for physical activity and physical activity in MET were corrected. The values in Figures 1 and 2 were corrected.
The corrected Table 1 and Figures 1, 2 and their captions appear below.
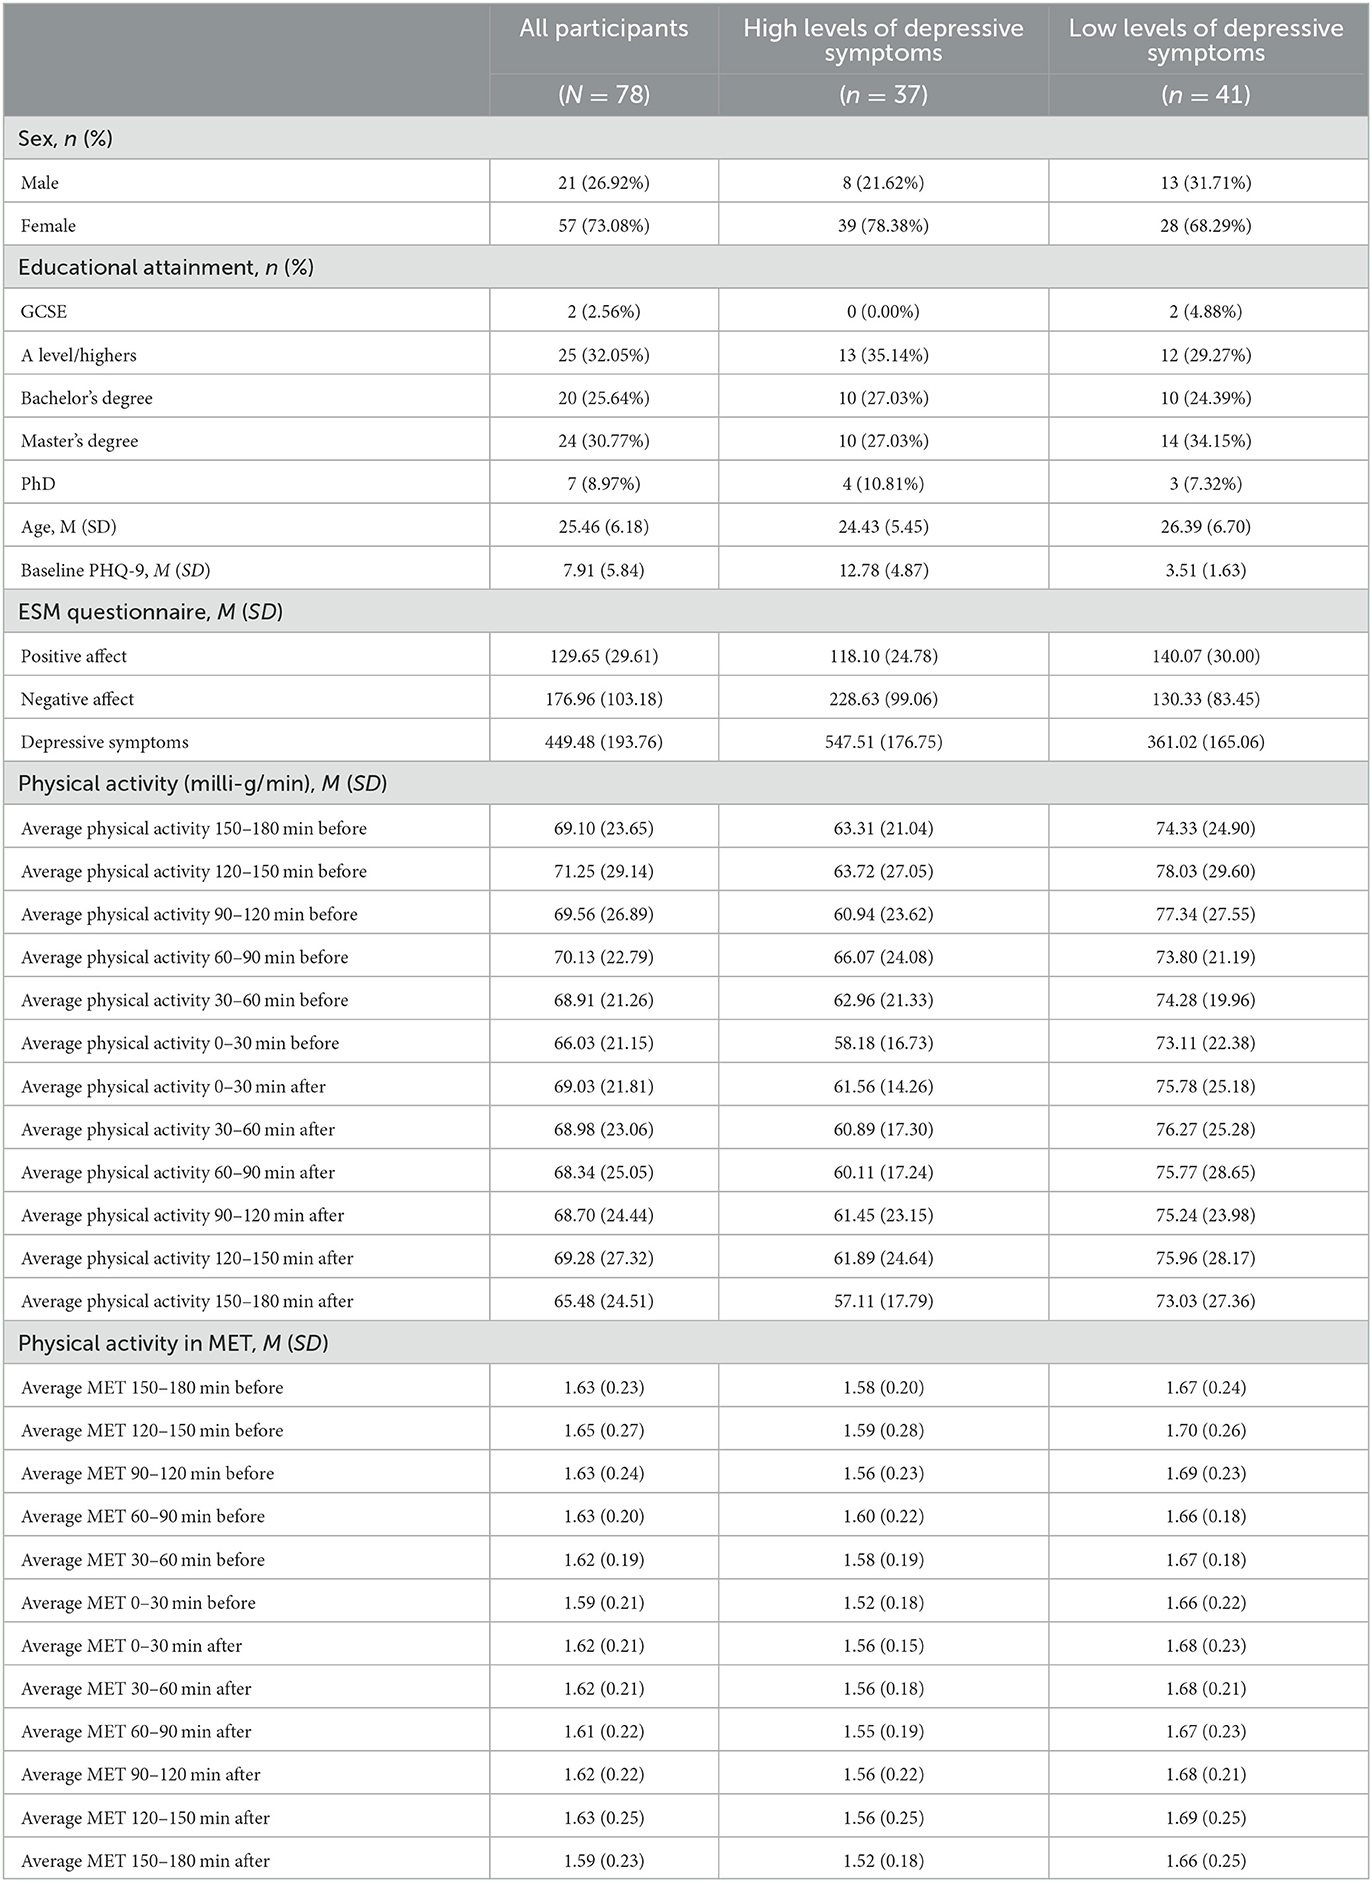
Table 1. Descriptive statistics.

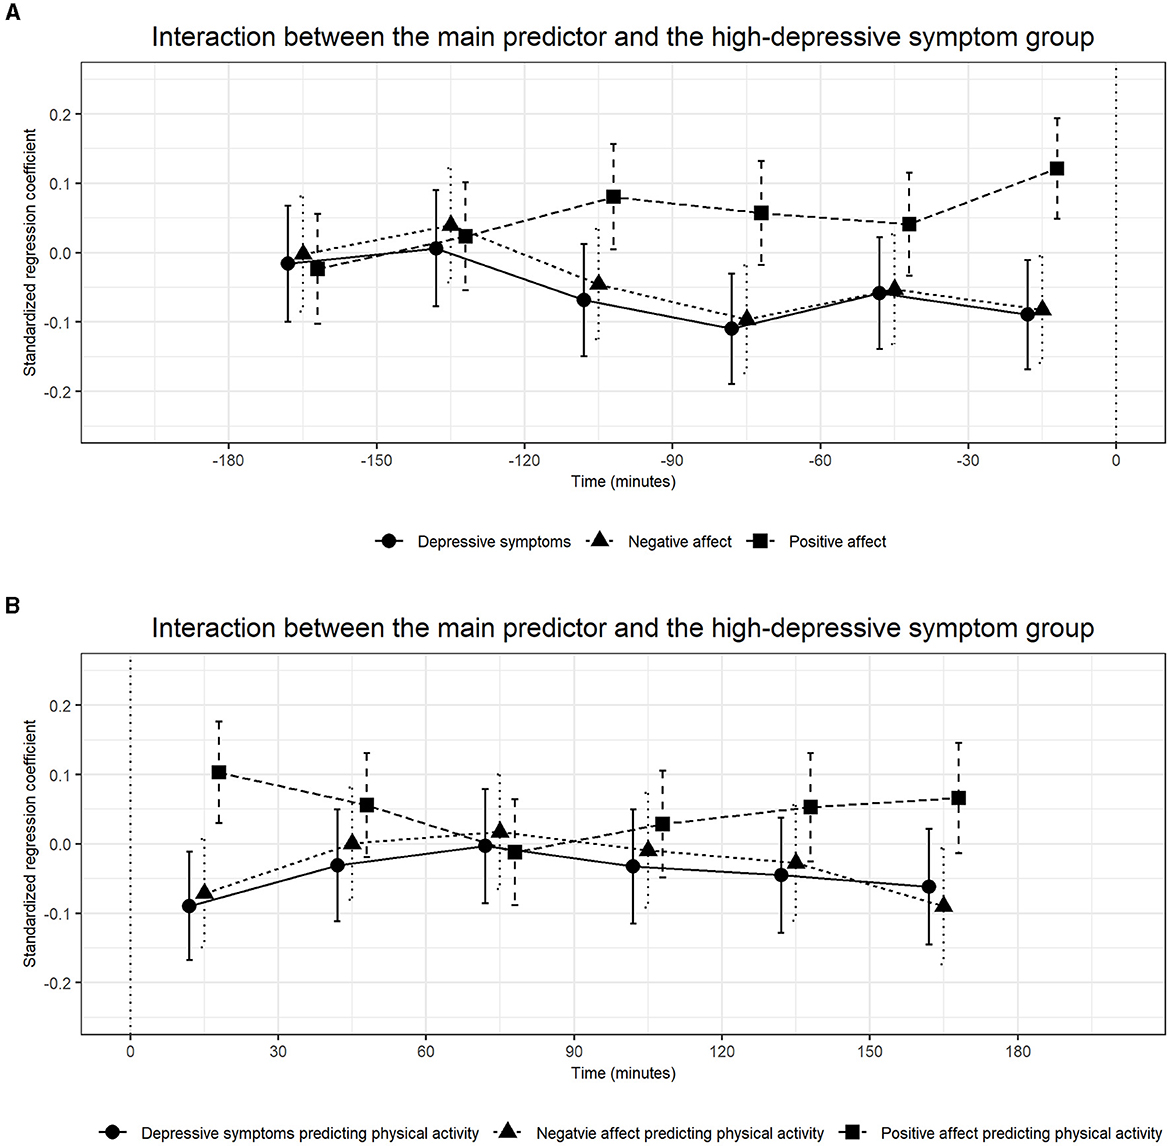
Figure 1. The standardized betas and confidence intervals of multilevel models in which physical activity predicted the subsequently measured dependent variables (DVs) positive affect, negative affect, and depressive symptoms (A–D) and models in which the independent variables (IVs) positive affect, negative affect, and depressive symptoms predicted subsequent physical activity (E–H). Results for all participants (unstratified) (A, E). Results for positive affect (B, F), negative affect (C, G), and depressive symptoms (D, H) are stratified by baseline levels of depressive symptoms.
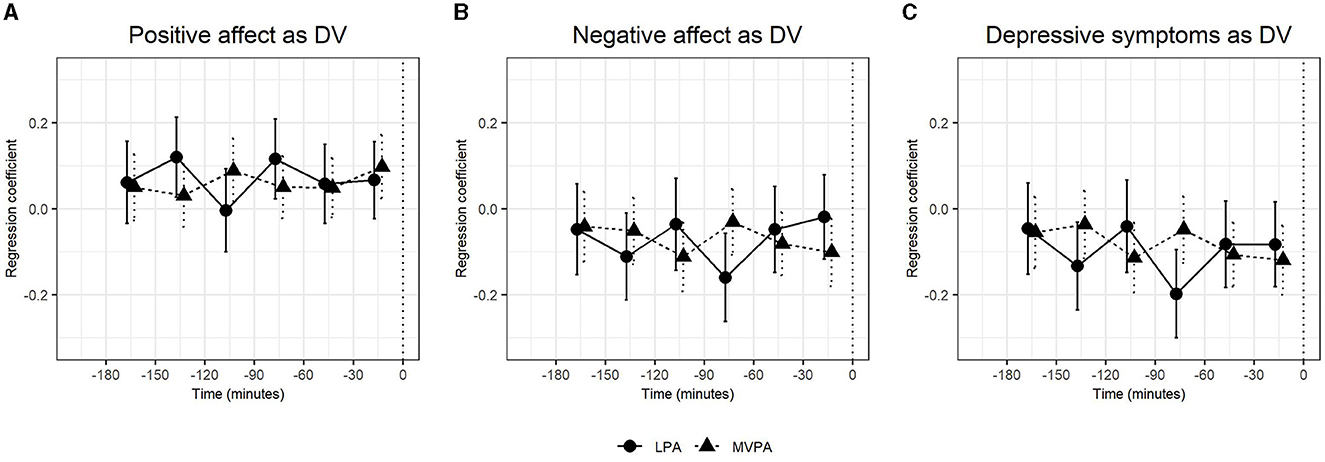
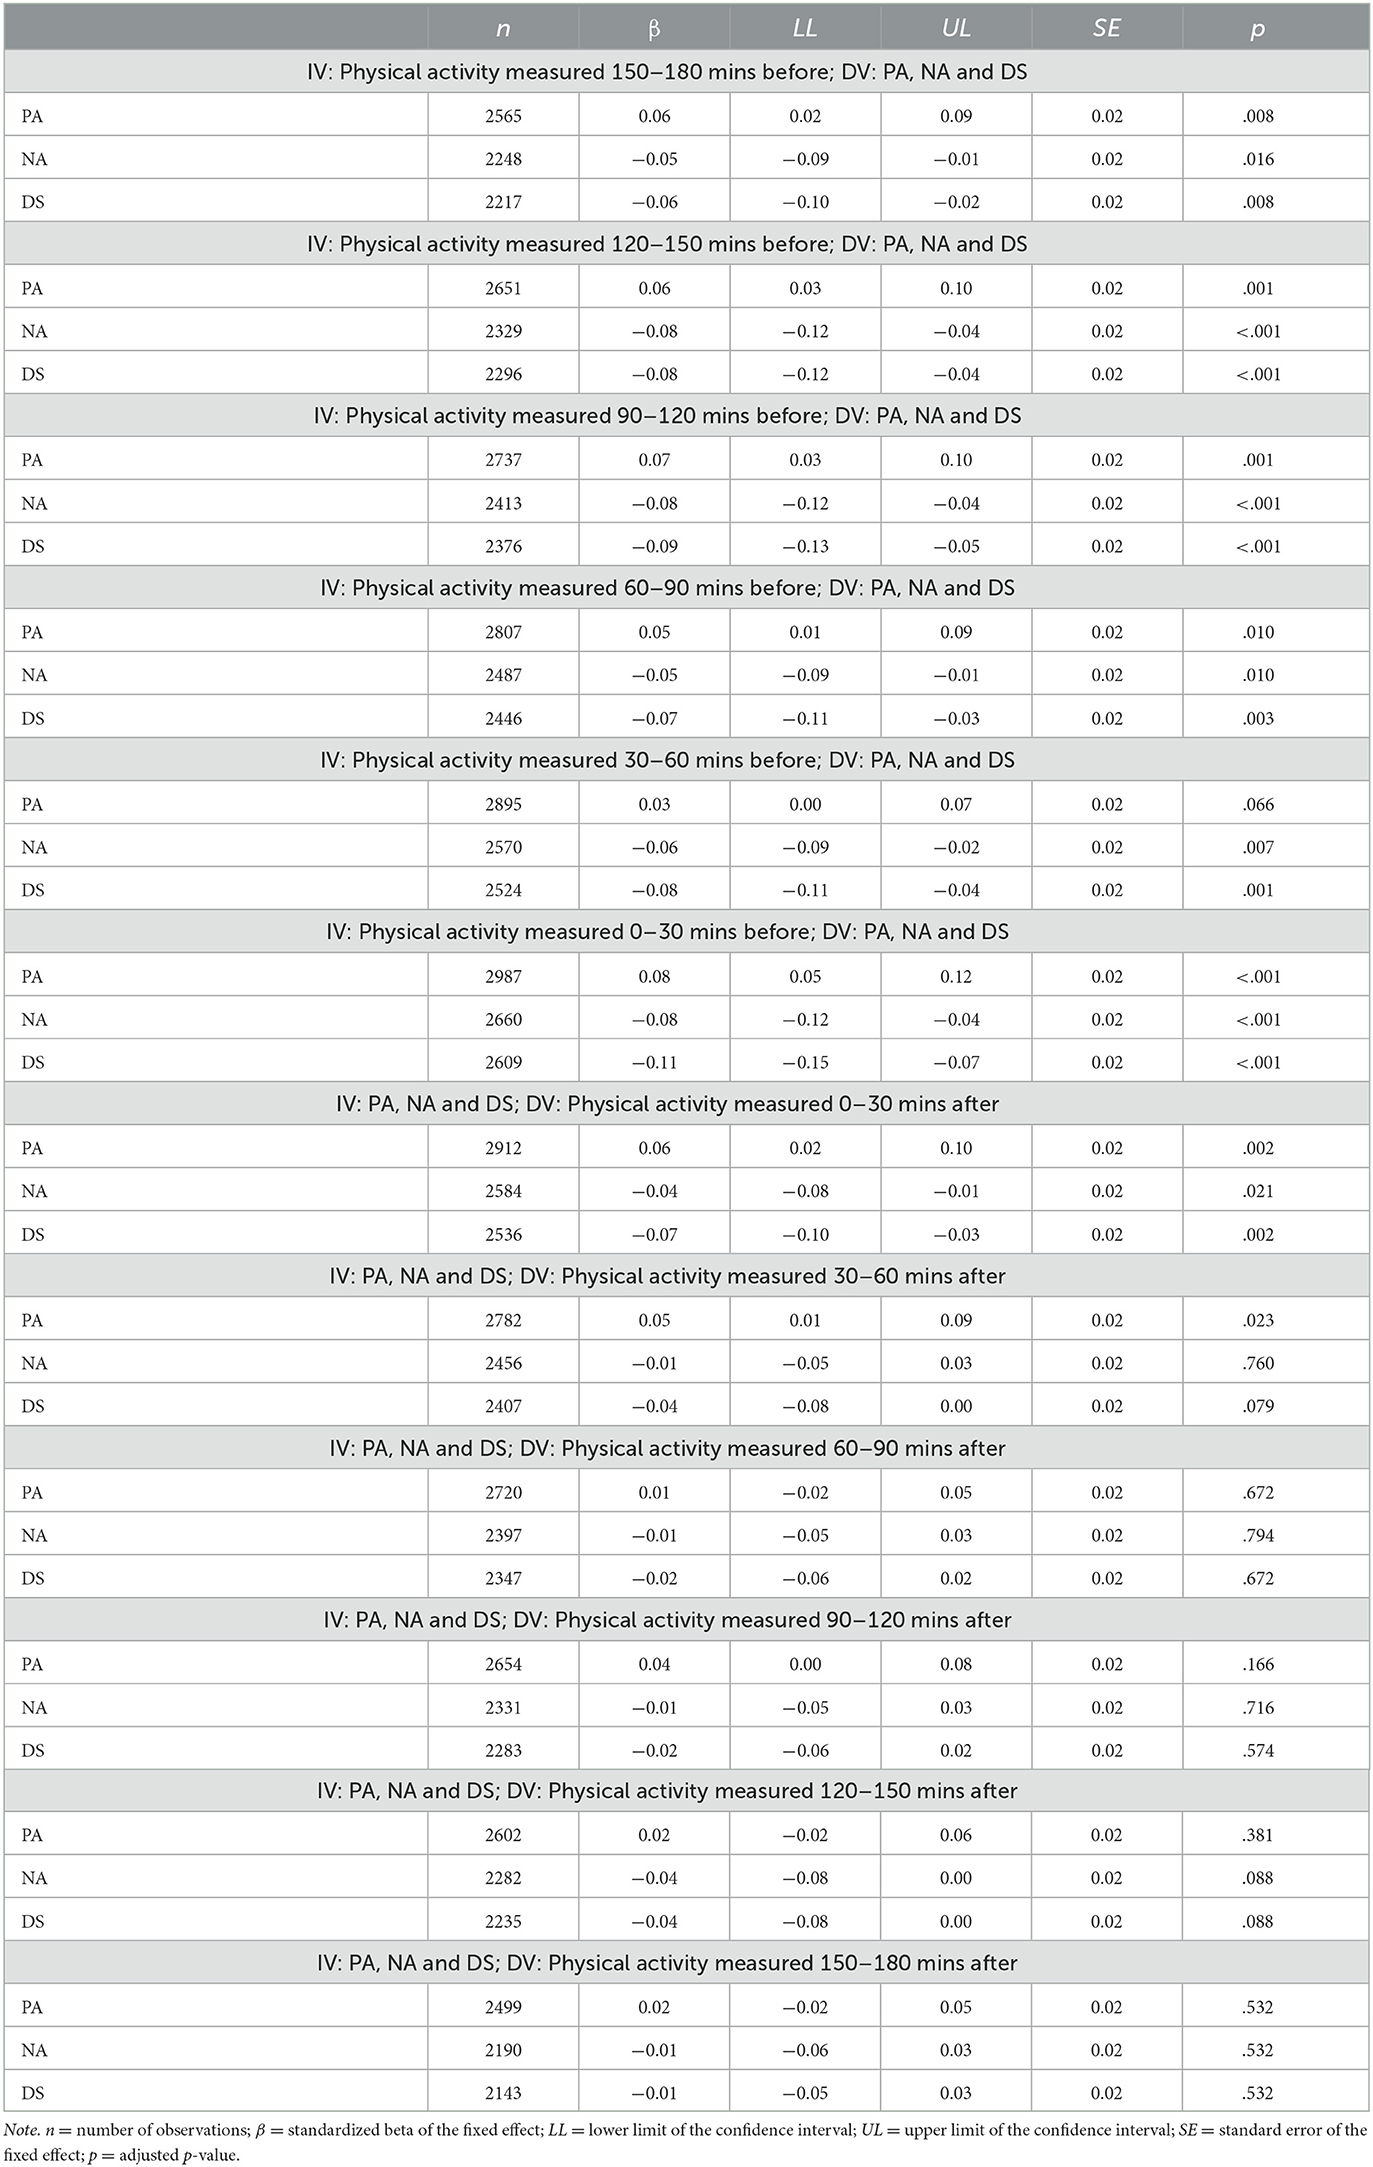
Figure 2. The regression coefficients and confidence intervals of applying isotemporal substitution models in multilevel models in which light physical activity (LPA), moderate-to-vigorous physical activity (MVPA), and total physical activity (not reported) predicted subsequent positive affect (A), negative affect (B), and depressive symptoms (C) in all participants (unstratified). To facilitate better interpretation, the regression coefficients were multiplied by 10 (thus an unstandardized regression coefficient of 0.20 means that with every 10-min increase of the respective intensity of physical activity, the dependent variable increases by 20% of a standard deviation).
In the published article, there was an error in Supplementary Tables 1–6 and Supplementary Figure 1. The values in Supplementary Tables 1–6 and Figure S1 were corrected. In the title of Supplementary Table 4, “Only the results of the interaction were presented” was added.
The correct Supplementary material appears below.
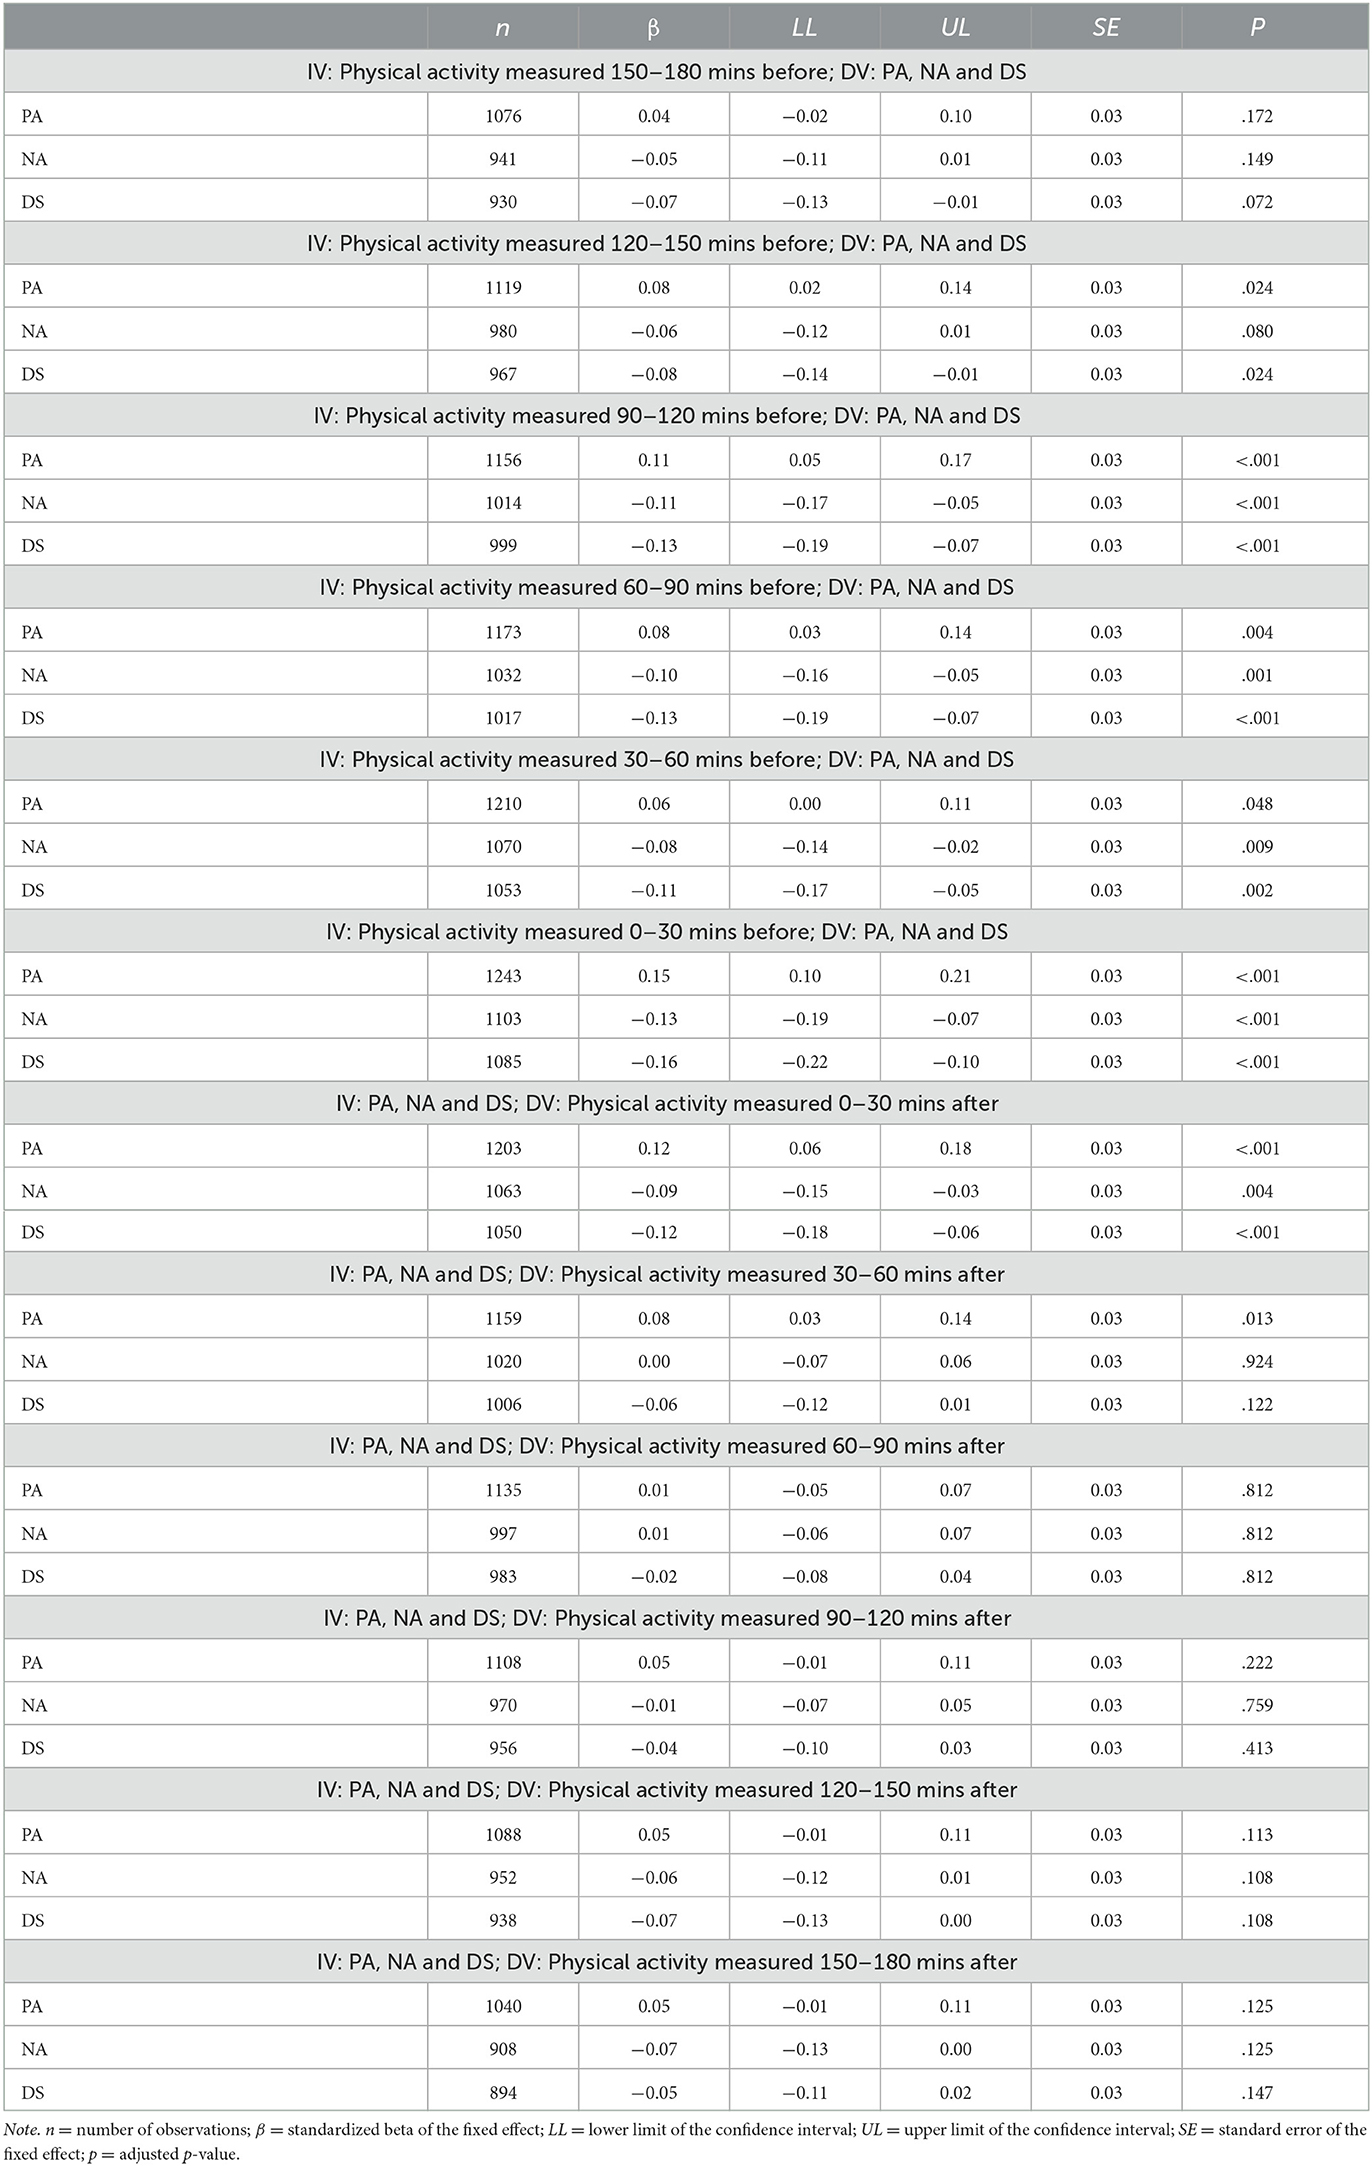
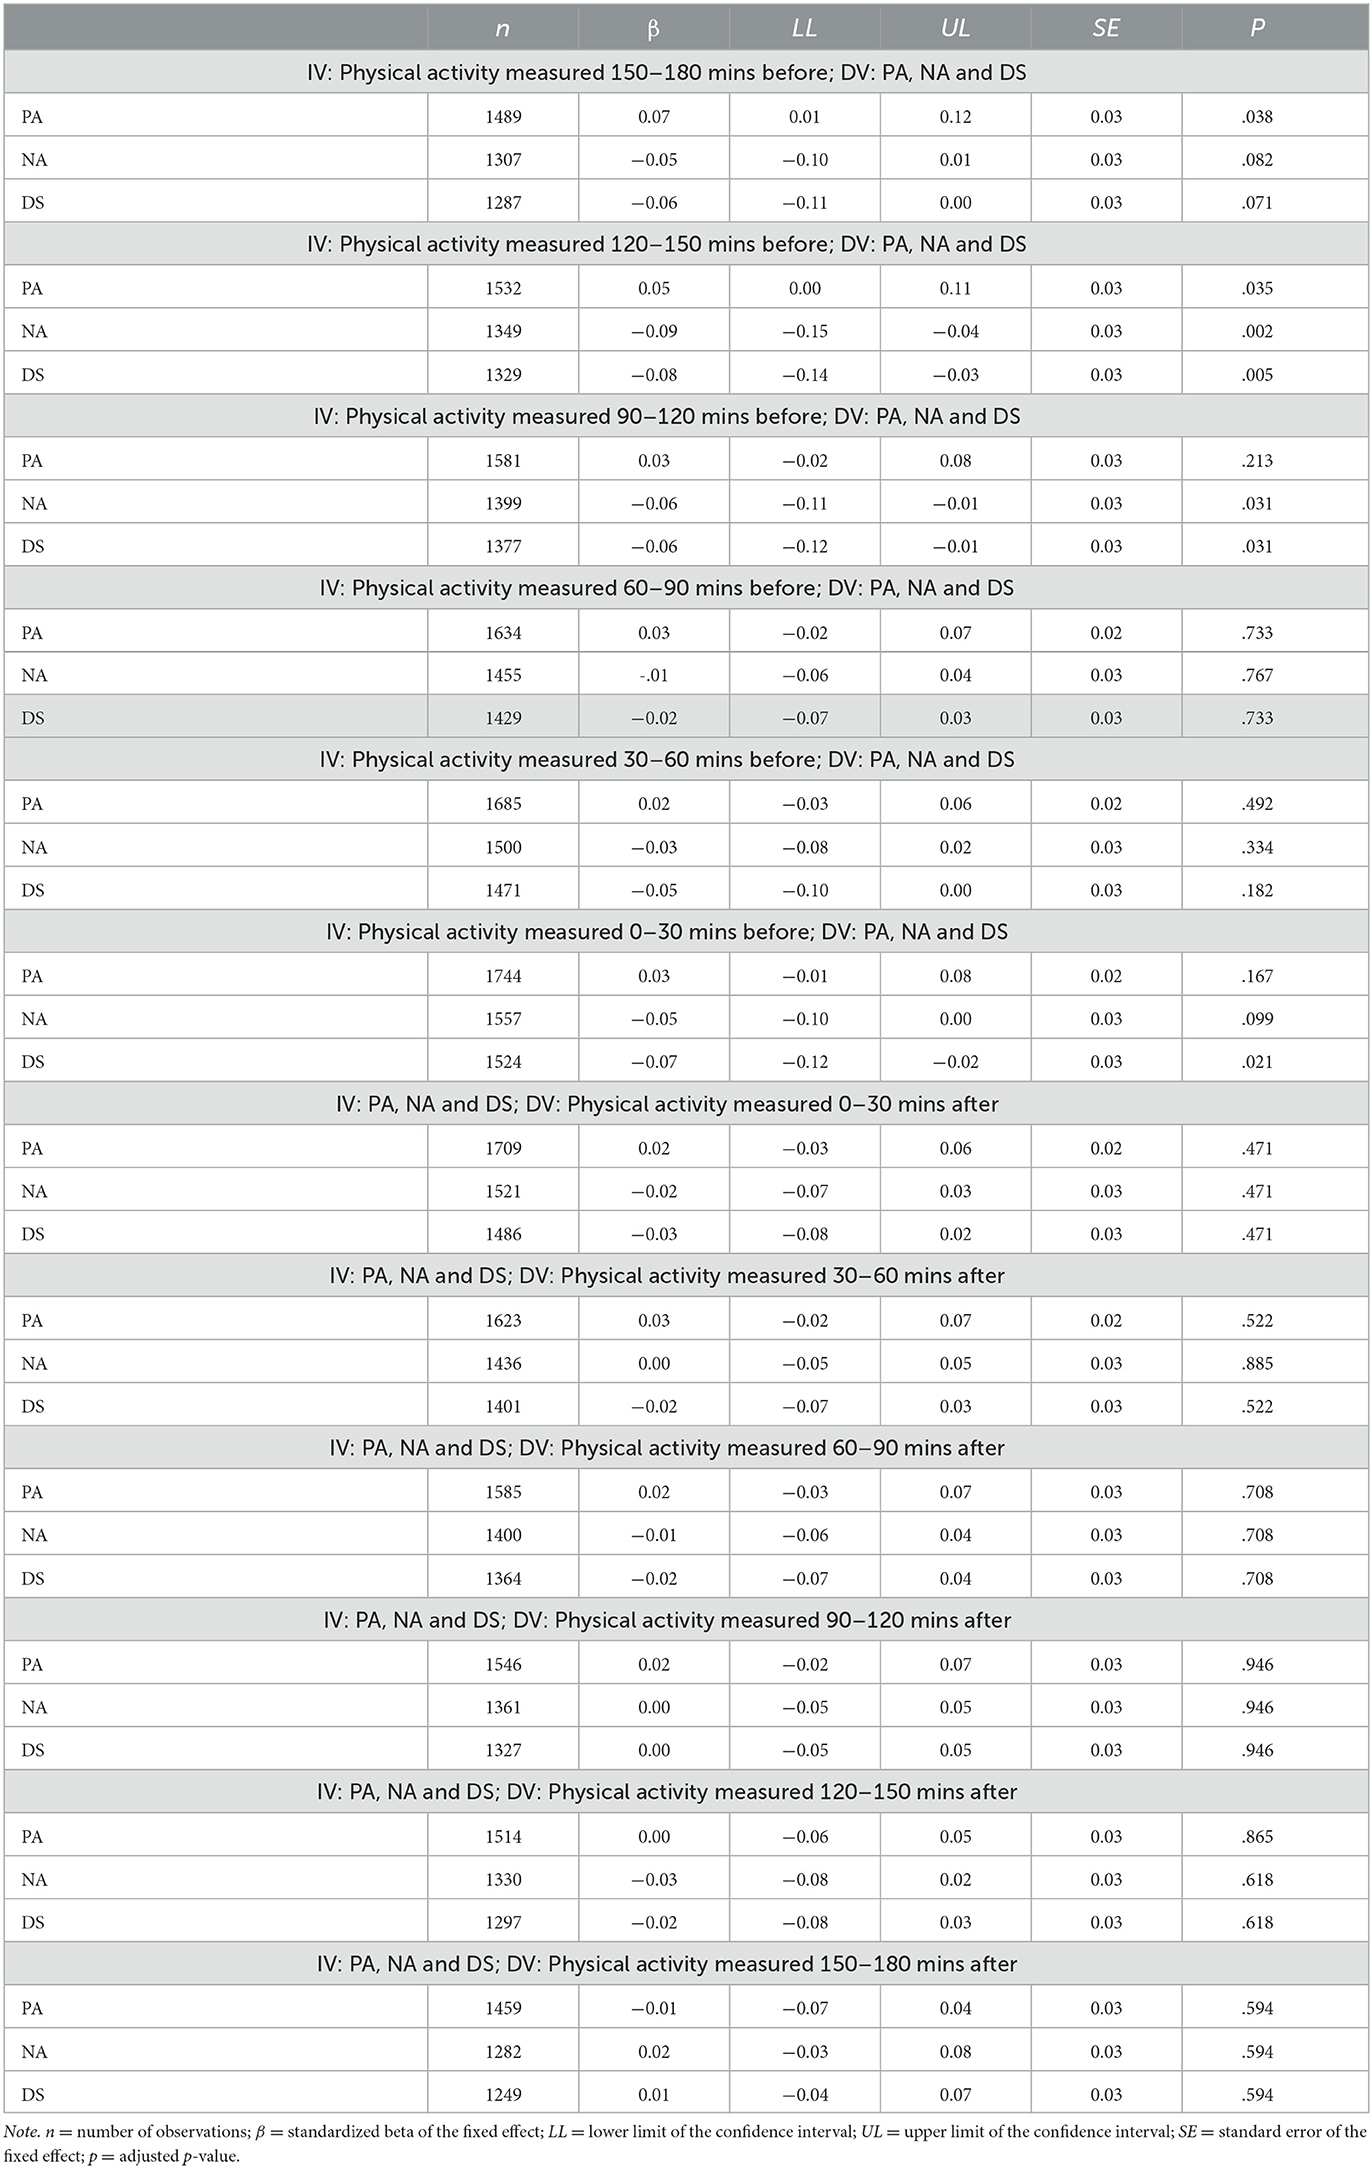
Supplementary Table 1. Results of multilevel models in which physical activity predicted the subsequent positive affect (PA), negative affect (NA), and depressive symptoms (DS) and the models in which PA, NA, and DS predicted the subsequent physical activity in all participants (N = 78).
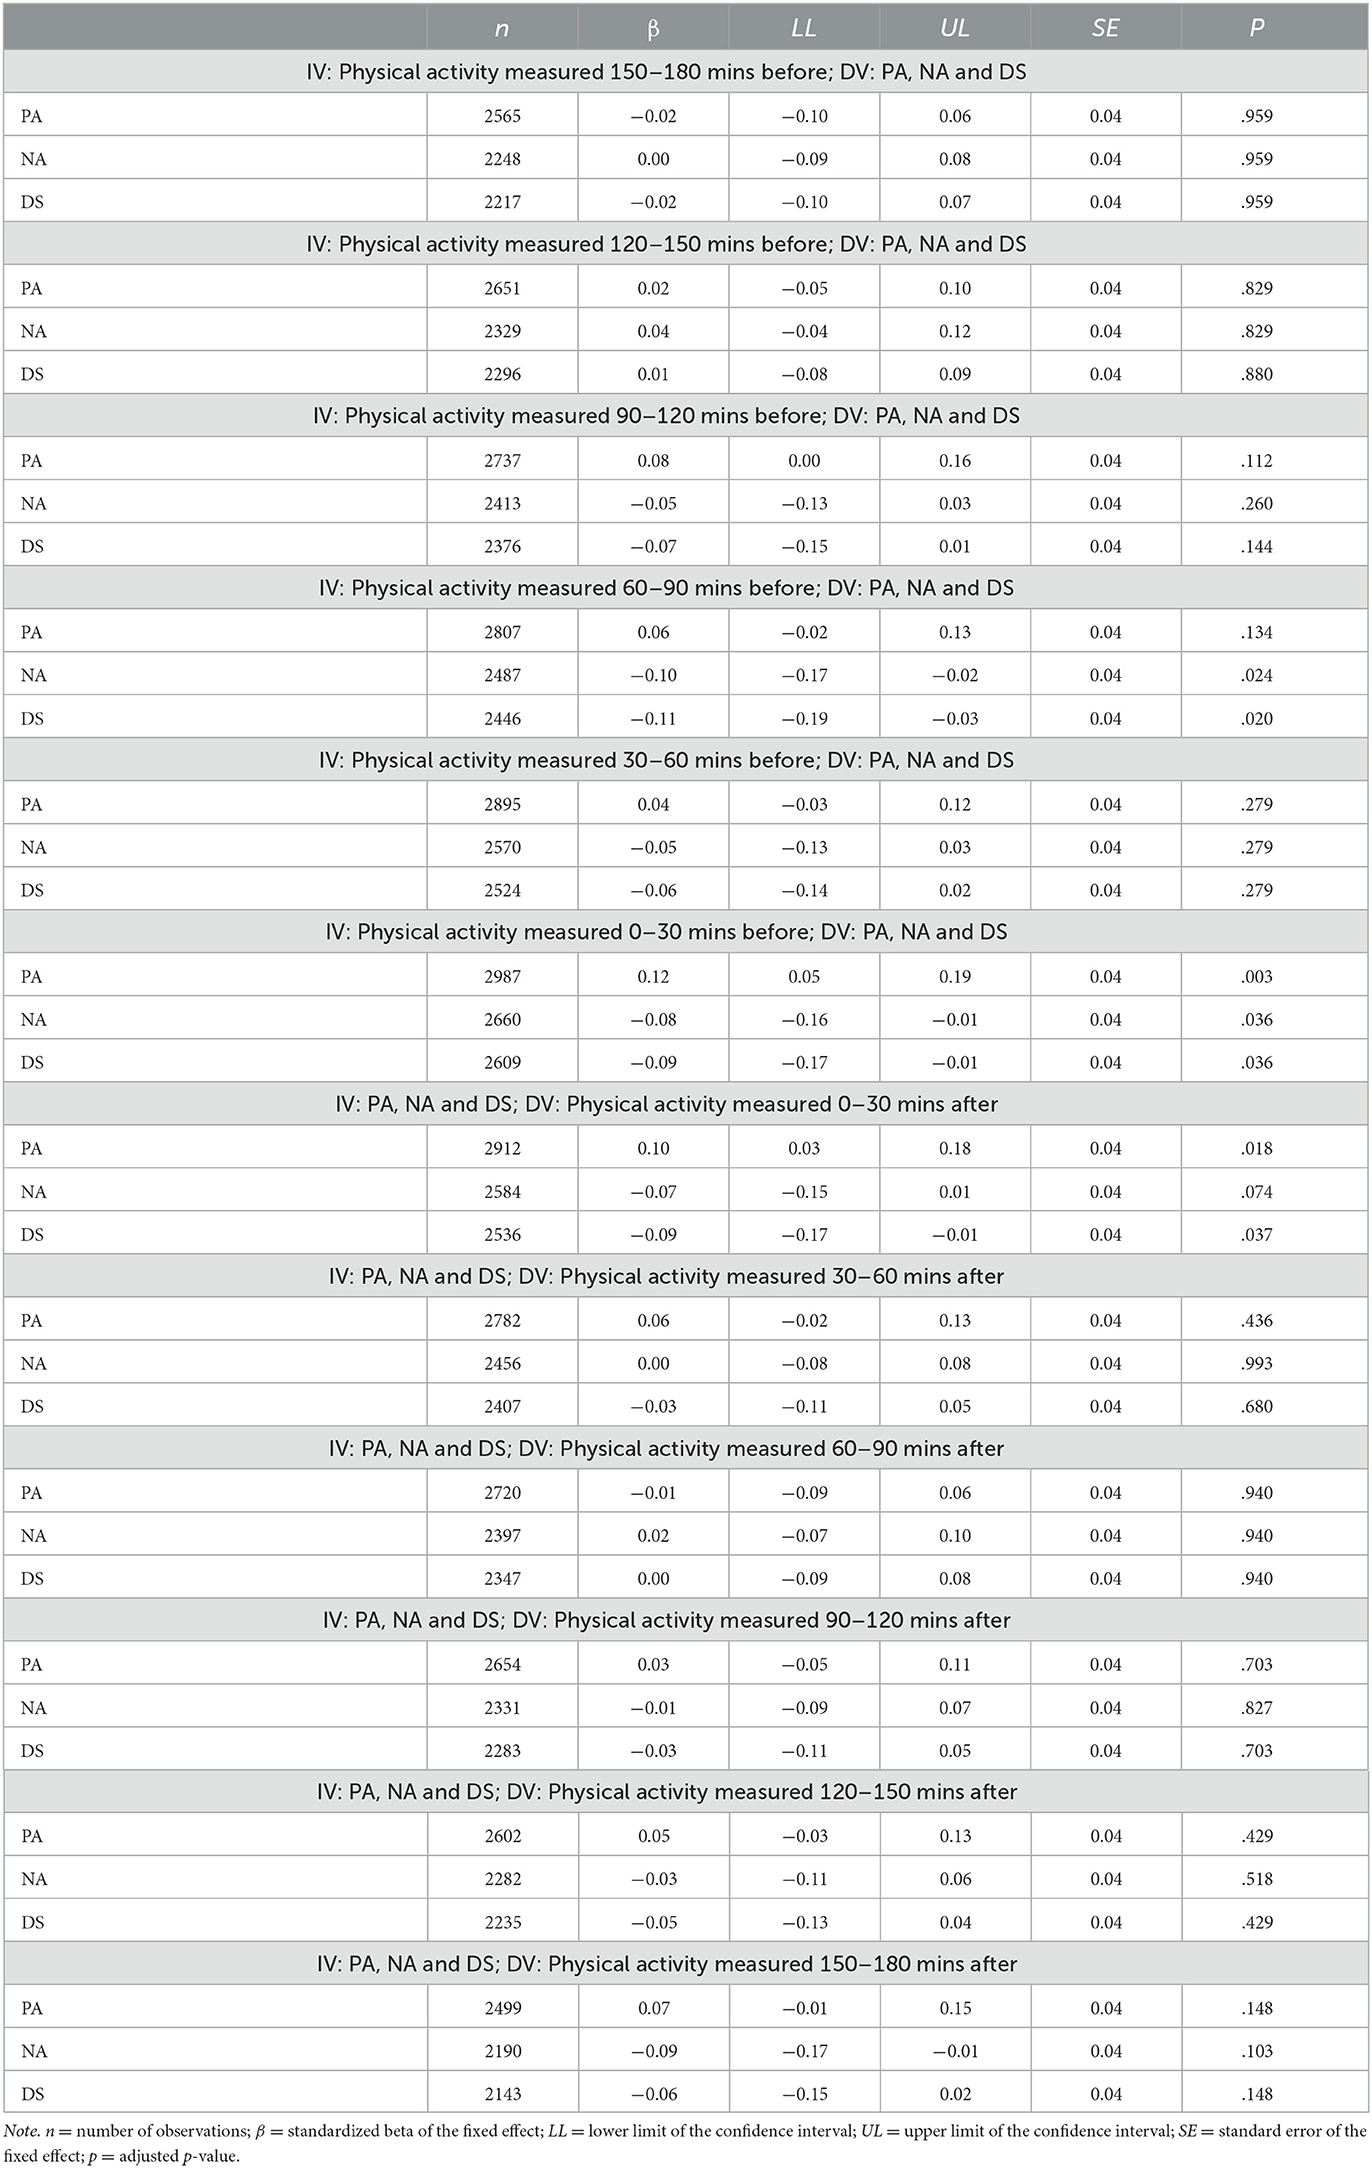
Supplementary Table 2. Results of multilevel models in which physical activity predicted the subsequent PA, NA, and DS and the models in which PA, NA, and DS predicted the subsequent physical activity in the participants with high levels of depressive symptoms (n = 37).
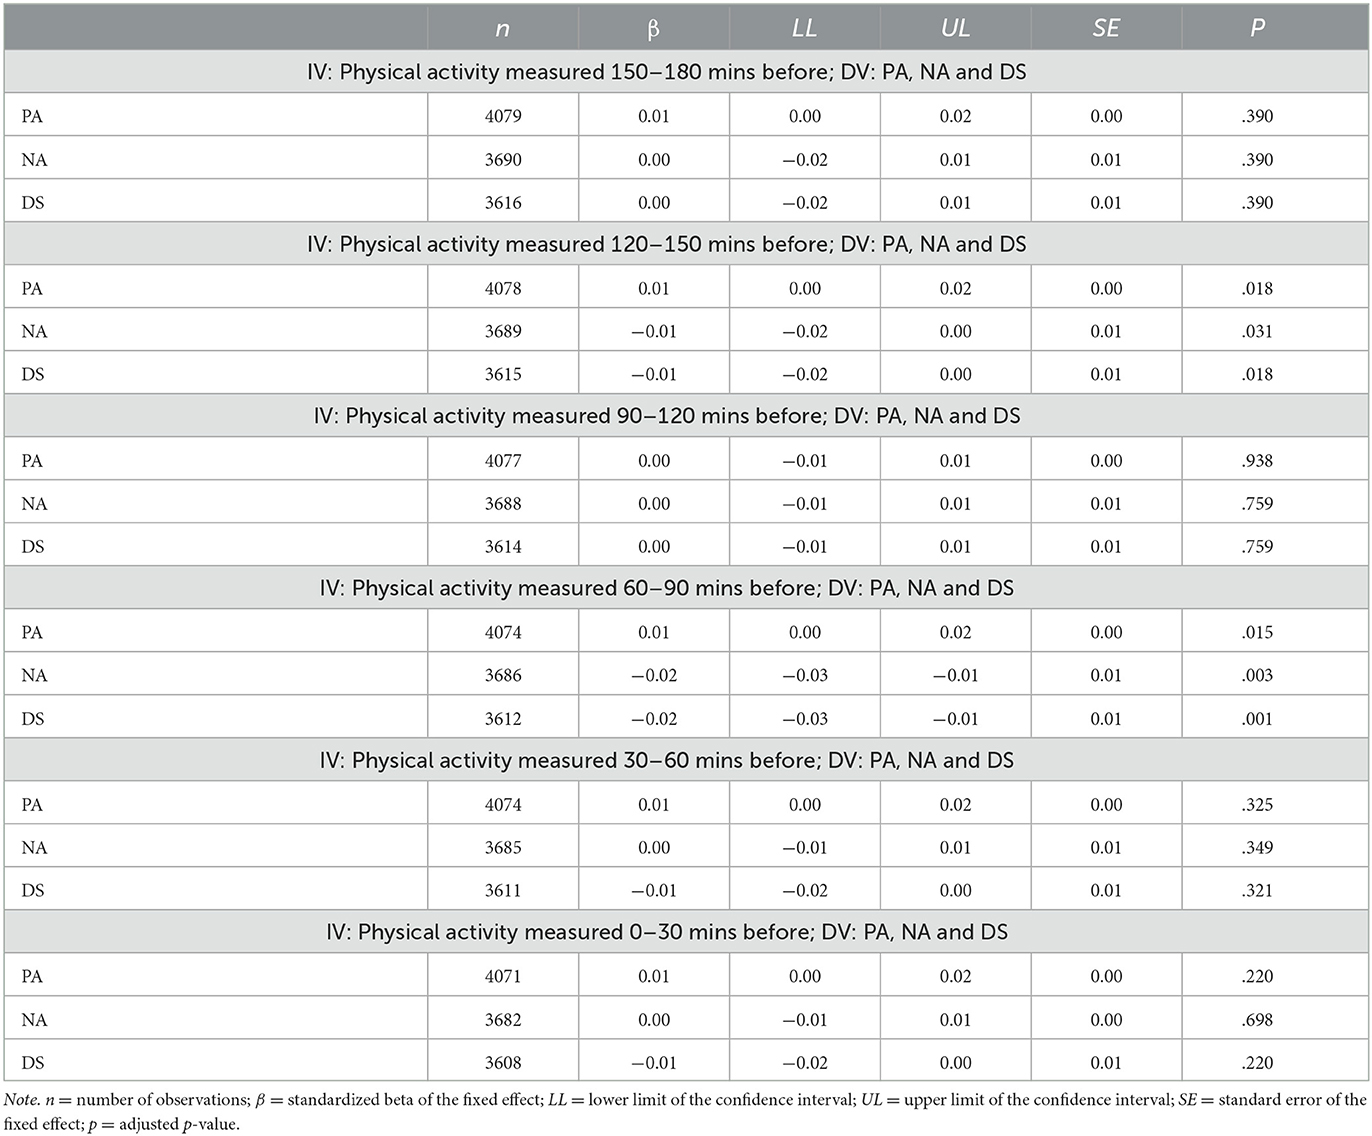
Supplementary Table 3. Results of multilevel models in which physical activity predicted the subsequent PA, NA, and DS and models in which PA, NA, and DS predicted the subsequent physical activity in the participants with low levels of depressive symptoms (n = 41).
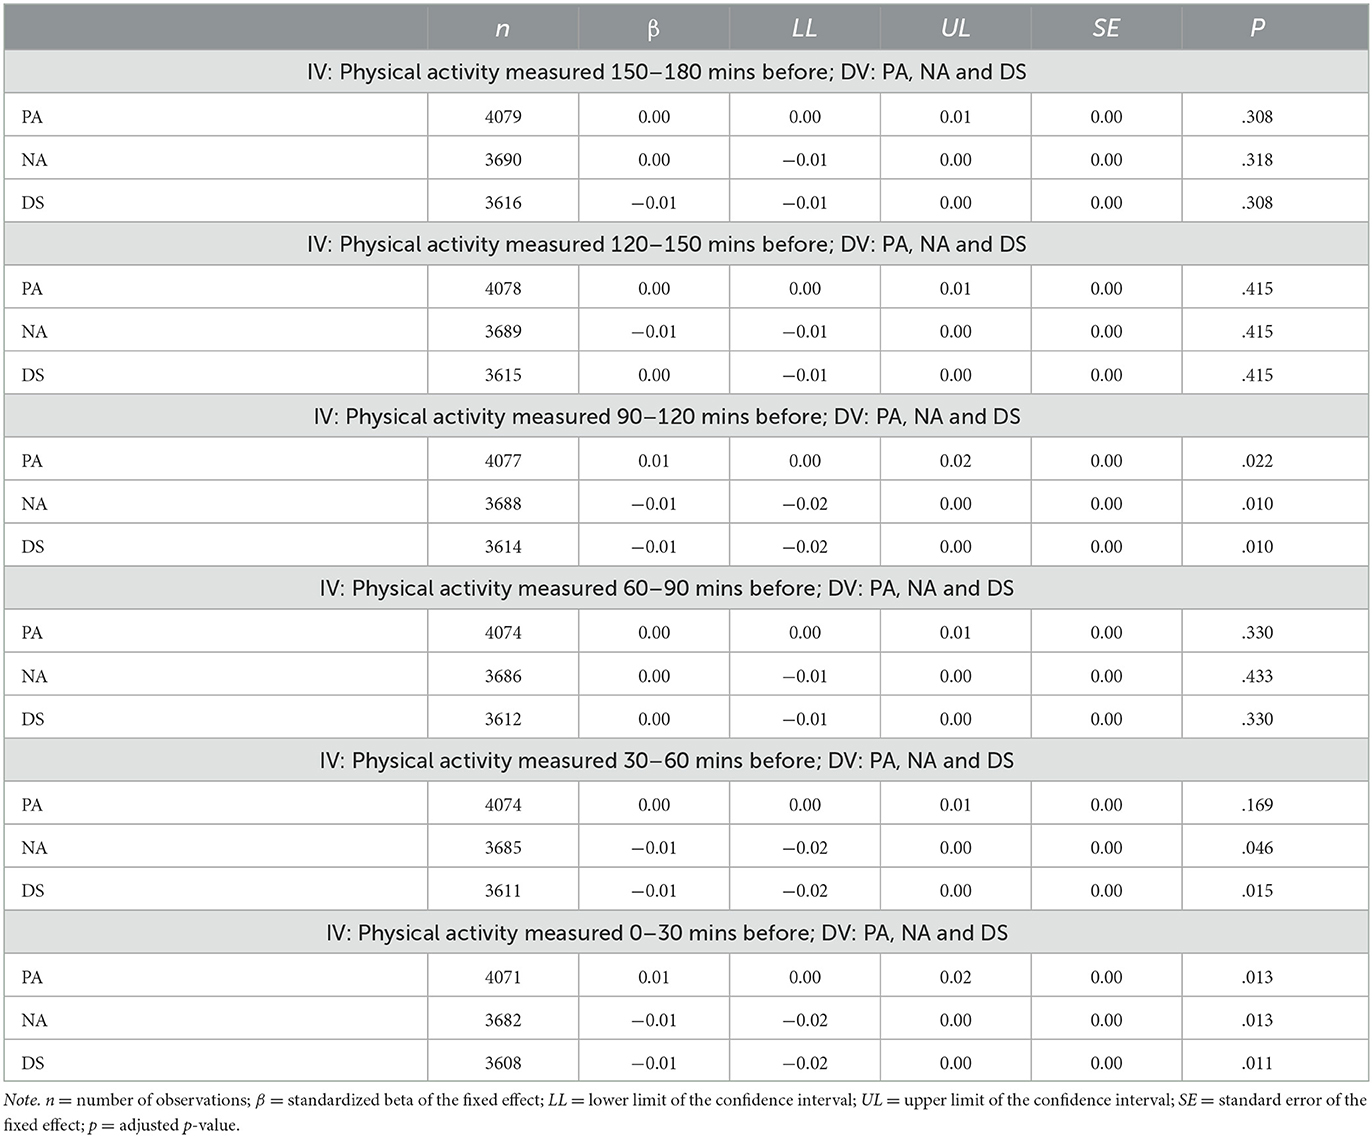
Supplementary Table 4. Results of multilevel models in which physical activity and the interactions between physical activity and low vs. high depressive symptom groups predicted the subsequent PA, NA, and DS, and models in which PA, NA, and DS and the interactions between PA, NA, or DS and low vs. high depressive symptom groups predicted the subsequent physical activity in all participants. Only the results of the interaction were presented.
Supplementary Table 5. Results of multilevel models in which light physical activity (LPA), moderate-to-vigorous physical activity (MVPA), and total physical activity (TPA) predicted the subsequent PA, NA, and DS in all participants (N = 78). Only the results of LPA were presented.
Supplementary Table 6. Results of multilevel models in which light physical activity (LPA), moderate-to-vigorous physical activity (MVPA), and total physical activity (TPA) predicted the subsequent PA, NA, and DS in all participants (N = 78). Only the results of MVPA were presented.
Suppelementary Figure 1. The standardized betas and confidence intervals of multilevel models including an interaction between the main predictor and a dummy-coded group variable.
In the published article, there were errors in Materials and methods.
A correction has been made to Materials and methods, Statistical analysis, paragraph 1. This sentence previously stated:
“The intraclass correlation coefficients of the grand-mean centered variables are 0.45 for positive affect, 0.69 for both negative affect and depressive symptoms, and 0.03–0.15 for the physical activity variables.”
The corrected sentence appears below:
“The intraclass correlation coefficients of the grand-mean centered variables are 0.45 for positive affect, 0.69 for both negative affect and depressive symptoms, and 0.03–0.13 for the physical activity variables.”
A correction has been made to Materials and methods, Statistical analysis, paragraph 2. This sentence previously stated:
“Minutes of sedentary behavior, LPA, MVPA, and total physical activity were aggregated by 30-min time windows before the mood ratings…”
The corrected sentence appears below:
“Minutes of sedentary behavior, LPA, and MVPA were aggregated by 30-min time windows before the mood ratings to create total physical activity…”
A correction has been made to Results, paragraph 2. This sentence previously stated:
“For positive affect, the effect sizes ranged from 0.05 to 0.10 and the confidence intervals 0.01–0.13. Negative affect and depressive symptoms showed similar effect sizes and confidence intervals; negative affect:−0.06 to−0.09 (standardized beta) and−0.02 to−0.13 (confidence intervals) and depressive symptoms:−0.07 to−0.11 (standardized beta) and−0.03 to−0.15 (confidence intervals).”
The corrected sentence appears below:
“For positive affect, the effect sizes ranged from 0.03 to 0.08 and the confidence intervals 0.00–0.12. Negative affect and depressive symptoms showed similar effect sizes and confidence intervals; negative affect:−0.05 to−0.08 (standardized beta) and −0.01 to −0.12 (confidence intervals) and depressive symptoms: −0.06 to −0.11 (standardized beta) and −0.02 to −0.15 (confidence intervals).”
A correction has been made to Results, paragraph 3. These sentences previously stated:
“The effects of physical activity on positive affect increased during the 180 min before the mood rating, they were the lowest in the 180–150 min before the mood rating (β = 0.06, CI [0.00, 0.12]) and the largest in the 30 min before the mood rating (β = 0.17, CI [0.12, 0.23]).”
“Significant interactions were observed for physical activity measured 30–0 min before the mood rating predicted positive affect (β = 0.13, CI [0.06, 0.21]) with stronger associations in participants with higher baseline levels of depressive symptoms (Supplementary Table 4; Figure 1).”
The corrected sentence appears below:
“The effects of physical activity on positive affect increased during the 180 min before the mood rating, they were the lowest in the 180–150 min before the mood rating (β = 0.04, CI [−0.02, 0.10]) and the largest in the 30 min before the mood rating (β = 0.15, CI [0.10, 0.21]).”
“Significant interactions were observed for physical activity measured 30–0 min before the mood rating predicted positive affect (β = 0.12, CI [0.05, 0.19]) with stronger associations in participants with higher baseline levels of depressive symptoms (Supplementary Table 4; Figure 1).”
A correction has been made to Results, paragraph 4. This sentence previously stated:
“The associations of positive affect (β = 0.13, CI [0.08, 0.19], p < 0.001), negative affect (β = −0.10, CI [-0.16,−0.04], p = 0.001), and depressive symptoms (β = −0.13, CI [-0.19,−0.07], p < 0.001) with physical activity measured 0–30 min after the mood rating were significant in the group with higher baseline levels of depressive symptoms but they were not significant in the group with lower levels of depressive symptoms (Figures 1F–H).”
The corrected sentence appears below:
“The associations of positive affect (β = 0.12, CI [0.06, 0.18], p < 0.001), negative affect (β = −0.09, CI [−0.15, −0.03], p = 0.004), and depressive symptoms (β = −0.12, CI [−0.18, −0.06], p < 0.001) with physical activity measured 0–30 min after the mood rating were significant in the group with higher baseline levels of depressive symptoms but they were not significant in the group with lower levels of depressive symptoms (Figures 1F–H).”
A correction has been made to Results, Exploratory analysis, paragraph 1. These sentences previously stated:
“Applying the isotemporal substitution model (Figure 2 and Supplementary Tables 5, 6), LPA measured 90–60 min before the mood ratings significantly predicted positive affect (b = 0.01, CI [0.00, 0.02], p = 0.009), negative affect (b = −0.01, CI [-0.02, 0.00], p = 0.005) and depressive symptoms (b = −0.02, CI [-0.03,−0.01], p = 0.003). MVPA measured 30–0 min before the mood rating significantly predicted positive affect (b = 0.01, CI [0.00, 0.02], p = 0.006) and depressive symptoms (b = −0.01, CI [-0.02, 0.00], p = 0.006).”
The corrected sentence appears below:
“Applying the isotemporal substitution model (Figure 2; Supplementary Tables 5, 6), LPA measured 90–60 min before the mood ratings significantly predicted negative affect (b = −0.02, CI [−0.03, −0.01], p = 0.003) and depressive symptoms (b = −0.02, CI [−0.03, −0.01], p = 0.001).”
A correction has been made to Discussion, paragraph 1. These sentences previously stated:
“The size of the association appeared to be relatively constant for physical activity across the 180 min before the mood rating (0.05–0.10,−0.06 to−0.09, and−0.07 to−0.11 for positive affect, negative affect, and depressive symptoms, respectively).”
“Moreover, exploratory analyses using isotemporal substitution approach showed that there were associations of both MVPA and LPA with subsequent levels of positive affect, negative affect and depressive symptoms, but we did not detect stronger effects of MVPA compared to LPA on average nor a meaningful temporal pattern of the effects over the 180 min before the mood rating, which suggests that both MVPA and LPA might both have positive effects on mood.”
The corrected sentences appear below:
“The size of the association appeared to be relatively constant for physical activity across the 180 min before the mood rating (0.03 to 0.08, −0.05 to −0.08, and −0.06 to −0.11 for positive affect, negative affect, and depressive symptoms, respectively).”
“Moreover, exploratory analyses using isotemporal substitution approach showed that there were associations of LPA with subsequent levels of negative affect and depressive symptoms, but we did not detect a meaningful temporal pattern of the effects over the 180 min before the mood rating, which suggests that LPA might have a positive effect on mood.”
The authors apologize for these errors and state that these do not change the scientific conclusions of the article in a substantial manner. However, the significant associations between light physical activity (LPA) measured 90–60 min before the mood ratings and positive affect and between moderate and vigorous physical activity (MVPA) measured 30–0 min before the mood ratings and positive affect and depressive symptoms were no longer significant. The original article has been updated.
Conflict of interest
The authors declare that the research was conducted in the absence of any commercial or financial relationships that could be construed as a potential conflict of interest.
The author SL declared that they were an editorial board member of Frontiers, at the time of submission. This had no impact on the peer review process and the final decision.
Publisher's note
All claims expressed in this article are solely those of the authors and do not necessarily represent those of their affiliated organizations, or those of the publisher, the editors and the reviewers. Any product that may be evaluated in this article, or claim that may be made by its manufacturer, is not guaranteed or endorsed by the publisher.
Keywords: experience sampling method (ESM), physical activity, accelerometry, negative affect, positive affect, depressive symptoms, within-individual differences
Citation: Li Y-M, Konstabel K, Mõttus R and Lemola S (2023) Corrigendum: Temporal associations between objectively measured physical activity and depressive symptoms: an experience sampling study. Front. Psychiatry 14:1240881. doi: 10.3389/fpsyt.2023.1240881
Received: 15 June 2023; Accepted: 03 August 2023;
Published: 23 August 2023.
Edited and reviewed by: Maria Melchior, Institut National de la Santé et de la Recherche Médicale (INSERM), France
Copyright © 2023 Li, Konstabel, Mõttus and Lemola. This is an open-access article distributed under the terms of the Creative Commons Attribution License (CC BY). The use, distribution or reproduction in other forums is permitted, provided the original author(s) and the copyright owner(s) are credited and that the original publication in this journal is cited, in accordance with accepted academic practice. No use, distribution or reproduction is permitted which does not comply with these terms.
*Correspondence: Yu-Mei Li, eXUtbWVpLmxpQHVuaS1iaWVsZWZlbGQuZGU=