
94% of researchers rate our articles as excellent or good
Learn more about the work of our research integrity team to safeguard the quality of each article we publish.
Find out more
ORIGINAL RESEARCH article
Front. Psychiatry, 03 February 2023
Sec. Schizophrenia
Volume 14 - 2023 | https://doi.org/10.3389/fpsyt.2023.1089724
 Vladimir Adrien1,2,3*
 Nicolas Bosc1Hugo Fumat3Cédric Tessier1
 Florian Ferreri1,2
 Stéphane Mouchabac1,2
 David Tareste3Philippe Nuss1,4
Schizophrenia is a severe, chronic, and heterogeneous mental disorder that affects approximately 1% of the world population. Ongoing research aims at clustering schizophrenia heterogeneity into various “biotypes” to identify subgroups of individuals displaying homogeneous symptoms, etiopathogenesis, prognosis, and treatment response. The present study is in line with this approach and focuses on a biotype partly characterized by a specific membrane lipid composition. We have examined clinical and biological data of patients with stabilized schizophrenia, including the fatty acid content of their erythrocyte membranes, in particular the omega-3 docosahexaenoic acid (DHA). Two groups of patients of similar size were identified: the DHA− group (N = 19) with a lower proportion of membrane DHA as compared to the norm in the general population, and the DHAn group (N = 18) with a normal proportion of DHA. Compared to DHAn, DHA− patients had a higher number of hospitalizations and a lower quality of life in terms of perceived health and physical health. They also exhibited significant higher interleukin-6 and cortisol blood levels. These results emphasize the importance of measuring membrane lipid and immunoinflammatory biomarkers in stabilized patients to identify a specific subgroup and optimize non-pharmacological interventions. It could also guide future research aimed at proposing specific pharmacological treatments.
Schizophrenia is a serious and chronic psychiatric disease with a prevalence of 0.28–0.66% and an incidence of 10–22 new cases per year for 100,000 people (1–3). It is a heterogeneous disease in terms of symptomatology, outcome, treatment response, and etiopathogenesis, involving neurodevelopmental anomalies in a context of polygenic vulnerability and gene-environment interaction (4–7). Numerous phenomena, either acute or chronic, are at play and vary during the life-long course of the disorder, including both brain and whole-body processes. In addition to drug prescriptions to help regulate these processes, non-pharmacological interventions, such as rehabilitation and patient empowerment programs, are proposed to optimize the overall treatment trajectory. Most treatment guidelines for clinicians are based on neuropharmacological studies conducted during the short period corresponding to the acute phase of the disorder, with comparatively fewer data on the best drug adjustments in terms of dosage and combinations during the stabilization phase.
The rationale for the pharmacological treatment of schizophrenia is based on the assumption of a dysfunctional dopamine brain signaling that comes along with structural defects in striato-cortico-thalamic pathways (8–10). Current research shows that many regulation systems, central or peripheral, are altered in schizophrenia (11, 12). These perturbations, which are sometimes moderate, or even present in healthy subjects, involve minor physical anomalies (13, 14), minor neurological signs (15, 16), oxidative stress (17–19), inflammation and immunity (20–23), lipid metabolism (24, 25), and alteration of the hormonal system (26), microbiota (27), or microglia (28, 29). Many studies have also shown the existence of membrane fatty acid, phospholipid, and glycolipid abnormalities, as well as lipidic signaling defects, associated with symptom severity in schizophrenia (30–35).
In this manuscript, we focused on two polyunsaturated fatty acid (PUFA) families with distinct properties. The omega-3 (ω3) family is mainly composed of alpha-linoleic acid (ALA), eicosapentaenoic acid (EPA), and docosahexaenoic acid (DHA) that have anti-inflammatory properties. The omega-6 (ω6) family includes linoleic acid (LA), arachidonic acid (AA), and docosapentaenoic acid (DPA) that have pro-inflammatory properties (36). Therefore, the ω6/ω3 ratio in dietary intake is critical.
Several studies on human subjects focused on the PUFA content of the red blood cell (RBC) membranes (30–33, 37), which has been shown to correlate with the PUFA content in the brain (38–42). These studies found a decrease of DHA and AA in the red blood cell (RBC) membranes from a subgroup of patients with schizophrenia, and observed that this decrease was associated with more severe symptoms. A decrease in DHA and AA, together with a lower level of EPA, was also observed in patients with an Ultra-High Risk (UHR) of psychotic transition, defined by the Comprehensive Assessment of At-Risk Mental States (CAARMS) (43). A study examining individuals with first schizophrenic episodes showed that ω3, but not ω6, rates were decreased compared to healthy controls (44). On the other hand, this study did not observe any differences in ω3 or ω6 rates between healthy individuals and subjects with chronic schizophrenia who did not receive any pharmacological treatment. This study also showed that treatment with atypical antipsychotics (AP) could partly correct the ω3 abnormality in first episode patients. Overall, this suggests that a deficiency in ω3 could be present at the beginning of the disease in some schizophrenia patients but would not persist over time.
Clinical trials have been made with ω3 supplementation in acute or stabilized patients with controversial results. Some studies showed some clinical improvement (45) while others could not evidence any efficacy of a supplementation with ω3 on symptoms or functionality (46). A monocentric study, however, found that dietary supplementation of ω3 was able to reduce the risk of psychotic transition in UHR patients (47). In this study, psychotic transition rates stayed weak, as well as compliance to diet, making it difficult to draw any conclusion. Many studies however propose to combine ω3 supplementation with AP treatment in order to improve the therapeutic effect of AP (48–50).
For stabilized patients, it is well-acknowledged that medication maintenance, cognitive therapies, and rehabilitation programs are critical for symptom reduction, and improvement of functionality and quality of life. Strikingly, whereas for the most part of their life, patients are not in an acute phase of the disease, there is a lack of biological data to guide pharmacological and non-pharmacological interventions during the stabilization phase (51). It is most probable that the biological signature of treated stabilized patients differs from that existing during the acute exacerbation of the disease. It could thus be interesting to pay attention not only to the clinical and functional response of stabilized patients, but also to their biomarkers. This could allow the clinician to biologically define a stabilization profile and identify the parameters that should be addressed to optimize the care.
The purpose of the present paper is to examine to what extent blood biomarkers coupled with clinical and cognitive data can contribute to disentangle disease heterogeneity and improve treatment in clinically stabilized schizophrenic patients. We retrospectively reviewed data from well-stabilized patients followed during several months in the Saint-Antoine psychiatric day hospital. We notably examined whether the PUFA level in the RBC membranes of these patients correlated with symptom severity, quality of life and other biological markers.
Medical records of 37 patients with criteria of schizophrenia (14 females, mean age: 44 years) have been retrieved. This was the exhaustive cohort of patients having been admitted to the psychiatric department of the Saint-Antoine day hospital in Paris, France in the 2 years prior to the initiation of the study. The indications for day hospitalization were symptoms stabilization, and implementation of rehabilitation and occupational therapy programs. At the time of assessment, all patients were living autonomously and could manage their medication by themselves. Most came part-time. They were receiving psychopharmacological treatment and were stabilized (i.e., at the time of assessment, all were admitted to the day hospital and had no recent significant change in their medication).
Inclusion criteria were being 18 years old or older, having criteria for schizophrenia as assessed by the Diagnostic and Statistical Manual of Mental Disorders, Fifth Edition (DSM-5), and having signed a written informed consent for the use of medical data in their electronic health record for research [AP-HP Health Data Warehouse (EDS), which has been authorized since December 22, 2021 by the authorization n° 20211222104100].
Exclusion criteria were central neurological disease, recent major changes in their medication (i.e., a change of more than 20% of the current medication dose or the addition of another treatment) or modification in their diet or physical activity in the 3 months preceding the clinical and biological assessment. Significant medication or habit changes were considered as a proxy of disease destabilization or likely to have an impact on biological markers such as metabolic-energetic markers, especially regarding lipid metabolism. Patients were under a wide variety of psychopharmacological medications depending on their treatment history. Previous studies have shown that antipsychotics have variable effects on FA levels. Some studies found no effect (30, 37, 52) while others observed little effect (31, 53) of AP treatment on FA levels, which seemed to depend on the type of AP (typical vs. atypical) used and/or the phase (acute vs. chronic) of the disease under investigation (54, 55). In our case, because the sample size was too low, we could not make any correlation between PUFA levels and type of treatment or number of episodes.
During their stay in the day hospital, all patients underwent extensive biological and psychological tests, similar to those performed during a full-time hospitalization in the same department. Retrieved data included sociodemographic information (age, sex, weight, height, abdominal perimeter, level of education, etc.). Clinical evaluation included criteria for schizophrenia as well as psychiatric comorbidities, suicide attempts history and number, family history of schizophrenia, schizoaffective disorder, or substance use disorders. A specific focus was made on diet issues, particularly supplementation in PUFAs. The course of the schizophrenia was also examined including age at first symptoms, first medical consultation, first hospitalization, and first AP treatment, as well as the number and average length of hospitalizations, and the treatment history.
Data were collected using both self- and clinician-rated questionnaires. Self-questionnaires were all in their French version and evaluated: (1) the type of diet based on a questionnaire used by the French national diet enquiry (56), (2) the quality of life with the Short Form (SF-36) Health Survey (57, 58) and the Duke Health Profile (59), (3) the physical activity, quantified by two scales, the Ricci and Gagnon (60) and the Modifiable Activity Questionnaire (MAQ) (61–64), and (4) the functional impairment with the Sheehan Disability Scale (SDS) (65). All scales were validated in French (58, 59, 66) except the French national diet enquiry, the Ricci and Gagnon scale and the SDS.
Clinician-evaluated questionnaires were also in their French version and included: (1) the Clinical Global Impression–Severity (CGI-S) scale (67), (2) the Global Assessment Functioning (GAF) scale (68), (3) the Positive and Negative Syndrome Scale (PANSS) (69, 70), (4) the Calgary Depression Scale for Schizophrenia (CDSS) (71, 72), (5) the Montreal Cognitive Assessment (MoCA), version 7.1 (73, 74), and (6) the Modified Wisconsin Card Sorting Test (MCST) (75–80). When the patient had already been tested by the MoCA, one of the two re-test versions of the MoCA was used. The MCST was rated at the end of the systematic evaluation of patients because it can bring moderate anxiety that could disturb the rating of other scales. The PANSS, CDSS and MoCA questionnaires were validated in French (72, 81, 82).
Retrieved biological and treatment data included: AP or mood stabilizers blood dosage, standard biology [blood count, serum electrolytes, creatine phosphokinase (CPK)], metabolic syndrome markers (LDL-cholesterol, HDL-cholesterol, triglycerides, fasting blood sugar, glycated hemoglobin), hormonal assays [Thyroid-Stimulating Hormone (TSH), prolactin], inflammation markers [Ultra-Sensitive C-Reactive Protein (US-CRP), Interleukin-1β (IL-1β), Interleukin-6 (IL-6), TNFα], energetic markers (amino acids among which homocysteine and methionine, B6, B9, and B12 vitamins), and finally lipidomic analysis [complete steroid profile, serum bile acids, RBC membrane FA].
After RBC lipid extraction following previously established protocols (83), the RBC membrane FA composition was obtained by GC-MS in the positive chemical ionization mode with ammonia as the reagent gas (GC 6890—MS 5975; Agilent) (84). The calibration of the response factors for FAs was made with a weighed mixture (FAME Mix Supelco47®, Sigma-Aldrich Chemie) (85). Profiles are expressed as mol%.
Descriptive statistics include usual parameters: mean ± standard deviation (S.D.) or number of subjects and percentages. Data were expressed as mean ± SD, number and percentages, and analyzed using Epi Info™ software (7.2.1.0 version) from the Centers for Disease Control and Prevention, Atlanta, USA.1 Patients’ characteristics correlations with RBC DHA class were investigated using Spearman’s correlation tests. χ2 tests were performed for nominal variables and independent samples T-test for continuous variables. All the tests were two-sided with a statistical significance level set at p = 0.05. With a 5% alpha risk, DHAn and DHA− samples of sizes 18 and 19, respectively, allow for the identification of effect sizes of 0.82, 0.92, and 1.06 with 70, 80, and 90% powers, respectively. This means that considering that an 80% power is satisfactory, the sample size may be considered as sufficient when the hypothesized difference between groups is at least 92% of the standard deviation for this variable.
Sociodemographic and clinical characteristics of patients are reported in Table 1. Among the 37 patients, 23 (62%) were men. The mean age of the cohort was 44 years. The first psychotic clinical manifestations appeared at a mean age of 20 years, while the mean age at first hospitalization was 24 years. The mean total number of hospitalizations was 7.7 with an average length of hospital stay of 42 days. A total of 13 (35%) patients had a history of suicide attempts. In the cohort, 6 (16%) patients had a first degree family history of schizophrenic or schizoaffective disorders, and 11 (30%) had a second degree or above. In addition, 21 (57%) patients were active smokers, and 5 (14%) had criteria for alcohol disorder.
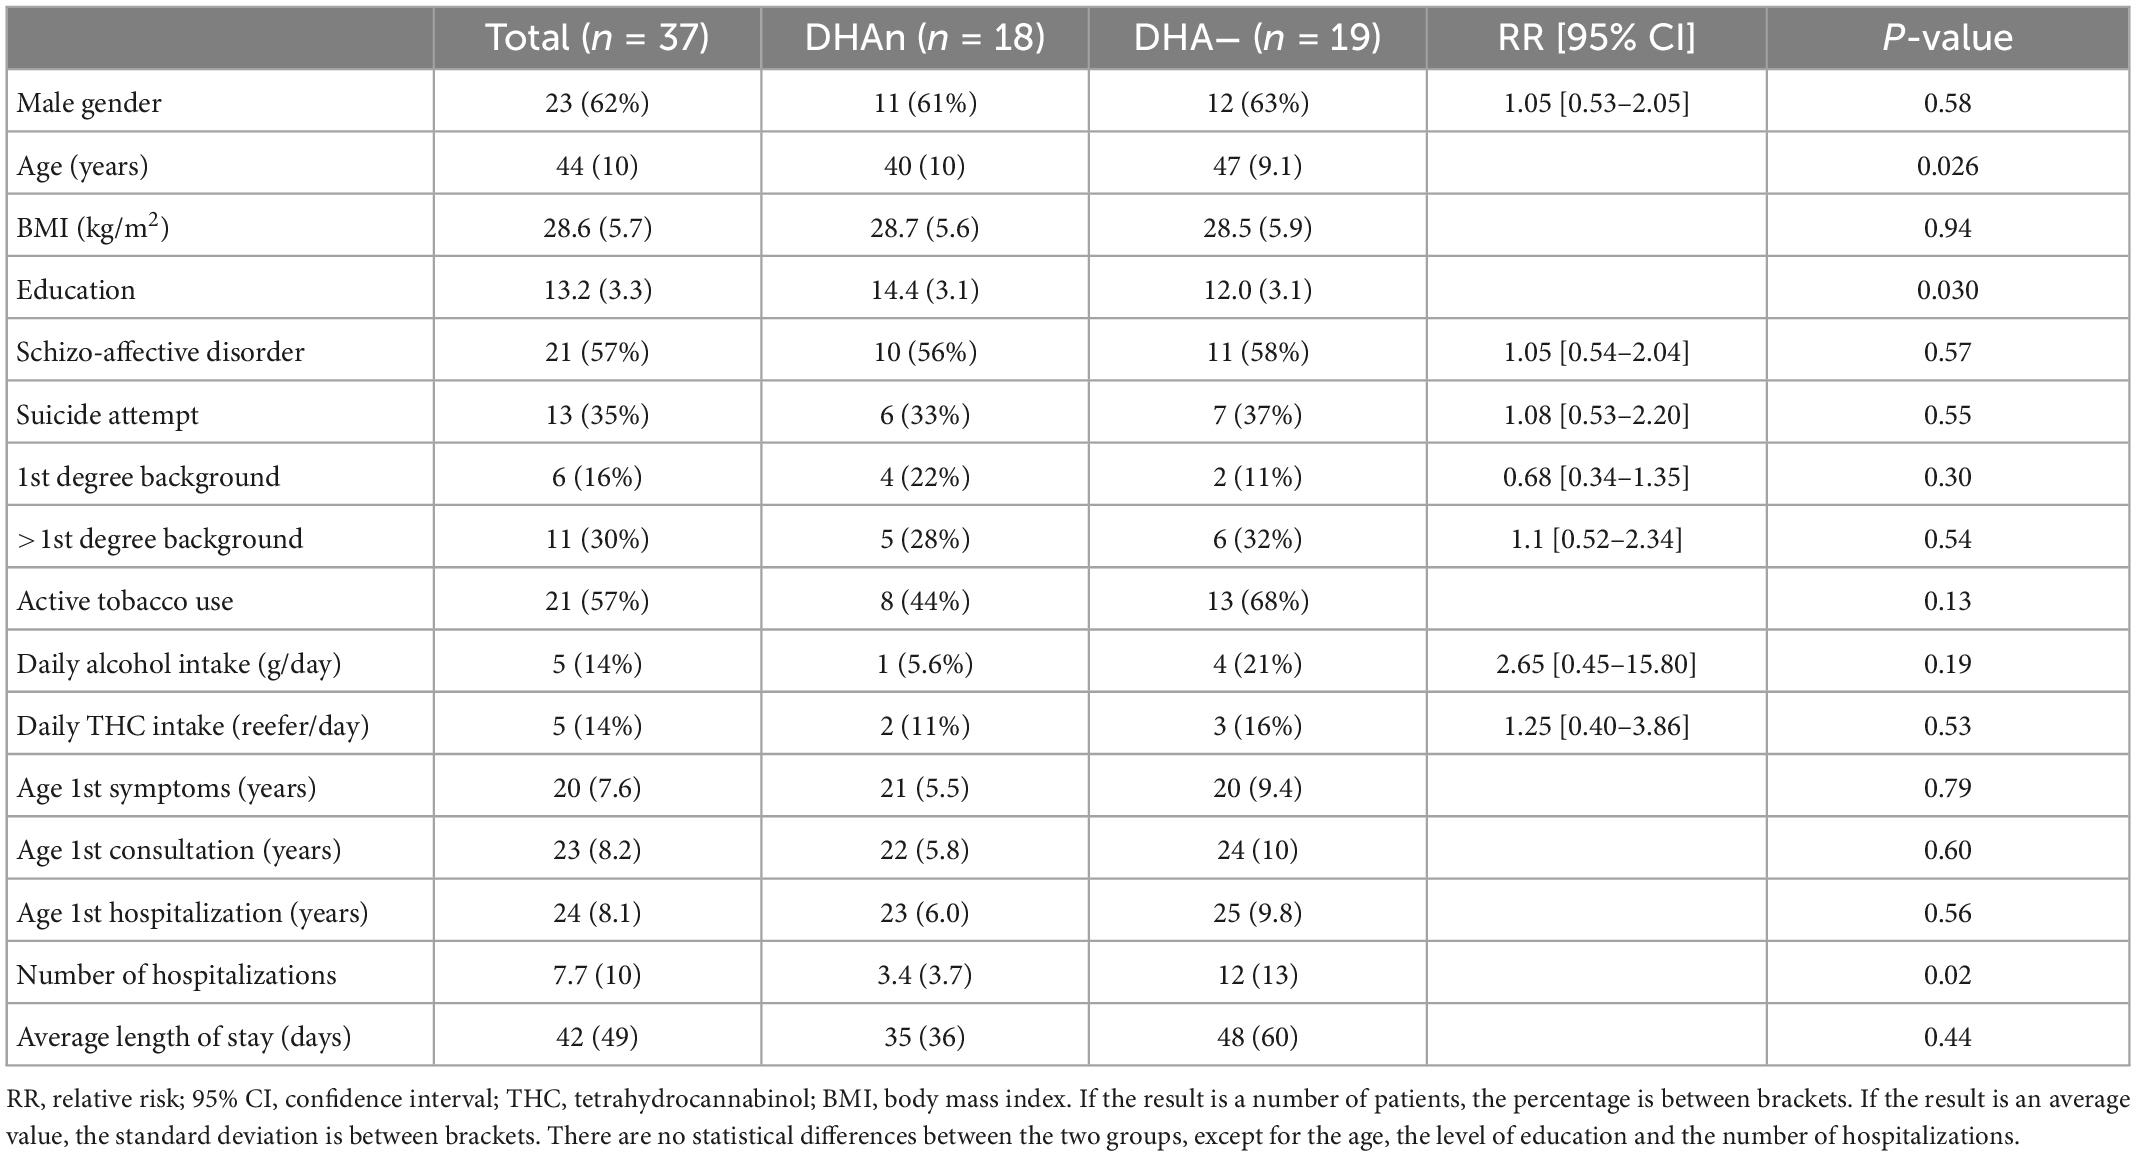
Table 1. Sociodemographic and clinical characteristics of the patient population, comparing the two groups DHAn and DHA−.
The fatty acid composition of RBC membranes from patients was determined by Mass Spectrometry (Table 2). The rate of the ω6 AA was increased in patients, with a mean value of 16.2%, as compared to the rate of the general population which is between 12.7 and 14.7% (86). Only 4 patients presented a normal AA rate. The rate of the ω3 DHA was slightly lowered, with a mean value of 5.6%, whereas the normal rate is between 5.7 and 7.8%. ALA rate was also lowered, with an average of 0.11%, for a normal rate between 0.2 and 0.3%.
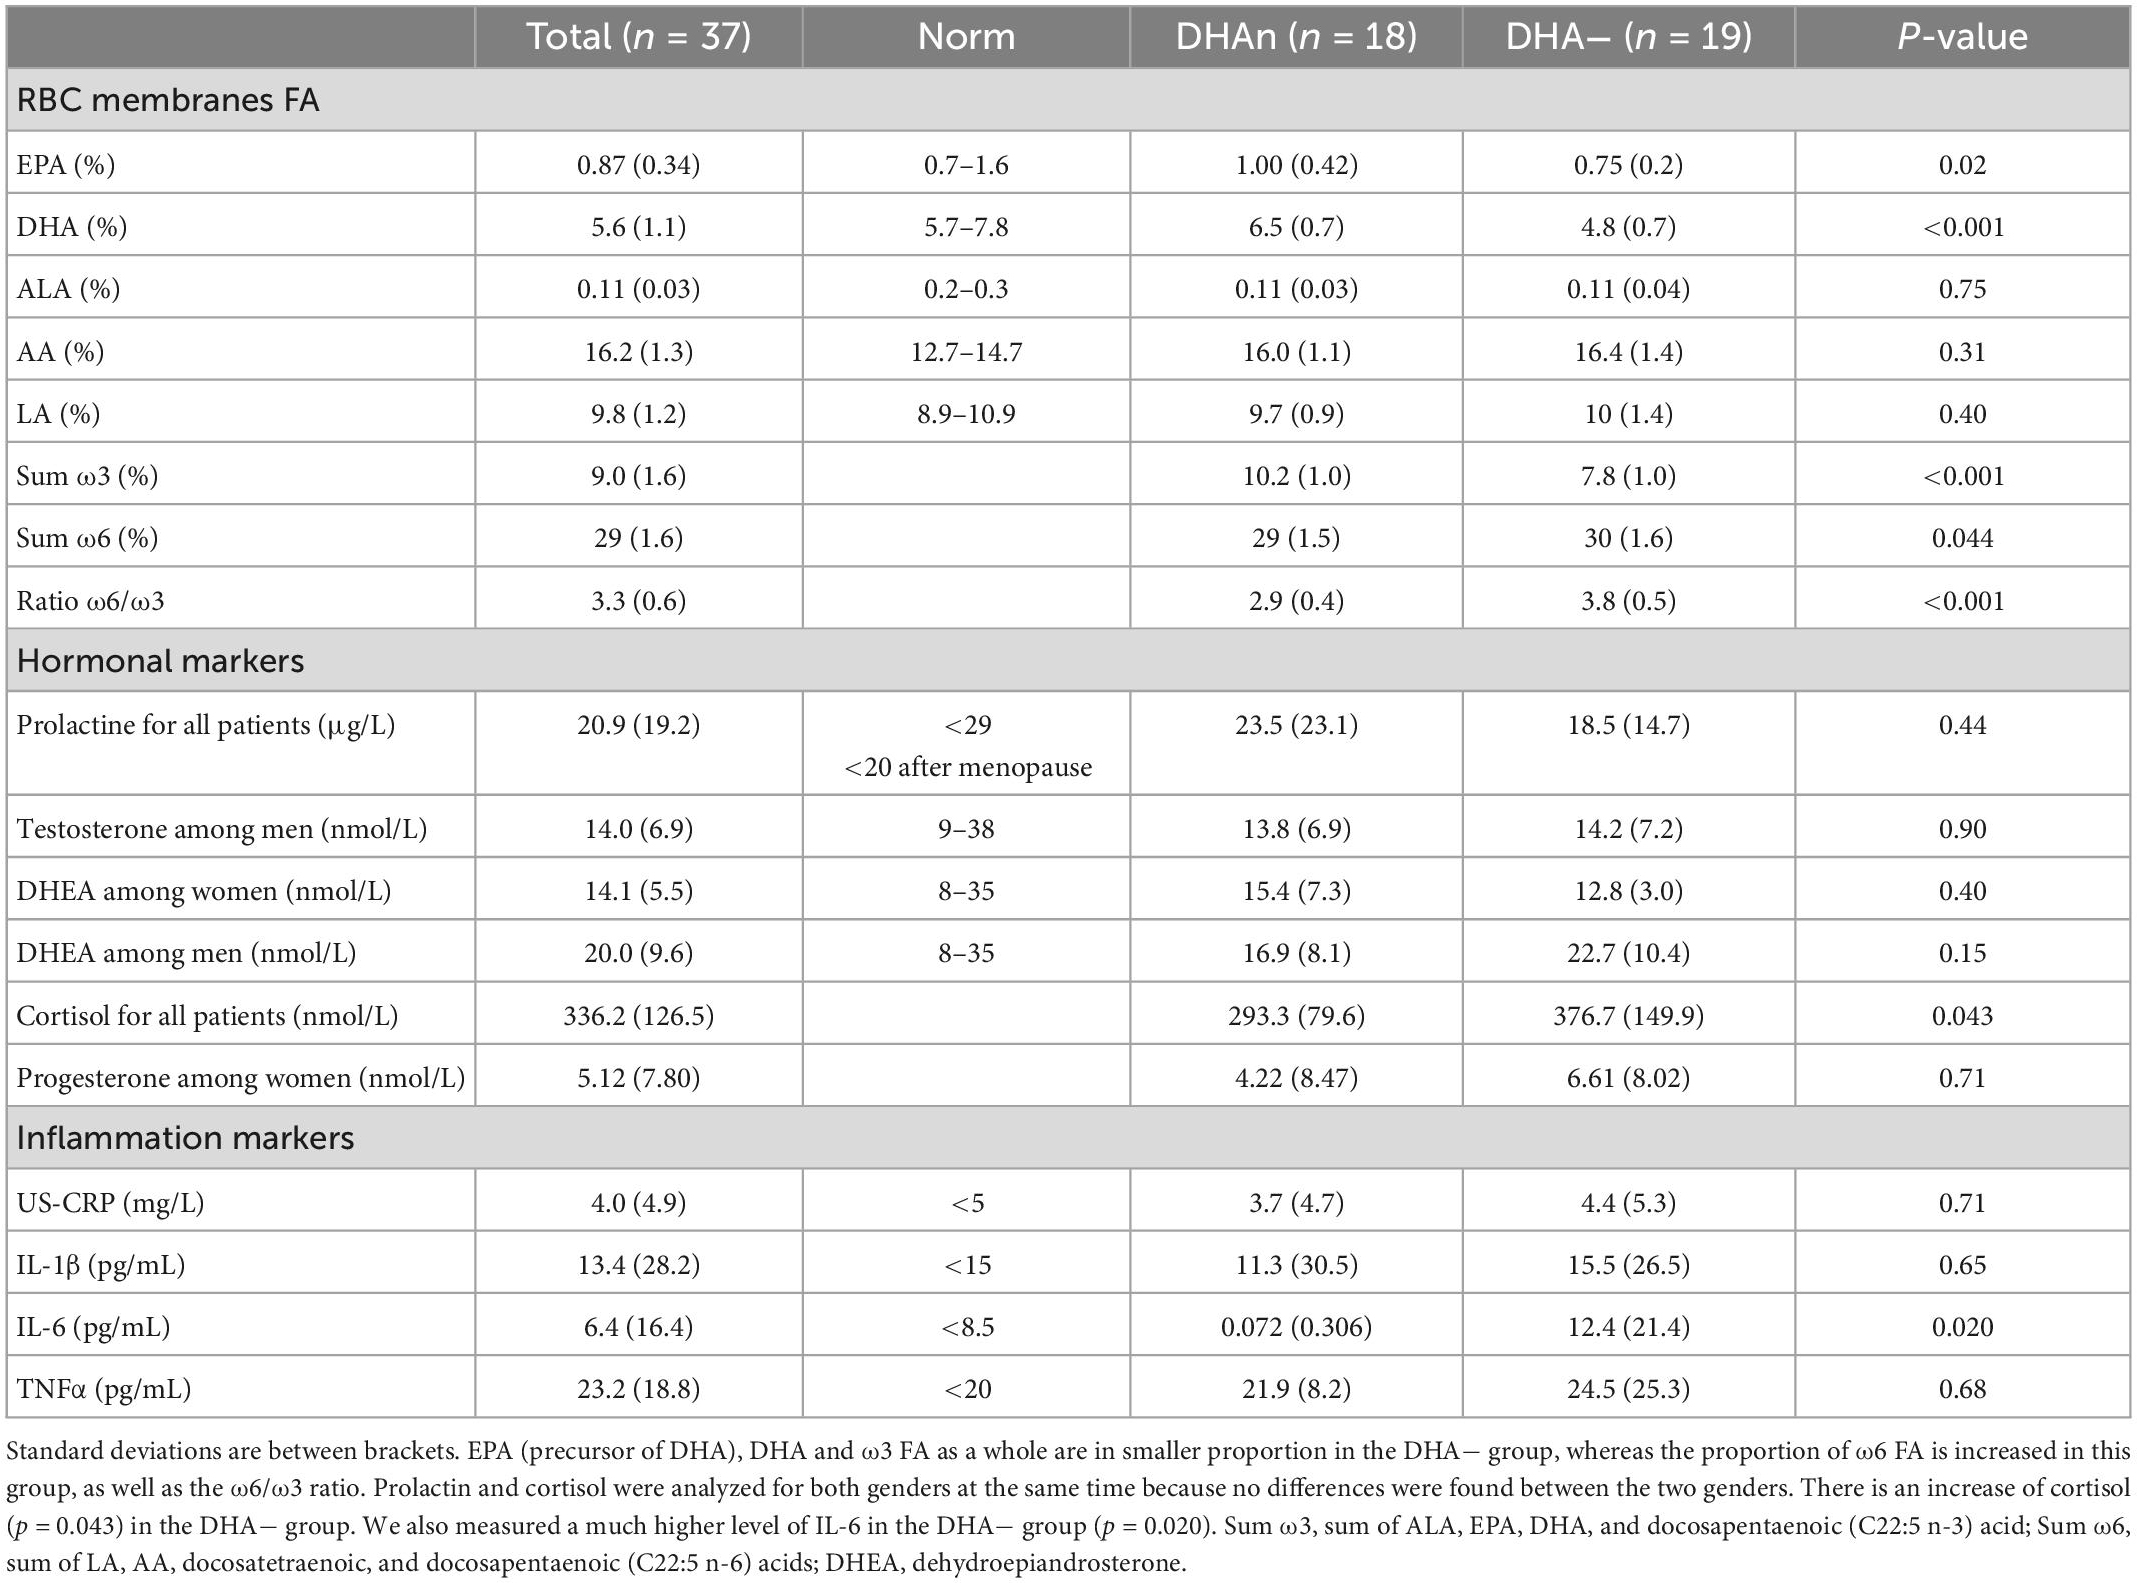
Table 2. Comparison of the RBC membranes fatty acid (FA) composition, hormonal markers and inflammation markers from patients of the two groups.
Dosages of hormonal and inflammation markers among patients are reported in Table 2. Only TNFα was increased for all patients, with an average rate of 23.2 pg/mL, while the normal rate is under 20 pg/mL.
Results on the perceived quality of life are given in Table 3, while Table 4 reports psychopathology and cognitive scores. As expected in this stabilized population, the GAF score was on average at 51, corresponding to moderate symptoms or moderate difficulties in socio-professional functioning. Similarly, the average PANSS was rated at 81.0, the Calgary at 16.0 and the MoCA at 24.9, corresponding to mild or moderate psychotic, depressive and cognitive symptoms.
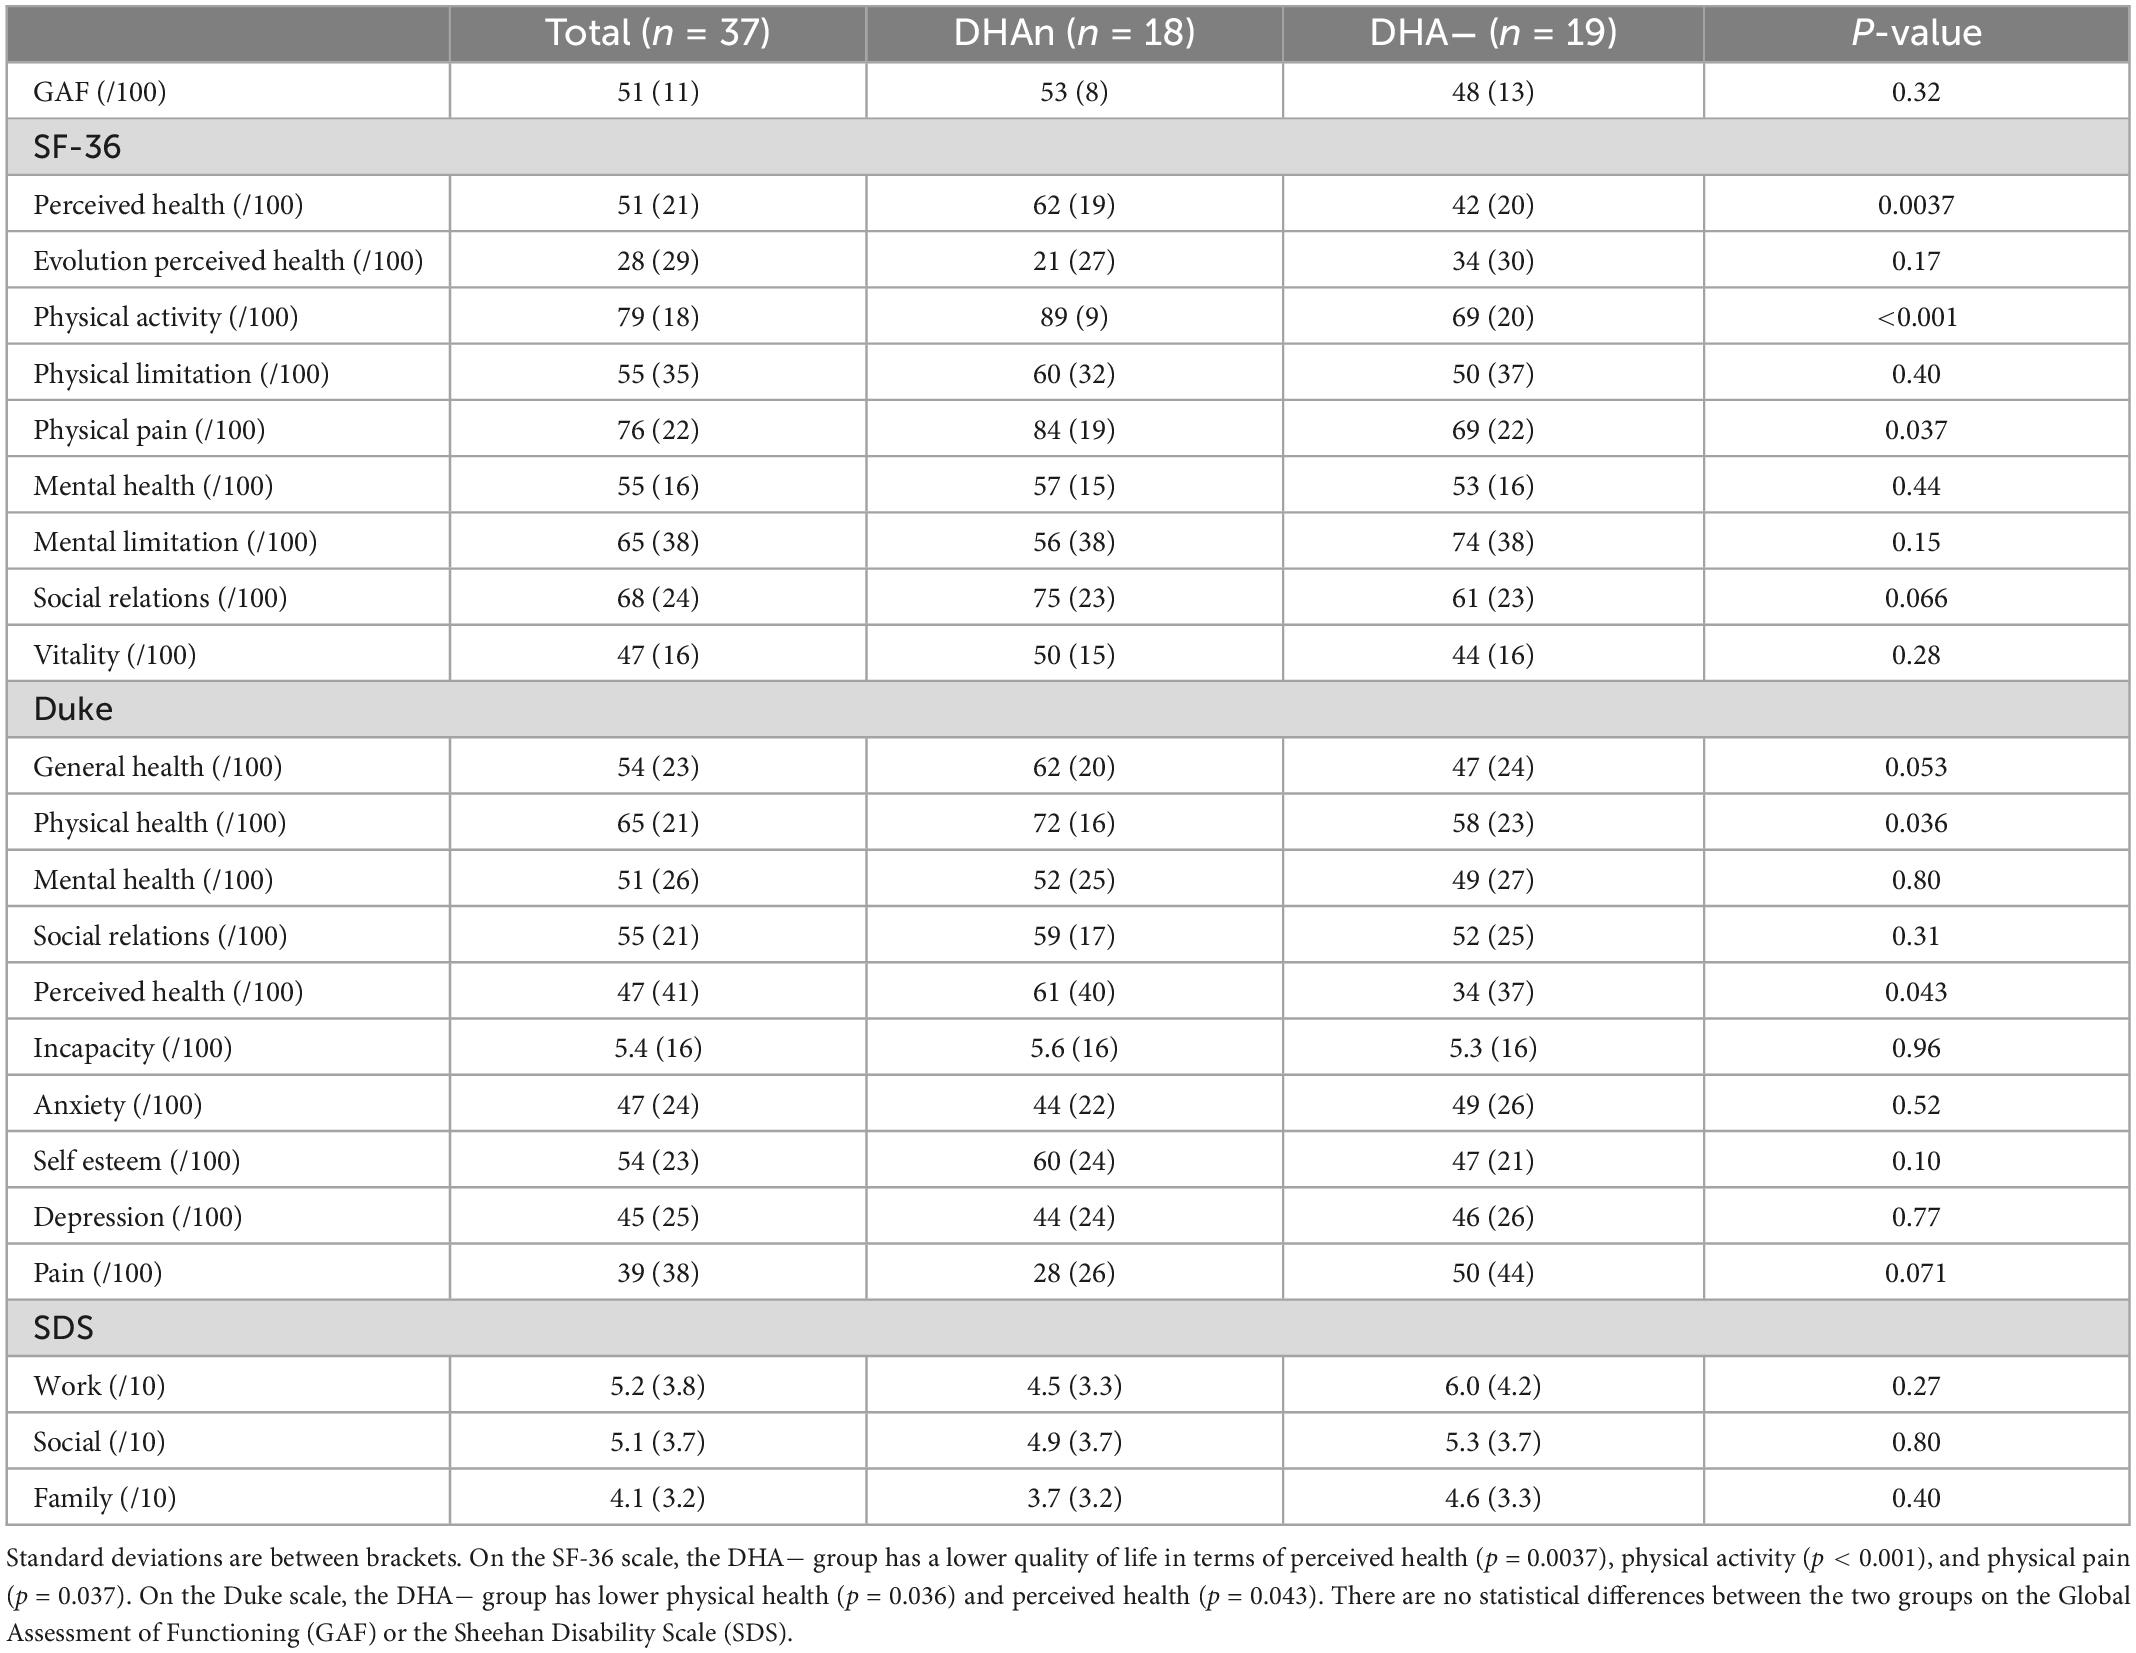
Table 3. Results on the quality of life comparing the two groups.
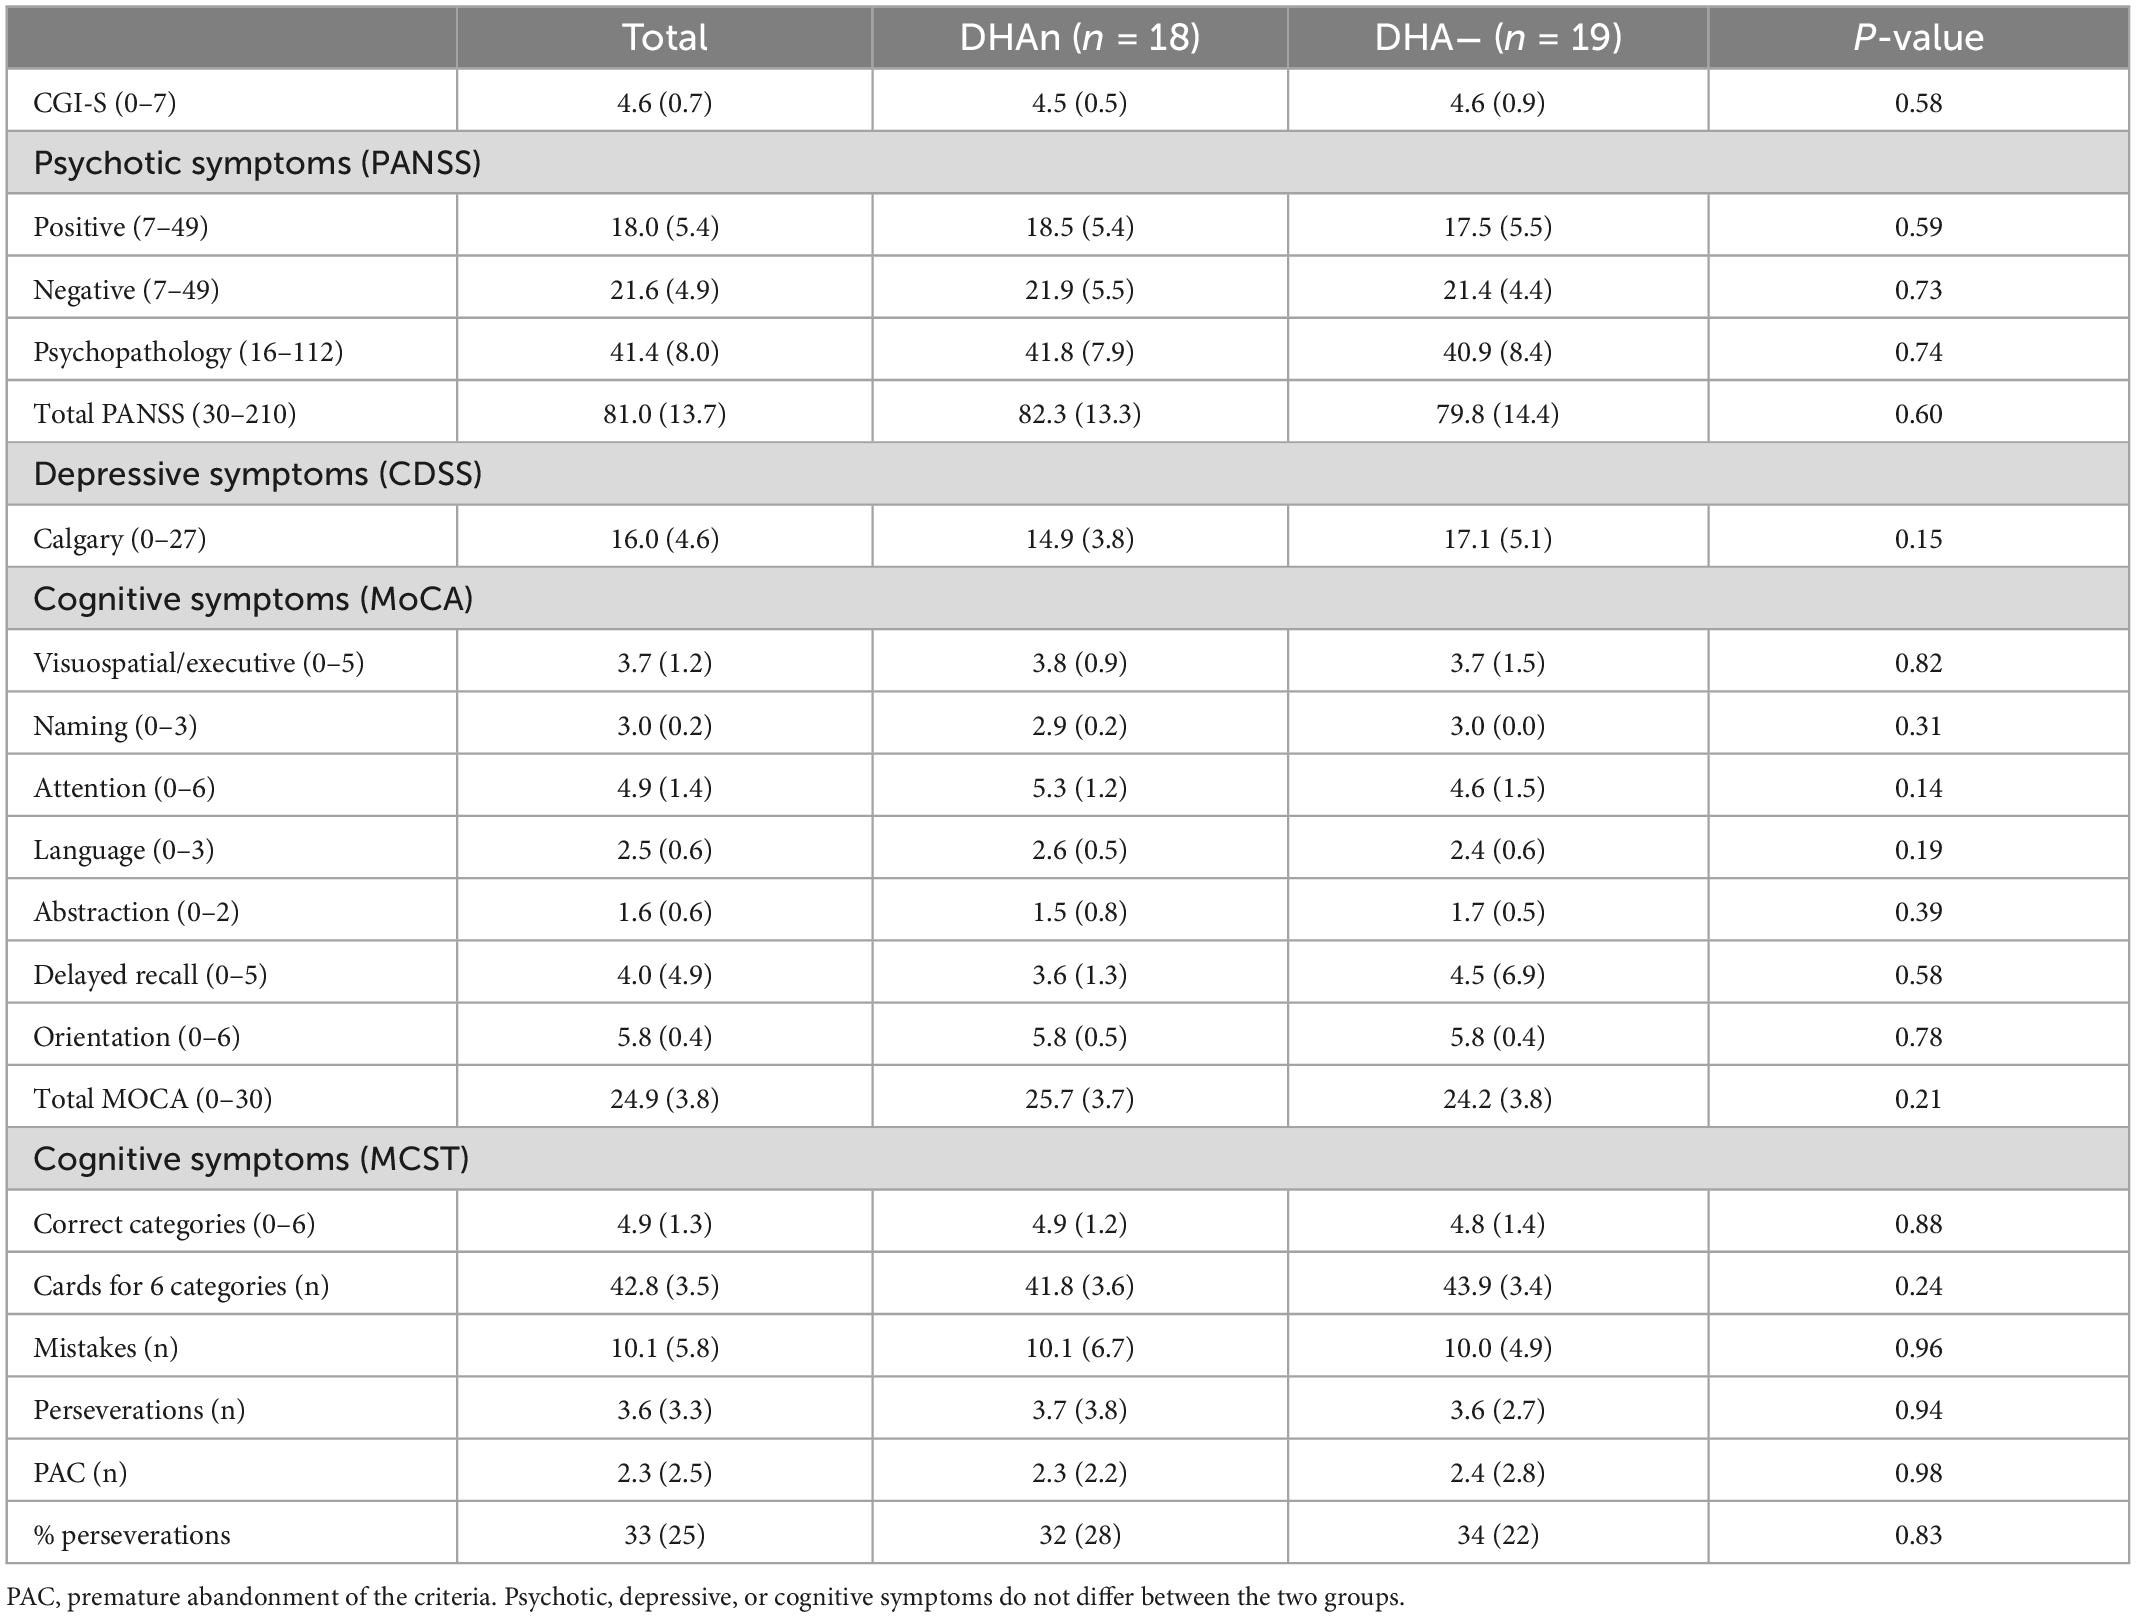
Table 4. Results on the neuropsychiatric symptoms comparing the two groups.
The evidence of an increased AA mean rate along with a decreased DHA mean rate, prompted us to examine the AA and DHA distribution within the studied cohort. AA rates were high in almost all patients (N = 33), whereas DHA rates were low in only half of the patients (N = 19). We thus chose to split the cohort into 2 subgroups of patients according to their DHA rate. The group named DHAn (N = 18) was constituted of patients whose RBC membrane DHA content was in the range of the norm (N = 17) or above (N = 1), and the group named DHA− (N = 19) was composed of patients with a low DHA rate (Figure 1).
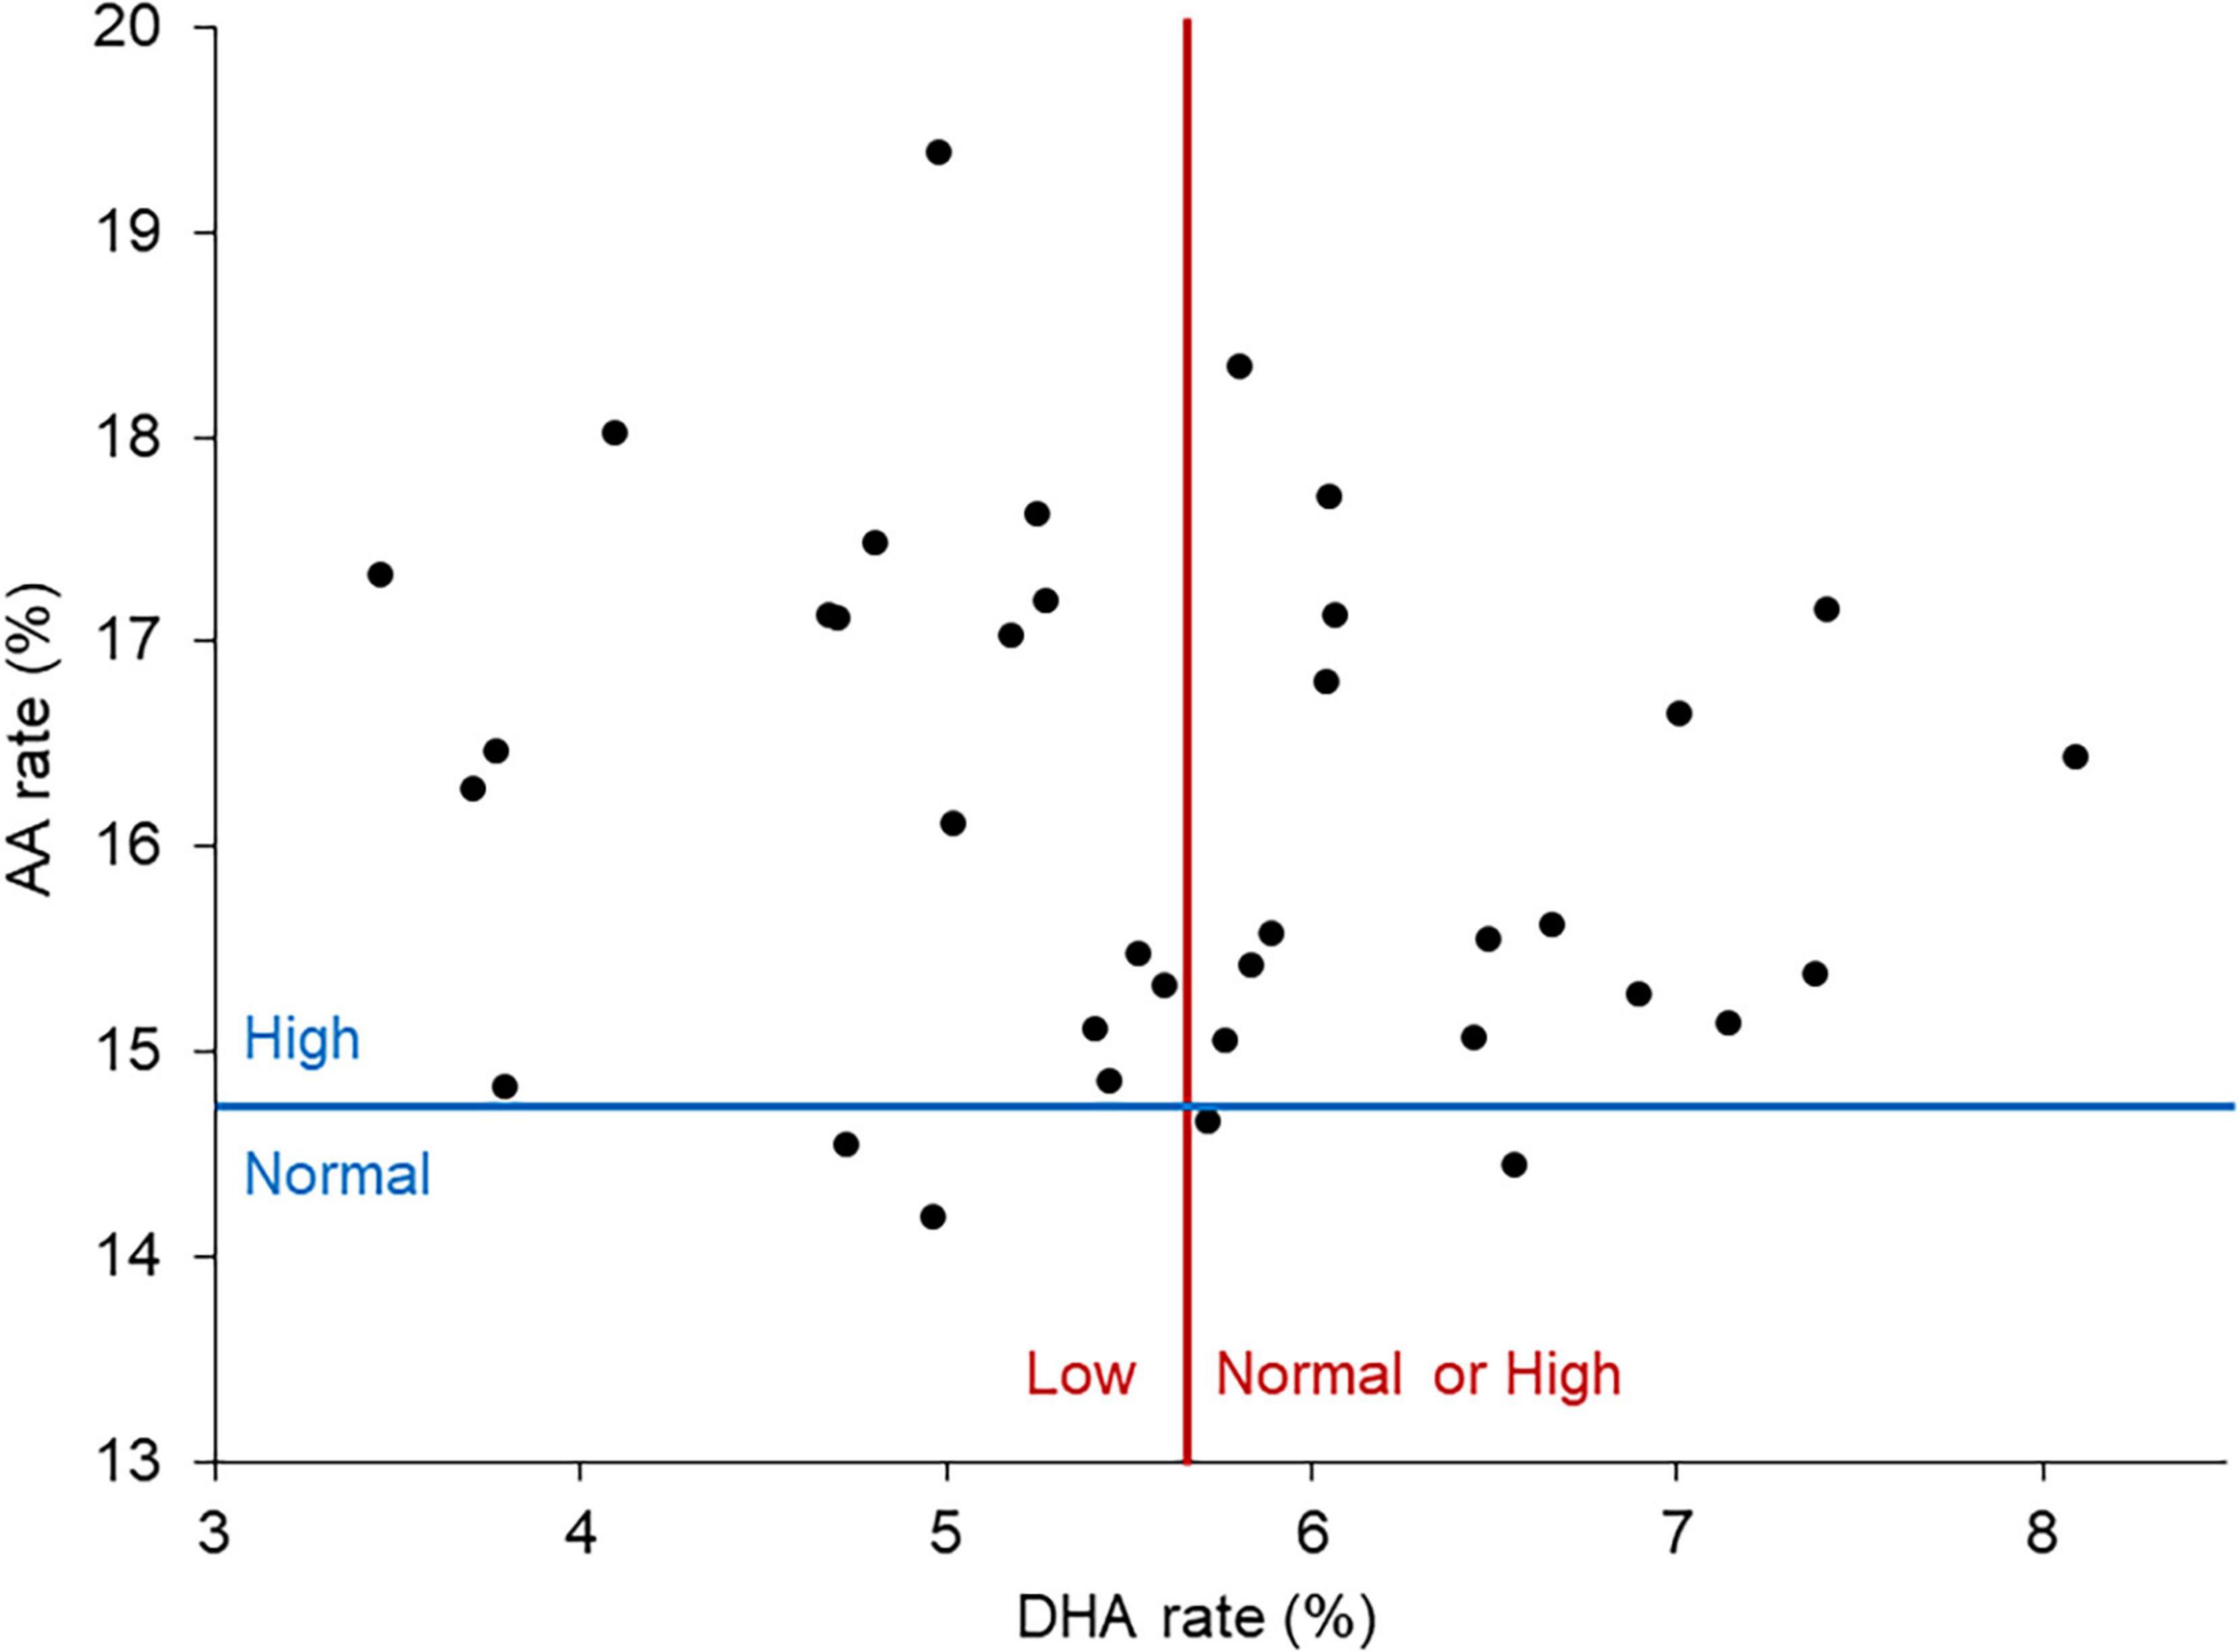
Figure 1. DHA and AA rates among patients. The red line corresponds to the threshold between low and normal or high DHA rates. The blue line corresponds to the threshold between normal and high AA rates. Almost all patients had an elevated AA level. Patients were divided in two groups of comparable size based on their DHA level: DHAn corresponding to a normal or high DHA rate and DHA– corresponding to a low DHA rate.
Patients in the DHA− group were older (47 vs. 40 years, p = 0.026), and had a lower level of education (12.0 vs. 14.4, p = 0.03) (Table 1). They had a higher number of hospitalizations (12 vs. 3.4, p = 0.02) but the length of full-time hospital stay was identical.
There was no statistically significant difference between the two groups in terms of duration of untreated psychosis (DUP), considered either as the duration between the first symptoms and the first consultation (3.89 vs. 1.85 years, p = 0.25), or between the first symptoms and the first hospitalization (4.67 vs. 2.32 years, p = 0.20).
No significant differences were measured between DHA− and DHAn groups in terms of sex ratio, body mass index, proportion of schizoaffective disorder diagnosis, suicidal attempts, or first (or more) degree family history of schizophrenia or schizoaffective disorder. Likewise, no significant differences were found concerning comorbid substance uses, or age of illness onset (first symptoms, consultation, or hospitalization). There were also no statistical differences between the two groups in terms of diet habits and physical activity (Supplementary Table 1).
Consistent with the membrane DHA ratio decrease, we found a significant decrease of the ω3 EPA (0.75 vs. 1.00, p = 0.02) and of the total ω3 content (7.8 vs. 10.2, p < 0.001) in patients from the DHA− group, whereas the total ω6 content was slightly increased (30 vs. 29, p = 0.044) (Table 2). The ω6/ω3 ratio was also different between the two groups with a higher ratio in the DHA− group (3.8 vs. 2.9, p < 0.001).
The two groups did not differ significantly in metabolic-energetic markers values (Supplementary Table 2), such as LDL-cholesterol, HDL-cholesterol, triglycerides, fasting blood sugar, glycated hemoglobin, B6, B9, B12 vitamins, amino acids, and bile acids.
Interestingly, patients in the DHA− group had a higher rate of cortisol (376.7 vs. 293.3 nM, p = 0.043, see also Figure 2A). No gender differences were found in prolactin and cortisol (Table 2).
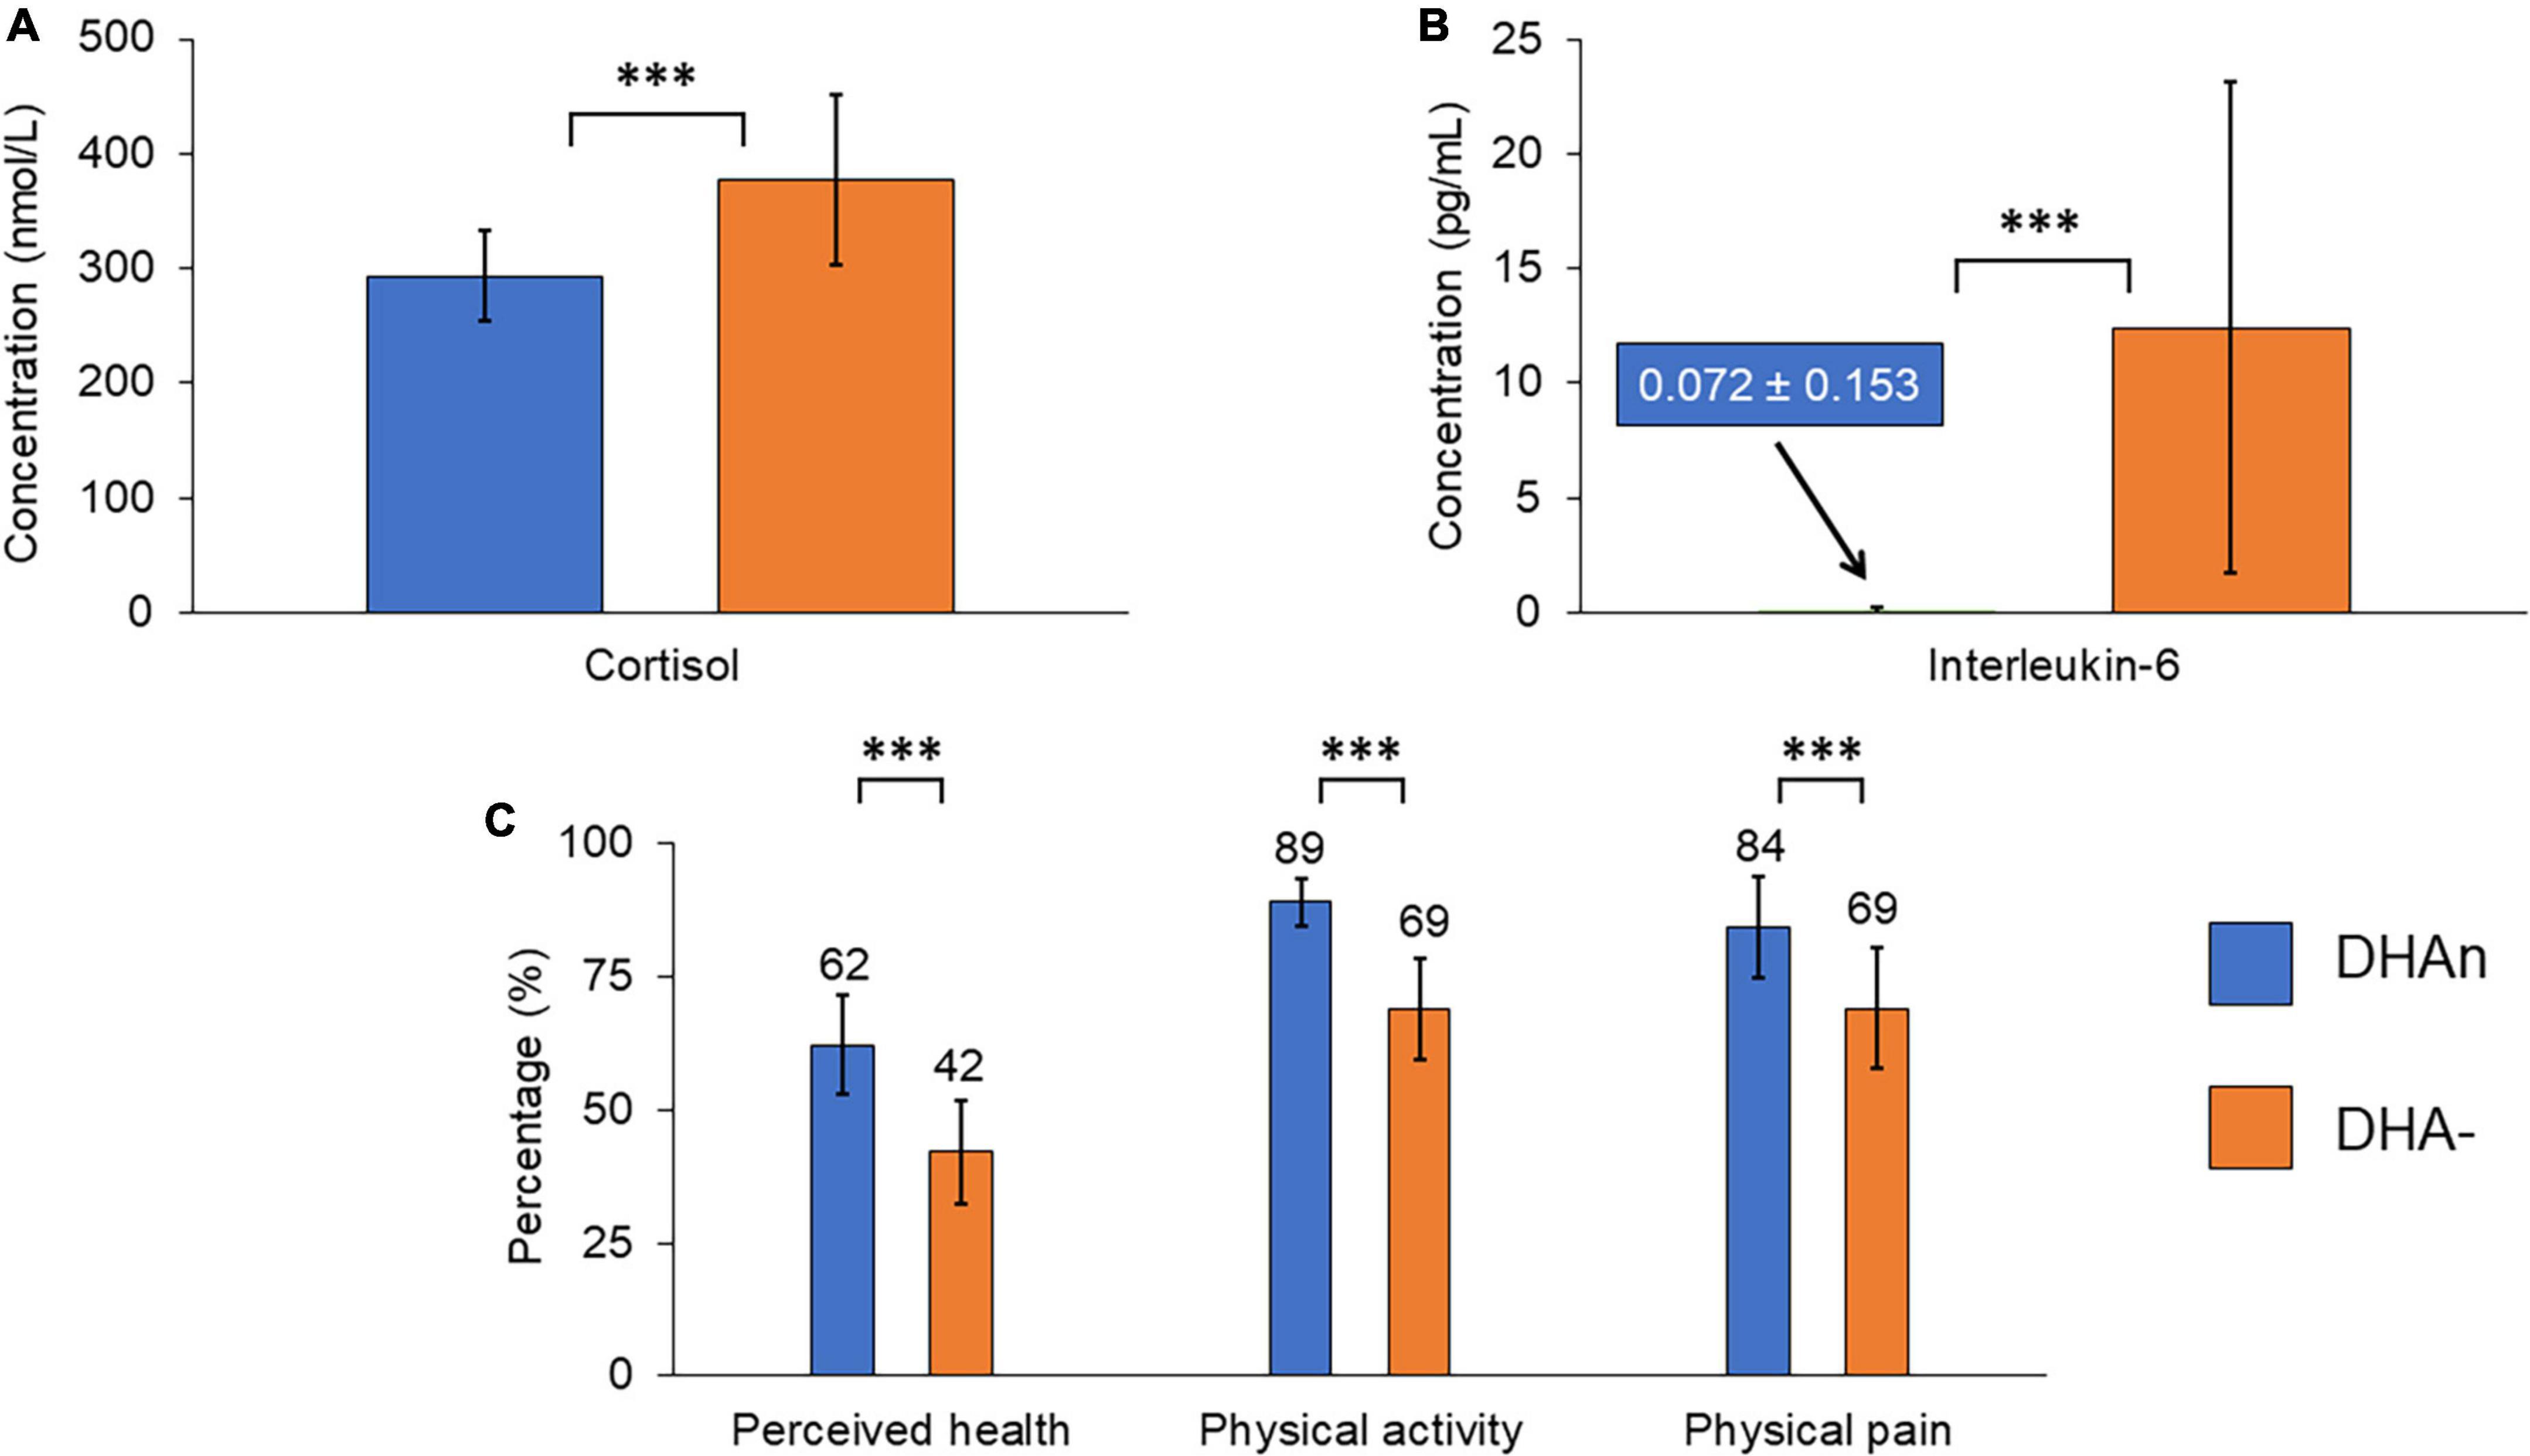
Figure 2. Summary graph of the main differences observed between the two groups of patients: (A) Cortisol level, (B) interleukin-6 level, and (C) quality of life as measured by the SF-36 scale. The cortisol and interleukin-6 levels are increased in the DHA– group. Quality of life dimensions represented here are decreased in the DHA– group. Error bars are standard deviations. ***Means p < 0.05 by χ2 test for nominal variables and T-test for continuous variables.
Finally, concerning inflammation markers (Table 2 and Figure 2B), IL-6 rates were dramatically increased in the DHA− group (12.4 vs. 0.072 pg/mL, p = 0.020), whereas no statistical difference was observed for TNFα, IL-1β, or US-CRP between the two DHA groups.
Quality of life measurements assessed with the SF-36 scale (Table 3 and Figure 2C) showed a lower perceived health (42 vs. 62%, p = 0.0037), lower physical activity (69 vs. 89%, p < 0.001), worse physical pain (69 vs. 84%, p = 0.037), and a tendency to poorer social relations (61 vs. 75%, p = 0.066) in the DHA− group. The Duke scale also showed a lower quality of life in the DHA− group in terms of physical health (58 vs. 72%, p = 0.036), perceived health (34 vs. 61%, p = 0.043), and general health (47 vs. 62%, p = 0.053). There was no significant difference between the two DHA groups in functional impairment evaluated either by the SDS or the GAF.
The evaluation of the psychotic, depressive, or cognitive symptoms based on PANSS, CDSS, and MoCA scores did not show any differences between the two groups (Table 4, Supplementary Table 3). Likewise, the severity of the disease evaluated by the clinician (CGI-S) was in the same range for both groups.
Lipidomic analysis of the RBC membrane of patients from our cohort of 37 individuals showed that 19 (51%) of them displayed a lower level of the ω3 fatty acid DHA compared to the range of the general population. Patients in this DHA− group had higher cortisol and IL-6 levels, and they presented lower quality of life scores and higher number of full-time hospitalizations (Tables 1–3 and Figure 2).
The observed membrane abnormalities in DHA− patients are not likely to result from differences in diet habit or energy metabolism whose markers did not differ between both groups although we lacked data on mitochondrial metabolism. Sex ratio and lifestyle (body mass index, physical activity, and substance use) are not confounding factors either since these parameters were not different between both DHA groups (Supplementary Table 1).
Increased cortisol in the DHA− group suggests a higher level of chronic stress in these patients, or the existence of physio-pathological processes that are costly for organisms with a lower functionality. Increased basal cortisol level is a well-established finding in patients with schizophrenia compared to healthy controls (87–89); in addition, hypercortisolemia was found to trigger psychotic symptoms (90).
IL-6 values were also specifically increased in the DHA− group. In the DHAn group, only one patient presented a weakly positive IL-6 value (1.3 pg/mL) while it was undetectable for the rest of the group. In contrast, IL-6 level was high (>10 pg/mL) for 7 out of the 19 patients in the DHA− group. Strikingly, higher IL-6 level was not associated with any other inflammation markers such as US-CRP, IL-1β, or TNFα. Furthermore, the 7 patients in the DHA− group that displayed higher IL-6 rates had comparable proportion of DHA compared to the whole DHA− group (4.8% in both cases).
The anti-inflammatory properties of DHA have been widely studied. According to some in vitro works, DHA would act differentially on TNFα and IL-6 expression, selectively reducing IL-6 expression without any effect on TNFα (91, 92), through the reduction of NFkB activity. This is in line with our results.
The effect of APs on cortisol and IL-6 levels is also a critical issue in particular since APs have been shown to induce IL-6 genes methylation, resulting in lower rates of IL-6 when prescribed in drug-naïve patients suffering from schizophrenia (93). Blood levels of IL-6 and cortisol were also found to be lower upon administration of the AP haloperidol to healthy volunteers (89).
Another important result of our study is the significant differences in quality of life between the two DHA groups. Scores of SF-36 and Duke scales both attested to a poorer physical health, perceived health, physical pain perception, and general health in patients from the DHA− group. There was also a tendency for the DHA− group to perform worse on the social health scale.
In line with the animal study of Abbott et al. (94) we did not find in our cohort any correlation between lifestyle (diet and physical activity) and DHA level in RBC membranes. In agreement with this finding, while 3 patients in our sample received an ω3 supplementation (at around 900 mg/j), 2 of them belonged to the DHA− group. Deficits in ω3 were repeatedly shown to be associated with various cognitive deficits in schizophrenia (95). This finding has been further supported by a recent animal study showing that a diet deficient in ω3 during development was associated with a motivational deficit later in life (96). This would explain the differences observed between the two DHA groups in terms of perceived health.
Finally, the symptomatology did not differ between the two DHA groups, whether at the psychotic, depressive, or cognitive level. There was, however, a small tendency (p < 0.2) for more depressive symptoms and less attentional abilities in the DHA− group.
One should note that the increase of AA measured here in patients with schizophrenia is in contradiction with some previous studies that observed a decrease of both AA and DHA in the RBC of patients (30, 31, 51). This may be due to the fact that these studies were conducted on patients in the acute phase and/or in the absence of any AP treatment. In agreement with this, a study in which patients were in a remitted or partly remitted phase of schizophrenia reported higher FA levels in patients compared to controls (54). Our cohort also focused on patients in the stabilization phase, where there might be compensatory or preventive mechanisms, generating a reserve pool of AA that would be quickly consumed during the acute phase. Another explanation may be that AP treatments would correct the decrease of AA, whereas it would not have any effect on DHA levels.
This study has several limitations. First, the small number of patients makes it difficult to draw any definitive conclusions and calls for a multicentric study conducted on a wider sample. Second, we observed that patients in the DHA− group were significantly older, had a significantly lower level of education, and a higher number of hospitalizations. These parameters can be confounding factors, or a sign of more severe illness in the DHA− group. The fact that the DHA− group had a lower level of education could thus be related to the neurodevelopmental hypothesis of schizophrenia. Finally, this study was exploratory, and we acknowledge that such data-driven exploratory study is subject to alpha inflation due to multiple testing.
The present work suggests that specific biological markers such as RBC membrane FA content could be the signature of a specific endophenotype of schizophrenia patients with higher stress and inflammatory response, as well as a lower quality of life. Though preliminary, it could guide non-pharmacological interventions based on biological results, in particular by addressing critical questions such as lifestyle habits and stress management. It could also pave the way for future research directions aiming at using biological markers to optimize the pharmacological treatment of already stabilized patients.
The datasets presented in this article are not readily available because datasets are the ownership of Assistance Publique–Hôpitaux de Paris (AP-HP). Requests to access the datasets should be directed to VA, dmxhZGltaXIuYWRyaWVuQGFwaHAuZnI=.
The studies involving human participants were reviewed and approved by AP-HP Health Data Warehouse (EDS). The patients/participants provided their written informed consent to participate in this study.
VA designed the protocol of the study under PN supervision. VA, NB, and PN performed data extraction and analysis. VA, HF, DT, and PN wrote the manuscript. CT and SM supervised the development of this work. NB, CT, SM, and FF reviewed the manuscript. All authors contributed to the article and approved the submitted version.
This work was supported by the “Fondation de France—Recherche fondamentale et clinique sur les maladies psychiatriques” (00101826) and the “Fondation Pierre Houriez”. HF received a Ph.D. fellowship from the “Fondation pour la Recherche Médicale” and was a Ph.D. student from the FIRE Ph.D. program funded by the “Fondation Bettencourt Schueller” and the EURIP graduate program (ANR-17-EURE-0012). The funding sources had no further role in the study design, the data collection, analysis and interpretation, the writing of the manuscript, or the decision to submit it for publication.
This work is an in-house research initiative of the Psychiatry Department of the Saint-Antoine Hospital, Sorbonne University, Paris, France. We thank Isabelle Carasso for collecting the blood samples of patients, Antonin Lamazière for the analysis of red blood cell membrane fatty acid composition, and Nathanaël Lapidus for his help on the statistical analysis.
The authors declare that the research was conducted in the absence of any commercial or financial relationships that could be construed as a potential conflict of interest.
All claims expressed in this article are solely those of the authors and do not necessarily represent those of their affiliated organizations, or those of the publisher, the editors and the reviewers. Any product that may be evaluated in this article, or claim that may be made by its manufacturer, is not guaranteed or endorsed by the publisher.
The Supplementary Material for this article can be found online at: https://www.frontiersin.org/articles/10.3389/fpsyt.2023.1089724/full#supplementary-material
1. Charlson F, Ferrari A, Santomauro D, Diminic S, Stockings E, Scott J, et al. Global epidemiology and burden of schizophrenia: findings from the Global Burden of Disease Study 2016. Schizophr Bull. (2018) 44:1195–203. doi: 10.1093/schbul/sby058
3. McGrath J, Saha S, Chant D, Welham J. Schizophrenia: a concise overview of incidence, prevalence, and mortality. Epidemiol Rev. (2008) 30:67–76. doi: 10.1093/epirev/mxn001
4. Ripke S, Neale B, Corvin A, Walters J, Farh K, Holmans P, et al. Biological insights from 108 schizophrenia-associated genetic loci. Nature. (2014) 511:421–7. doi: 10.1038/nature13595
6. Cullberg J. Stressful life events preceding the first onset of psychosis. An explorative study. Nord J Psychiatry. (2003) 57:209–14. doi: 10.1080/08039480310001373
7. Fusar-Poli P, Tantardini M, De Simone S, Ramella-Cravaro V, Oliver D, Kingdon J, et al. Deconstructing vulnerability for psychosis: meta-analysis of environmental risk factors for psychosis in subjects at ultra high-risk. Eur Psychiatry. (2017) 40:65–75. doi: 10.1016/j.eurpsy.2016.09.003
8. van Rossum J. [The effect of psychostimulants on the central and autonomic nervous system]. Schweiz Z Sportmed. (1967) 15:26–40.
9. Baumeister A, Francis J. Historical development of the dopamine hypothesis of schizophrenia. J Hist Neurosci. (2002) 11:265–77. doi: 10.1076/jhin.11.3.265.10391
10. Van Os J. A salience dysregulation syndrome. Br J Psychiatry. (2009) 194:101–3. doi: 10.1192/bjp.bp.108.054254
11. Pillinger T, D’Ambrosio E, McCutcheon R, Howes O. Is psychosis a multisystem disorder? A meta-review of central nervous system, immune, cardiometabolic, and endocrine alterations in first-episode psychosis and perspective on potential models. Mol Psychiatry. (2019) 24:776–94. doi: 10.1038/s41380-018-0058-9
12. Kirkpatrick B. Schizophrenia as a systemic disease. Schizophr Bull. (2009) 35:381–2. doi: 10.1093/schbul/sbn183
13. Green M, Satz P, Christenson C. Minor physical anomalies in schizophrenia patients, bipolar patients, and their siblings. Schizophr Bull. (1994) 20:433–40. doi: 10.1093/schbul/20.3.433
14. Compton M, Walker E. Physical manifestations of neurodevelopmental disruption: are minor physical anomalies part of the syndrome of schizophrenia? Schizophr Bull. (2009) 35:425–36. doi: 10.1093/schbul/sbn151
15. Boks M, Russo S, Knegtering R, van den Bosch R. The specificity of neurological signs in schizophrenia: a review. Schizophr Res. (2000) 43:109–16. doi: 10.1016/S0920-9964(99)00145-0
16. Gourion D, Goldberger C, Olie J, Loo H, Krebs M. Neurological and morphological anomalies and the genetic liability to schizophrenia: a composite phenotype. Schizophr Res. (2004) 67:23–31. doi: 10.1016/s0920-9964(03)00099-9
17. Yao J, Keshavan M. Antioxidants, redox signaling, and pathophysiology in schizophrenia: an integrative view. Antioxid Redox Signal. (2011) 15:2011–35. doi: 10.1089/ars.2010.3603
18. Sullivan E, O’Donnell P. Inhibitory interneurons, oxidative stress, and schizophrenia. Schizophr Bull. (2012) 38:373–6. doi: 10.1093/schbul/sbs052
19. Prabakaran S, Swatton J, Ryan M, Huffaker S, Huang J, Griffin J, et al. Mitochondrial dysfunction in schizophrenia: evidence for compromised brain metabolism and oxidative stress. Mol Psychiatry. (2004) 9:684–97. doi: 10.1038/sj.mp.4001511
20. Potvin S, Stip E, Sepehry A, Gendron A, Bah R, Kouassi E. Inflammatory cytokine alterations in schizophrenia: a systematic quantitative review. Biol Psychiatry. (2008) 63:801–8. doi: 10.1016/j.biopsych.2007.09.024
21. Muller N. Inflammation in schizophrenia: pathogenetic aspects and therapeutic considerations. Schizophr Bull. (2018) 44:973–82. doi: 10.1093/schbul/sby024
22. Upthegrove R, Khandaker G. Cytokines, oxidative stress and cellular markers of inflammation in schizophrenia. Curr Top Behav Neurosci. (2020) 44:49–66. doi: 10.1007/7854_2018_88
23. Khandaker G, Cousins L, Deakin J, Lennox B, Yolken R, Jones P. Inflammation and immunity in schizophrenia: Implications for pathophysiology and treatment. Lancet Psychiatry. (2015) 2:258–70.
24. Horrobin D, Glen A, Vaddadi K. The membrane hypothesis of schizophrenia. Schizophr Res. (1994) 13:195–207.
25. Mahadik S, Evans D. Is schizophrenia a metabolic brain disorder? Membrane phospholipid dysregulation and its therapeutic implications. Psychiatr Clin North Am. (2003) 26:85–102. doi: 10.1016/s0193-953x(02)00033-3
26. Deutch A, Bubser M. The orexins/hypocretins and schizophrenia. Schizophr Bull. (2007) 33:1277–83.
27. He Y, Kosciolek T, Tang J, Zhou Y, Li Z, Ma X, et al. Gut microbiome and magnetic resonance spectroscopy study of subjects at ultra-high risk for psychosis may support the membrane hypothesis. Eur Psychiatry. (2018) 53:37–45. doi: 10.1016/j.eurpsy.2018.05.011
28. Bloomfield P, Selvaraj S, Veronese M, Rizzo G, Bertoldo A, Owen D, et al. Microglial activity in people at ultra high risk of psychosis and in schizophrenia: an [11C]PBR28 PET brain imaging study. Am J Psychiatry. (2016) 173:44–52.
30. Hoen W, Lijmer J, Duran M, Wanders R, van Beveren N, de Haan L. Red blood cell polyunsaturated fatty acids measured in red blood cells and schizophrenia: a meta-analysis. Psychiatry Res. (2013) 207:1–12. doi: 10.1016/j.psychres.2012.09.041
31. van der Kemp W, Klomp D, Kahn R, Luijten P, Hulshoff Pol HE. A meta-analysis of the polyunsaturated fatty acid composition of erythrocyte membranes in schizophrenia. Schizophr Res. (2012) 141:153–61. doi: 10.1016/j.schres.2012.08.014
32. Bentsen H, Solberg D, Refsum H, Bohmer T. Clinical and biochemical validation of two endophenotypes of schizophrenia defined by levels of polyunsaturated fatty acids in red blood cells. Prostaglandins Leukot Essent Fatty Acids. (2012) 87:35–41. doi: 10.1016/j.plefa.2012.05.005
33. Montesinos-Rueda L, Canete-Crespillo J, Palma-Sevillano C, Gine-Serven E. Erythrocyte membrane polyunsaturated fatty acid (pufa) levels in a sample of patients with schizophrenia and relation with clinical and progression variables. Actas Esp Psiquiatr. (2015) 43:170–6.
34. Schmitt A, Wilczek K, Blennow K, Maras A, Jatzko A, Petroianu G, et al. Altered thalamic membrane phospholipids in schizophrenia: a postmortem study. Biol Psychiatry. (2004) 56:41–5. doi: 10.1016/j.biopsych.2004.03.019
35. Yao J, Leonard S, Reddy R. Membrane phospholipid abnormalities in postmortem brains from schizophrenic patients. Schizophr Res. (2000) 42:7–17.
36. Calder P. Polyunsaturated fatty acids and inflammation. Prostaglandins Leukot Essent Fatty Acids. (2006) 75:197–202.
37. Tessier C, Sweers K, Frajerman A, Bergaoui H, Ferreri F, Delva C, et al. Membrane lipidomics in schizophrenia patients: a correlational study with clinical and cognitive manifestations. Transl Psychiatry. (2016) 6:e906–8. doi: 10.1038/tp.2016.142
38. Guest J, Garg M, Bilgin A, Grant R. Relationship between central and peripheral fatty acids in humans. Lipids Health Dis. (2013) 12:79.
39. Peters B, Machielsen M, Hoen W, Caan M, Malhotra A, Szeszko P, et al. Polyunsaturated fatty acid concentration predicts myelin integrity in early-phase psychosis. Schizophr Bull. (2013) 39:830–8. doi: 10.1093/schbul/sbs089
40. Richardson A, Allen S, Hajnal JV, Cox I, Easton T, Puri B. Associations between central and peripheral measures of phospholipid breakdown revealed by cerebral 31-phosphorus magnetic resonance spectroscopy and fatty acid composition of erythrocyte membranes. Prog Neuropsychopharmacol Biol Psychiatry. (2001) 25:1513–21. doi: 10.1016/s0278-5846(01)00211-1
41. Yao JK, Stanley J, Reddy R, Keshavan M, Pettegrew J. Correlations between peripheral polyunsaturated fatty acid content and in vivo membrane phospholipid metabolites. Biol Psychiatry. (2002) 52:823–30. doi: 10.1016/s0006-3223(02)01397-5
42. Tan Z, Harris W, Beiser A, Au R, Himali J, Debette S, et al. Red blood cell ω-3 fatty acid levels and markers of accelerated brain aging. Neurology. (2012) 78:658–64.
43. Alqarni A, Mitchell T, McGorry P, Nelson B, Markulev C, Yuen H, et al. Comparison of erythrocyte omega-3 index, fatty acids and molecular phospholipid species in people at ultra-high risk of developing psychosis and healthy people. Schizophr Res. (2020) 226:44–51. doi: 10.1016/j.schres.2019.06.020
44. McEvoy J, Baillie R, Zhu H, Buckley P, Keshavan M, Nasrallah H, et al. Lipidomics reveals early metabolic changes in subjects with schizophrenia: effects of atypical antipsychotics. PLoS One. (2013) 8:e68717. doi: 10.1371/journal.pone.0068717
45. Arvindakshan M, Ghate M, Ranjekar P, Evans D, Mahadik S. Supplementation with a combination of omega-3 fatty acids and antioxidants (vitamins E and C) improves the outcome of schizophrenia. Schizophr Res. (2003) 62:195–204. doi: 10.1016/s0920-9964(02)00284-0
46. Politi P, Rocchetti M, Emanuele E, Rondanelli M, Barale F. Randomized placebo-controlled trials of omega-3 polyunsaturated fatty acids in psychiatric disorders: a review of the current literature. Curr Drug Discov Technol. (2013) 10:245–53.
47. Amminger G, Schafer M, Schlogelhofer M, Klier C, McGorry P. Longer-term outcome in the prevention of psychotic disorders by the Vienna omega-3 study. Nat Commun. (2015) 6:7934.
48. Emsley R, Chiliza B, Asmal L, du Plessis S, Phahladira L, van Niekerk E, et al. A randomized, controlled trial of omega-3 fatty acids plus an antioxidant for relapse prevention after antipsychotic discontinuation in first-episode schizophrenia. Schizophr Res. (2014) 158:230–5. doi: 10.1016/j.schres.2014.06.004
49. Fusar-Poli P, Berger G. Eicosapentaenoic acid interventions in schizophrenia: meta-analysis of randomized, placebo-controlled studies. J Clin Psychopharmacol. (2012) 32:179–85.
50. Jamilian H, Solhi H, Jamilian M. Randomized, placebo-controlled clinical trial of omega-3 as supplemental treatment in schizophrenia. Glob J Health Sci. (2014) 6:103–8.
51. Khan M, Evans D, Gunna V, Scheffer R, Parikh VV, Mahadik S. Reduced erythrocyte membrane essential fatty acids and increased lipid peroxides in schizophrenia at the never-medicated first-episode of psychosis and after years of treatment with antipsychotics. Schizophr Res. (2002) 58:1–10. doi: 10.1016/s0920-9964(01)00334-6
52. Sumiyoshi T, Higuchi Y, Matsui M, Itoh H, Uehara T, Itoh T, et al. Membrane fatty acid levels as a predictor of treatment response in chronic schizophrenia. Psychiatry Res. (2011) 186:23–7. doi: 10.1016/j.psychres.2010.07.049
53. McNamara R, Jandacek R, Rider T, Tso P, Cole-Strauss A, Lipton J. Differential effects of antipsychotic medications on polyunsaturated fatty acid biosynthesis in rats: relationship with liver delta6-desaturase expression. Schizophr Res. (2011) 129:57–65. doi: 10.1016/j.schres.2011.03.006
54. Medema S, Mocking R, Koeter M, Vaz F, Meijer C, de Haan L, et al. Levels of red blood cell fatty acids in patients with psychosis, their unaffected siblings, and healthy controls. Schizophr Bull. (2016) 42:358–68. doi: 10.1093/schbul/sbv133
55. Li N, Yang P, Tang M, Liu Y, Guo W, Lang B, et al. Reduced erythrocyte membrane polyunsaturated fatty acid levels indicate diminished treatment response in patients with multi- versus first-episode schizophrenia. Schizophrenia. (2022) 8:7. doi: 10.1038/s41537-022-00214-2
56. Julia C, Vernay M, Salanave B, Deschamps V, Malon A, Oleko A, et al. Nutrition patterns and metabolic syndrome: a need for action in young adults (French Nutrition and Health Survey - ENNS, 2006-2007). Prev Med. (2010) 51:488–93. doi: 10.1016/j.ypmed.2010.09.009
57. Aaronson N, Acquadro C, Alonso J, Apolone G, Bucquet D, Bullinger M, et al. International Quality of Life Assessment (IQOLA) Project. Qual Life Res. (1992) 1:349–51.
58. Leplege A, Ecosse E, Verdier A, Perneger TV. The French SF-36 Health Survey: translation, cultural adaptation and preliminary psychometric evaluation. J Clin Epidemiol. (1998) 51:1013–23. doi: 10.1016/s0895-4356(98)00093-6
59. Guillemin F, Paul-Dauphin A, Virion J, Bouchet C, Briancon S. The DUKE health profile: a generic instrument to measure the quality of life tied to health. Sante Publique. (1997) 9:35–44.
60. Laureyns F, Séné J. Test D’autoévaluation d’après Ricci et Gagnon, Université de Montréal. Paris: Clinicprosport (2011)
61. Kriska A, Knowler W, LaPorte R, Drash A, Wing R, Blair S, et al. Development of questionnaire to examine relationship of physical activity and diabetes in Pima Indians. Diabetes Care. (1990) 13:401–11.
62. Vuillemin A, Oppert J, Guillemin F, Essermeant L, Fontvieille A, Galan P, et al. Self-administered questionnaire compared with interview to assess past-year physical activity. Med Sci Sports Exerc. (2000) 32:1119–24. doi: 10.1097/00005768-200006000-00013
63. Schulz L, Harper I, Smith C, Kriska A, Ravussin E. Energy intake and physical activity in Pima Indians: comparison with energy expenditure measured by doubly-labeled water. Obes Res. (1994) 2:541–8. doi: 10.1002/j.1550-8528.1994.tb00103.x
64. Pereira M, FitzerGerald S, Gregg E, Joswiak M, Ryan W, Suminski R, et al. A collection of Physical Activity Questionnaires for health-related research. Med Sci Sports Exerc. (1997) 29(6 Suppl):S1–205.
65. Sheehan DV, Harnett-Sheehan K, Raj B. The measurement of disability. Int Clin Psychopharmacol. (1996) 11(Suppl 3):89–95.
66. Perneger TV, Leplège A, Etter J, Rougemont A. Validation of a French-language version of the MOS 36-Item Short Form Health Survey (SF-36) in young healthy adults. J Clin Epidemiol. (1995) 48:1051–60. doi: 10.1016/0895-4356(94)00227-h
67. Guy W. ECDEU Assessment Manual for Psychopharmacology. Rockville, MD: U.S. Dept. of Health, Education, and Welfare (1976). p. 218–22.
68. Jones S, Thornicroft G, Coffey M, Dunn G. A brief mental health outcome scale-reliability and validity of the Global Assessment of Functioning (GAF). Br J Psychiatry. (1995) 166:654–9. doi: 10.1192/bjp.166.5.654
69. Kay S, Fiszbein A, Opler L. The positive and negative syndrome scale (PANSS) for schizophrenia. Schizophr Bull. (1987) 13:261–76.
70. Opler M, Yavorsky C, Daniel D. Positive and Negative Syndrome Scale (PANSS) training: challenges, solutions, and future directions. Innov Clin Neurosci. (2017) 14:77–81.
71. Addington D, Addington J, Schissel B. A depression rating scale for schizophrenics. Schizophr Res. (1990) 3:247–51.
72. Bernard D, Lancon C, Auquier P, Reine G, Addington D. Calgary Depression Scale for Schizophrenia: a study of the validity of a French-language version in a population of schizophrenic patients. Acta Psychiatr Scand. (1998) 97:36–41. doi: 10.1111/j.1600-0447.1998.tb09960.x
73. Nasreddine Z, Phillips N, Bedirian V, Charbonneau S, Whitehead V, Collin I, et al. The montreal cognitive assessment, MoCA: a brief screening tool for mild cognitive impairment. J Am Geriatr Soc. (2005) 53:695–9. doi: 10.1111/j.1532-5415.2005.53221.x
74. Tu Q, Jin H, Ding B, Yang X, Lei Z, Bai S, et al. Reliability, validity, and optimal cutoff score of the montreal cognitive assessment (changsha version) in ischemic cerebrovascular disease patients of hunan province, China. Dement Geriatr Cogn Dis Extra. (2013) 3:25–36. doi: 10.1159/000346845
75. Grant D, Berg EA. A behavioral analysis of degree of reinforcement and ease of shifting to new responses in a Weigl-type card-sorting problem. J Exp Psychol. (1948) 38:404–11. doi: 10.1037/h0059831
76. Lavoie K, Everett J. [Schizophrenia and performance on the Wisconsin Card Sorting Test (WCST): deficits and rehabilitation]. Encephale. (2001) 27:444–9.
77. Volz H, Gaser C, Hager F, Rzanny R, Mentzel H, Kreitschmann-Andermahr I, et al. Brain activation during cognitive stimulation with the Wisconsin Card Sorting Test–a functional MRI study on healthy volunteers and schizophrenics. Psychiatry Res. (1997) 75:145–57. doi: 10.1016/s0925-4927(97)00053-x
78. Caffarra P, Vezzadini G, Dieci F, Zonato F, Venneri A. Modified Card Sorting Test: normative data. J Clin Exp Neuropsychol. (2004) 26:246–50.
79. Obonsawin M, Crawford J, Page J, Chalmers P, Low G, Marsh P. Performance on the Modified Card Sorting Test by normal, healthy individuals: relationship to general intellectual ability and demographic variables. Br J Clin Psychol. (1999) 38:27–41. doi: 10.1348/014466599162647
80. Lineweaver T, Bond M, Thomas R, Salmon DP. A normative study of Nelson’s (1976) modified version of the Wisconsin Card Sorting Test in healthy older adults. Clin Neuropsychol. (1999) 13:328–47. doi: 10.1076/clin.13.3.328.1745
81. Nasreddine Z, Patel B. Validation of montreal cognitive assessment, MoCA, alternate french versions. Can J Neurol Sci Le J Can des Sci Neurol. (2016) 43:665–71.
82. Lançon C, Reine G, Llorca P, Auquier P. Validity and reliability of the French-language version of the Positive and Negative Syndrome Scale (PANSS). Acta Psychiatr Scand. (1999) 100:237–43.
83. Rose H, Oklander M. Improved procedure for the extraction of lipids from human erythrocytes. J Lipid Res. (1965) 6:428–31.
84. Wolf C, Quinn P. Lipidomics: practical aspects and applications. Prog Lipid Res. (2008) 47:15–36.
85. Goulet O, Lamazière A, Abi Nader E, Talbotec C, Wolf C, Lambe C. Erythrocyte fatty acid membrane composition in children on long-term parenteral nutrition enriched with ω-3 fatty acids. Am J Clin Nutr. (2021) 115:422–31. doi: 10.1093/ajcn/nqab263
86. Schuchardt J, Cerrato M, Ceseri M, DeFina L, Delgado G, Gellert S, et al. Red blood cell fatty acid patterns from 7 countries: focus on the Omega-3 index. Prostaglandins, Leukot Essent Fat Acids. (2022) 179:102418.
87. Thoonney J, Conus P. Trauma et psychose: quelles pistes neurobiologiques? Inf Psychiatr. (2010) 86:505–11.
88. Schifani C, Tseng H, Kenk M, Tagore A, Kiang M, Wilson A, et al. Cortical stress regulation is disrupted in schizophrenia but not in clinical high risk for psychosis. Brain. (2018) 141:2213–24.
89. Lee D, Huang W, Wang L, Copolov D, Lim A. Glucocorticoid modulation of dopamine mediated effects on hypothalamic atrial natriuretic factor neurons. Mol Psychiatry. (2000) 5:332–6.
90. Fujii Y, Mizoguchi Y, Masuoka J, Matsuda Y, Abe T, Anzai K, et al. Cushing’s syndrome and psychosis: a case report and literature review. Prim care companion CNS Disord. (2018) 20:18br02279.
91. Honda K, Lamon-Fava S, Matthan N, Wu D, Lichtenstein A. Docosahexaenoic acid differentially affects TNFα and IL-6 expression in LPS-stimulated RAW 264.7 murine macrophages. Prostaglandins Leukot Essent Fatty Acids. (2015) 97:27–34. doi: 10.1016/j.plefa.2015.03.002
92. Honda K, Lamon-Fava S, Matthan N, Wu D, Lichtenstein AH. EPA and DHA exposure alters the inflammatory response but not the surface expression of Toll-like receptor 4 in macrophages. Lipids. (2015) 50:121–9.
93. Venugopal D, Shivakumar V, Subbanna M, Kalmady SV, Amaresha A, Agarwal S, et al. Impact of antipsychotic treatment on methylation status of Interleukin-6 [IL-6] gene in Schizophrenia. J Psychiatr Res. (2018) 104:88–95. doi: 10.1016/j.jpsychires.2018.07.002
94. Abbott S, Else P, Atkins T, Hulbert A. Fatty acid composition of membrane bilayers: importance of diet polyunsaturated fat balance. Biochim Biophys Acta. (2012) 1818:1309–17. doi: 10.1016/j.bbamem.2012.01.011
95. McLaverty A, Allott K, Berger M, Hester R, McGorry P, Nelson B, et al. Omega-3 fatty acids and neurocognitive ability in young people at ultra-high risk for psychosis. Early Interv Psychiatry. (2021) 15:874–81.
Keywords: schizophrenia, membrane fatty acids, biomarkers, quality of life, stabilized patients
Citation: Adrien V, Bosc N, Fumat H, Tessier C, Ferreri F, Mouchabac S, Tareste D and Nuss P (2023) Higher stress response and altered quality of life in schizophrenia patients with low membrane levels of docosahexaenoic acid. Front. Psychiatry 14:1089724. doi: 10.3389/fpsyt.2023.1089724
Received: 04 November 2022; Accepted: 12 January 2023;
Published: 03 February 2023.
Edited by:
Douglas Noordsy, Stanford University, United StatesReviewed by:
Vanika Chawla, Stanford University, United StatesCopyright © 2023 Adrien, Bosc, Fumat, Tessier, Ferreri, Mouchabac, Tareste and Nuss. This is an open-access article distributed under the terms of the Creative Commons Attribution License (CC BY). The use, distribution or reproduction in other forums is permitted, provided the original author(s) and the copyright owner(s) are credited and that the original publication in this journal is cited, in accordance with accepted academic practice. No use, distribution or reproduction is permitted which does not comply with these terms.
*Correspondence: Vladimir Adrien,  dmxhZGltaXIuYWRyaWVuQGFwaHAuZnI=
Disclaimer: All claims expressed in this article are solely those of the authors and do not necessarily represent those of their affiliated organizations, or those of the publisher, the editors and the reviewers. Any product that may be evaluated in this article or claim that may be made by its manufacturer is not guaranteed or endorsed by the publisher.
Research integrity at Frontiers
Learn more about the work of our research integrity team to safeguard the quality of each article we publish.