
94% of researchers rate our articles as excellent or good
Learn more about the work of our research integrity team to safeguard the quality of each article we publish.
Find out more
ORIGINAL RESEARCH article
Front. Psychiatry, 11 April 2022
Sec. Neuroimaging
Volume 13 - 2022 | https://doi.org/10.3389/fpsyt.2022.859772
This article is part of the Research TopicProton Magnetic Resonance Spectroscopy in Brain Aging: Inflammation, Bloodflow, Connectivity and Cognitive DeclineView all 6 articles
 Wouter A. J. Vints1,2,3*
 Simona Kušleikiene1
 Samrat Sheoran1Milda Šarkinaite4Kristina Valatkevičiene4
 Rymante Gleizniene4
 Mindaugas Kvedaras1Kazimieras Pukenas1
 Uwe Himmelreich5Vida J. Cesnaitiene1
 Oron Levin1,6
 Jeanine Verbunt2,3
 Nerijus Masiulis1,7
Rationale and Objectives: Pro-inflammatory processes have been argued to play a role in conditions associated with cognitive decline and neurodegeneration, like aging and obesity. Only a limited number of studies have tried to measure both peripheral and central biomarkers of inflammation and examined their interrelationship. The primary aim of this study was to examine the hypothesis that chronic peripheral inflammation would be associated with neurometabolic changes that indicate neuroinflammation (the combined elevation of myoinositol and choline), brain gray matter volume decrease, and lower cognitive functioning in older adults.
Materials and Methods: Seventy-four older adults underwent bio-impedance body composition analysis, cognitive testing with the Montreal Cognitive Assessment (MoCA), blood serum analysis of inflammatory markers interleukin-6 (IL-6) and kynurenine, magnetic resonance imaging (MRI), and proton magnetic resonance spectroscopy (1H-MRS) of the brain. Neurometabolic findings from both Tarquin and LCModel 1H-MRS post-processing software packages were compared. The regions of interest for MRI and 1H-MRS measurements were dorsal posterior cingulate cortex (DPCC), left hippocampal cortex (HPC), left medial temporal cortex (MTC), left primary sensorimotor cortex (SM1), and right dorsolateral prefrontal cortex (DLPFC).
Results: Elevated serum kynurenine levels were associated with signs of neuroinflammation, specifically in the DPCC, left SM1 and right DLPFC, and signs of neurodegeneration, specifically in the left HPC, left MTC and left SM1, after adjusting for age, sex and fat percentage (fat%). Elevated serum IL-6 levels were associated with increased Glx levels in left HPC, left MTC, and right DLPFC, after processing the 1H-MRS data with Tarquin. Overall, the agreement between Tarquin and LCModel results was moderate-to-strong for tNAA, tCho, mIns, and tCr, but weak to very weak for Glx. Peripheral inflammatory markers (IL-6 and kynurenine) were not associated with older age, higher fat%, decreased brain gray matter volume loss or decreased cognitive functioning within a cohort of older adults.
Conclusion: Our results suggest that serum kynurenine may be used as a peripheral inflammatory marker that is associated with neuroinflammation and neurodegeneration, although not linked to cognition. Future studies should consider longitudinal analysis to assess the causal inferences between chronic peripheral and neuroinflammation, brain structural and neurometabolic changes, and cognitive decline in aging.
Looking back at how the world's population has changed in the last four decades, two major trends have been noticed; (a) the increase in the proportion of older adults and (b) the increase in the prevalence of overweight and obesity. Indeed, first of all, the subpopulation of older adults is rapidly increasing worldwide and is prospected to continue to increase (1). With it, the increasing amount of care-needing elderly places high demands on our health care services (1). At the same time, there is a shift in the prevalence of diseases in the group of older adults showing an increase in chronic care-demanding illnesses. A comparison of diseases in older adults in 2016 showed that dementias displayed the largest increase as a cause of disability and second largest increase as a cause of mortality in the last 16 years (2). Importantly, Mayeux and Stern (3) hypothesized that the burden of dementia, with Alzheimer's disease as the leading cause of dementia, will double every 20 years until at least 2040. Secondly, a dramatic increase in the prevalence of overweight and obesity has taken place in the last four decades. At this rate, the majority of the world's adult population will be overweight or obese by 2030 (4). Of interest, not only older age, but also obesity has been associated with cognitive decline, as was reported after adjusting for age and educational level (5). Moreover, obese individuals were found to have an increased risk of Alzheimer's disease (6). Furthermore, life-style interventions targeted to reduce obesity, like regular physical exercise and a healthy diet, are also suggested to be promising strategies to prevent cognitive decline and dementia (7).
A common mechanism that has been suggested to be a major player in age- and obesity-related cognitive decline is a chronic state of inflammation (8–10). Studies have measured increased levels of inflammatory markers and activated immune cells in blood samples and tissue biopsies in old and obese individuals (11, 12). In the context of aging, ‘inflammaging' refers to the gradual transition into a chronic pro-inflammatory stage that is reported when people get older (11). It is thought that inflammaging arises at least partly from the release of inflammatory markers by senescent cells, which accumulate over time (13). The senescence program makes old cells stop dividing to prevent malignant transformation (14), but also alters secretory activity so that they start releasing a range of inflammatory markers and attract and activate immune cells (12). In the context of obesity, chronic inflammation is suggested to arise from adipose cells. Especially from visceral fat, which is considered one of the largest contributors to the release of inflammatory markers in the human body (15, 16).
Of importance, these signs of elevated inflammation can also be found in the brain, both with aging (17) and obesity (18). Within the central nervous system, glial cells, which include microglia and astrocytes, are the main immune cells involved in local neuroinflammation (17). Stereological findings have shown an age-related increase in the number of glial cells in the frontal and temporal cortex (19). Moreover, studies have shown that microglia change to a more proinflammatory phenotype with age (20, 21). In the context of obesity, neuroinflammation in the hypothalamus is consistently reported (9), but also other brain regions are affected, such as the hippocampus, amygdala, cerebral cortex and cerebellum, as has been shown in rodent studies (10, 22–24). In the areas with increased neuroinflammation, activated microglia release inflammatory markers to attract more inflammatory cells and initiate repair mechanisms, further increasing inflammation in the brain (25–28). This may cause damage to the surrounding neurons and may impair synaptic signaling, which eventually results in cognitive impairment (8, 17, 29).
It is considered that peripheral inflammation and neuroinflammation are closely linked, even though the brain and the rest of the body are separated from each other by the blood–brain barrier. Indeed, peripheral and central inflammatory signals were previously found to interact via blood and neural routes of communication (30–37). For example, studies have shown that a peripheral inflammatory challenge activated microglial cells and drastically altered neural activity (35, 38). After blocking peripheral cytokine production, neuroinflammation was also altered and this was found to result in cognitive improvements (39, 40). Inversely, traumatic brain injury was reported to induce an inflammatory response in the liver, causing liver damage (41–43). Recently, the neurobiological link between peripheral inflammation, neuroinflammation, and cognitive aging was tested for the first time by Lind et al. (44). Firstly, in a previous study, they used proton magnetic resonance spectroscopy (1H-MRS) to search for signs of neuroinflammation and discovered a link between cognitive aging and elevated levels of the glia-related neurometabolites, total choline (tCho), myoinositol (mIns), and total creatine (tCr) in the anterior cingulate cortex, hippocampus, and thalamus. Secondly, Lind et al. (45) correlated these findings to blood levels of the pro-inflammatory markers C-reactive protein (CRP), interleukin-8 (IL)-8, and tumor necrosis factor-α (TNF-α) in young, middle-aged, and older adults. They reported that circulating levels of CRP and IL-8 were elevated in older adults. The CRP was positively correlated to thalamic mIns levels and IL-8 was positively correlated with tCho in the anterior cingulate cortex as well as with mIns in the hippocampus. Moreover, they observed a negative correlation between CRP levels and visuo–spatial working memory performance.
In addition to CRP, IL-8, and TNF-α, other markers of inflammation have previously been linked to aging, obesity, and cognitive impairment. For example, IL-6 is extensively studied as a marker of inflammaging and has even been called the “gerontologist's cytokine” (46). The levels of IL-6 are increased in older and in obese adults (47). A meta-analysis including seven longitudinal studies presented evidence that subjects with high circulating IL-6 levels were 1.42 times more likely to experience global cognitive decline after a 2–7 year follow-up (48). However, IL-6 seems also to be involved in anti-inflammatory actions and is therefore suggested to be an important regulator of the inflammatory response (49). Another very interesting inflammatory marker is kynurenine, as the enzyme indolamine 2,3-dioxygenase, which converts tryptophan into kynurenine in the liver, is upregulated in a state of high inflammation (50). Increased indolamine 2,3-dioxygenase activity and elevated levels of kynurenine were associated with higher levels of CRP, IL-1β, IL-6, IL-8, TNF-α, and Interferon-gamma (IFN-γ), while the anti-inflammatory cytokines IL-4 and IL-10 counteracted the increase in kynurenine levels (51–54). Through this pathway, inflammation results in a reduction in tryptophan, a precursor of serotonin and may cause sickness behavior and depression (55). Furthermore, kynurenine metabolites have been shown to induce dysregulation of glutamatergic pathways, leading to excitotoxic neural damage (56). The higher levels of kynurenine were associated with obesity (57), with cognitive decline in older adults (58) and with striatal and hippocampal volume loss in psychiatric disorders (59). In a model applying Alzheimer mouse, peripheral inhibition of the kynurenine pathway prevented neurodegeneration and memory deficits (60).
The primary aim of this study was to investigate the association between peripheral inflammatory markers measured from serum samples and signs of neuroinflammation measured with 1H-MRS in a cohort of older adults and secondarily to relate peripheral inflammatory markers to brain gray matter volume (GMV) and cognitive function, as measured with the Montreal Cognitive Assessment (MoCA). The MoCA is considered a sensitive screening tool to evaluate the risk of mild cognitive impairment in the geriatric population (61, 62). We built our analysis starting first with assessing the relationship between the demographic characteristics of the subjects included in our study and cognitive function. Based on the existing literature, we also expect to find that older age and higher body fat percentage (fat%) are associated with cognitive deficit (5, 8). Of importance, studies have also shown that cognitive performance depends on the subject's educational level; for example, see Malek-Ahmadi et al. (63), and fat% greatly differs between sexes. Also in older adults, fat% is generally larger in women than in men (64). Secondly, we will correlate age, fat%, and cognition to peripheral inflammatory markers, brain GMV, and neurometabolic changes. Here, we hypothesize that older age, higher fat% and lower cognitive functioning are associated with higher levels of peripheral inflammation, a loss of brain GMV, a decrease in markers of neural integrity and an increase in markers of neuroinflammation. Thirdly, we test the hypothesis that higher levels of peripheral inflammation are associated with brain volume loss, and eventually our study's primary endpoint that peripheral inflammation is associated with neurometabolic changes indicating brain inflammation. This investigation elaborates the findings of Lind et al. (45), since we used different peripheral serum biomarkers, added brain GMV measurements, examined more brain regions with 1H-MRS, and used the MoCA as a more general screening instrument for mild cognitive impairment in older adults. Furthermore, we took into account the effect of age, fat%, and sex and excluded subjects with neurological and psychiatric disorders. Finally, quantification of neurometabolites such as mIns and Glx may not be consistent across vendors and algorithms (65). Therefore, we used LCModel and Tarquin, two linear-combination modeling algorithms commonly implemented for the quantification of 1H-MRS spectra, to examine the robustness of our neurometabolic estimates and the predictability of their associations with the other biomarkers. Ultimately, this paper may lead to a better understanding of the expected detrimental effect of inflammation on brain health and cognitive function.
A total of 74 apparently healthy adults aged 60 years and older were recruited in Kaunas, Lithuania. The recruitment strategies included presentations in local community organizations, contacting subjects from a list of patients provided by general practitioners and volunteers from previous studies. Candidates were invited for an interview in the primary care center, Saules Family Medical Center, before inclusion. The exclusion criteria were a diagnosis of a neurological disorder, including stroke, epilepsy, multiple sclerosis, traumatic brain injury, brain tumor or neurodegenerative diseases like dementia. Furthermore, we excluded subjects with alcohol or drug abuse, diabetes, psychiatric disorders such as depression, or usage of psychopharmacological drugs in the last 5 years and oncologic disorders or a history of chemotherapy use. Finally, we applied the exclusion criteria for magnetic resonance imaging (MRI) studies as formulated by the checklist of the Department of Radiology, Lithuanian University of Health Science, including metal or MR-incompatible implants and claustrophobia. The participants indicated that they did not participate in any regular exercise program in the last 6 months, but were able to perform 10 sit-ups. The participants could voluntarily withdraw from the study at any time.
All participants were asked to report age, sex, smoking status, and educational level (i.e., basic education, secondary education or higher education). Furthermore, the MoCA test was conducted by a qualified mental health care specialist (co-author SK). The MoCA test is a brief cognitive screening instrument developed by Nasreddine et al. (61). It contains 12 items measuring seven cognitive domains as follows: Executive functioning; visuospatial abilities; language; attention, concentration and working memory; abstract reasoning; memory and orientation. All items add up to a total score with a maximum of 30 points, where a higher score indicates better cognitive functioning. This screening tool is widely used and is especially considered as a reliable and sensitive tool to evaluate the risk of mild cognitive impairment in the geriatric population (61, 62). At last, we assessed the subjects' body mass index (BMI) and measured their body fat% using leg-to-leg bio-impedance analysis (Tanita TBF-300-A).
Venous blood samples were drawn by a qualified medical professional at the antecubital vein. All blood samples were collected between 9 a.m. and 1 p.m. in 5 ml serum separation gel tubes. After blood collection, the tubes were gently inverted 8–10 times and kept at room temperature for 30 min until centrifugation for 15 min at 4,000 g centrifugal force. After centrifugation, serum was aliquoted into 1.5 ml polypropylene tubes and immediately frozen and stored at −80°C in the refrigerator compartment of the laboratory of the Lithuanian Sports University Institute of Sports Science and Innovation until further analysis. Enzyme-linked immunosorbent assay (ELISA) tests for the assessment of the circulating levels of IL-6 and kynurenine were analyzed with spectrophotometry (Spark 10M, Tecan Group Ltd., Zürich, Switzerland) by an experienced researcher (co-author MK).
IL-6 measurement. The IL-6 concentrations were measured using a commercially available ELISA kit purchased from DIAsource ImmunoAssays S.A., Belgium (KAP1216). It was a sandwich immunometric assay utilizing recombinant human cytokines and antibodies raised against recombinant human cytokines. The lower limit of the detection being 2 pg/ml. Absorbance was measured using a spectrophotometer at 450 nm absorbance.
Kynurenine measurement. Kynurenine concentrations were measured using a commercially available ELISA kit purchased from MyBiosource, Inc., USA. Lower limit of detection being 45.7 ng/ml.
Brain scanning consisted of whole brain MRI and 1H-MRS with voxels in five brain regions with a total length of about 90 min per subject. An MRI was performed using a Siemens 3T Skyra scanner (Siemens Healthineers, Erlangen, Germany) with a 32-channel receiver head coil. A high-resolution T1-weighted (T1W) structural MR image [(repetition time (TR) = 2,200 ms, echo time (TE) = 2.48 ms, 0.9 × 0.9 × 1.0 mm3 voxels, field of view: 230 × 256 mm, number of sagittal slices = 176)] was used to acquire a 3D magnetization prepared gradient echo (MPRAGE). A T2-weighted (T2W) turbo-spin echo scan, a fluid-attenuated inversion recovery (FLAIR) and a susceptibility weighted imaging (SWI) were reviewed for brain lesions by an experienced radiologist with more than 10 years of experience (co-author KV).
Total GMV and GMVs of dorsal posterior cingulate cortex (DPCC), left and right hippocampal cortex (HPC), left middle temporal cortex (MTC), left primary sensorimotor cortex (SM1) and right dorsolateral prefrontal cortex (DLPFC) were analyzed using FreeSurfer v7.1.1 (Harvard, MA, USA, http://surfer.nmr.mgh.harvard.edu/) on isotropic 3D T1W images of 0.9 mm slice thickness. The DPCC GMV was calculated by combining the Freesurfer region volumes right and left posterior cingulate. For the left and right HPC GMV, the Freesurfer regions left and right whole hippocampus were used. The left MTC GMV was calculated from middle temporal Freesurfer site of the left hemisphere. Left SM1 GMV was the combined volume of Freesurfer precentral area of frontal lobe and postcentral area of parietal lobe of the left hemisphere. Finally, the right DLPFC GMV was calculated by combining the Freesurfer region volumes of left rostral and caudal middle frontal regions.
1H-MRS spectra were acquired in five voxels using a Point RESolved Spectroscopy (PRESS) sequence (TR = 2,000 ms, TE = 30 ms, number of averages = 128, spectral bandwidth = 2,000 Hz, and data size = 1,024 points) with excitation water suppression (sequence svs_se_30). The unsuppressed water signal was also acquired to measure absolute metabolite concentrations using the same acquisition parameters. The regions of interest where voxels were placed included DPCC, left HPC, left MTC, left SM1, and right DLPFC and corresponded to the regions used to calculate GMVs. The DPCC voxel was placed in the midline of both posterior parts of cingulate cortex in axial plane anterior to precuneus and parieto-occipital sulcus, corresponding to the Freesurfer sites used to calculate DPCC GMV. The hippocampal voxel was centered over the whole hippocampus in left hemisphere in the medial part of the temporal lobe anterior to lateral ventricle, corresponding to the Freesurfer region used to calculate left HPC GMV. The MTC voxel was placed in the left middle part of temporal lobe over the middle temporal gyrus caudal to superior temporal gyrus and cranial to inferior temporal gyrus, corresponding to the Freesurfer site used to measure left MTC GMV. The SM1 voxel was centered over the left hand-knob, corresponding to the Freesurfer sites used to calculate left SM1 GMV. The DLPFC voxel was placed over the right middle frontal gyrus inferior to the superior frontal sulcus and anterior to the precentral sulcus, corresponding to the Freesurfer sites used to calculate right DLPFC GMV. The voxel sizes were: (i) 1.6 × 1.6 × 1.6 cm3 in the DPCC, the left SM1, and the right DLPFC voxels, (ii) 20 × 12 × 16 cm3 in the left MTC and (iii) 26 × 12 × 12 cm3 in the left HPC. The MR spectra were processed using the totally automatic robust quantification in nuclear MR (TARQUIN, version 4.3.10) and the linear combination of model spectra (LCModel, version 6.3.1-R). These two post-processing software packages are widely used (65). However, LCModel may offer a more accurate quantification of Glx and macromolecular constituents (66). We presented Tarquin results after lipid signal extraction using the lipid-filtering preprocessing option prior to quantification, as recommended by Near et al. (67). However, LCModel has no lipid filter option at the preprocessing phase. Therefore, we present right DLPFC Tarquin results with no filtering of lipids compared to LCModel results in Supplementary Table 1. This table confirms that the same conclusion can be drawn as when lipids were filtered before processing with Tarquin, as shown in Table 1, see results section. Only spectra with linewidths <12 Hz and signal-to-noise ratio >5 were included in the statistical analyses, other values were considered missing. For spectra that were processed with LCModel, all included neurometabolites were quantified with a Cramér-Rao lower bound <20%. 1H-MRS spectra were visually checked to ensure the absence of artifacts prior to quantification. Quantifiable neurometabolites were (1) total NAA (tNAA) composed of N-acetyl aspartate and N-acetyl glutamate, (2) tCr composed of creatine and phosphocreatine, (3) tCho composed of phosphorylcholine and glycerophosphocholine, (4) mIns, and (5) the glutamate–glutamine complex (Glx).
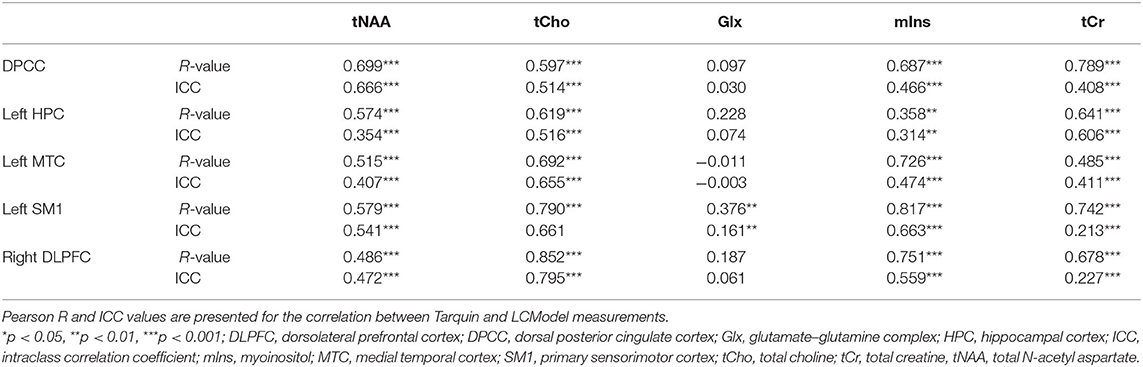
Table 1. Agreement between LCModel and Tarquin 1H-MRS post-processing software packages.
Water-referenced levels of tNAA, tCr, tCho, mIns, and Glx were quantified for each voxel location and ratios relative to tCr were calculated. For tNAA also, the ratio relative to mIns was calculated. Neuroinflammation and gliosis were reported in association with elevated levels of mIns, tCr, and tCho (44, 68, 69). The concentrations of these neurometabolites are significantly higher in glial cells than in neurons and the concomitant increase in mIns and tCho is considered to indicate glial proliferation (70). In addition, decreased concentrations of tNAA are considered a robust marker of neurodegeneration (71). The ratio of tNAA relative to mIns is an interesting marker for neurodegenerative processes that involve inflammation, as it indicates a combined loss of neural integrity (tNAA) and increase in neuroinflammation (mIns) (72).
Statistical analysis was performed using IBM SPSS Statistics version 27 (SPSS Inc, Chicago USA). We used parametric tests where possible. In case this was not appropriate due to not meeting normality assumptions, data was log transformed, as was the case for IL-6 measurements. After data inspection and cleaning bad quality measurements (see criteria in 4. Brain imaging and 1H-MRS), the agreement between LCModel and Tarquin 1H-MRS post-processing software packages was evaluated using intraclass correlation coefficients (ICC, single measure two-way random effects model for absolute agreement). Subject demographics were correlated to MoCA test scores using linear regression analysis for continuous markers and two-sided independent t-tests to compare MoCA test results between two groups. Linear regression was used to correlate age with levels of serum inflammatory markers, brain GMV and neurometabolite levels. Multiple linear regression analysis was used to investigate the association between MoCA score, adjusted for age and educational level, or fat%, adjusted for age and sex and peripheral inflammatory marker levels, brain GMV, and neurometabolite levels. Finally, multiple regression analysis was used to investigate the association between peripheral inflammatory marker levels, adjusted for age, sex, and fat% and brain GMV and neurometabolite levels. For the purpose of this exploratory study, p-values below 0.05 were considered statistically significant. In addition, we presented which of these p-values survived correction for multiple testing with false discovery rate (FDR) analysis (Benjamini and Hochberg adjustment) (73). In the FDR procedure, every p-value is compared against a sequentially weighted threshold on all p-values. The FRD procedure was done multiple times for each of the independent variables age, MoCA, fat%, IL-6, IL-6 after exclusion of an outlier, and kynurenine; and separately for LCModel results, Tarquin results, and the combination of all other dependent variables for all p-values presented in Supplementary Tables 3–10. It should be noted that the results surviving the multiple testing adjustment are strong, whereas interpretation of the remaining results should be made with caution.
Of all included subjects, 68 (91.9%) underwent complete brain scanning sessions with MRI and 1H-MRS. The reasons for missing data were inclusion in a pilot 1H-MRS scanning session using stimulated echo acquisition mode (STEAM) sequence (n = 2) or scanning cessation due to claustrophobia, unrest, discomfort, or pain during scanning (n = 4). After excluding data of bad quality, a complete dataset of all MRI and MRS values was attained for 33 subjects. Further analysis was done each time with all the data available, which differed depending on the measurement. To know specifically from how many subjects the data was used for each of the associations assessed below, Supplementary Table 2 lists the number of subjects with good quality MRI and 1H-MRS values, with 1H-MRS values presented per region and compared between LCModel and Tarquin (see Figure 1).
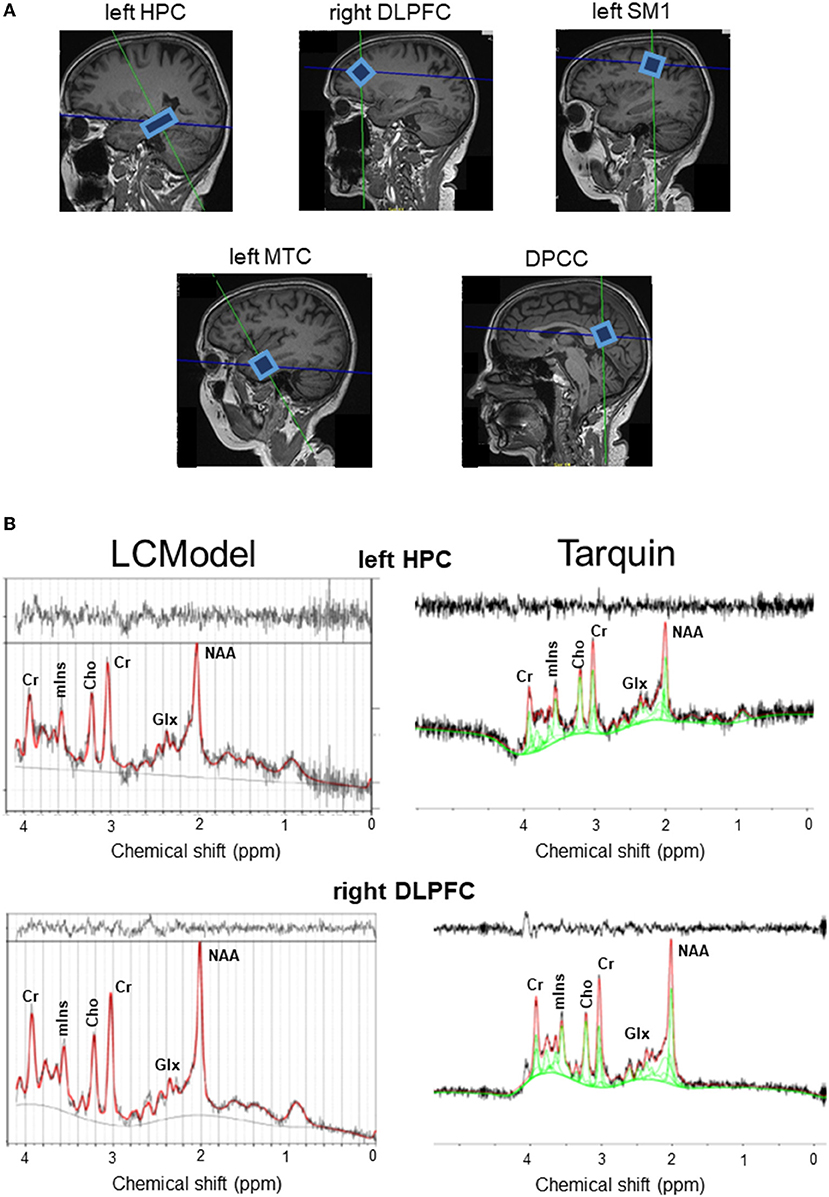
Figure 1. (A) Example voxel positions and spectra from a representative subject. (B) Raw (black curve) and fitted (red curve) spectra from LCModel (left hand side panel) and Tarquin (right hand side panel) are illustrated for the left HPC and right DLPFC. Cho, total choline; Cr, creatine + phosphocreatine; DLPFC, dorsolateral prefrontal cortex; DPCC, dorsal posterior cingulate cortex; Glx, glutamate–glutamine complex; HPC, hippocampal cortex; mIns, myoinositol; MTC, medial temporal cortex; NAA, N-acetyl aspartate; SM1, primary sensorimotor cortex.
Overall, the agreement between tNAA, tCho, mIns, and tCr measurements postprocessed with LCModel compared to measurements after processing with Tarquin were strong (R or ICC > 0.750) or moderate (0.500 < R or ICC < 0.750), with exception of weak correlations (0.250 < R < 0.500) for tNAA levels in the right DLPFC, mIns levels in the left HPC and tCr levels in the left MTC; or low ICC values (0.250 < ICC < 0.500) for tNAA levels in the left HPC, left MTC and right DLPFC, mIns levels in the DPCC, left HPC, left MTC and tCr levels in the DPCC, left MTC, left SM1 and right DLPFC. The agreement of Glx levels between the two models was very weak (R or ICC < 0.250) in all regions of interest, except for a weak correlation in the left SM1 (R = 0.376); for details, see Table 1.
Subject characteristics are described in Table 2. The mean (SD) MoCA score was 25.2 (2.8), ranging from 19 to 30. The age of the included subjects ranged from 60 to 85 years old. Older aged adults scored significantly lower on the MoCA test (R2 = 0.175, p < 0.001). Fat% ranged from 3.4–51.6% and BMI from 19.2–47.9. As expected, fat% was highly dependent on sex (p < 0.001), with mean (SD) fat% in men 26.3% (8.7) and in women 35.8% (7.8). The BMI did not significantly differ between sexes (p = 0.361), with mean (SD) BMI in men 28.6 (8.7) and in women 27.5 (4.5). Fat% and BMI, adjusted for age and sex, were not significantly correlated with MoCA scores (p = 0.202, p = 0.127, respectively). Older age was significantly correlated with lower fat% (R2 = 0.143, p = 0.001), but not with BMI (R2 = 0.019, p = 0.128).
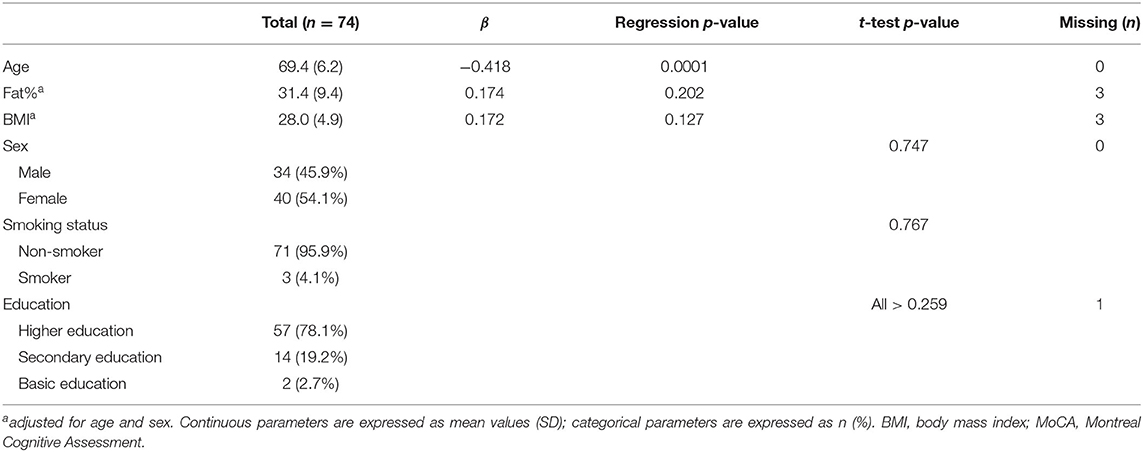
Table 2. Subject characteristics and their relation to MoCA score.
Older age was significantly correlated with lower brain volumes in all regions of interest (all p < 0.05). Multiple linear regression, adjusted for age and educational level, showed that higher MoCA scores significantly correlated with higher levels of kynurenine (p = 0.027), which is contradictory to what we hypothesized. After adjusting for age and sex, higher fat% was correlated with lower total GMV (p = 0.029) and lower left MTC GMV (p = 0.031), see Table 3. The correlations with age all survived multiple testing correction with FDR, while the correlations with MoCA and fat% did not remain statistically significant. No significant correlations were found between age or fat% and IL-6 or kynurenine levels, see Supplementary Table 3.
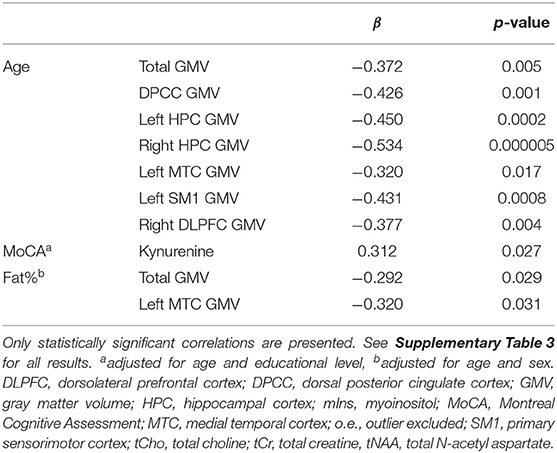
Table 3. The effect of age, MoCA, and fat% on brain GMV and peripheral inflammation.
Correlations obtained from regression analyses between age, fat% and cognition and the neurometabolites are depicted in Table 4 and Supplementary Tables 4–6. To assess potential effects of MRS data analysis software, we have compared LCModel and Tarquin for the quantification of neurometabolites.
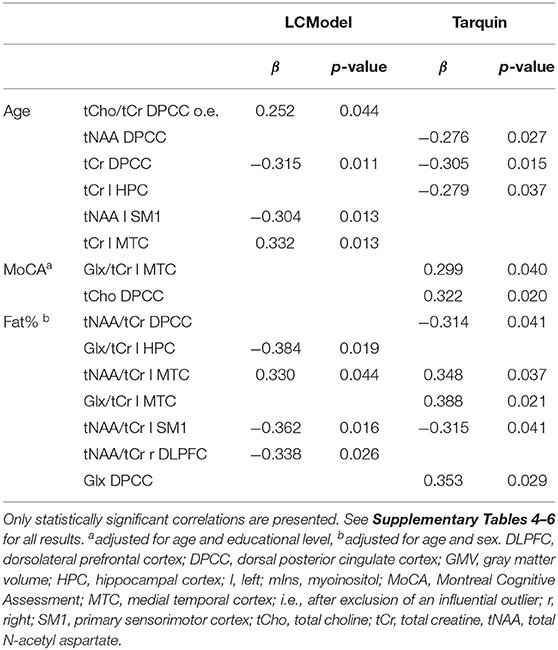
Table 4. Effect of age, MoCA, and fat% on neurometabolites.
A common finding after processing 1H-MRS data with LCModel and Tarquin was the significant age-related decrease in tCr DPCC levels. Furthermore, we expect tNAA levels to be lower as a function of age. Even though we did not compare to young adults, we were able to find a decrease of tNAA DPCC (Tarquin) and tNAA left SM1 (LCModel) in association with older age. The age-related decrease in tNAA DPCC levels was also close to significance level for LCModel (p = 0.053). No age-related changes in neuroinflammation were discovered. After adjusting for age and educational level, MoCA test results were not related to signs of neurodegeneration or neuroinflammation. Contradictory, higher fat%, adjusted for age and sex, was associated with increased tNAA/tCr levels in left MTC, but decreased tNAA/tCr levels in left SM1. In addition, a negative association was found between fat% and tNAA/tCr DPCC (Tarquin) and tNAA/tCr right DLPFC (LCModel). Also, Glx level changes were inconsistent. Results after processing with LCModel showed higher fat% correlates with lower Glx/tCr in left HPC, while after processing with Tarquin higher fat% correlated with higher levels of Glx/tCr in left MTC and Glx in DPCC. Here, the discordance may be explained by the very weak agreement of Glx concentrations between LCModel and Tarquin results. None of the significant p-values survived FDR correction for multiple testing.
Multiple regression analysis adjusted for age, sex, and fat% and after exclusion of an outlier in IL-6 found no associations between the inflammatory serum markers and brain GMV, see Supplementary Table 7 for all results. Correlations obtained from multiple regression analysis between the inflammatory serum markers and neurometabolites are depicted in Table 5 and Supplementary Tables 8–10.
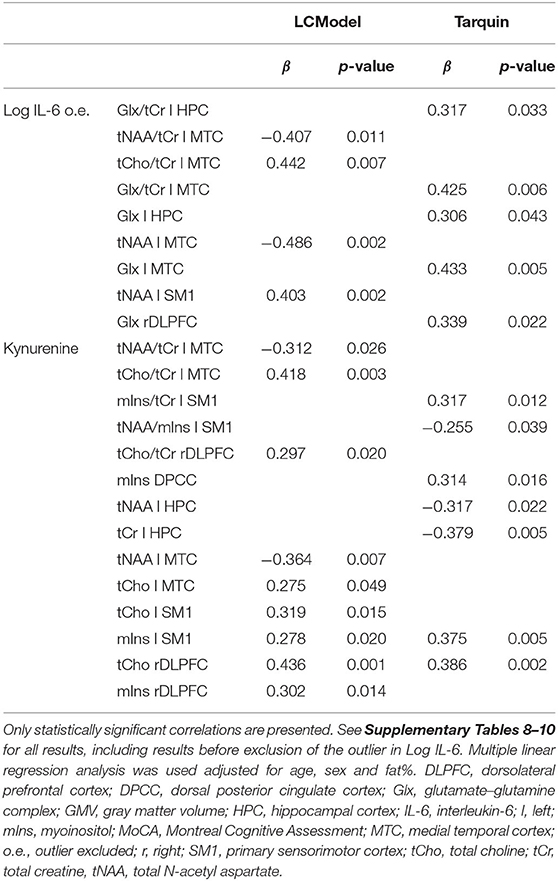
Table 5. The effect of inflammatory blood markers adjusted for age, sex and fat% on neurometabolites.
The only concordant significant association between peripheral inflammatory markers and neurometabolites for results after processing 1H-MRS data with LCModel compared to Tarquin, was the positive association between serum kynurenine levels and mIns levels in the left SM1 and tCho levels in the right DLPFC. Serum kynurenine was associated with signs of neuroinflammation (i.e., the concomitant increase in tCho and mIns) in both left SM1 and right DLPFC when considering LCModel results. After processing 1H-MRS data with Tarquin, the positive association between serum kynurenine and tCho left SM1 (p = 0.204) and mIns right DLPFC (p = 0.063) was non-significant. The increase in tCho in the right DLPFC (LCModel and Tarquin) and the increase in mIns left SM1 (Tarquin) were the only significant associations between neurometabolites and kynurenine that survived the FDR procedure to correct for multiple testing. In addition, although not surviving multiple testing correction, we found a significant positive association between serum kynurenine and mIns concentrations in the DPCC (Tarquin), which was accompanied with a non-significant positive association with tCho DPCC (p = 0.162). For LCModel results both the association between serum kynurenine and mIns DPCC (p = 0.849) and tCho DPCC (p = 0.286) was positive but non-significant. Of interest was also the negative association between serum kynurenine levels and tNAA/mIns concentrations in left SM1 (Tarquin), tNAA left HPC (Tarquin), and tNAA left MTC (LCModel), which may indicate neurodegeneration. When looking at the same results from the other 1H-MRS post-processing method where these findings were not significant, we found similar trends for serum kynurenine and tNAA/mIns in left SM1 (with LCModel p = 0.128), tNAA left HPC (with LCModel p = 0.076), and tNAA left MTC (with Tarquin p = 0.053).
Associations between serum IL-6 levels and the neurometabolites were discordant between and within post-processing methods LCModel and Tarquin. While tNAA levels in the left MTC were decreased, tNAA levels in left SM1 were increased in association with high IL-6 levels after processing with LCModel, while results from Tarquin showed the same trends but not reaching significance. These LCModel results were also the only two associations between IL-6 and neurometabolites that survived the FDR multiple testing correction. After processing with Tarquin, we found only an increase in Glx levels related to high IL-6 levels. This was significant for left HPC, left MTC and right DLPFC, and close to significant for DPCC (p = 0.062), but none of them survived correction for multiple testing.
We examined the association between serum inflammatory factors and neurometabolic, brain volume, and cognitive changes, taking into account the effect of age, sex, and fat%. Our results showed that the elevated levels of serum kynurenine were associated with signs of neuroinflammation [defined as a concomitant increase in tCho and mIns levels (69)] in the left SM1 and right DLPFC after 1H-MRS post-analysis with the LCModel. After an analysis with Tarquin, only a significant increase in mIns left SM1 and tCho right DLPFC was found. After correction for multiple testing, the positive association between serum kynurenine and tCho right DLPFC (LCModel and Tarquin) and mIns left SM1 (Tarquin) remained statistically significant. Furthermore, we found an association between higher kynurenine levels and increases in mIns in the DPCC (Tarquin). This elevation of mIns associated with only a trend of increased tCho levels, as seen in DPCC, most likely also represents neuroinflammation, as increased levels of mIns are believed to represent glial proliferation or an increase in glial cell size (74). Moreover, it has been suggested that elevated levels of mIns or mIns/tCr are an early event in the course toward Alzheimer's dementia and can precede tNAA reduction (75). The previous studies have also reported a positive correlation between pro-inflammatory factors, IL-8 (45) or CRP (76) and hippocampal mIns levels after processing the 1H-MRS data with the LCModel (45) or in a study where the 1H-MRS post-processing analytical method was not defined (76). In our study, we did not find a significant relationship between one of the measured pro-inflammatory factors and mIns levels in the hippocampus with either of the post-processing software packages. An interesting finding was the association between peripheral inflammation, as marked by high serum levels of kynurenine, and decreases in tNAA/mIns levels in left SM1 (Tarquin). As tNAA/mIns is considered to reflect the combination of decreased neural integrity and increased neuroinflammation, which may indicate neurodegeneration and was previously found to be related to an increased risk of developing clinical Alzheimer's disease (72). Furthermore, an increase in tCho or tCho/tCr was found in the left MTC in association with elevated levels of serum IL-6 and kynurenine in LCModel results. In this case, there was no associated trend of increased mIns. However, the left MTC did present significant decreases in tNAA levels in association with increased levels of serum IL-6 or kynurenine (LCModel). This elevation of tCho, which not coincides with an elevation in mIns, is difficult to interpret, as tCho is a marker of increased synthesis and degradation of cellular membranes, which is not only seen in local inflammation, but also in several other neurological disorders, including cerebral infarctions, multiple sclerosis, and malignant tumors (77).
An interesting finding that was only seen in the results obtained after processing the 1H-MRS data with Tarquin was the elevation of Glx and Glx/tCr levels in left HPC and left MTC in association with higher levels of serum IL-6, adjusted for age, sex, and fat%. Notably, also in the DPCC and right DLPFC, Glx and Glx/tCr levels were close to being significantly positively associated with IL-6 levels, see Supplementary Table 9. These findings are in line with observations in a recent study by Ho et al. (78) who used the LCModel post-processing software and reported an association between increases in circulating IL-6 and increased concentrations of glutamate in the anterior cingulate cortex in adolescents with depression. Elevated IL-6 levels have previously also been linked to depression in older adults (79) and recent studies also found increases in Glx in the anterior or posterior cingulate cortex with LCModel in adolescents with suicidal ideation or in cognitively impaired adults (79–81). It has been suggested that inflammatory cytokines can induce an excessive release of glutamate, which results in oligodendrocyte excitotoxicity. Over time, oligodendrocyte excitotoxicity leads to white matter damage and cell apoptosis (78, 82, 83). In contrast, a meta-analysis showed that Glx levels were significantly decreased in the medial frontal cortex in depressed subjects receiving antidepressant medication (84). Also in mild cognitive impairment and Alzheimer's disease, most studies showed decreases of brain glutamate and Glx (75, 85). Furthermore, most studies have reported a decrease in brain glutamate levels with older age, while glutamine was found to increase and Glx to change inconsistently across studies (86, 87).
The discordance between studies and absence of an association between Glx and serum IL-6 levels in the LCModel in our study can partly be explained by the very low agreement between Tarquin and LCModel results concerning Glx. For all other neurometabolites we found an overall moderate-to-high reliability between the two post-processing software packages. This is in line with other studies who also reported that neurometabolites with prominent singlets (like tNAA and tCho) show better agreement between linear-combination modeling algorithms than signals of lower intensity (like mIns and Glx) (65, 88–91). Based on these findings, it is advised to be careful when interpreting results from studies who use only one software package, especially when sample sizes are small and specifically when findings concern Glx. It has been advocated that reporting results of more than one algorithm may improve the power of 1H-MRS studies (65).
In this study, serum IL-6 and kynurenine levels were not associated with older age, fat%, or cognitive decline. We even found a positive association between serum kynurenine and cognitive function. These findings are in contrast to findings from the previous studies. Considering IL-6, chronic elevations were reported in association with older age (47) and obesity (92, 93). In addition, high levels of peripheral IL-6 negatively affected memory and learning (94) and correlated with poor overall cognitive performance (95, 96). Moreover, high basal IL-6 levels were also associated with an increased risk of future age-related cognitive decline (48, 97). In our study, IL-6 levels inversely correlated with hippocampal GMV (94, 98), which could only be found in the right HPC before exclusion of an outlier in IL-6, see Supplementary Table 7. Based on the findings from existing literature, it has been suggested that high levels of IL-6 may increase the risk of developing neurodegenerative diseases (99). However, our results suggest that serum kynurenine, despite its contradictory positive association with cognitive functioning, would be a better predictor of neuroinflammation and neurodegeneration than IL-6. Of note, IL-6, though widely used as a marker of inflammation, has been suggested to be not only involved in pro-inflammatory processes, but to act as a regulator of both pro- and anti-inflammatory activity (49). For example, a study in healthy humans showed that the administration of IL-6 before an infusion with endotoxin abolished the increase in plasma levels of the pro-inflammatory factor TNF-α (100). In contrast, kynurenine is considered a more robust marker of inflammation, as several pro-inflammatory cytokines, like CRP, IL-1β, IL-6, IL-8, TNF-α, and IFN-γ, were shown to enhance the activation of indoleamine 2,3-dioxygenase, increasing kynurenine levels, while the anti-inflammatory cytokines IL-4 and IL-10 counteracted this increase in kynurenine levels (50–54). Furthermore, kynurenine has previously been linked to obesity (57), cognitive aging (58), psychiatric disorders (54, 55, 59), brain volume loss (59), neurodegenerative disorders (60), and central nervous system injury (50). Taking into account the vast amount of evidence in the recent literature and considering our own results, we propose that kynurenine can be used as a generic peripheral inflammatory marker that is associated with neuroinflammation and neurodegeneration. However, still more research needs to confirm the role of elevated kynurenine levels in age-related cognitive decline and neurodegenerative diseases.
In conclusion, serum kynurenine levels were positively associated with signs of neuroinflammation, specifically in the DPCC, left SM1, and right DLPFC, and the signs of neurodegeneration, specifically in the left HPC, left MT,C and left SM1, after adjusting for age, sex, and fat%. Interestingly, higher levels of IL-6 were associated with an elevation of Glx levels in left HPC, left MTC, and right DLPFC, but only following 1H-MRS post-processing analysis with Tarquin. Of note, the agreement between Tarquin and LCModel results was moderate-to-strong for tNAA, tCho, mIns and tCr, but weak to very weak for Glx in all regions of interest. At last, our results did not find a link between the peripheral inflammatory markers kynurenine or IL-6 and older age, fat%, or cognitive decline. It should be noted that our results are exploratory and should be interpreted with caution due to multiple testing. After correcting for multiple testing with FDR analysis, the positive association between serum kynurenine and tCho right DLPFC (LCModel and Tarquin) and mIns left SM1 (Tarquin) remained statistically significant. Furthermore, a discordant finding of an association between higher IL-6 levels and lower tNAA levels in the left MTC, but higher tNAA levels in left SM1 survived the correction for multiple testing. At last, the negative associations between age and MoCA score and between age and GMV in all regions of interest remained statistically significant after the FDR procedure. Further analyses are needed to specifically assess the relationship between increases of peripheral inflammatory factors and markers of neuroinflammation in older adults and obesity and investigate their role in cognitive decline.
The raw data supporting the conclusions of this article will be made available by the authors, without undue reservation.
The studies involving human participants were reviewed and approved by Medical Ethics Committee for Biomedical Research of the Lithuanian Sports University (No. BE-10-7). The patients/participants provided their written informed consent to participate in this study.
WV, SK, VC, OL, and NM contributed to conception and design of the study. WV, SK, SS, MŠ, KV, RG, MK, VC, OL, and NM were involved in data collection and/or analysis. WV and KP performed the statistical analysis. WV wrote the first draft of the manuscript. SK, MŠ, MK, and UH wrote sections of the manuscript. OL prepared the figures. RG, OL, JV, and NM had a role in supervision. All authors contributed to manuscript revision, read, and approved the submitted version.
This work was supported by the Research Council of Lithuania (Grant Number S-SEN-20-5). The sponsor was not involved in study design; collection, analysis, and interpretation of the data; in writing of the report; nor in the decision to submit the article for publication.
The authors declare that the research was conducted in the absence of any commercial or financial relationships that could be construed as a potential conflict of interest.
All claims expressed in this article are solely those of the authors and do not necessarily represent those of their affiliated organizations, or those of the publisher, the editors and the reviewers. Any product that may be evaluated in this article, or claim that may be made by its manufacturer, is not guaranteed or endorsed by the publisher.
The Supplementary Material for this article can be found online at: https://www.frontiersin.org/articles/10.3389/fpsyt.2022.859772/full#supplementary-material
1H-MRS, proton magnetic resonance spectroscopy; BMI, body mass index; CRP, C-Reactive protein; DLPFC, dorsolateral prefrontal cortex; DPCC, dorsal posterior cingulate cortex; FDR, false discovery rate; Fat%, body fat percentage; Glx, glutamate–glutamine complex; GMV, gray matter volume; HPC, hippocampal cortex; ICC, intraclass correlation coefficient; IL-6, interleukin-6; IL-8, interleukin-8; mIns, myoinositol; MoCA, Montreal Cognitive Assessment; MTC, medial temporal cortex; SM1, primary sensorimotor cortex; tCho, total choline; tCr, total creatine; tNAA, total N-acetyl aspartate; TNF-α, tumor necrosis factor-α.
1. Dall TM, Gallo PD, Chakrabarti R, West T, Semilla AP, Storm M V. An aging population and growing disease burden will require a large and specialized health care workforce by 2025. Health Aff. (2013) 32:2013–20. doi: 10.1377/hlthaff.2013.0714
2. Mattiuzzi C, Lippi G. Worldwide disease epidemiology in the older persons. Eur Geriatr Med. (2020) 11:147–53. doi: 10.1007/S41999-019-00265-2/TABLES/4
3. Mayeux R, Stern Y. Epidemiology of Alzheimer disease. Cold Spring Harb Perspect Med. (2012) 2:6239. doi: 10.1101/CSHPERSPECT.A006239
4. Haththotuwa RN, Wijeyaratne CN, Senarath U. Worldwide epidemic of obesity. In: Mahmood TA, Arulkumaran S, Chervenak FA, editors. Obesity and Obstetrics, 2nd ed. Netherlands: Elsevier (2020) 3–8. doi: 10.1016/B978-0-12-817921-5.00001-1
5. Cournot M, Marquié JC, Ansiau D, Martinaud C, Fonds H, Ferrières J, et al. Relation between body mass index and cognitive function in healthy middle-aged men and women. Neurology. (2006) 67:1208–14. doi: 10.1212/01.WNL.0000238082.13860.50
6. Mrak RE. Alzheimer-type neuropathological changes in morbidly obese elderly individuals. Clin Neuropathol. (2009) 28:40–5. doi: 10.5414/NPP28040
7. Rakesh G, Szabo ST, Alexopoulos GS, Zannas AS. Strategies for dementia prevention: latest evidence and implications. Ther Adv Chronic Dis. (2017) 8:121–36. doi: 10.1177/2040622317712442
8. Sartori AC, Vance DE, Slater LZ, Crowe M. The impact of inflammation on cognitive function in older adults: implications for healthcare practice and research. J Neurosci Nurs. (2012) 44:206–17. doi: 10.1097/JNN.0b013e3182527690
9. Tang Y, Purkayastha S, Cai D. Hypothalamic microinflammation: a common basis of metabolic syndrome and aging. Trends Neurosci. (2015) 38:36–44. doi: 10.1016/J.TINS.2014.10.002
10. Beilharz JE, Maniam J, Morris MJ. Short-term exposure to a diet high in fat and sugar, or liquid sugar, selectively impairs hippocampal-dependent memory, with differential impacts on inflammation. Behav Brain Res. (2016) 306:1–7. doi: 10.1016/J.BBR.2016.03.018
11. Franceschi C, Bonafè M, Valensin S, Olivieri F, De Luca M, Ottaviani E, De Benedictis G. Inflamm-aging. An evolutionary perspective on immunosenescence. in Annals of the New York Academy of Sciences (New York Academy of Sciences):244–254. doi: 10.1111/j.1749-6632.2000.tb06651.x
12. Borodkina A V, Deryabin PI, Giukova AA, Nikolsky NN. “Social life” of senescent cells: what is sasp and why study it? Acta Naturae. (2018) 10:4–14. Available online at: http://www.ncbi.nlm.nih.gov/pubmed/29713514 (accessed October 25, 2020).
13. Dimri GP, Lee X, Basile G, Acosta M, Scott G, Roskelley C, et al. A biomarker that identifies senescent human cells in culture and in aging skin in vivo. Proc Natl Acad Sci U S A. (1995) 92:9363–7. doi: 10.1073/pnas.92.20.9363
14. Campisi J, D'Adda Di Fagagna F. Cellular senescence: when bad things happen to good cells. Nat Rev Mol Cell Biol. (2007) 8:729–40. doi: 10.1038/nrm2233
15. Yudkin JS. Inflammation, obesity, and the metabolic syndrome. in Hormone and Metabolic Research. New York:© Georg Thieme Verlag KG Stuttgart ·, 707–9. doi: 10.1055/s-2007-985898
16. Woods JA, Wilund KR, Martin SA, Kistler BM. Exercise, inflammation and aging. Aging Dis. (2012) 3:130–140. Available online at: /pmc/articles/PMC3320801/?report=abstract (Accessed October 20, 2020).
17. Scheiblich H, Trombly M, Ramirez A, Heneka MT. neuroimmune connections in aging and neurodegenerative diseases. Trends Immunol. (2020) 41:300–12. doi: 10.1016/j.it.2020.02.002
18. Guillemot-Legris O, Muccioli GG. Obesity-induced neuroinflammation: beyond the hypothalamus. Trends Neurosci. (2017) 40:237–53. doi: 10.1016/J.TINS.2017.02.005
19. Terry RD, DeTeresa R, Hansen LA. Neocortical cell counts in normal human adult aging. Ann Neurol. (1987) 21:530–9. doi: 10.1002/ana.410210603
20. Perry VH, Cunningham C, Holmes C. Systemic infections and inflammation affect chronic neurodegeneration. Nat Rev Immunol. (2007) 7:161–7. doi: 10.1038/nri2015
21. Cohen J, Torres C. Astrocyte senescence: evidence and significance. Aging Cell. (2019) 18:12937. doi: 10.1111/acel.12937
22. Lu J, Wu D. mei, Zheng Y lin, Hu B, Cheng W, Zhang Z feng, Shan Q. Ursolic acid improves high fat diet-induced cognitive impairments by blocking endoplasmic reticulum stress and IκB kinase β/nuclear factor-κB-mediated inflammatory pathways in mice. Brain Behav Immun. (2011) 25:1658–67. doi: 10.1016/J.BBI.2011.06.009
23. Tapia-González S, García-Segura LM, Tena-Sempere M, Frago LM, Castellano JM, Fuente-Martín E, et al. Activation of microglia in specific hypothalamic nuclei and the cerebellum of adult rats exposed to neonatal overnutrition. J Neuroendocrinol. (2011) 23:365–70. doi: 10.1111/J.1365-2826.2011.02113.X
24. Guillemot-Legris O, Masquelier J, Everard A, Cani PD, Alhouayek M, Muccioli GG. High-fat diet feeding differentially affects the development of inflammation in the central nervous system. J Neuroinflammation. (2016) 13:1–11. doi: 10.1186/S12974-016-0666-8/FIGURES/5
25. van Dam AM, Bauer J, Tilders FJH, Berkenbosch F. Endotoxin-induced appearance of immunoreactive interleukin-1 beta in ramified microglia in rat brain: a light and electron microscopic study. Neuroscience. (1995) 65:815–26. doi: 10.1016/0306-4522(94)00549-K
26. Layé S, Goujon E, Combe C, VanHoy R, Kelley KW, Parnet P, et al. Effects of lipopolysaccharide and glucocorticoids on expression of interleukin-1β converting enzyme in the pituitary and brain of mice. J Neuroimmunol. (1996) 68:61–6. doi: 10.1016/0165-5728(96)00066-5
27. Nguyen KT, Deak T, Owens SM, Kohno T, Fleshner M, Watkins LR, et al. Exposure to acute stress induces brain interleukin-1β protein in the rat. J Neurosci. (1998) 18:2246. doi: 10.1523/JNEUROSCI.18-06-02239.1998
28. Turrin NP, Gayle D, Ilyin SE, Flynn MC, Langhans W, Schwartz GJ, et al. Pro-inflammatory and anti-inflammatory cytokine mRNA induction in the periphery and brain following intraperitoneal administration of bacterial lipopolysaccharide. Brain Res Bull. (2001) 54:443–53. doi: 10.1016/S0361-9230(01)00445-2
29. Bourgognon JM, Cavanagh J. The role of cytokines in modulating learning and memory and brain plasticity. Brain Neurosci Adv. (2020) 4:239821282097980. doi: 10.1177/2398212820979802
30. Dinarello CA, Cannon JG, Wolff SM. New Concepts on the Pathogenesis of Fever. Rev Infect Dis. (1988) 10:168–89. doi: 10.1093/CLINIDS/10.1.168
31. Ericsson A, Kovács KJ, Sawchenko PE. A functional anatomical analysis of central pathways subserving the effects of interleukin-1 on stress-related neuroendocrine neurons. J Neurosci. (1994) 14:897–913. doi: 10.1523/JNEUROSCI.14-02-00897.1994
32. Goehler LE, Relton JK, Dripps D, Kiechle R, Tartaglia N, Maier SF, et al. Vagal paraganglia bind biotinylated interleukin-1 receptor antagonist: a possible mechanism for immune-to-brain communication. Brain Res Bull. (1997) 43:357–64. doi: 10.1016/S0361-9230(97)00020-8
33. Gaykema RPA, Goehler LE, Tilders FJH, Bol JGJM, McGorry M, Fleshner M, et al. Bacterial endotoxin induces fos immunoreactivity in primary afferent neurons of the vagus nerve. Neuroimmunomodulation. (1998) 5:234–40. doi: 10.1159/000026343
34. Banks WA, Kastin AJ, Brennan JM, Vallance KL. Adsorptive endocytosis of HIV-1gp120 by blood-brain barrier is enhanced by lipopolysaccharide. Exp Neurol. (1999) 156:165–71. doi: 10.1006/EXNR.1998.7011
35. Maier SF. Bi-directional immune-brain communication: implications for understanding stress, pain, and cognition. Brain Behav Immun. (2003) 17:69–85. doi: 10.1016/S0889-1591(03)00032-1
36. Bachstetter AD, Morganti JM, Jernberg J, Schlunk A, Mitchell SH, Brewster KW, et al. Fractalkine and CX 3 CR1 regulate hippocampal neurogenesis in adult and aged rats. Neurobiol Aging. (2011) 32:2030–44. doi: 10.1016/J.NEUROBIOLAGING.2009.11.022
37. Barrientos RM, Kitt MM, Watkins LR, Maier SF. Neuroinflammation in the normal aging hippocampus. Neuroscience. (2015) 309:84–99. doi: 10.1016/j.neuroscience.2015.03.007
38. Maier SF, Watkins LR. Cytokines for psychologists: implications of bidirectional immune-to-brain communication for understanding behavior, mood, and cognition. Psychol Rev. (1998) 105:83–107. doi: 10.1037/0033-295X.105.1.83
39. Campbell SJ, Jiang Y, Davis AEM, Farrands R, Holbrook J, Leppert D, et al. Immunomodulatory effects of etanercept in a model of brain injury act through attenuation of the acute-phase response. J Neurochem. (2007) 103:2245–55. doi: 10.1111/J.1471-4159.2007.04928.X
40. Jiang Y, Deacon R, Anthony DC, Campbell SJ. Inhibition of peripheral TNF can block the malaise associated with CNS inflammatory diseases. Neurobiol Dis. (2008) 32:125–32. doi: 10.1016/J.NBD.2008.06.017
41. Campbell SJ, Hughes PM, Iredale JP, Wilcockson DC, Waters S, Docagne F, et al. CINC-1 is an acute-phase protein induced by focal brain injury causing leukocyte mobilization and liver injury. FASEB J. (2003) 17:1168–70. doi: 10.1096/FJ.02-0757FJE
42. Campbell SJ, Perry VH, Pitossi FJ, Butchart AG, Chertoff M, Waters S, et al. Central nervous system injury triggers hepatic CC and CXC chemokine expression that is associated with leukocyte mobilization and recruitment to both the central nervous system and the liver. Am J Pathol. (2005) 166:1487–97. doi: 10.1016/S0002-9440(10)62365-6
43. Campbell SJ, Deacon RMJ, Jiang Y, Ferrari C, Pitossi FJ, Anthony DC. Overexpression of IL-1beta by adenoviral-mediated gene transfer in the rat brain causes a prolonged hepatic chemokine response, axonal injury and the suppression of spontaneous behaviour. Neurobiol Dis. (2007) 27:151–63. doi: 10.1016/J.NBD.2007.04.013
44. Lind A, Boraxbekk C-J, Petersen ET, Paulson OB, Siebner HR, Marsman A. Regional myo-inositol, creatine, and choline levels are higher at older age and scale negatively with visuospatial working memory: a cross-sectional proton mr spectroscopy study at 7 tesla on normal cognitive ageing. J Neurosci. (2020) 40:8149–59. doi: 10.1523/JNEUROSCI.2883-19.2020
45. Lind A, Boraxbekk CJ, Petersen ET, Paulson OB, Andersen O, Siebner HR, et al. Do glia provide the link between low-grade systemic inflammation and normal cognitive ageing? A 1H magnetic resonance spectroscopy study at 7 tesla. J Neurochem. (2021) 159:185–96. doi: 10.1111/JNC.15456
46. Ershler WB. Interleukin-6: a cytokine for gerontolgists. J Am Geriatr Soc. (1993) 41:176–81. doi: 10.1111/J.1532-5415.1993.TB02054.X
47. Maggio M, Guralnik JM, Longo DL, Ferrucci L. Interleukin-6 in aging and chronic disease: a magnificent pathway. Journals Gerontol - Ser A Biol Sci Med Sci. (2006) 61:575–84. doi: 10.1093/gerona/61.6.575
48. Bradburn S, Sarginson J, Murgatroyd CA. Association of peripheral interleukin-6 with global cognitive decline in non-demented adults: a meta-analysis of prospective studies. Front Aging Neurosci. (2018) 9:438. doi: 10.3389/fnagi.2017.00438
49. Smith LL, Miles MP. “Exercise-Induced Muscle Injury and Inflammation,” in Exercise and Sport Science, eds. Garret WE, Kirkendall DT (Philadelphia: Lippincott Williams & Wilkins), 401–12. Available online at: https://books.google.nl/books?hl=nl&lr=&id=Cx22TcXodrwC&oi=fnd&pg=PA401&dq=exercise-induced+inflammation&ots=9L98ewUuuC&sig=WGkSl6M8qmkH6K4lsSoIVRInkTo#v=onepage&q=exercise-inducedinflammation&f=false (accessed October 20, 2020)
50. Allison DJ, Josse AR, Gabriel DA, Klentrou P, Ditor DS. Targeting inflammation to influence cognitive function following spinal cord injury: a randomized clinical trial. Spinal Cord. (2017) 55:26–32. doi: 10.1038/sc.2016.96
51. Chiarugi A, Calvani M, Meli E, Traggiai E, Moroni F. Synthesis and release of neurotoxic kynurenine metabolites by human monocyte-derived macrophages. J Neuroimmunol. (2001) 120:190–8. doi: 10.1016/S0165-5728(01)00418-0
52. Lustgarten MS, Fielding RA. Metabolites associated with circulating interleukin-6 in older adults. J Gerontol Ser A. (2017) 72:1277–83. doi: 10.1093/GERONA/GLW039
53. Kindler J, Lim CK, Weickert CS, Boerrigter D, Galletly C, et al. Dysregulation of kynurenine metabolism is related to proinflammatory cytokines, attention, and prefrontal cortex volume in schizophrenia. Mol Psychiatry. (2019) 25:2860–2872. doi: 10.1038/s41380-019-0401-9
54. Pedraz-Petrozzi B, Elyamany O, Rummel C, Mulert C. Effects of inflammation on the kynurenine pathway in schizophrenia - a systematic review. J Neuroinflammation. (2020) 17:1–17. doi: 10.1186/S12974-020-1721-Z/TABLES/4
55. Wichers MC, Maes M. The role of indoleamine 2,3-dioxygenase (IDO) in the pathophysiology of interferon-α-induced depression. J Psychiatry Neurosci. (2004) 29:11. Available online at: https://www.ncbi.nlm.nih.gov/pmc/articles/PMC305266/ (Accessed December 16, 2021).
56. Vécsei L, Szalárdy L, Fülöp F, Toldi J. Kynurenines in the CNS: recent advances and new questions. Nat Rev Drug Discov. (2013) 12:64–82. doi: 10.1038/nrd3793
57. Mangge H, Summers KL, Meinitzer A, Zelzer S, Almer G, Prassl R, et al. Obesity-related dysregulation of the Tryptophan–Kynurenine metabolism: role of age and parameters of the metabolic syndrome. Obesity. (2014) 22:195–201. doi: 10.1002/OBY.20491
58. Solvang SEH, Nordrehaug JE, Tell GS, Nygård O, McCann A, Ueland PM, et al. The kynurenine pathway and cognitive performance in community-dwelling older adults. The Hordaland health study. Brain Behav Immun. (2019) 75:155–62. doi: 10.1016/j.bbi.2018.10.003
59. Skorobogatov K, De Picker L, Verkerk R, Coppens V, Leboyer M, et al. Brain vs. blood: a systematic review on the concordance between peripheral and central kynurenine pathway measures in psychiatric disorders. Front Immunol. (2021) 12:980. doi: 10.3389/FIMMU.2021.716980
60. Zwilling D, Huang SY, Sathyasaikumar K V, Notarangelo FM, Guidetti P, Wu HQ, et al. Kynurenine 3-monooxygenase inhibition in blood ameliorates neurodegeneration. Cell. (2011) 145:863–74. doi: 10.1016/J.CELL.2011.05.020
61. Nasreddine ZS, Phillips NA, Bédirian V, Charbonneau S, Whitehead V, Collin I, et al. The montreal cognitive assessment, MoCA: a brief screening tool for mild cognitive impairment. J Am Geriatr Soc. (2005) 53:695–9. doi: 10.1111/j.1532-5415.2005.53221.x
62. Bruijnen CJWH, Dijkstra BAG, Walvoort SJW, Budy MJJ, Beurmanjer H, De Jong CAJ, et al. Psychometric properties of the Montreal Cognitive Assessment (MoCA) in healthy participants aged 18–70. Int J Psychiatry Clin Pract. (2020) 24:293–300. doi: 10.1080/13651501.2020.1746348
63. Malek-Ahmadi M, Powell JJ, Belden CM, Oconnor K, Evans L, Coon DW, et al. Age- and education-adjusted normative data for the montreal cognitive assessment (MoCA) in older adults age 70–99. Neuropsychol Dev Cogn B Aging Neuropsychol Cogn. (2015) 22:755–61. doi: 10.1080/13825585.2015.1041449
64. He X, Li Z, Tang X, Zhang L, Wang L, He Y, Jin T, Yuan D. Age- and sex-related differences in body composition in healthy subjects aged 18 to 82 years. Medicine. (2018) 97:11152. doi: 10.1097/MD.0000000000011152
65. Zöllner HJ, PovaŽan M, Hui SCN, Tapper S, Edden RAE, Oeltzschner G. Comparison of different linear-combination modeling algorithms for short-TE proton spectra. NMR Biomed. (2021) 34:4482. doi: 10.1002/NBM.4482
66. Kanowski M, Kaufmann J, Braun J, Bernarding J, Tempelmann C. Quantitation of simulated short echo time 1H human brain spectra by LCModel and AMARES. Magn Reson Med. (2004) 51:904–12. doi: 10.1002/MRM.20063
67. Near J, Harris AD, Juchem C, Kreis R, Marjańska M, Öz G, Slotboom J, Wilson M, Gasparovic C. Preprocessing, analysis and quantification in single-voxel magnetic resonance spectroscopy: experts' consensus recommendations. NMR Biomed. (2021) 34:457. doi: 10.1002/NBM.4257
68. Glanville NT, Byers DM, Cook HW, Spence MW, Palmer FBSC. Differences in the metabolism of inositol and phosphoinositides by cultured cells of neuronal and glial origin. Biochim Biophys Acta (BBA)/Lipids Lipid Metab. (1989) 1004:169–79. doi: 10.1016/0005-2760(89)90265-8
69. Urenjak J, Williams SR, Gadian DG, Noble M. Proton nuclear magnetic resonance spectroscopy unambiguously identifies different neural cell types. J Neurosci. (1993) 13:981–9. doi: 10.1523/jneurosci.13-03-00981.1993
70. Bitsch A, Bruhn H, Vougioukas V, Stringaris A, Lassmann H, Frahm J, Brück W. Inflammatory CNS demyelination: histopathologic correlation with in vivo quantitative proton MR spectroscopy. Am J Neuroradiol. (1999) 20:1619–27.
71. Cichocka M, Bereś A. From fetus to older age: a review of brain metabolic changes across the lifespan. Ageing Res Rev. (2018) 46:60–73. doi: 10.1016/j.arr.2018.05.005
72. Waragai M, Moriya M, Nojo T. Decreased N-acetyl aspartate/myo-inositol ratio in the posterior cingulate cortex shown by magnetic resonance spectroscopy may be one of the risk markers of preclinical alzheimer's disease: a 7-year follow-up study. J Alzheimer's Dis. (2017) 60:1411–27. doi: 10.3233/JAD-170450
73. Benjamini Y, Hochberg Y. Controlling the false discovery rate: a practical and powerful approach to multiple testing. J R Stat Soc Ser B. (1995) 57:289–300. doi: 10.1111/J.2517-6161.1995.TB02031.X
74. Rosen Y, Lenkinski RE. Recent advances in magnetic resonance neurospectroscopy. Neurotherapeutics. (2007) 4:330–45. doi: 10.1016/j.nurt.2007.04.009
75. Graff-Radford J, Kantarci K. Magnetic resonance spectroscopy in Alzheimer's disease. Neuropsychiatr Dis Treat. (2013) 9:687–96. doi: 10.2147/NDT.S35440
76. Ge X, Xu XY, Feng CH, Wang Y, Li YL, Feng B. Relationships among serum C-reactive protein, receptor for advanced glycation products, metabolic dysfunction, and cognitive impairments. BMC Neurol. (2013) 13:110. doi: 10.1186/1471-2377-13-110
77. Danielsen ER, Ross B eds. Magnetic Resonance Spectroscopy Diagnosis of Neurological Diseases. 1st ed. New York: Marcel Dekker Inc (1999). Available online at: https://www.amazon.com/Magnetic-Resonance-Spectroscopy-Diagnosis-Neurological/dp/0824702387 (accessed October 24, 2020).
78. Ho TC, Teresi GI, Segarra JR, Ojha A, Walker JC, Gu M, et al. Higher levels of pro-inflammatory cytokines are associated with higher levels of glutamate in the anterior cingulate cortex in depressed adolescents. Front Psychiatry. (2021) 12:346. doi: 10.3389/FPSYT.2021.642976/BIBTEX
79. Ali NS, Hashem AHH, Hassan AM, Saleh AA, El-Baz HN. Serum interleukin-6 is related to lower cognitive functioning in elderly patients with major depression. Aging Ment Health. (2018) 22:655–61. doi: 10.1080/13607863.2017.1293005
80. Fayed N, Andrés E, Viguera L, Modrego PJ, Garcia-Campayo J. Higher glutamate+glutamine and reduction of N-acetylaspartate in posterior cingulate according to age range in patients with cognitive impairment and/or pain. Acad Radiol. (2014) 21:1211–7. doi: 10.1016/J.ACRA.2014.04.009
81. Lewis CP, Port JD, Blacker CJ, Sonmez AI, Seewoo BJ, Leffler JM, et al. Altered anterior cingulate glutamatergic metabolism in depressed adolescents with current suicidal ideation. Transl Psychiatry. (2020) 10:119. doi: 10.1038/S41398-020-0792-Z
82. Káradóttir R, Attwell D. Neurotransmitter receptors in the life and death of oligodendrocytes. Neuroscience. (2007) 145:1426–38. doi: 10.1016/J.NEUROSCIENCE.2006.08.070
83. Matute C. Glutamate and ATP signalling in white matter pathology. J Anat. (2011) 219:53–64. doi: 10.1111/J.1469-7580.2010.01339.X
84. Moriguchi S, Takamiya A, Noda Y, Horita N, Wada M, et al. Glutamatergic neurometabolite levels in major depressive disorder: a systematic review and meta-analysis of proton magnetic resonance spectroscopy studies. Mol Psychiatry. (2018) 24:952–64. doi: 10.1038/s41380-018-0252-9
85. Oeltzschner G, Wijtenburg SA, Mikkelsen M, Edden RAE, Barker PB, Joo JH, et al. Neurometabolites and associations with cognitive deficits in mild cognitive impairment: a magnetic resonance spectroscopy study at 7 Tesla. Neurobiol Aging. (2019) 73:211–8. doi: 10.1016/J.NEUROBIOLAGING.2018.09.027
86. Harris JL, Yeh H-W, Swerdlow RH, Choi I-Y, Lee P, Brooks WM. High-field proton magnetic resonance spectroscopy reveals metabolic effects of normal brain aging. Neurobiol Aging. (2014) 35:1686–94. doi: 10.1016/j.neurobiolaging.2014.01.018
87. Cleeland C, Pipingas A, Scholey A, White D. Neurochemical changes in the aging brain: a systematic review. Neurosci Biobehav Rev. (2019) 98:306–19. doi: 10.1016/j.neubiorev.2019.01.003
88. Wilson M, Reynolds G, Kauppinen RA, Arvanitis TN, Peet AC. A constrained least-squares approach to the automated quantitation of in vivo 1H magnetic resonance spectroscopy data. Magn Reson Med. (2011) 65:1–12. doi: 10.1002/MRM.22579
89. Mosconi E, Sima DM, Osorio Garcia MI, Fontanella M, Fiorini S, Van Huffel S, et al. Different quantification algorithms may lead to different results : a comparison using proton MRS lipid signals. NMR Biomed. (2014) 27:431–43. doi: 10.1002/NBM.3079
90. Scott J, Underwood J, Garvey LJ, Mora-Peris B, Winston A. A comparison of two post-processing analysis methods to quantify cerebral metabolites measured via proton magnetic resonance spectroscopy in HIV disease. Br J Radiol. (2016) 89:20150979. doi: 10.1259/BJR.20150979
91. Kossowski B, Orzeł J, Bogorodzki P, Wilson M, Setkowicz Z. P. Gazdzinski S Follow-up analyses on the effects of long-term use of high fat diet on hippocampal metabolite concentrations in Wistar rats: Comparing Tarquin quantification of 70T rat metabolites to LCModel. Biol Eng Med. (2017) 2:1–7. doi: 10.15761/BEM.1000129
92. Pedersen BK, Febbraio MA. Muscles, exercise and obesity: skeletal muscle as a secretory organ. Nat Rev Endocrinol. (2012) 8:457–65. doi: 10.1038/nrendo.2012.49
93. Carey AL, Bruce CR, Sacchetti M, Anderson MJ, Olsen DB, Saltin B, et al. Interleukin-6 and tumor necrosis factor-α are not increased in patients with Type 2 diabetes: evidence that plasma interleukin-6 is related to fat mass and not insulin responsiveness. Diabetologia. (2004) 47:1029–37. doi: 10.1007/s00125-004-1403-x
94. Kline R, Wong E, Haile M, Didehvar S. Peri-operative inflammatory cytokines in plasma of the elderly correlate in prospective study with postoperative changes in cognitive test scores. Int J Anesthesiol Res. (2016) 4:313–21. doi: 10.19070/2332-2780-1600065
95. Puzianowska-Kuznicka M, Owczarz M, Wieczorowska-Tobis K, Nadrowski P, Chudek J, Slusarczyk P, et al. Interleukin-6 and C-reactive protein, successful aging, and mortality: the PolSenior study. Immun Ageing. (2016) 13:76. doi: 10.1186/s12979-016-0076-x
96. Paine NJ, Bosch JA, Ring C, Drayson MT. Veldhuijzen van Zanten JJCS. Induced mild systemic inflammation is associated with impaired ability to improve cognitive task performance by practice. Psychophysiology. (2015) 52:333–41. doi: 10.1111/psyp.12360
97. Shivakumar V, Debnath M, Venugopal D, Rajasekaran A, Kalmady S V, Subbanna M, et al. Influence of correlation between HLA-G polymorphism and Interleukin-6 (IL6) gene expression on the risk of schizophrenia. Cytokine. (2018) 107:59–64. doi: 10.1016/j.cyto.2017.11.016
98. Marsland AL, Gianaros PJ, Kuan DCH, Sheu LK, Krajina K, Manuck SB. Brain morphology links systemic inflammation to cognitive function in midlife adults. Brain Behav Immun. (2015) 48:195–204. doi: 10.1016/j.bbi.2015.03.015
99. Thielen JW, Kärgel C, Müller BW, Rasche I, Genius J, Bus B, Maderwald S, Norris DG, Wiltfang J, Tendolkar I. Aerobic activity in the healthy elderly is associated with larger plasticity in memory related brain structures and lower systemic inflammation. Front Aging Neurosci. (2016) 8:319. doi: 10.3389/fnagi.2016.00319
Keywords: aging, cognition, obesity, gray matter volume, neurochemicals, cerebral metabolite ratios, inflammation, brain imaging
Citation: Vints WAJ, Kušleikiene S, Sheoran S, Šarkinaite M, Valatkevičiene K, Gleizniene R, Kvedaras M, Pukenas K, Himmelreich U, Cesnaitiene VJ, Levin O, Verbunt J and Masiulis N (2022) Inflammatory Blood Biomarker Kynurenine Is Linked With Elevated Neuroinflammation and Neurodegeneration in Older Adults: Evidence From Two 1H-MRS Post-Processing Analysis Methods. Front. Psychiatry 13:859772. doi: 10.3389/fpsyt.2022.859772
Received: 21 January 2022; Accepted: 11 March 2022;
Published: 11 April 2022.
Edited by:
Antoine Hone-Blanchet, Massachusetts General Hospital and Harvard Medical School, United StatesReviewed by:
Joseph O'Neill, University of California, United StatesCopyright © 2022 Vints, Kušleikiene, Sheoran, Šarkinaite, Valatkevičiene, Gleizniene, Kvedaras, Pukenas, Himmelreich, Cesnaitiene, Levin, Verbunt and Masiulis. This is an open-access article distributed under the terms of the Creative Commons Attribution License (CC BY). The use, distribution or reproduction in other forums is permitted, provided the original author(s) and the copyright owner(s) are credited and that the original publication in this journal is cited, in accordance with accepted academic practice. No use, distribution or reproduction is permitted which does not comply with these terms.
*Correspondence: Wouter A. J. Vints, dy52aW50c0BtYWFzdHJpY2h0dW5pdmVyc2l0eS5ubA==
Disclaimer: All claims expressed in this article are solely those of the authors and do not necessarily represent those of their affiliated organizations, or those of the publisher, the editors and the reviewers. Any product that may be evaluated in this article or claim that may be made by its manufacturer is not guaranteed or endorsed by the publisher.
Research integrity at Frontiers
Learn more about the work of our research integrity team to safeguard the quality of each article we publish.