
95% of researchers rate our articles as excellent or good
Learn more about the work of our research integrity team to safeguard the quality of each article we publish.
Find out more
ORIGINAL RESEARCH article
Front. Psychiatry , 05 October 2022
Sec. Computational Psychiatry
Volume 13 - 2022 | https://doi.org/10.3389/fpsyt.2022.841999
This article is part of the Research Topic The Development of Biomarkers in Psychiatry View all 11 articles
Background: Transcriptome-wide analysis of peripheral blood in post-traumatic stress disorder (PTSD) indicates widespread changes in immune-related pathways and function. Ferroptosis, an iron-dependent regulated cell death, is closely related to oxidative stress. However, little is known as to whether ferroptosis plays a role in PTSD.
Methods: We conducted a comprehensive analysis of combined data from six independent peripheral blood transcriptional studies in the Gene Expression Omnibus (GEO) database, covering PTSD and control individuals. Differentially expressed genes (DEGs) were extracted by comparing PTSD patients with control individuals, from which 29 ferroptosis-related genes (FRGs) were cross-matched and obtained. The weighted gene co-expression network analysis (WGCNA), the Extreme Gradient Boosting (XGBoost) model with Bayesian Optimization, and the least absolute shrinkage and selection operator (LASSO) Cox regression were utilized to construct a PTSD prediction model. Single-sample Gene Set Enrichment Analysis (ssGSEA) and CIBERSORT revealed the disturbed immunologic state in PTSD high-risk patients.
Results: Three crucial FRGs (ACSL4, ACO1, and GSS) were identified and used to establish a predictive model of PTSD. The receiver operating characteristic (ROC) curve verifies its risk prediction ability. Remarkably, ssGSEA and CIBERSORT demonstrated changes in cellular immunity and antigen presentation depending on the FRGs model.
Conclusion: These findings collectively provide evidence that ferroptosis may change immune status in PTSD and be related to the occurrence of PTSD, which may help delineate mechanisms and discover treatment biomarkers for PTSD.
Post-traumatic stress disorder (PTSD) is a psychiatric syndrome involving the interaction of environments and genes. PTSD occurs after a traumatic experience and is followed by flashbacks, hallucinations, nightmares, constant alertness, and enhanced arousal (1). By definition, PTSD is associated with a traumatic event. However, data also suggest that the development of PTSD requires a genetic tendency that alters, to varying degrees, an individual’s response to, or recovery from, traumatic exposure (2).
The development of high-throughput sequencing technology has enabled unbiased identification of genes, pathways, and proteins related to PTSD pathophysiology. Data from five PTSD peripheral blood studies indicated that transcriptional disruption affects multiple immune-related pathways and molecules (3). In a review of similar studies, Heinzlemann and Gill concluded that PTSD develops as a result of altered epigenetic regulation and inflammatory genes that are highly active (4).
Despite the widespread observation of immune fluctuations, it remains unclear how specific mechanisms are activated or how key processes are regulated. On the other hand, the nervous system is particularly vulnerable to oxidative stress due to its high metabolic demands and dense composition of oxidation-sensitive lipid cells (5, 6). PTSD patients showed elevated serum lipid peroxidation and depleted antioxidant enzymes (7). Down-regulated expression of the antioxidant protease, superoxide dismutase (SOD), also was observed in PTSD patients (8).
Oxidative stress is a cellular state that occurs when the pro-oxidant molecules, such as reactive oxygen species (ROS), exceed the elimination power of the antioxidants (9). Antioxidant depletion leads to cell degeneration and apoptosis, making oxidative stress a primary molecular aging mechanism widely involved in multiple diseases.
In the presence of excess iron, or more precisely, the divalent ferrous ion Fe2+, can produce abundant ROS such as soluble hydroxyl radicals or lipid alkoxy radicals (10). Known as the Fenton reaction, this is the main source of ROS in the cell produced by Fe2+. By generating ROS, mitochondrial respiration is reduced, lipids are peroxidized, enzymes are oxidized, and neuronal damage is possible (11). Moreover, ROS and mitochondrial function seem to be closely related to the innate immune system. Mitochondria-derived ROS can trigger some inflammasomes such as nucleotide-binding and oligomerization domain (NOD)-like receptors (NLRs), and Melanoma (AIM) 2-like receptors (ALRs) (12, 13).
Another process closely related to iron metabolism and ROS is ferroptosis. Ferroptosis is a form of iron-dependent cell death induced by oxidative stress, and that involves molecular pathways common to oxidative stress, such as lipid peroxidation and glutathione (GSH) depletion (14). The Fenton reaction is the critical step of ferroptosis. A high level of iron produces excessive ROS and leads to liposome peroxidation, which leads to cell death. Although first found in cancer cells, ferroptosis has been linked to several neurological illnesses, such as Alzheimer’s, Parkinson’s, and stroke (15–17). Stefanovic et al. found lower GSH transferase levels in PTSD (18), suggesting that ferroptosis may be involved in the pathophysiological process of PTSD. These studies suggest that ferroptosis may be a key influence in the pathological processes of PTSD.
The main aim of the current study is to synthesize available data from transcriptional studies of PTSD and to elucidate the association of ferroptosis-related genes (FRGs) with the pathophysiology of PTSD. Six independent studies from the Gene Expression Omnibus (GEO) database were included. Multiple algorithms were used in this study to establish a risk prediction model for PTSD, including the weighted gene co-expression network analysis (WGCNA), the Extreme Gradient Boosting (XGBoost) model with Bayesian Optimization, and the least absolute shrinkage and selection operator (LASSO) Cox regression (Figure 1). Furthermore, immune cell and function analyses were conducted to reveal the possible underlying mechanism of PTSD assessments.
The RNA sequencing (RNA-seq) data of PTSD patients were obtained from the GEO database (accession numbers: GSE97356, GSE81761, GSE63878, GSE64813, GSE67663, and GSE109409) (Table 1). GSE97356 contains 324 World Trade Center responders, of which 123 individuals are in the PTSD group, and 201 individuals are controls. GSE81761 includes military service members with PTSD (n = 39) and controls without PTSD (n = 27) at baseline. GSE63878 contains 96 samples from U.S. Marines deployed to conflict zones, half of whom returned with PTSD. GSE64813 involved 188 samples of service members, and half with PTSD. GSE67663 summarizes the gene expression profiles of 112 PTSD cases and 72 controls. GSE109409 contains 85 Canadian infantry soldiers, of whom 27 were positive for PTSD. All research projects used peripheral blood to obtain transcriptome-wide RNA-Seq data, and both are publicly available. Thus, the present study was exempt from requiring approval from local ethics committees. The GSE97356 and GSE81761 datasets were used as training sets, while the others were used as independent validation datasets. The ferroptosis-related genes (FRGs) list was derived from previously published research (19–23).
All statistical analyses were conducted using the R program version 3.6.2 and GraphPad software (Prism 8). Each individual’s gene expression profiles were summarized after the microarray probes were mapped with gene symbols according to the chips and platforms. If multiple microarray probes were mapped to one single gene, the expression level was expressed as the mean value. The analysis did not include missing data or samples with low coverage. The gene expression values were log2-transformed, namely log2 Fold Change (log2FC), before normalization. The batch correction was conducted using the R package ComBat and sva functions to reduce cohort effects and remove system variability from technical, clinical, or demographic factors (3, 24). Subsequently, combined and normalized cohorts contained gene expression data from two GEO cohorts that included PTSD and control individuals. We performed a principal component analysis (PCA) to verify whether the batch effect was eliminated. Continuous variables were compared between groups using the equal-variance T-test. Unless otherwise noted, the significance threshold for the P-value was set to 0.05.
The Wilcoxon test for non-parametric distributions was performed to detect differential gene expressions (DGEs) between PTSD and controls samples by the limma package. The weighted gene co-expression network analysis (WGCNA) is a common method to transform gene expression data into a co-expression network and identify disease-related gene modules and key genes affecting phenotypic traits (25, 26). The R program’s WGCNA package was utilized on DGEs data to identify highly connected modules, which summarized specific gene expression patterns related to PTSD. Under the proper soft threshold power, clustering analysis can successfully establish a standard scale-free network, and then overlapping WGCNA function was used to get a Topological Overlap Matrix (TOM). Similar modules were merged by the hierarchical clustering method with a height cut-off of 0.25. Module eigengenes (MEs) were principal components and summarized all gene expression patterns into a specific module. Subsequently, module-trait associations were estimated using spearman’s correlation analysis (in our study, clinical trait refers to PTSD). The module with the highest spearman’s correlation coefficient was extracted. Genes clustered in the module genes were then cross-matched with FRGs, thus identifying FRGs potentially crucial in PTSD development.
In order to further refine the screening of key genes, we employed the Extreme Gradient Boosting (XGBoost) algorithm. The XGBoost algorithm excels as a method for combining multiple learning algorithms into one superior predictive algorithm. It consists primarily of two parts: a decision tree algorithm and a gradient boosting algorithm (27). Boosting is accomplished by setting up weak evaluators individually and integrating multiple weak evaluators iteratively. Because hyperparameters can greatly impact the classification performance of the XGBoost model, the Bayesian parameter optimization based on Gaussian processes was applied as a way to adjust them (28). Four main hyperparameters were associated with the Bayesian optimization in this article: Eta (Learning rate), Max depth (Maximum depth of a tree), Min child weight (Minimum sum of instance weight needed in a child), and Subsample (Subsample ratio of the training instances). We used the area under the curve (AUC) as the objective function. Ranks of features were determined by the average gain of each feature across all trees. High-value features can be considered more significant for prediction than low-value features. An analysis of the model’s performance was compared according to the learning curve. As a result, the classification model’s generalization ability (overfitting or underfitting) could be effectively evaluated (29).
Gene Ontology (GO) enrichment and Kyoto Encyclopedia of Genes and Genomes (KEGG) pathway analyses were conducted to better understand the biologic function of DGEs and FRGs. GO analysis utilized the Biological Process term, which provides current scientific information about the functions of encoding and non-coding genes and allows exploring how individual genes contribute to an organism’s biology at the molecular, cellular, and organism levels. KEGG database provides information for biological system functions such as cells, organisms, and ecosystems, mainly generated from large-scale datasets produced by genome sequencing and other high-throughput technologies. The intersection of DGEs and FRGs was assessed via the R VennDiagram package. The GO Biological Process and KEGG pathway analyses identified major biological terms via the R “clusterProfiler” package. The R “GOplot” package was employed to visualize the enrichment terms.
The Search Tool for the Retrieval of Interacting Genes database1 provides protein interaction information from large-scale sequencing sources (30). Using this tool, the physical and functional associations among specific gene clusters (based on user requirements) can be computationally predicted. A protein–protein interaction (PPI) network among intersection genes of DGEs and FRGs was calculated by topology analysis using Maximal Clique Centrality (MCC).
Genome-wide analysis of gene expression levels and high throughput technology produces a large amount of data that allows statistical analyses of complex diseases’ genetic causes. Regularization via the least absolute shrinkage and selection operator (LASSO) is often used to reduce the selected set of explanatory variables in examining the associations between all biomarkers and a given phenotype (31). The LASSO model construction was accomplished using the R package “glmnet.” After tenfold cross-validation with minimum standards to determine the penalty parameters (λ), the Lasso model was established. The Receiver Operating Characteristic (ROC) curve verified the prediction ability for the risk of illness.
Single-sample Gene Set Enrichment Analysis (ssGSEA) classified gene sets with immune biological roles by identified immune markers (32, 33). The immune markers comprised 782 immune-related genes representing diverse immunologic cells and functions (34). The expression data were changed into ssGSEA scores to predict the abundance of each gene set type in individual samples. The gene expression profile of two combined PTSD studies was transformed into a gene set enrichment profile.
Cell-type identification by estimating relative subsets of RNA transcript, also named CIBERSORT, is a computational algorithm that distinguishes 22 immune cell types retrieved from RNA-sequencing gene expression profiles (35). Cell types including B cells naïve, B cells memory, Plasma cells, T cells CD8, T cells CD4 naïve, T cells CD4 memory resting, T cells CD4 memory activated, T cells follicular helper, T cells regulatory (Tregs), T cells gamma delta, NK cells resting, NK cells activated, Monocytes, Macrophages M0, Macrophages M1, Macrophages M2, Dendritic cells resting, Dendritic cells activated, Mast cells resting, Mast cells activated, Eosinophils, and Neutrophils were estimated in each sample. And in that way, the gene expression profile was transformed into an immune cell profile.
The samples based on the unnormalized expression values showed a distribution bias by batch (Figure 2A). After normalization, the PCA plot indicated that the batch effect was removed from the different platforms (Figure 2B), and 185 PTSD subjects and 248 controls were included in the training datasets. The batch correction had a significant impact on the log2FC value of the differential genes. The absolute value of average log2FC decreased from 89 to less than 1. Therefore, instead of utilizing log2FC, we used a stronger P-value criterion, namely the P-value after FDR (false discovery rate) correction. A total of 5362 DGEs were screened from 19,281 genes at baseline using an FDR value less than 0.05, of which 369 were up-regulated, and 4993 were down-regulated (Figure 2C). After matching with 60 FRGs reported in previous studies, we obtained 29 differential FRGs (Figure 2D): ACACA, ACO1, ACSF2, ACSL3, ACSL4, AIFM2, AKR1C3, ALOX5, ALOX12, ALOX15, CBS, CD44, CHAC1, CISD1, CRYAB, CS, DPP4, EMC2, FADS2, FANCD2, FDFT1, FTH1, G6PD, GCLC, GCLM, GLS2, GOT1, GPX4, and GSS.
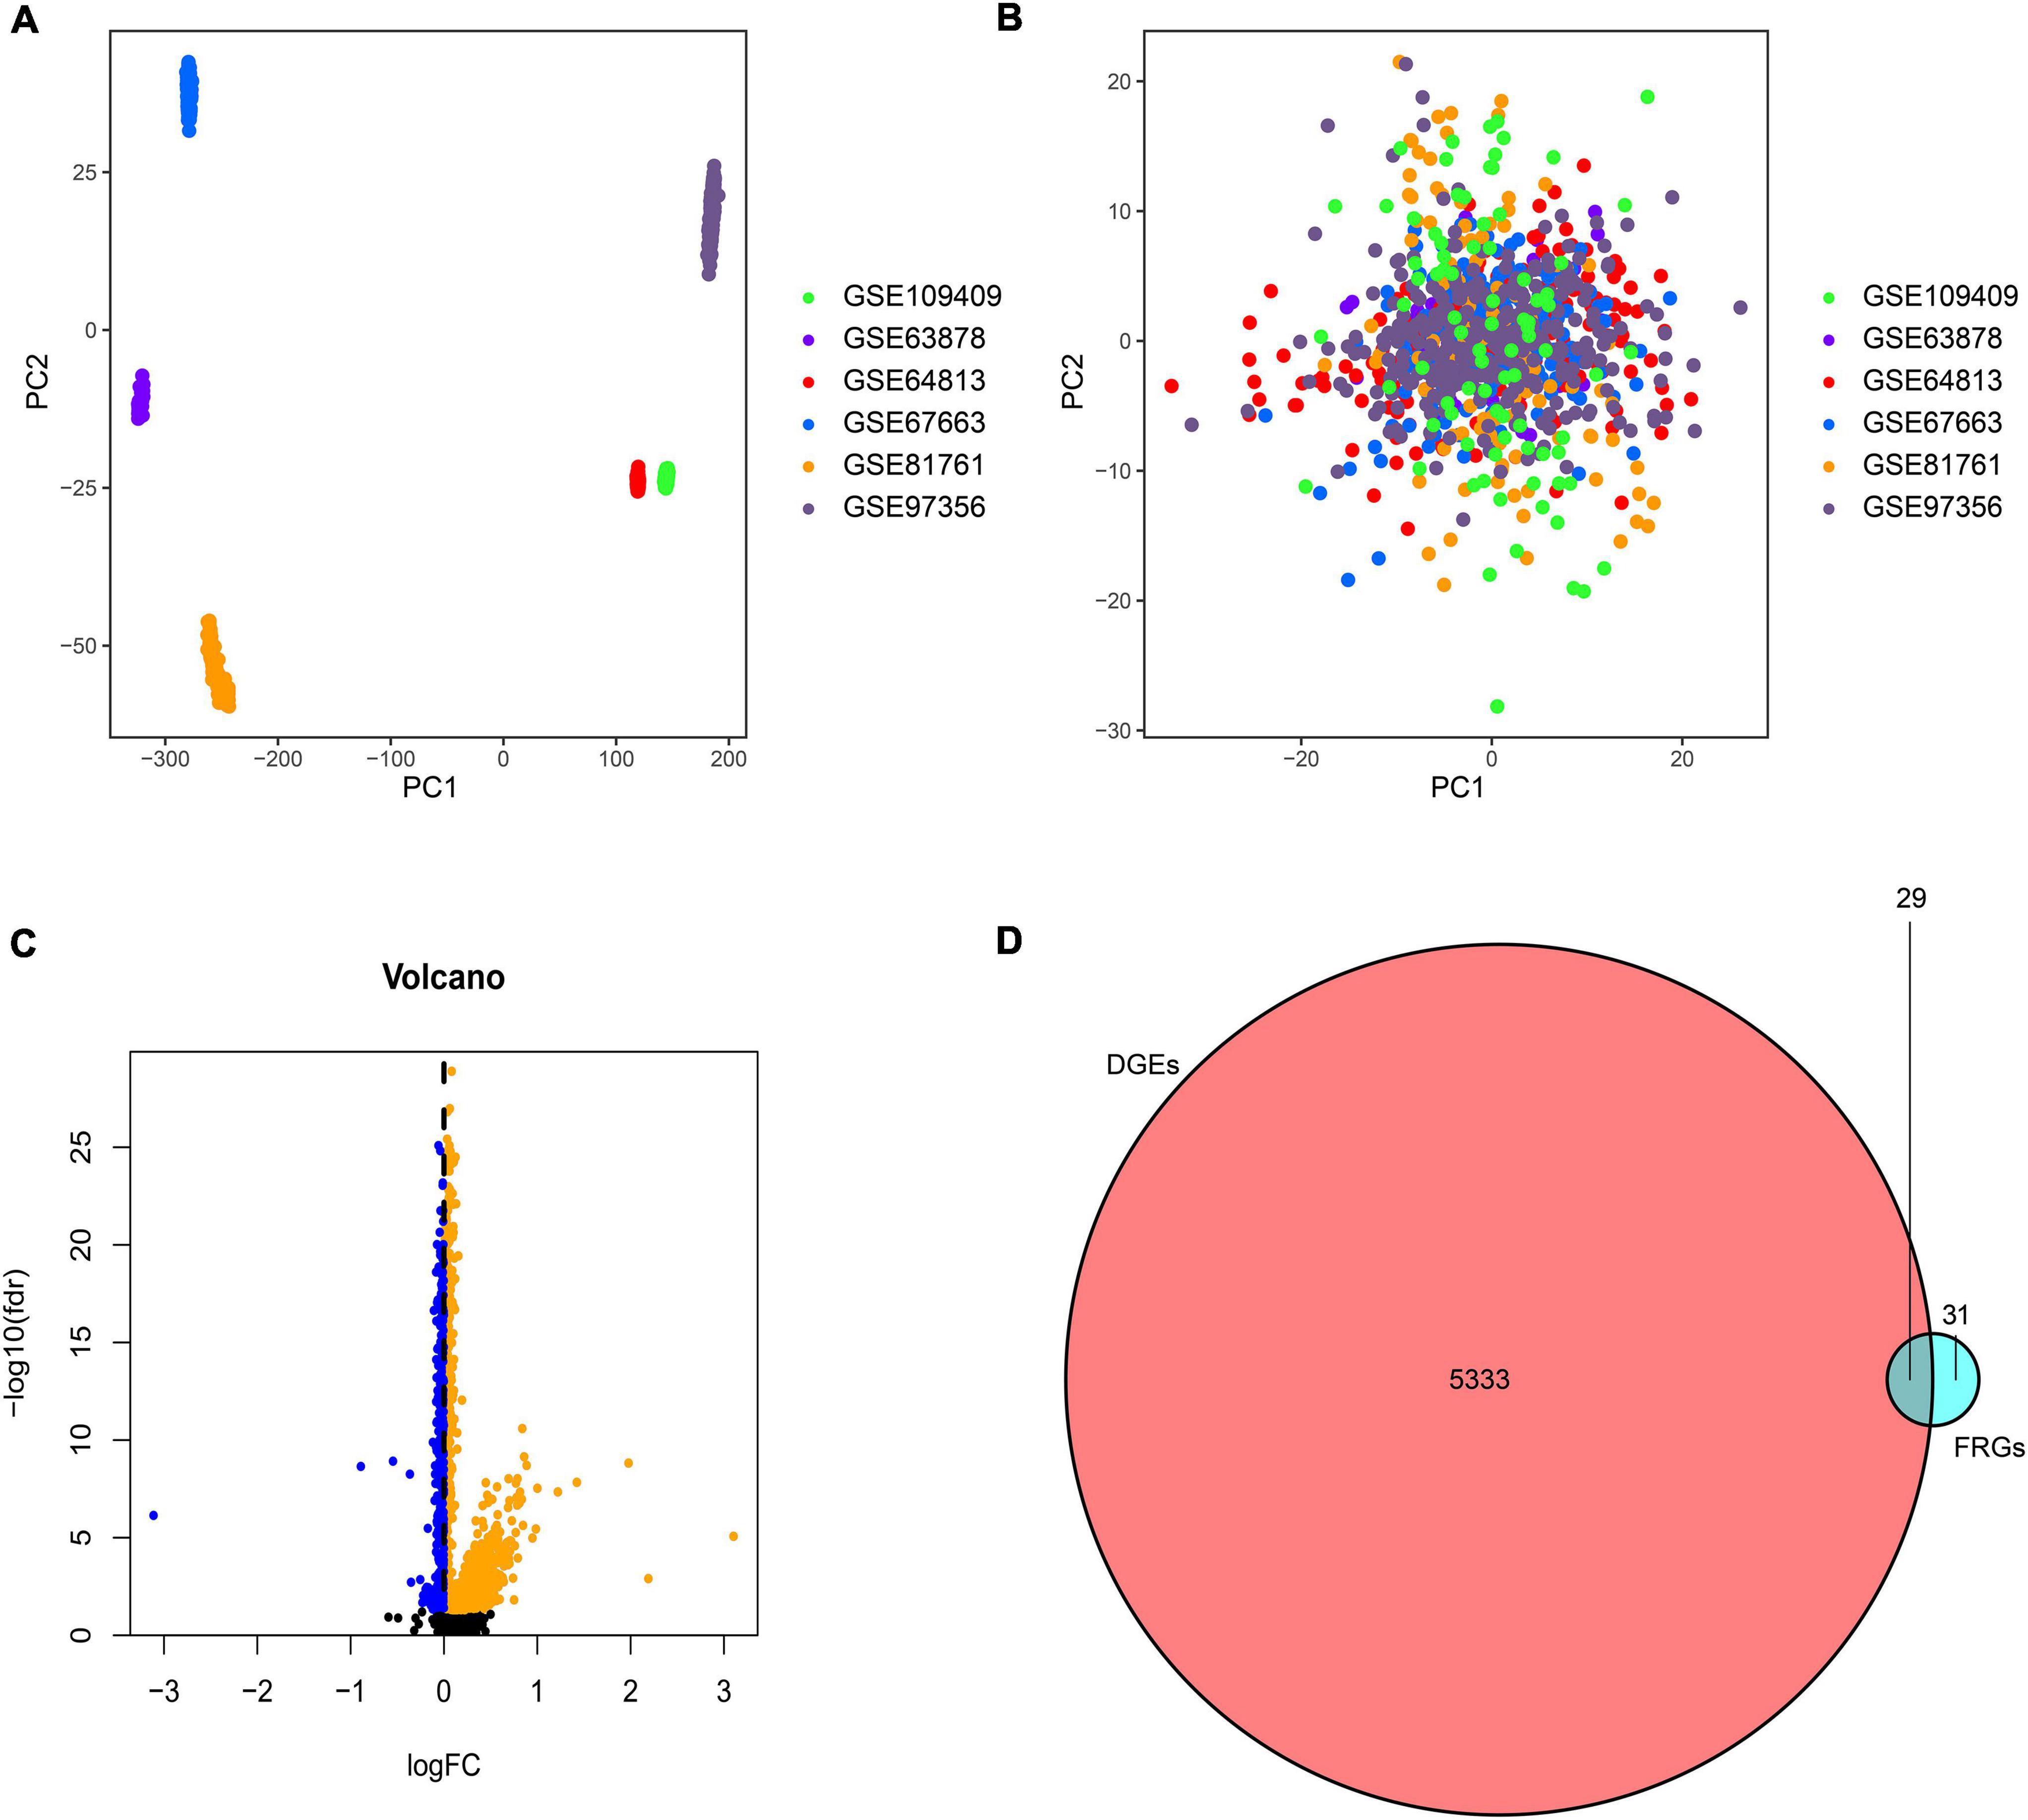
Figure 2. Principal component analysis (PCA) of the six GEO datasets. (A) Scatter plots present the samples based on two principal components (PC1 and PC2) without removing the batch effect. (B) Scatter plots to present the samples with the removal of batch effect. (C) Volcano plot of DGEs in the combined GEO cohort. The orange spots represented the up-regulated genes, and the blue spots represented the down-regulated genes between PTSD and controls. (D) Venn diagram of DGEs and FRGs showed the cross-match gene set contained 29 crucial FRGs.
Gene Ontology enrichment analysis related to biological processes (BP) found that the 29 differential FRGs were enriched in several metabolic pathways, including carboxylic acid biosynthesis, organic acid biosynthesis, long-chain fatty acid metabolism, and glutathione metabolism. Cellular components (CC) genes were concentrated in various organelle membranes, e.g., organelle outer membrane, mitochondrial outer membrane, and microbody membrane. Molecular function (MF) genes were mainly enriched in terms of the activity of multiple enzymes, including acyl-CoA ligase activity, acid-amino acid ligase activity, and acid-thiol ligase activity (Figure 3). Not surprisingly, in the KEGG pathway analyses, the 29 differential FRGs were notably associated with ferroptosis and some metabolic pathways similar to those revealed by GO enrichment, such as fatty acid biosynthesis, 2-Oxocarboxylic acid metabolism, and glutathione metabolism (Figure 4).
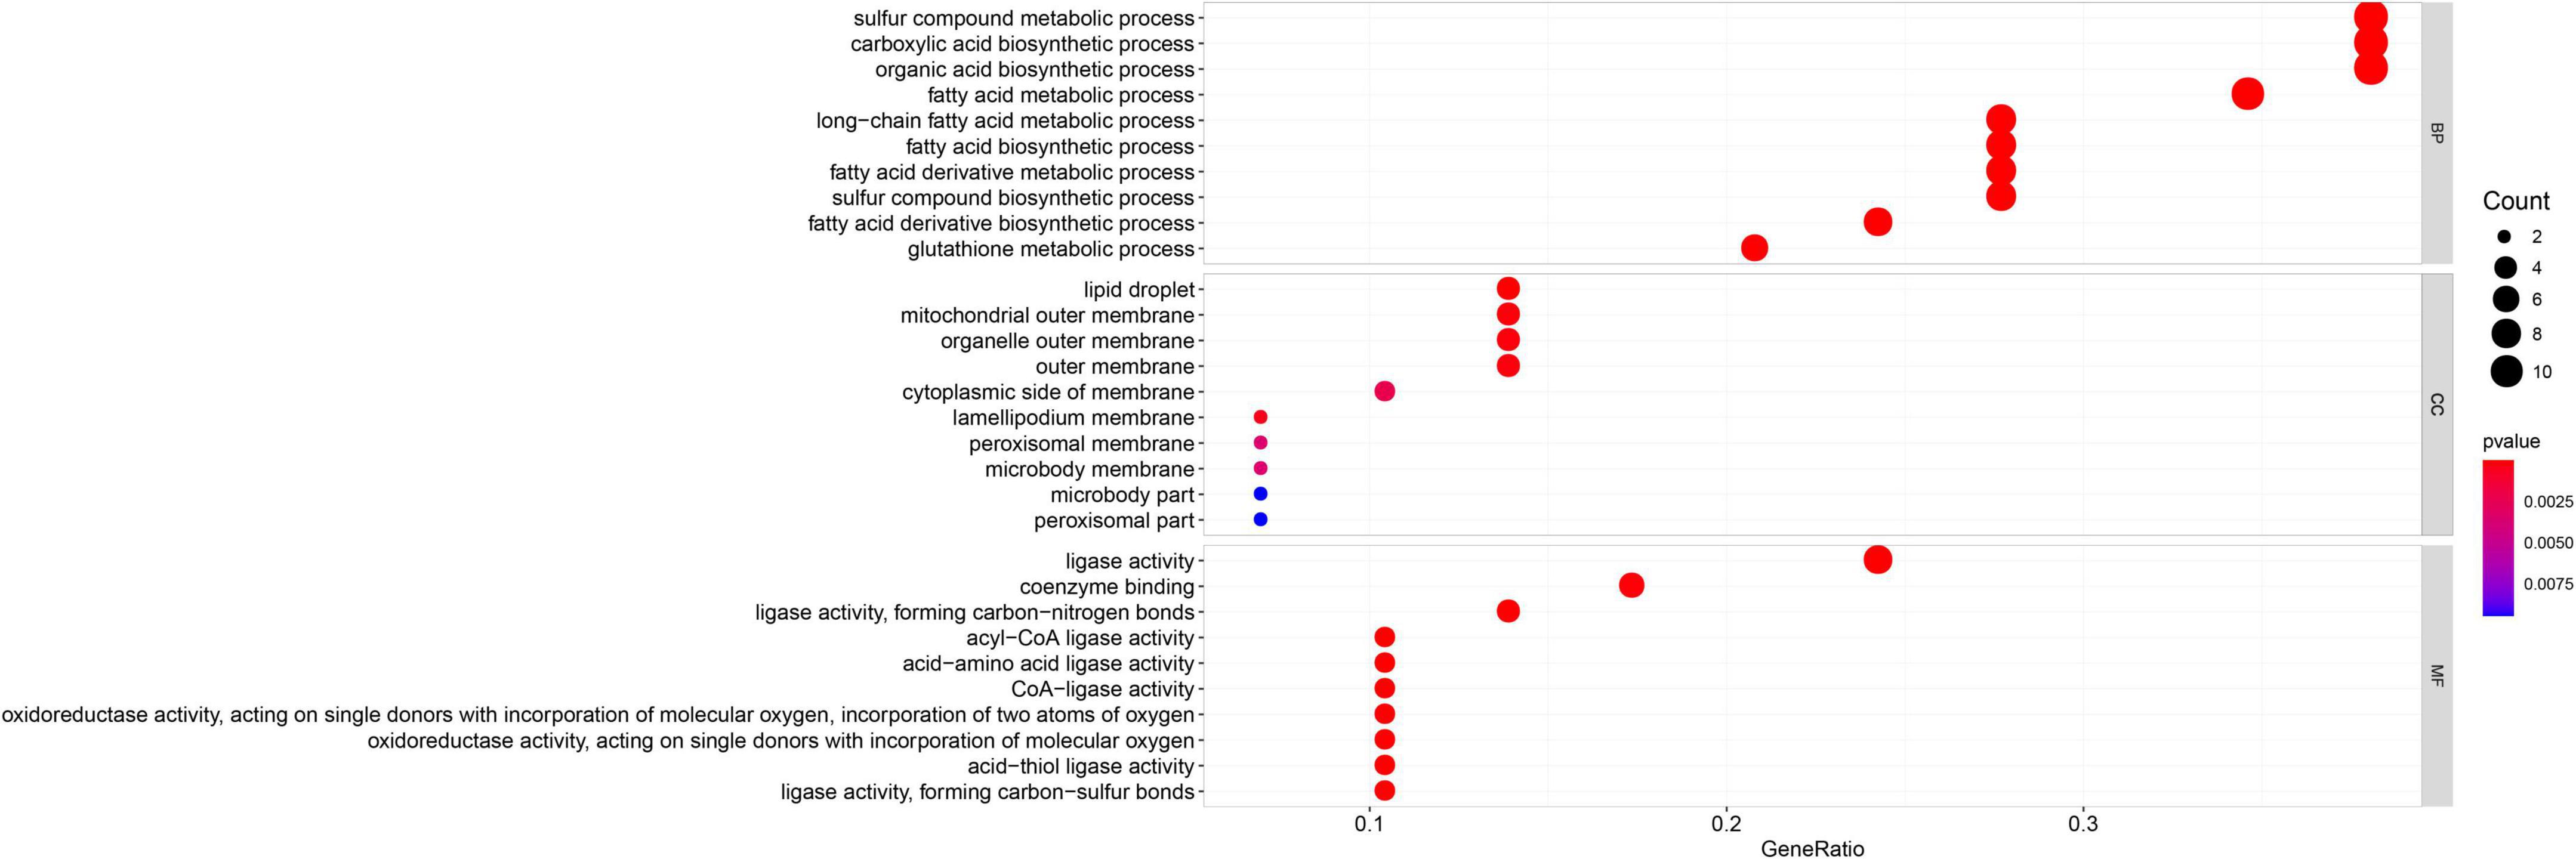
Figure 3. Gene Ontology enrichment of 29 differential FRGs. The count shows the number of genes enriched in the pathway. Gene ratio: the ratio of the FRGs number in this term to the total number of FRGs.
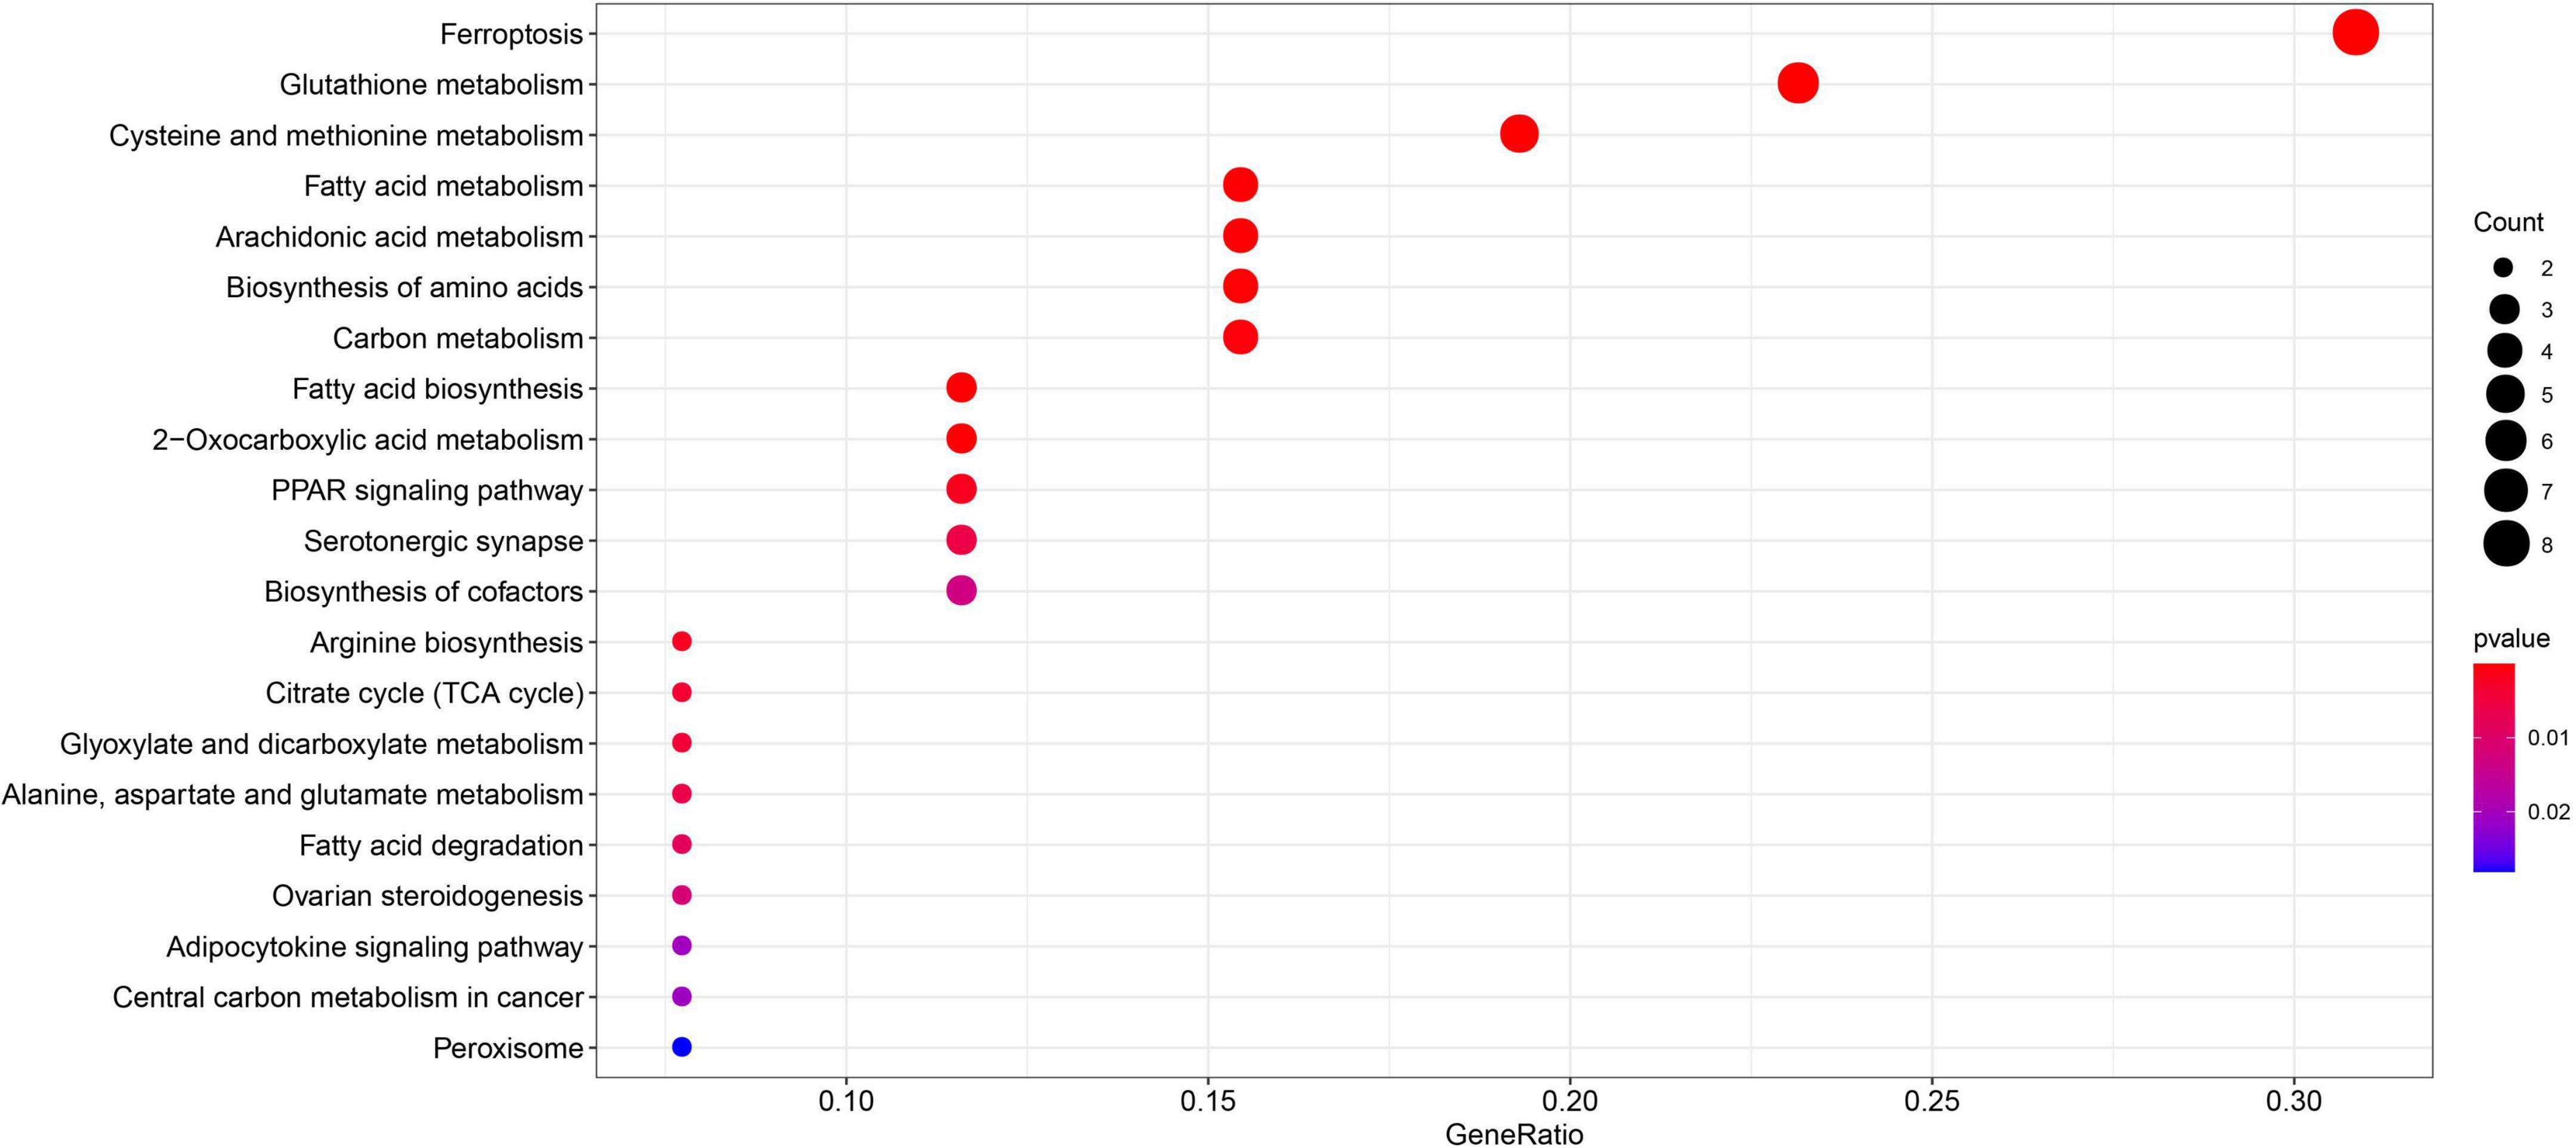
Figure 4. Kyoto encyclopedia of genes and genomes enrichment of 29 differential FRGs. The count shows the number of genes enriched in the pathway. Gene ratio: the ratio of the FRGs number in this term to the total number of FRGs.
The PPI network was constructed with the 29 differential FRGs using the STRING database (Figure 5A). Subsequently, 15 significant network nodes (GCLC, G6PD, ACACA, GCLM, GPX4, GOT1, CS, GSS, ACSL4, FADS2, GLS2, ACSL3, ALOX15, FTH1, ACO1) were identified with a PPI combined score > 0.4, which indicated a medium to high confidence network (Figure 5B).
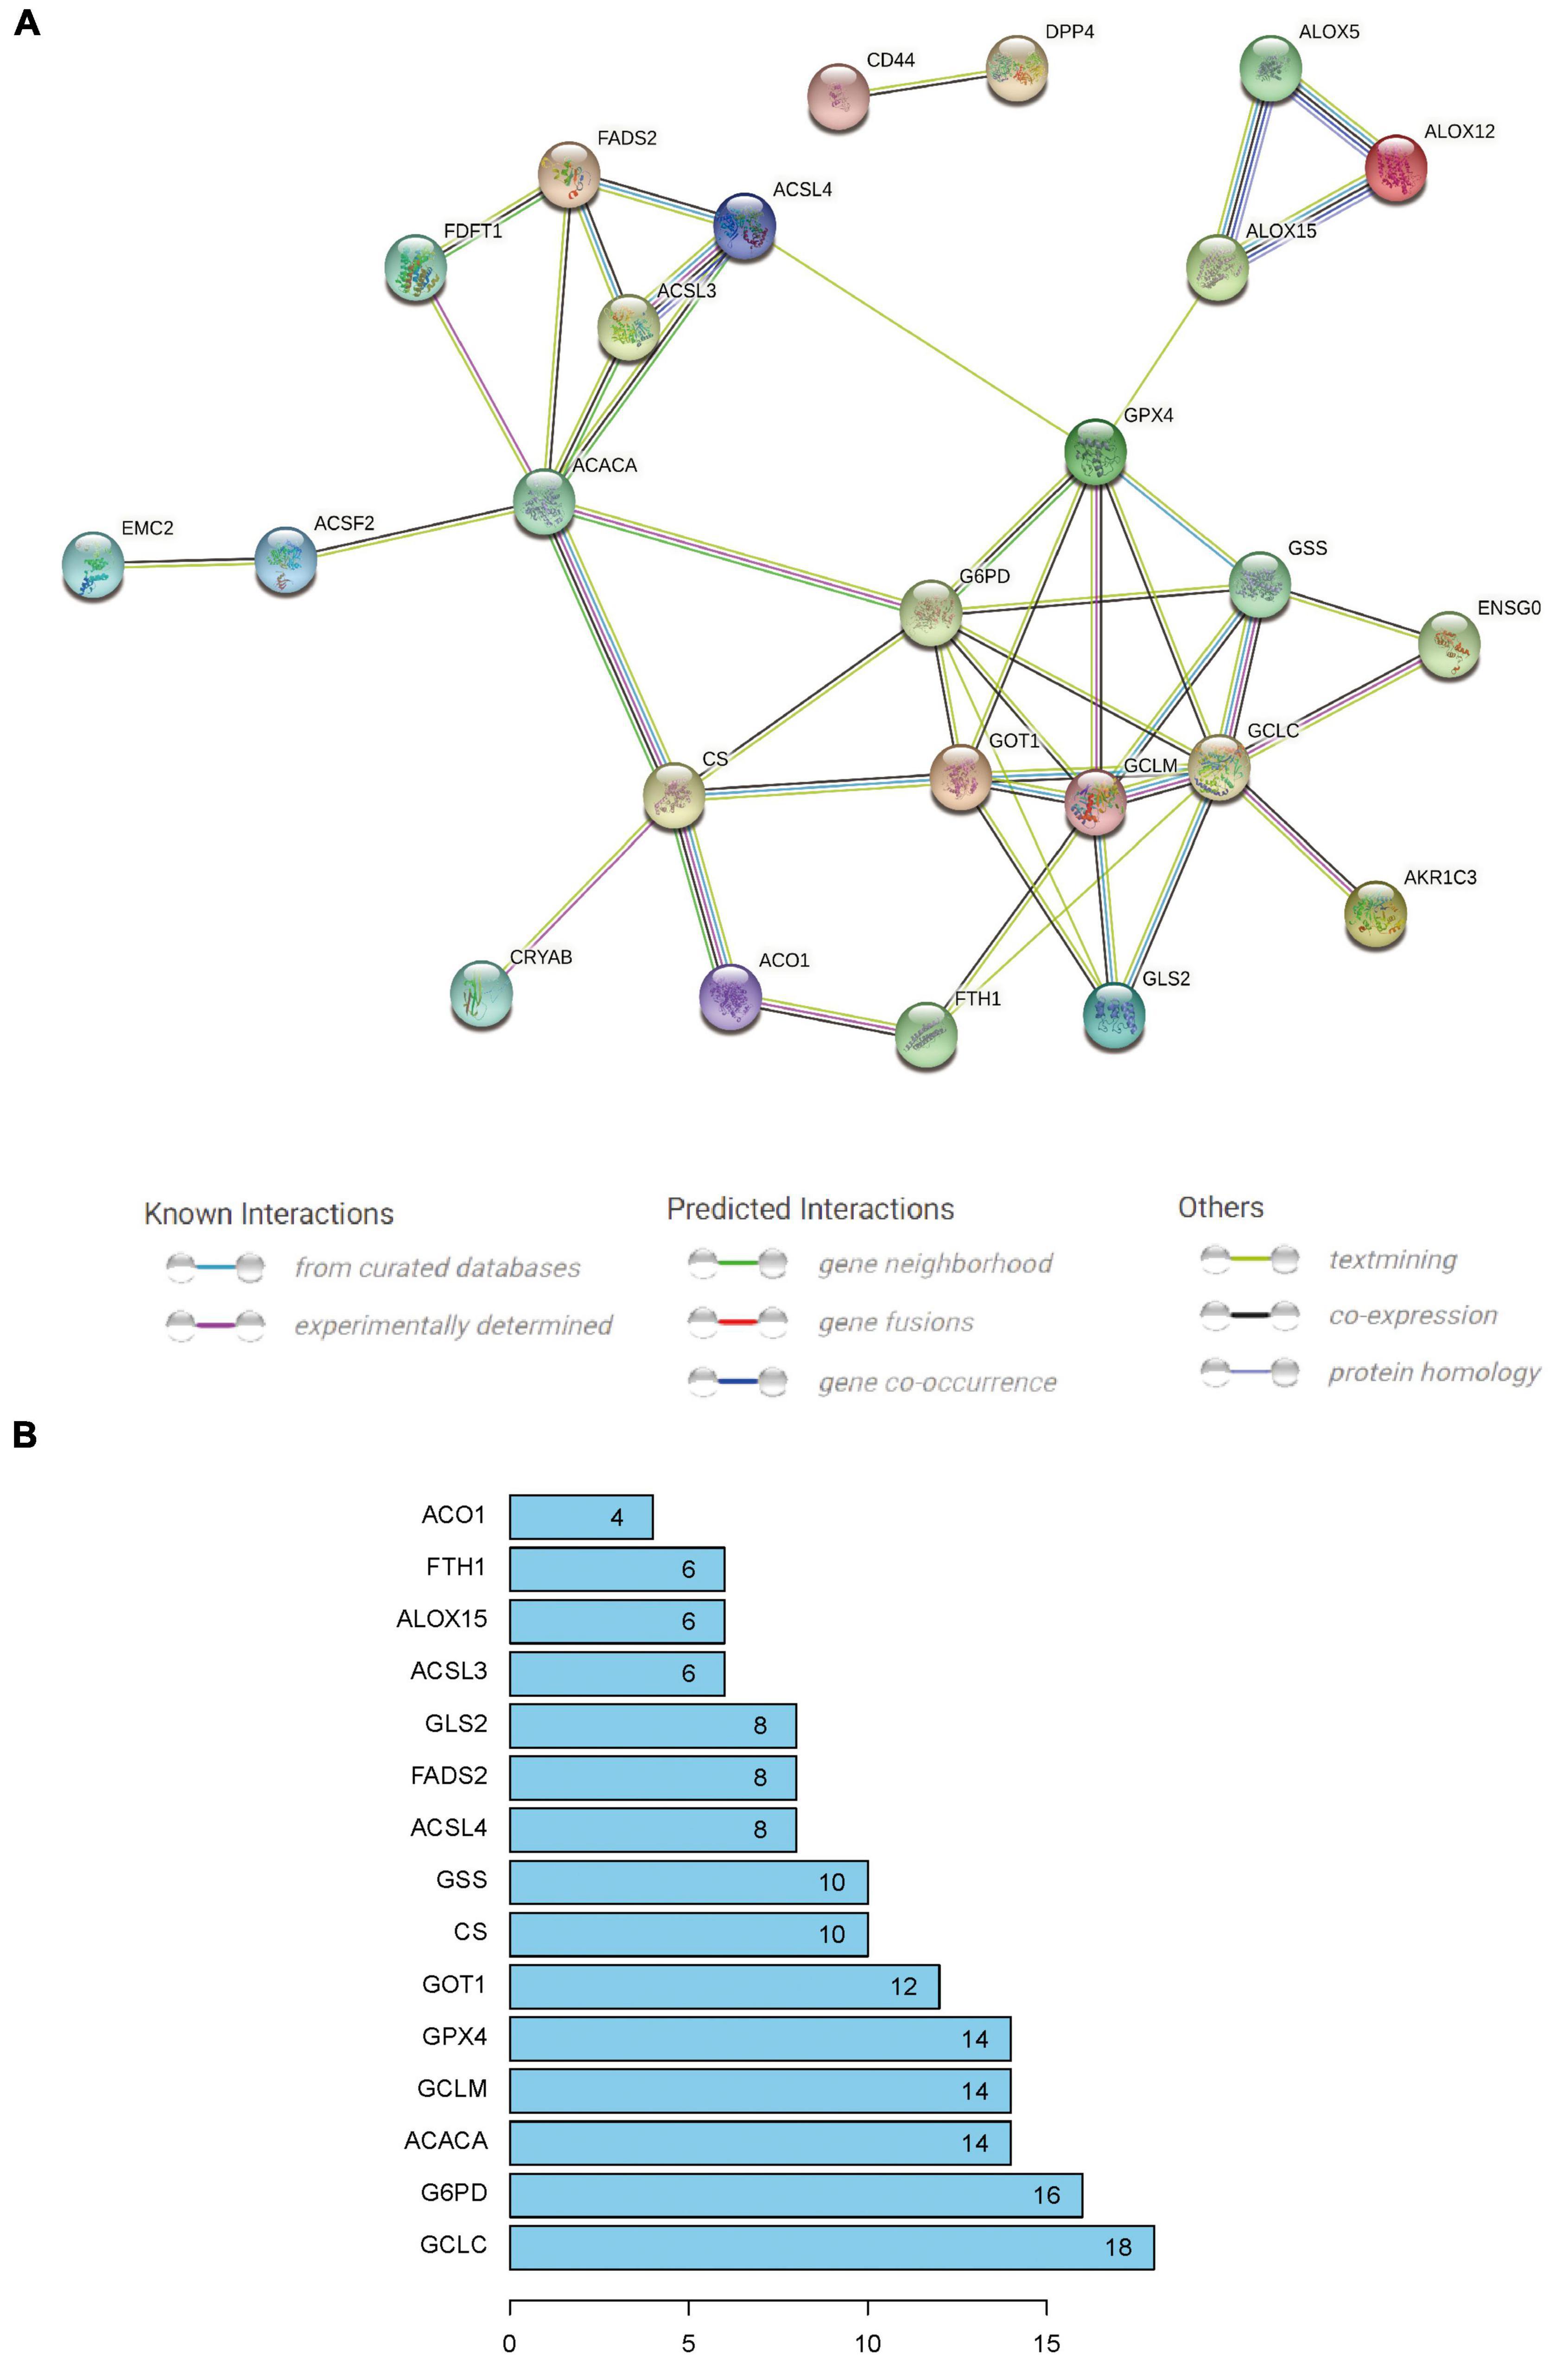
Figure 5. (A) Protein–protein interaction network generated by STRING database analysis indicating direct and indirect associations among 29 crucial FRGs. (B) Fifteen significant nodes of the PPI network were screened using an interaction score > 0.4; these were the most widely connected and are sorted by the number of connected nodes.
We used WGCNA to assess highly connected modules by integrating DGEs of PTSD cases compared to all control individuals. The gene hierarchy clustering plots showed two clusters in PTSD patients and controls by the WGCNA algorithm method (Figure 6A). Outliers in height above 20,000 were removed. When the soft threshold power β was set to 7, the scale-free Topology fitting index R^2 was greater than 0.9 and the mean connectivity was stabilized, indicating a good network connection (Figure 6B). After removing highly similar modules (Figure 7A), 12 gene cluster modules (Figure 7B) were generated as MEcyan (96 genes), MEblack (258 genes), MEblue (1550 genes), MEpurple (173 genes), MEbrown (989 genes), MEsalmon (135 genes), MEgreenyellow (149 genes), MEred (274 genes), MEtan (149 genes), MEmagenta (434 genes), MEyellow (385 genes), and MEgray (770 genes). The spearman’s correlation analysis revealed each module’s correlation coefficient with PTSD. We chose the module with the largest correlation coefficient, MEgreenyellow (correlation coefficient = -0.54, P = 5e-09), as the critical module for further analysis.
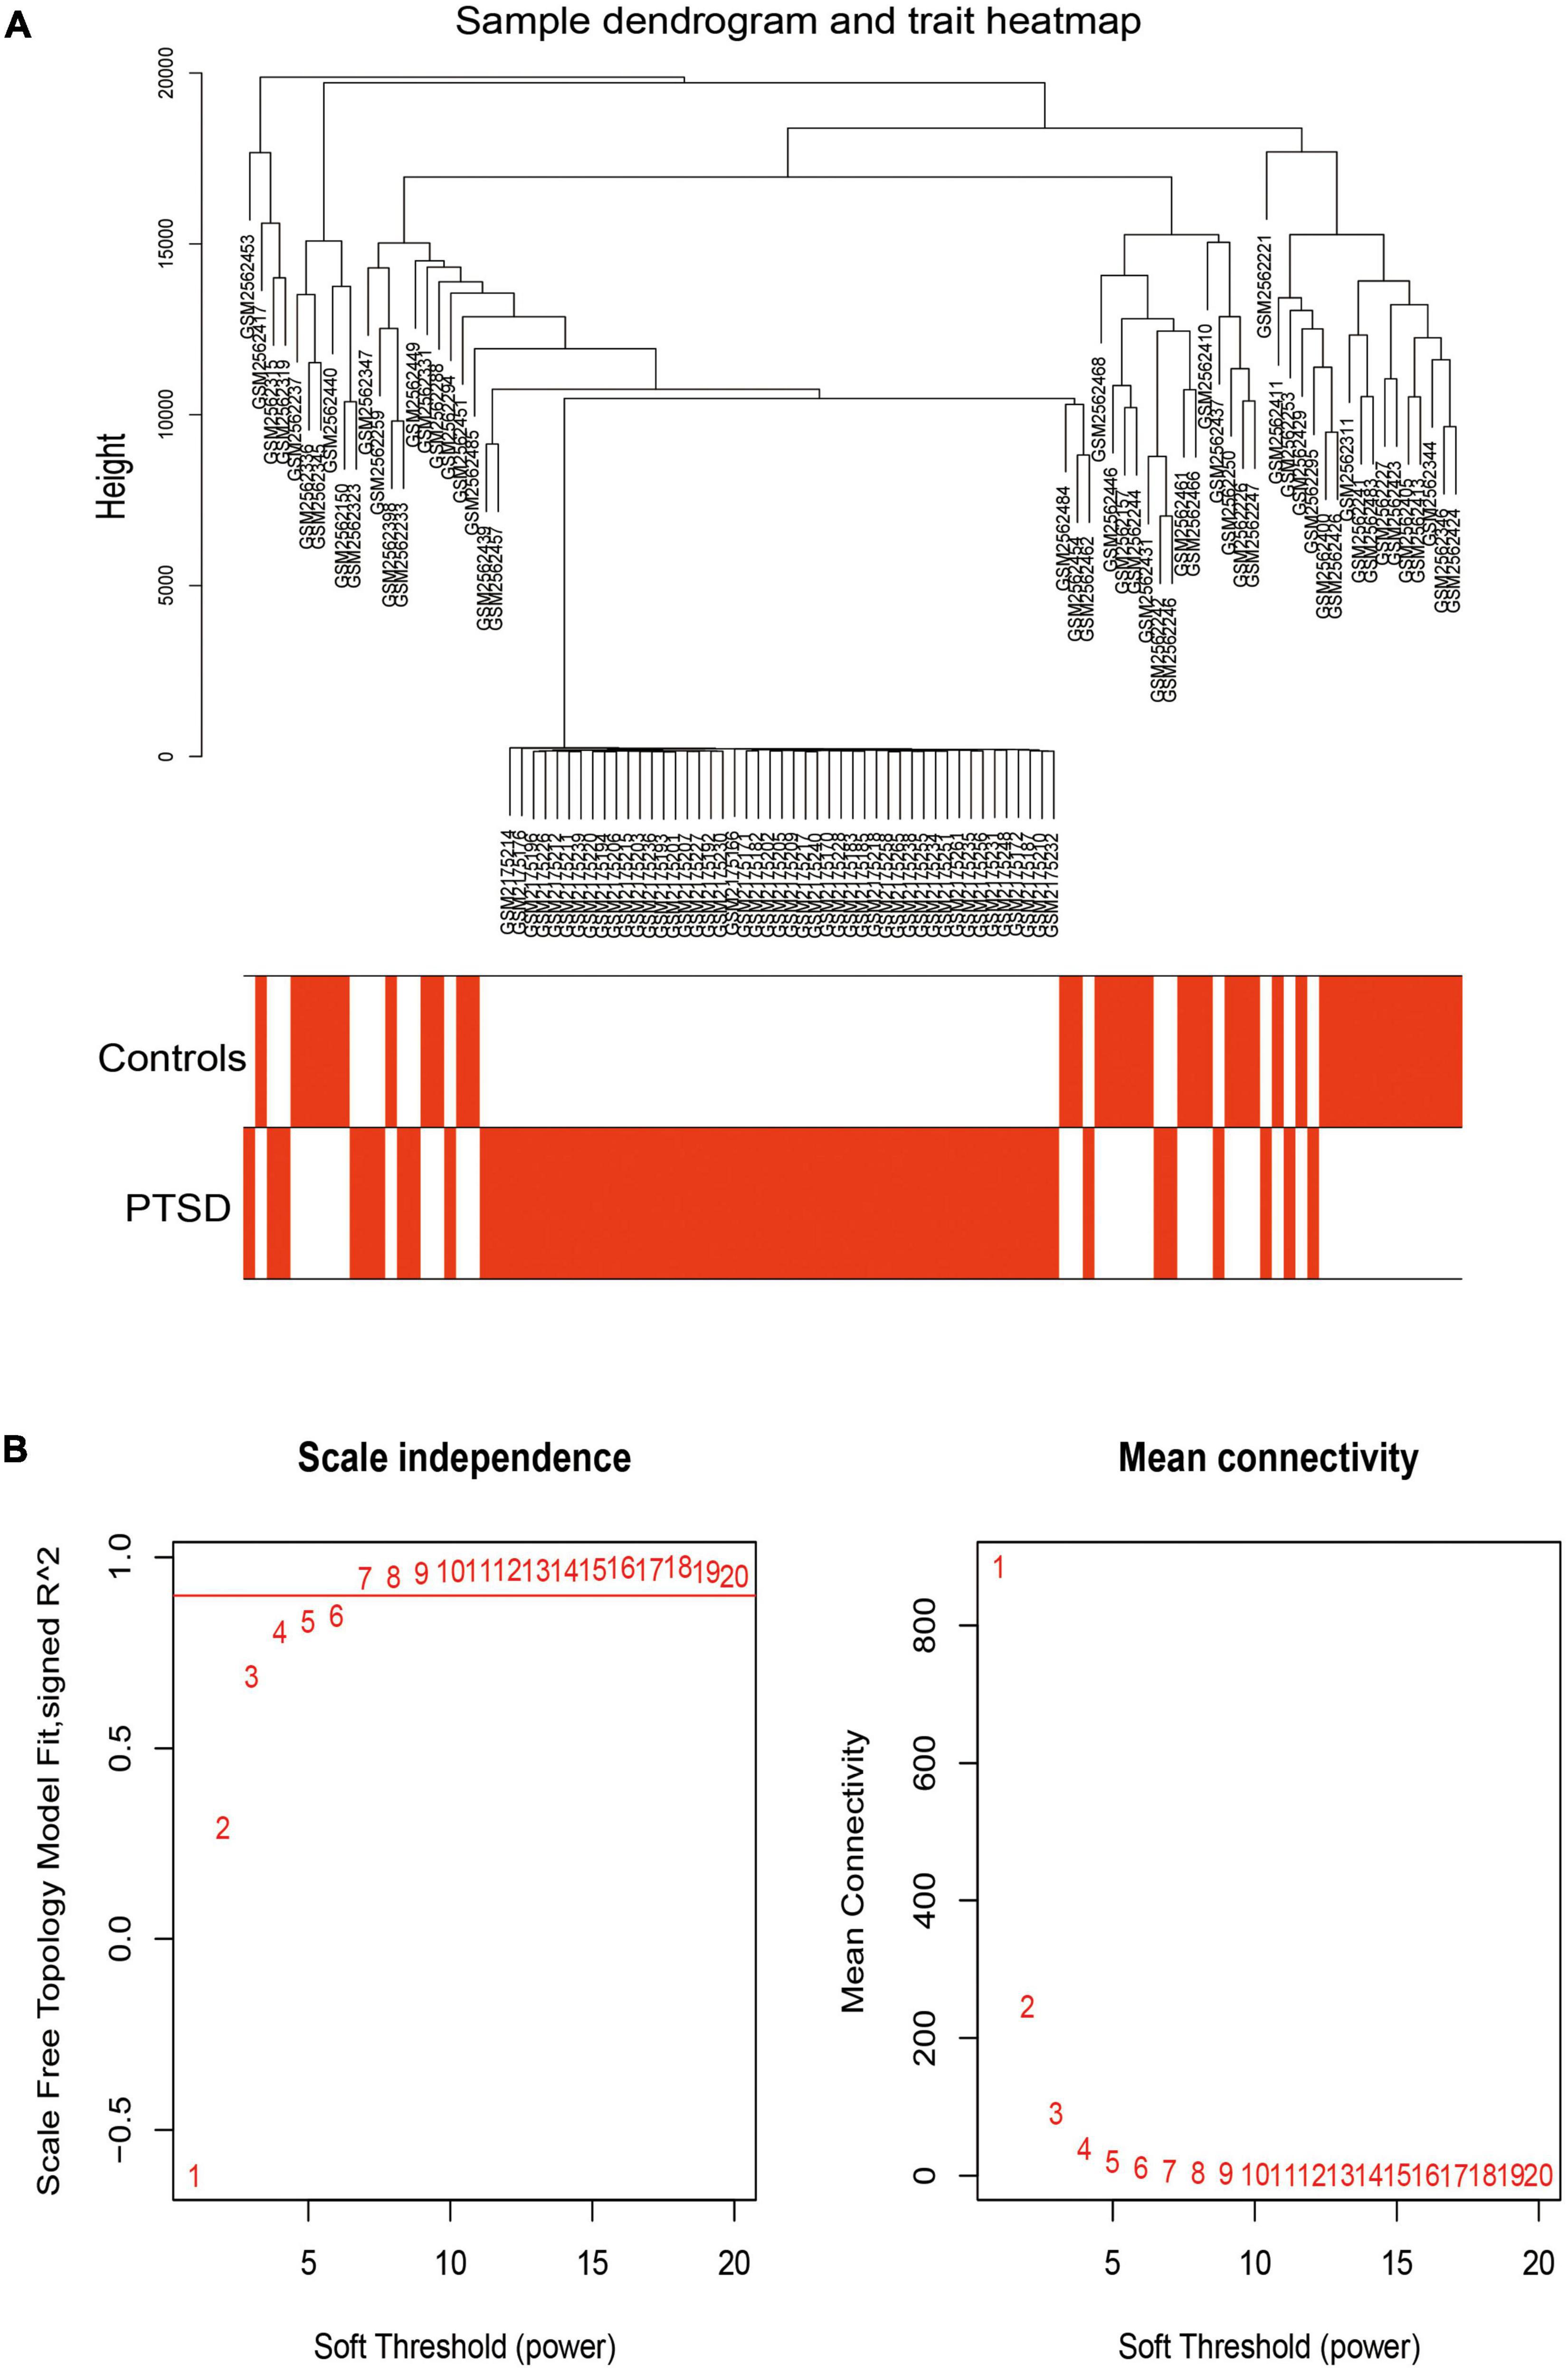
Figure 6. (A) The gene hierarchy clustering plots showed that all samples were divided into two clusters (in the red and white plot) with the WGCNA algorithm method. (B) A scale-free network distribution was with stable average connectivity when the soft threshold power β was set to 7.
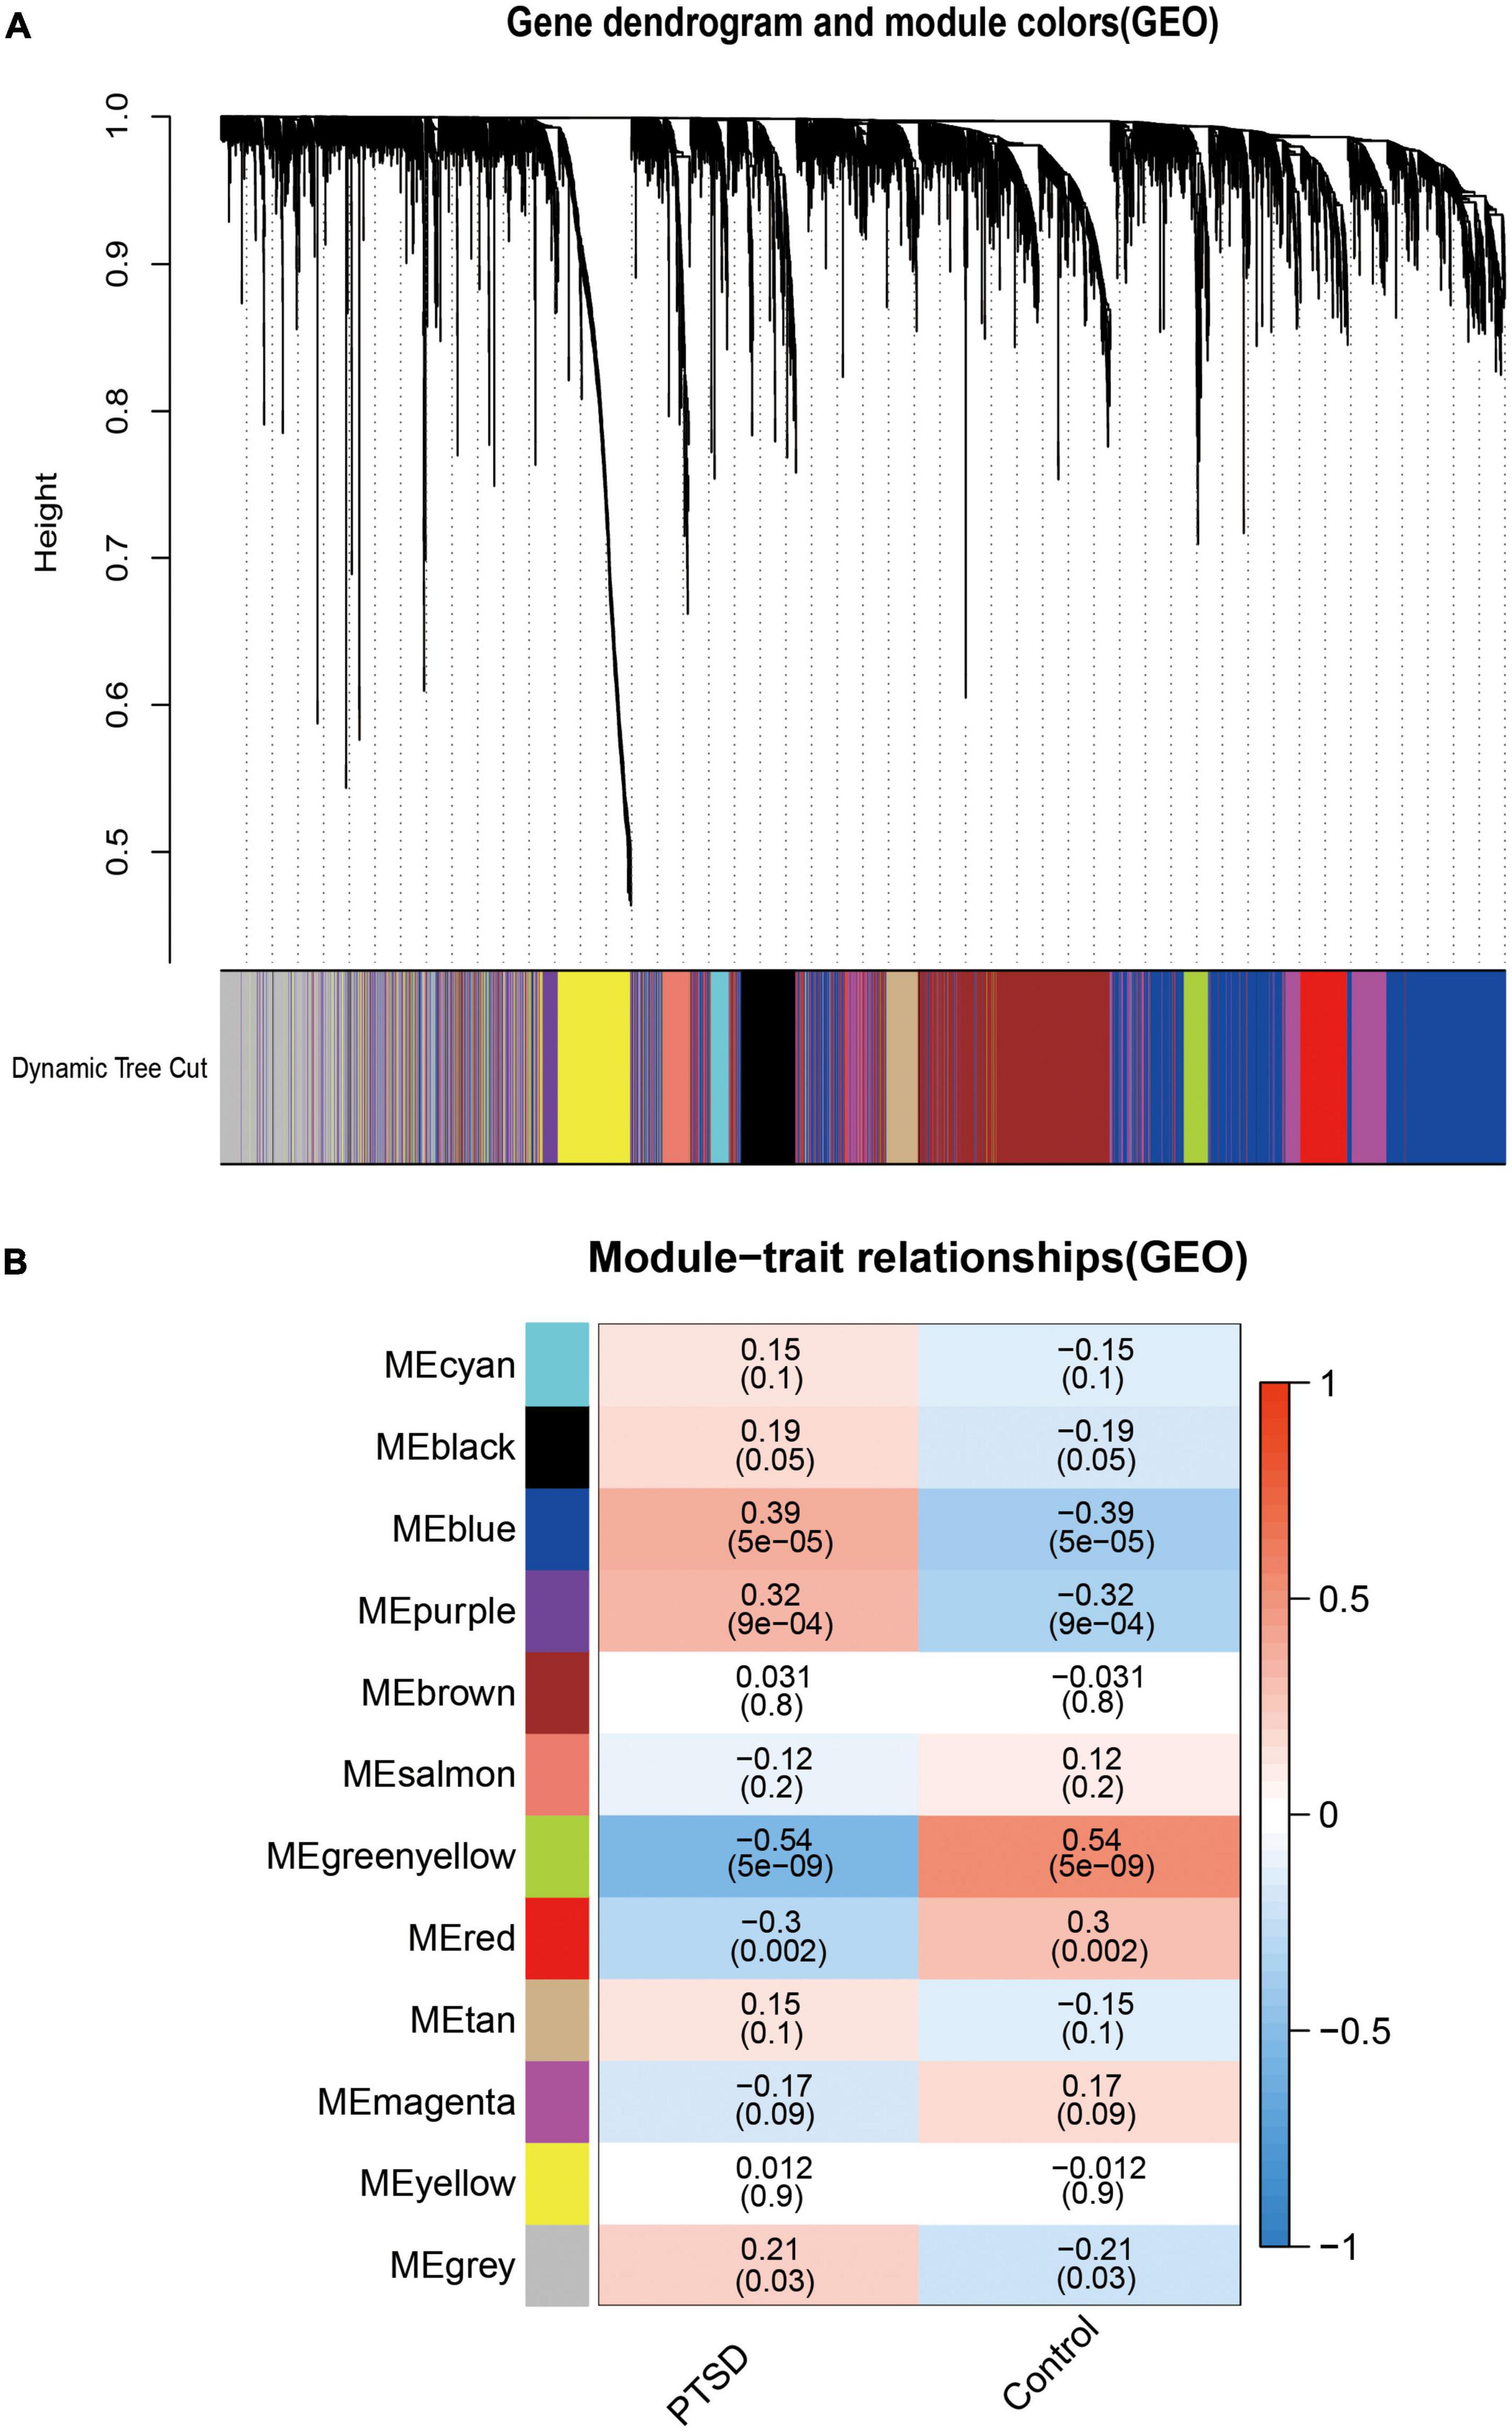
Figure 7. (A) Through the hierarchical clustering method, similar modules were clustered in 12 module eigengenes (MEs), which summarized all gene expression patterns into a specific module. (B) Spearman’s correlation analysis between the MEs and PTSD indicated that the most relevant object module was MEgreenyellow (correlation coefficient = −0.54, P = 5e-09).
The GO enrichment and KEGG pathway analyses were performed again for the 149 MEgreenyellow genes (Figures 8, 9). For GO analysis, these genes aggregated in multiple immune-related responses, such as cellular response to interferon-gamma, negative regulation of T cell receptor signaling pathway, and IgG binding. It is worth noting that the 149 MEgreenyellow genes were also enriched in ferroptosis in the KEGG pathway and were involved in some similar metabolic pathways, including long-chain fatty acid-CoA ligase activity and fatty acid biosynthesis.
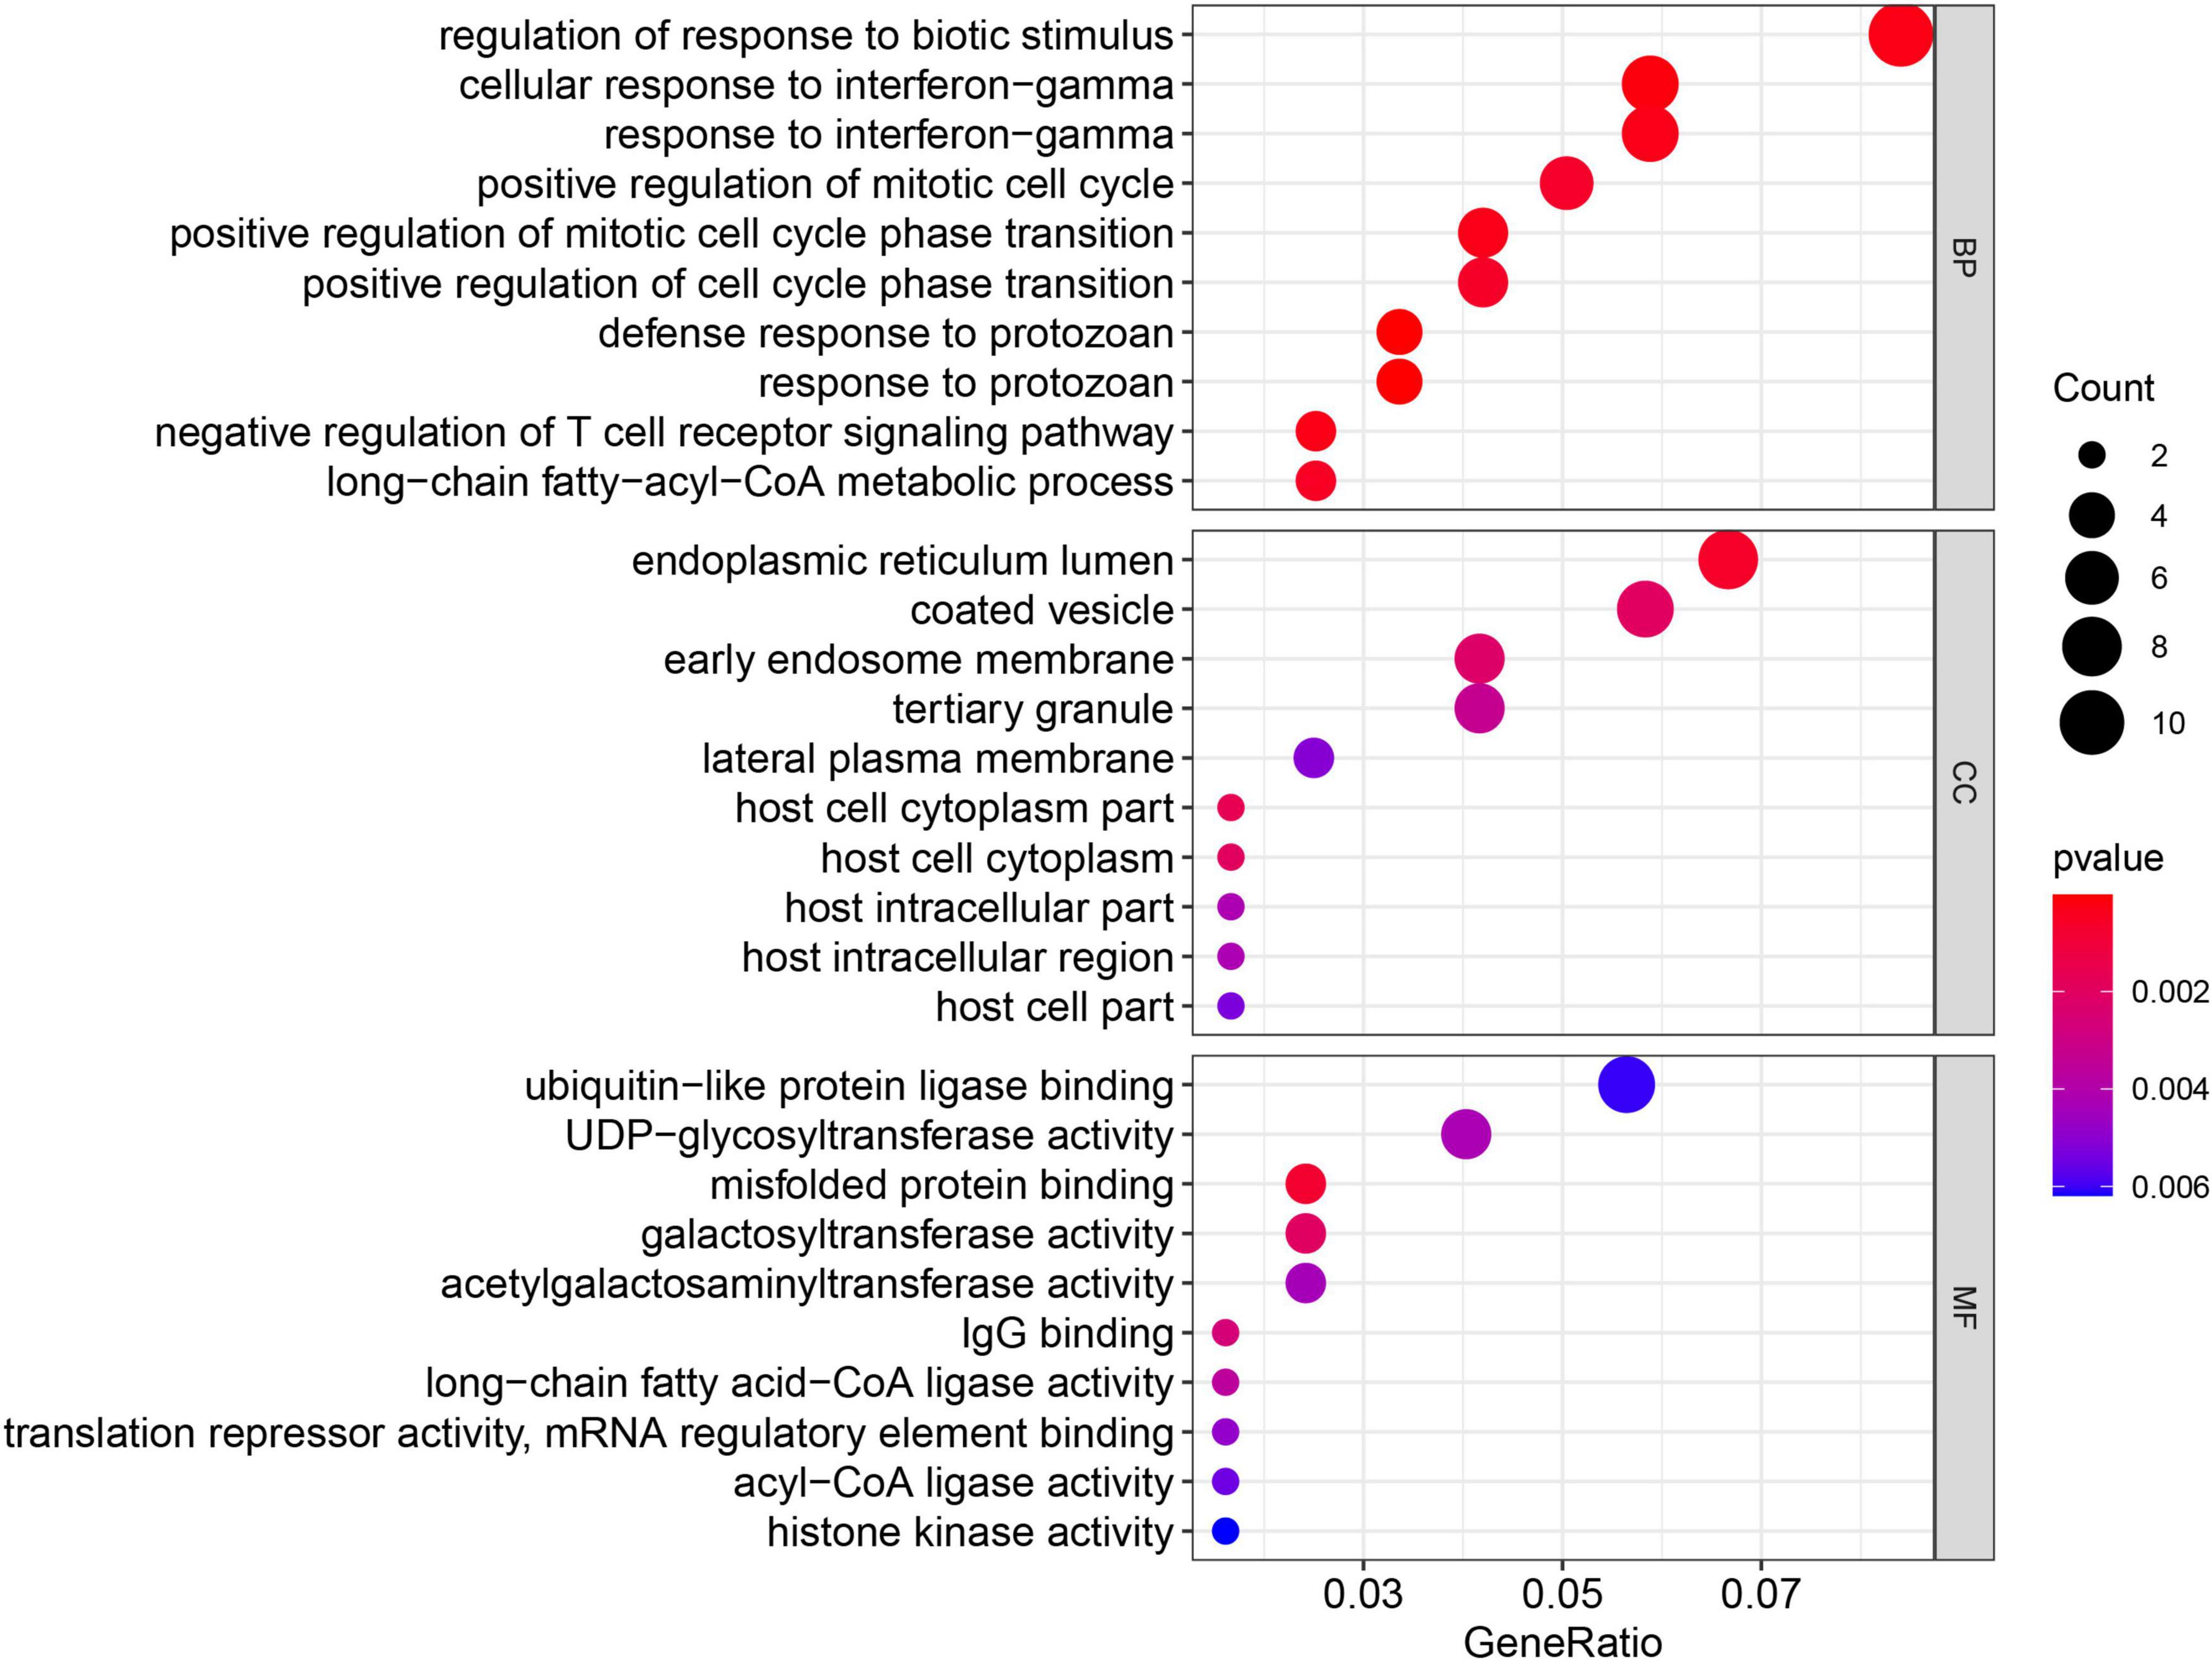
Figure 8. Gene Ontology enrichment of 149 MEgreenyellow genes. The count shows the number of genes enriched in the pathway. Gene ratio: the ratio of the gene number in this term to the total number of the MEgreenyellow module.
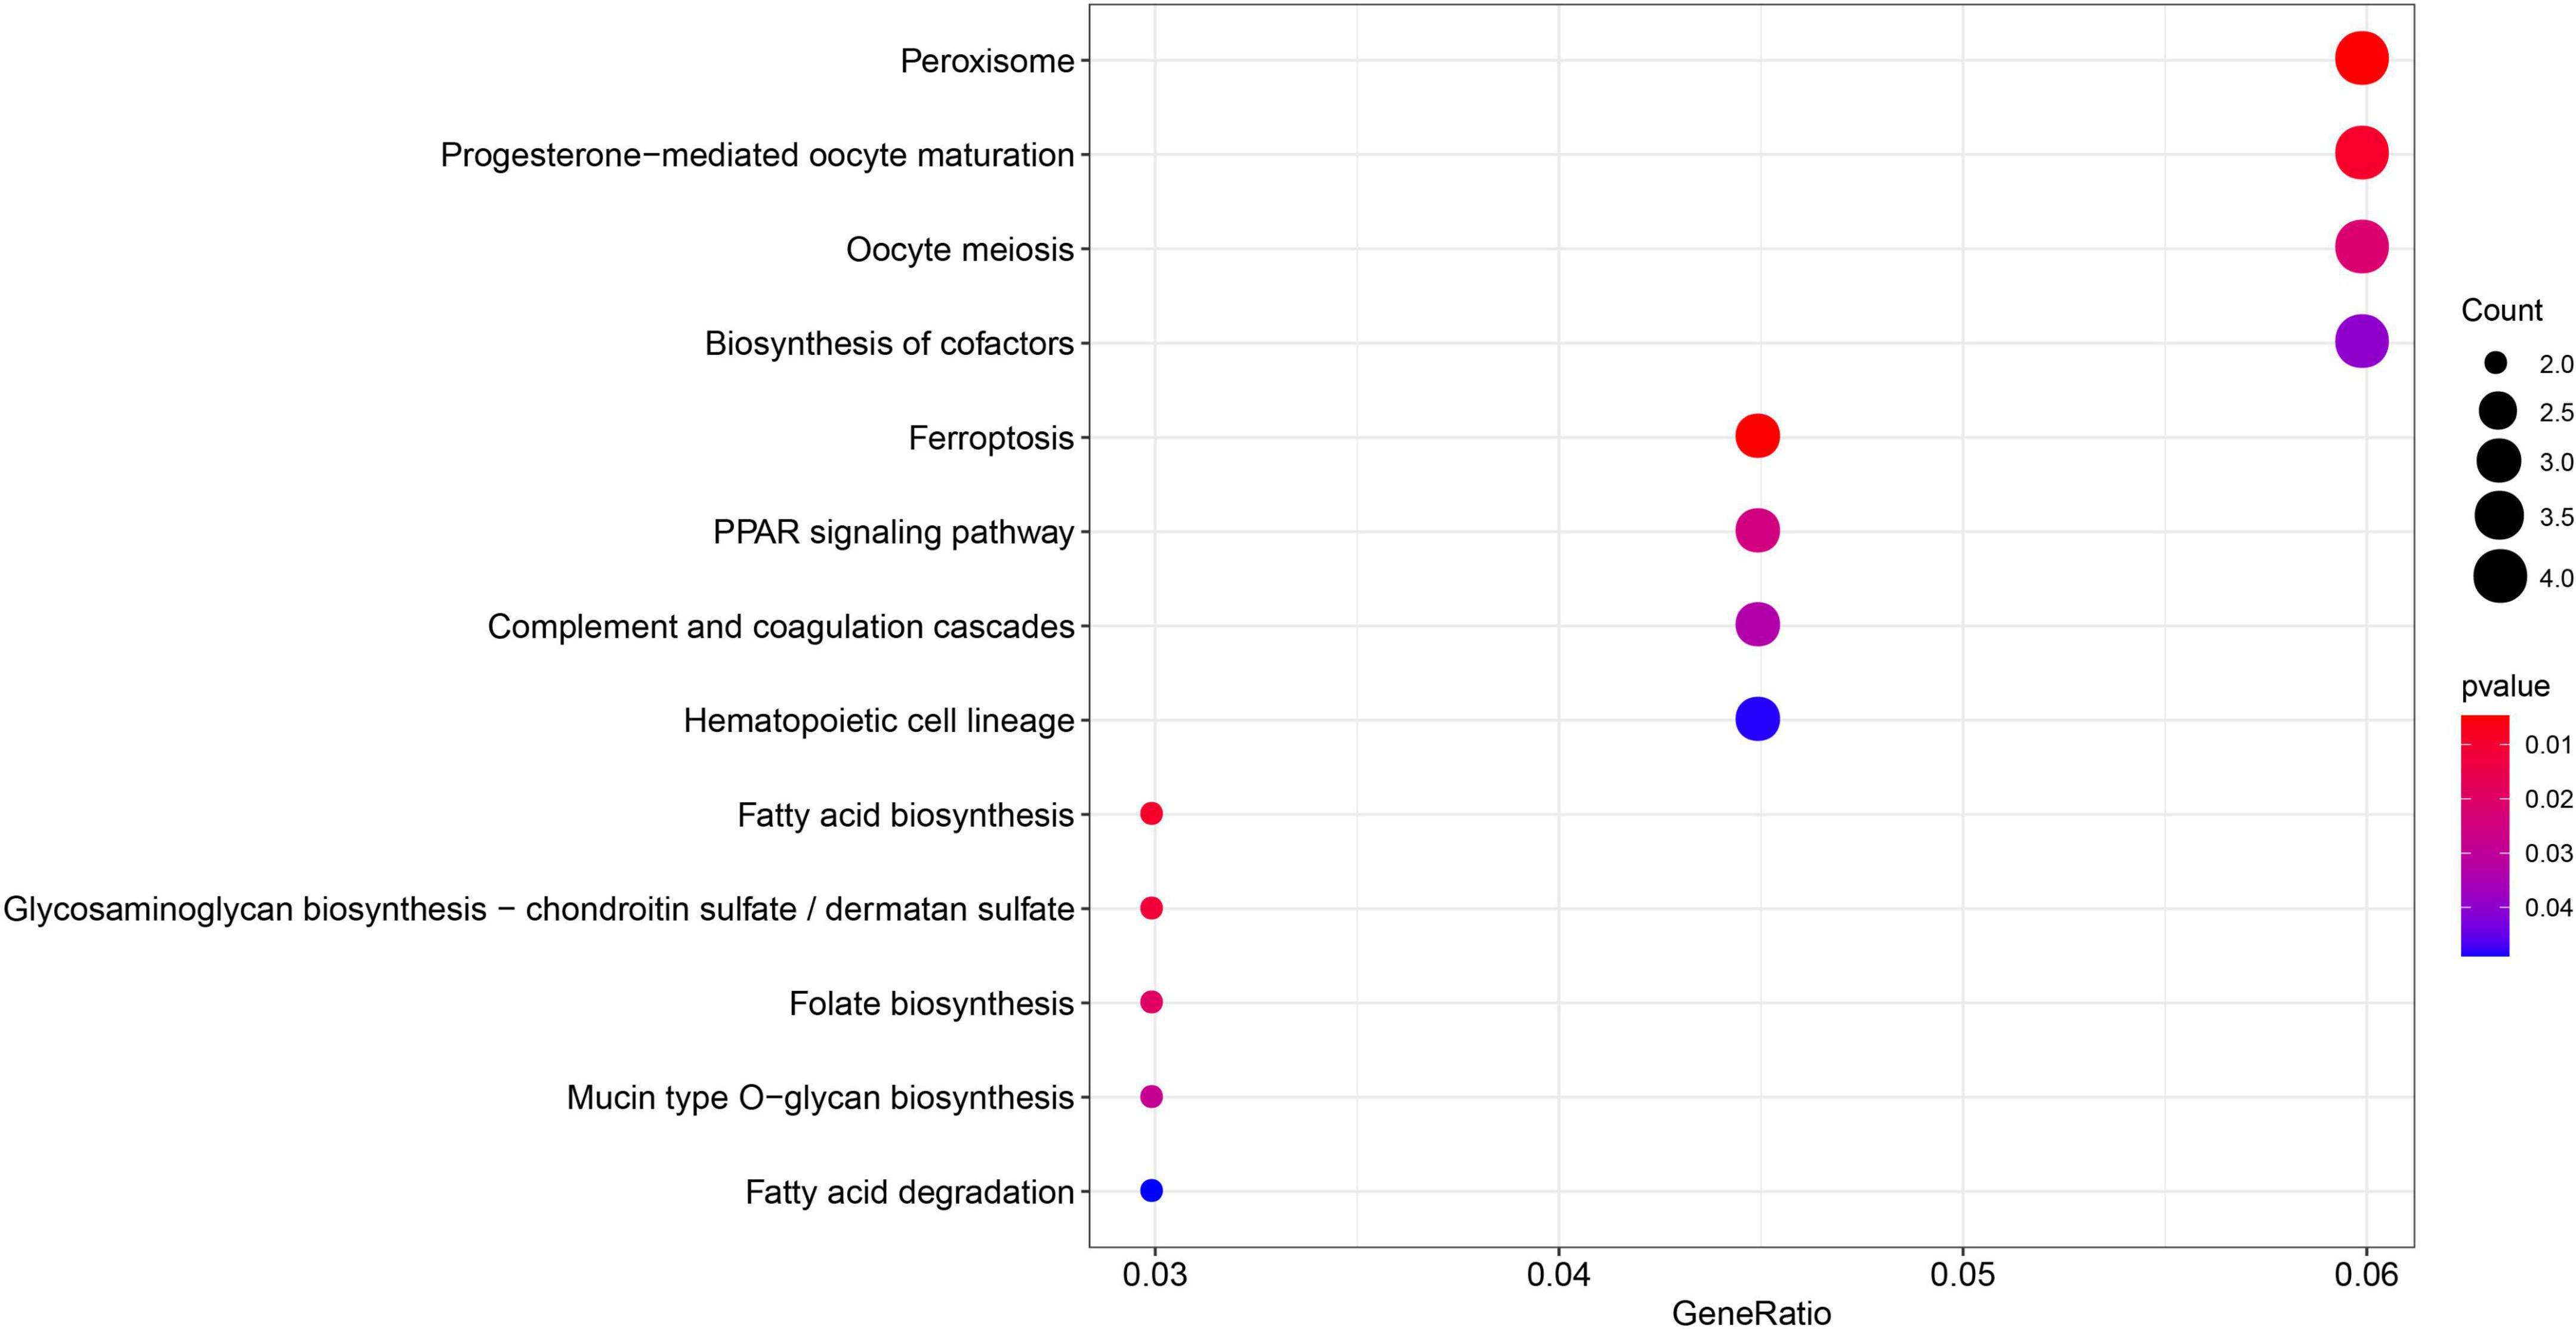
Figure 9. Kyoto encyclopedia of genes and genomes enrichment of 149 MEgreenyellow genes. The count shows the number of genes enriched in the pathway. Gene ratio: the ratio of the gene number in this term to the total number of the MEgreenyellow module.
Table 2 shows parameter ranges and optimized values for the XGBoost model. Accordingly, we obtained the optimal feature subset and the hyperparameter combination that provided the highest AUC. In the learning curve, the optimal model satisfied both the accuracy of the training set and the validation set at the same time (Figure 10B). Based on the rank order of each feature in the XGBoost model, the top 20 key genes were retained (Figure 10A).
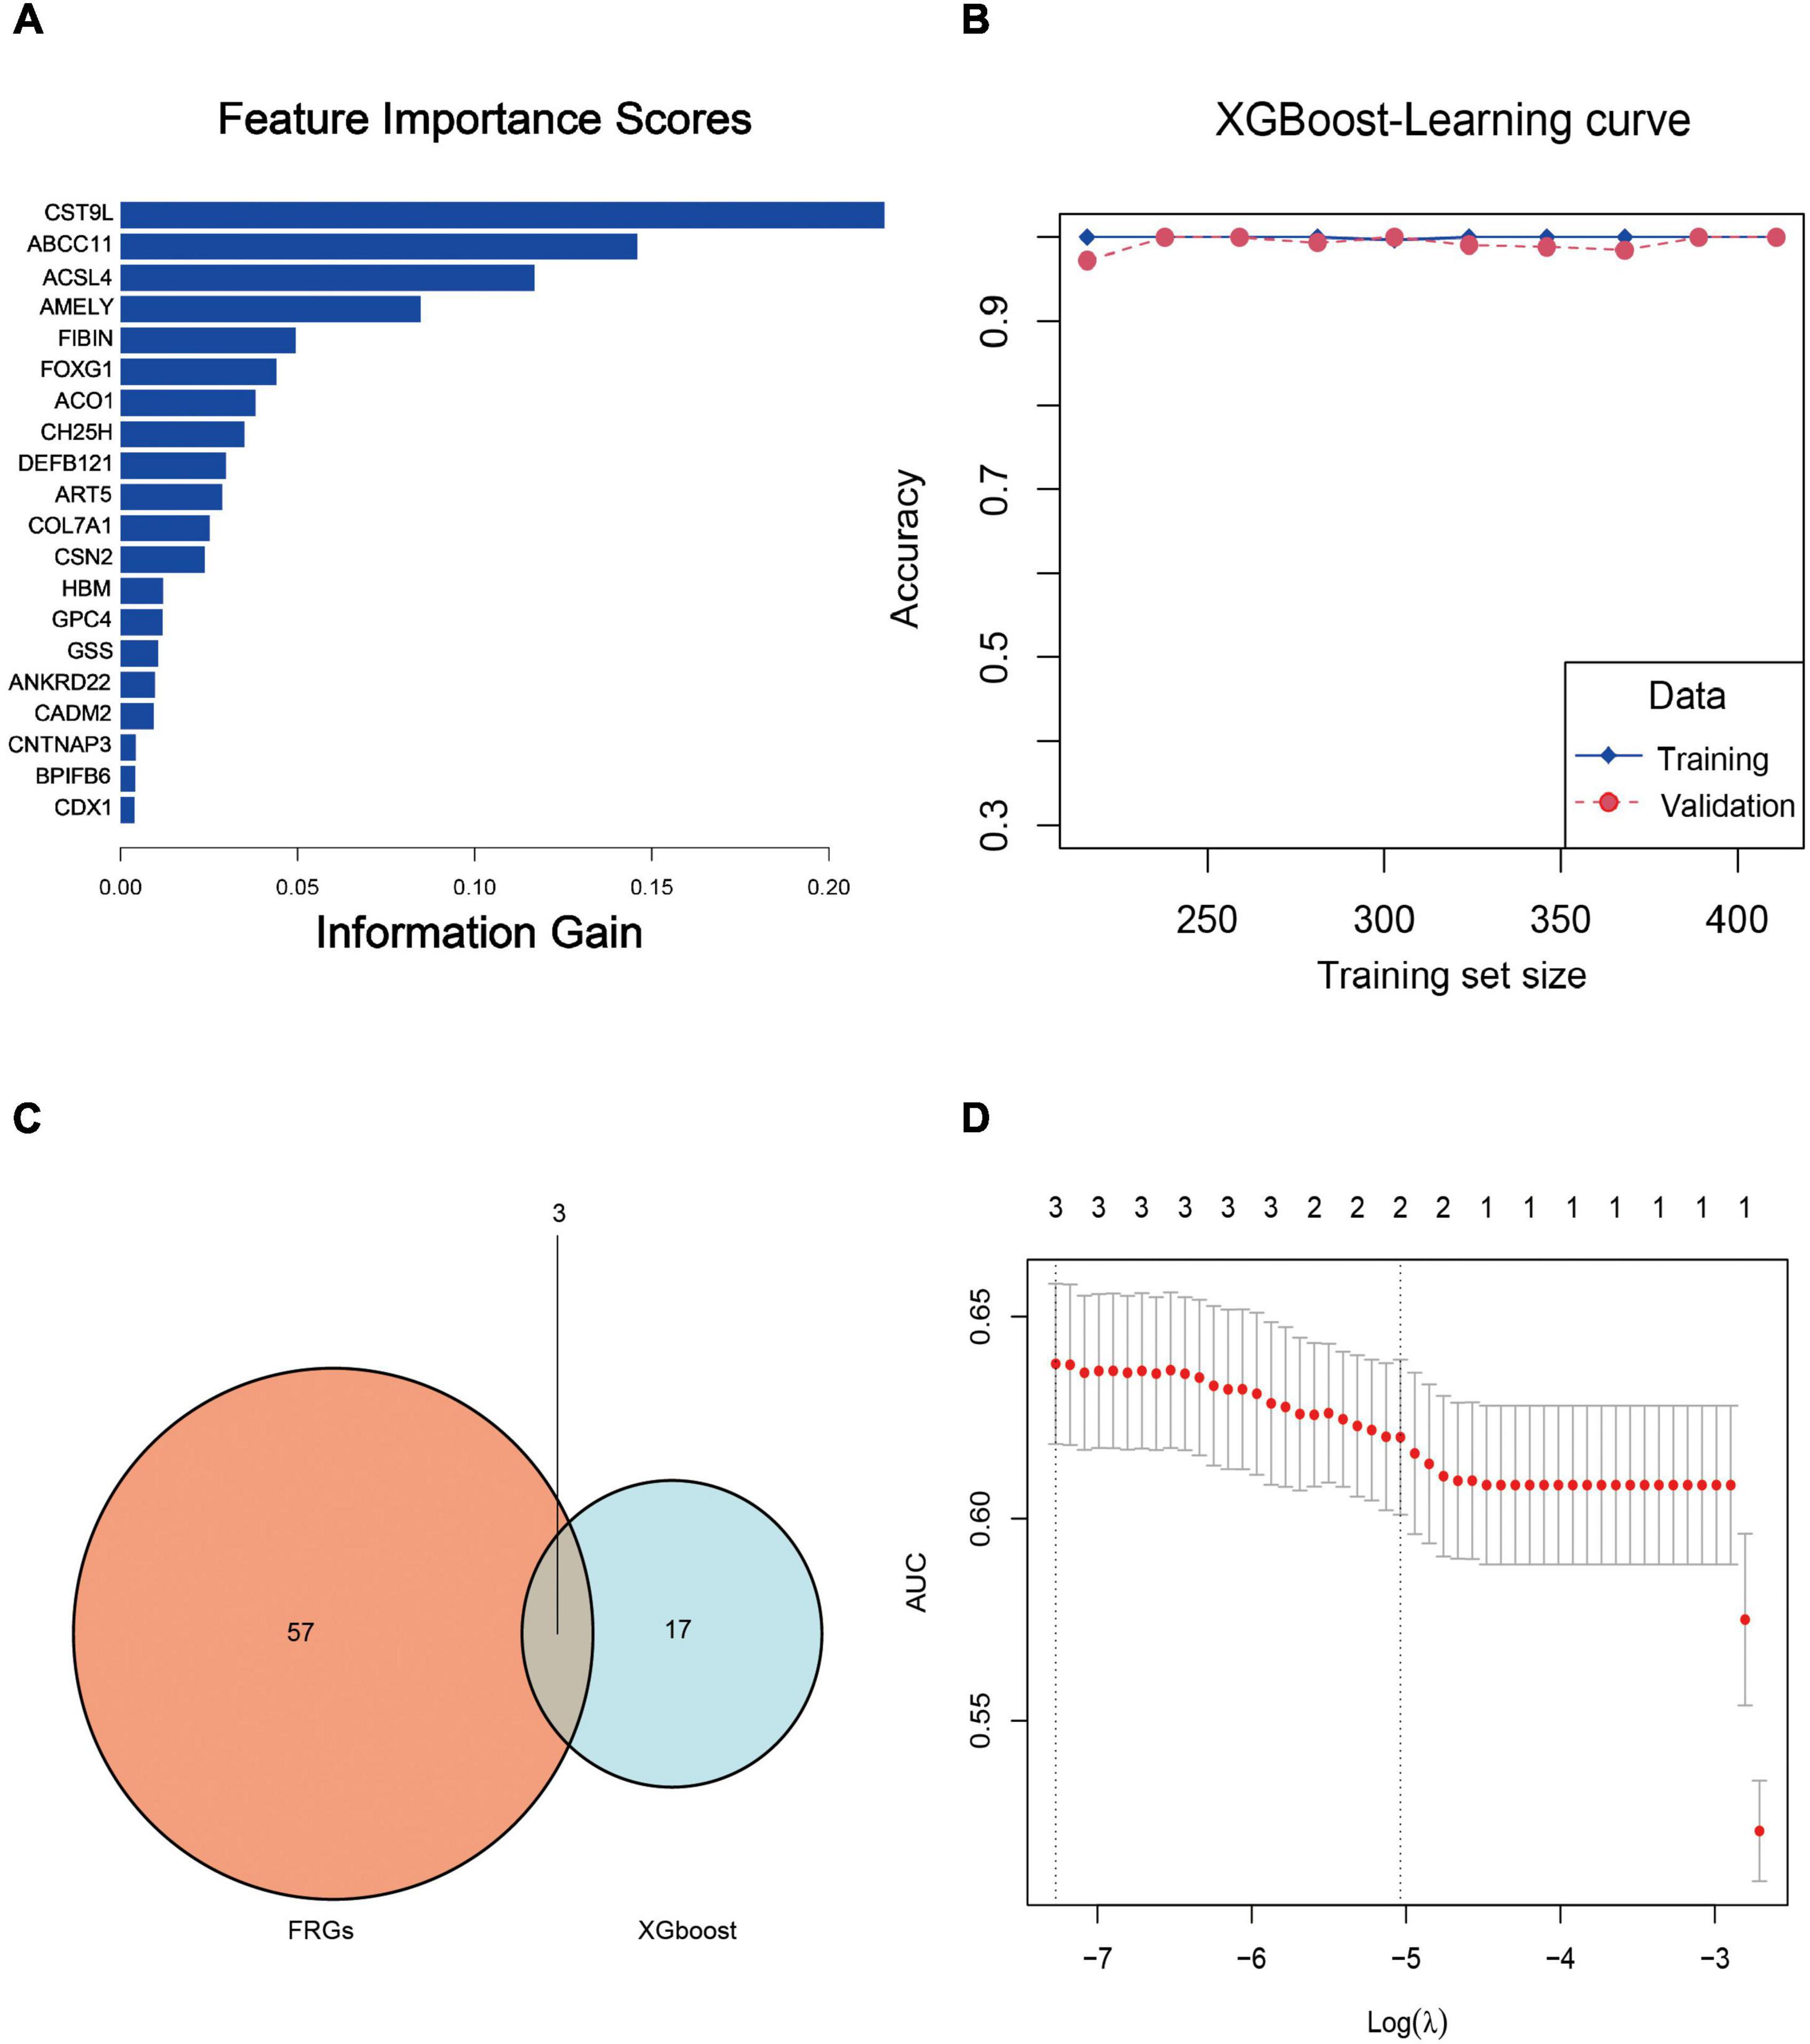
Figure 10. (A) Feature importance rankings for the top 20 genes identified by the XGBoost model. (B) Accuracy rates in the training and validating processes upon the learning curve. (C) Venn diagram of the top 20 genes and FRGs. After cross-matching 20 XGBoost genes and 60 FRGs, we identified three crucial FRGs related to PTSD development, which were ACSL4, ACO1, and GSS. (D) LASSO coefficient profile plot of the three crucial FRGs plotted against the log (lambda) sequence.
After cross-matching 60 FRGs and 20 key genes, we identified three crucial FRGs related to PTSD development: ACSL4, ACO1, and GSS (Figure 10C). They were also significant nodes of our PPI network. t-Tests showed that all three genes were down-expressed in the training datasets and the validation datasets (Figures 11A–F) compared with control individuals. The LASSO model of PTSD was constructed using the three intersecting genes. As shown in Figure 10D, the optimal value of λ was set when a 3-FRG signature was generated as follows: estimation score = ACSL4 × 0.000296 + ACO1 × –0.001032 + GSS × 0.001216. The PTSD group received a higher score than the control group (P < 0.001). ROC curves evaluated the estimation score’s predictive performance for PTSD, and the AUC reached 0.769 in the training datasets and 0.922 in the validation datasets (Figures 11G,H).
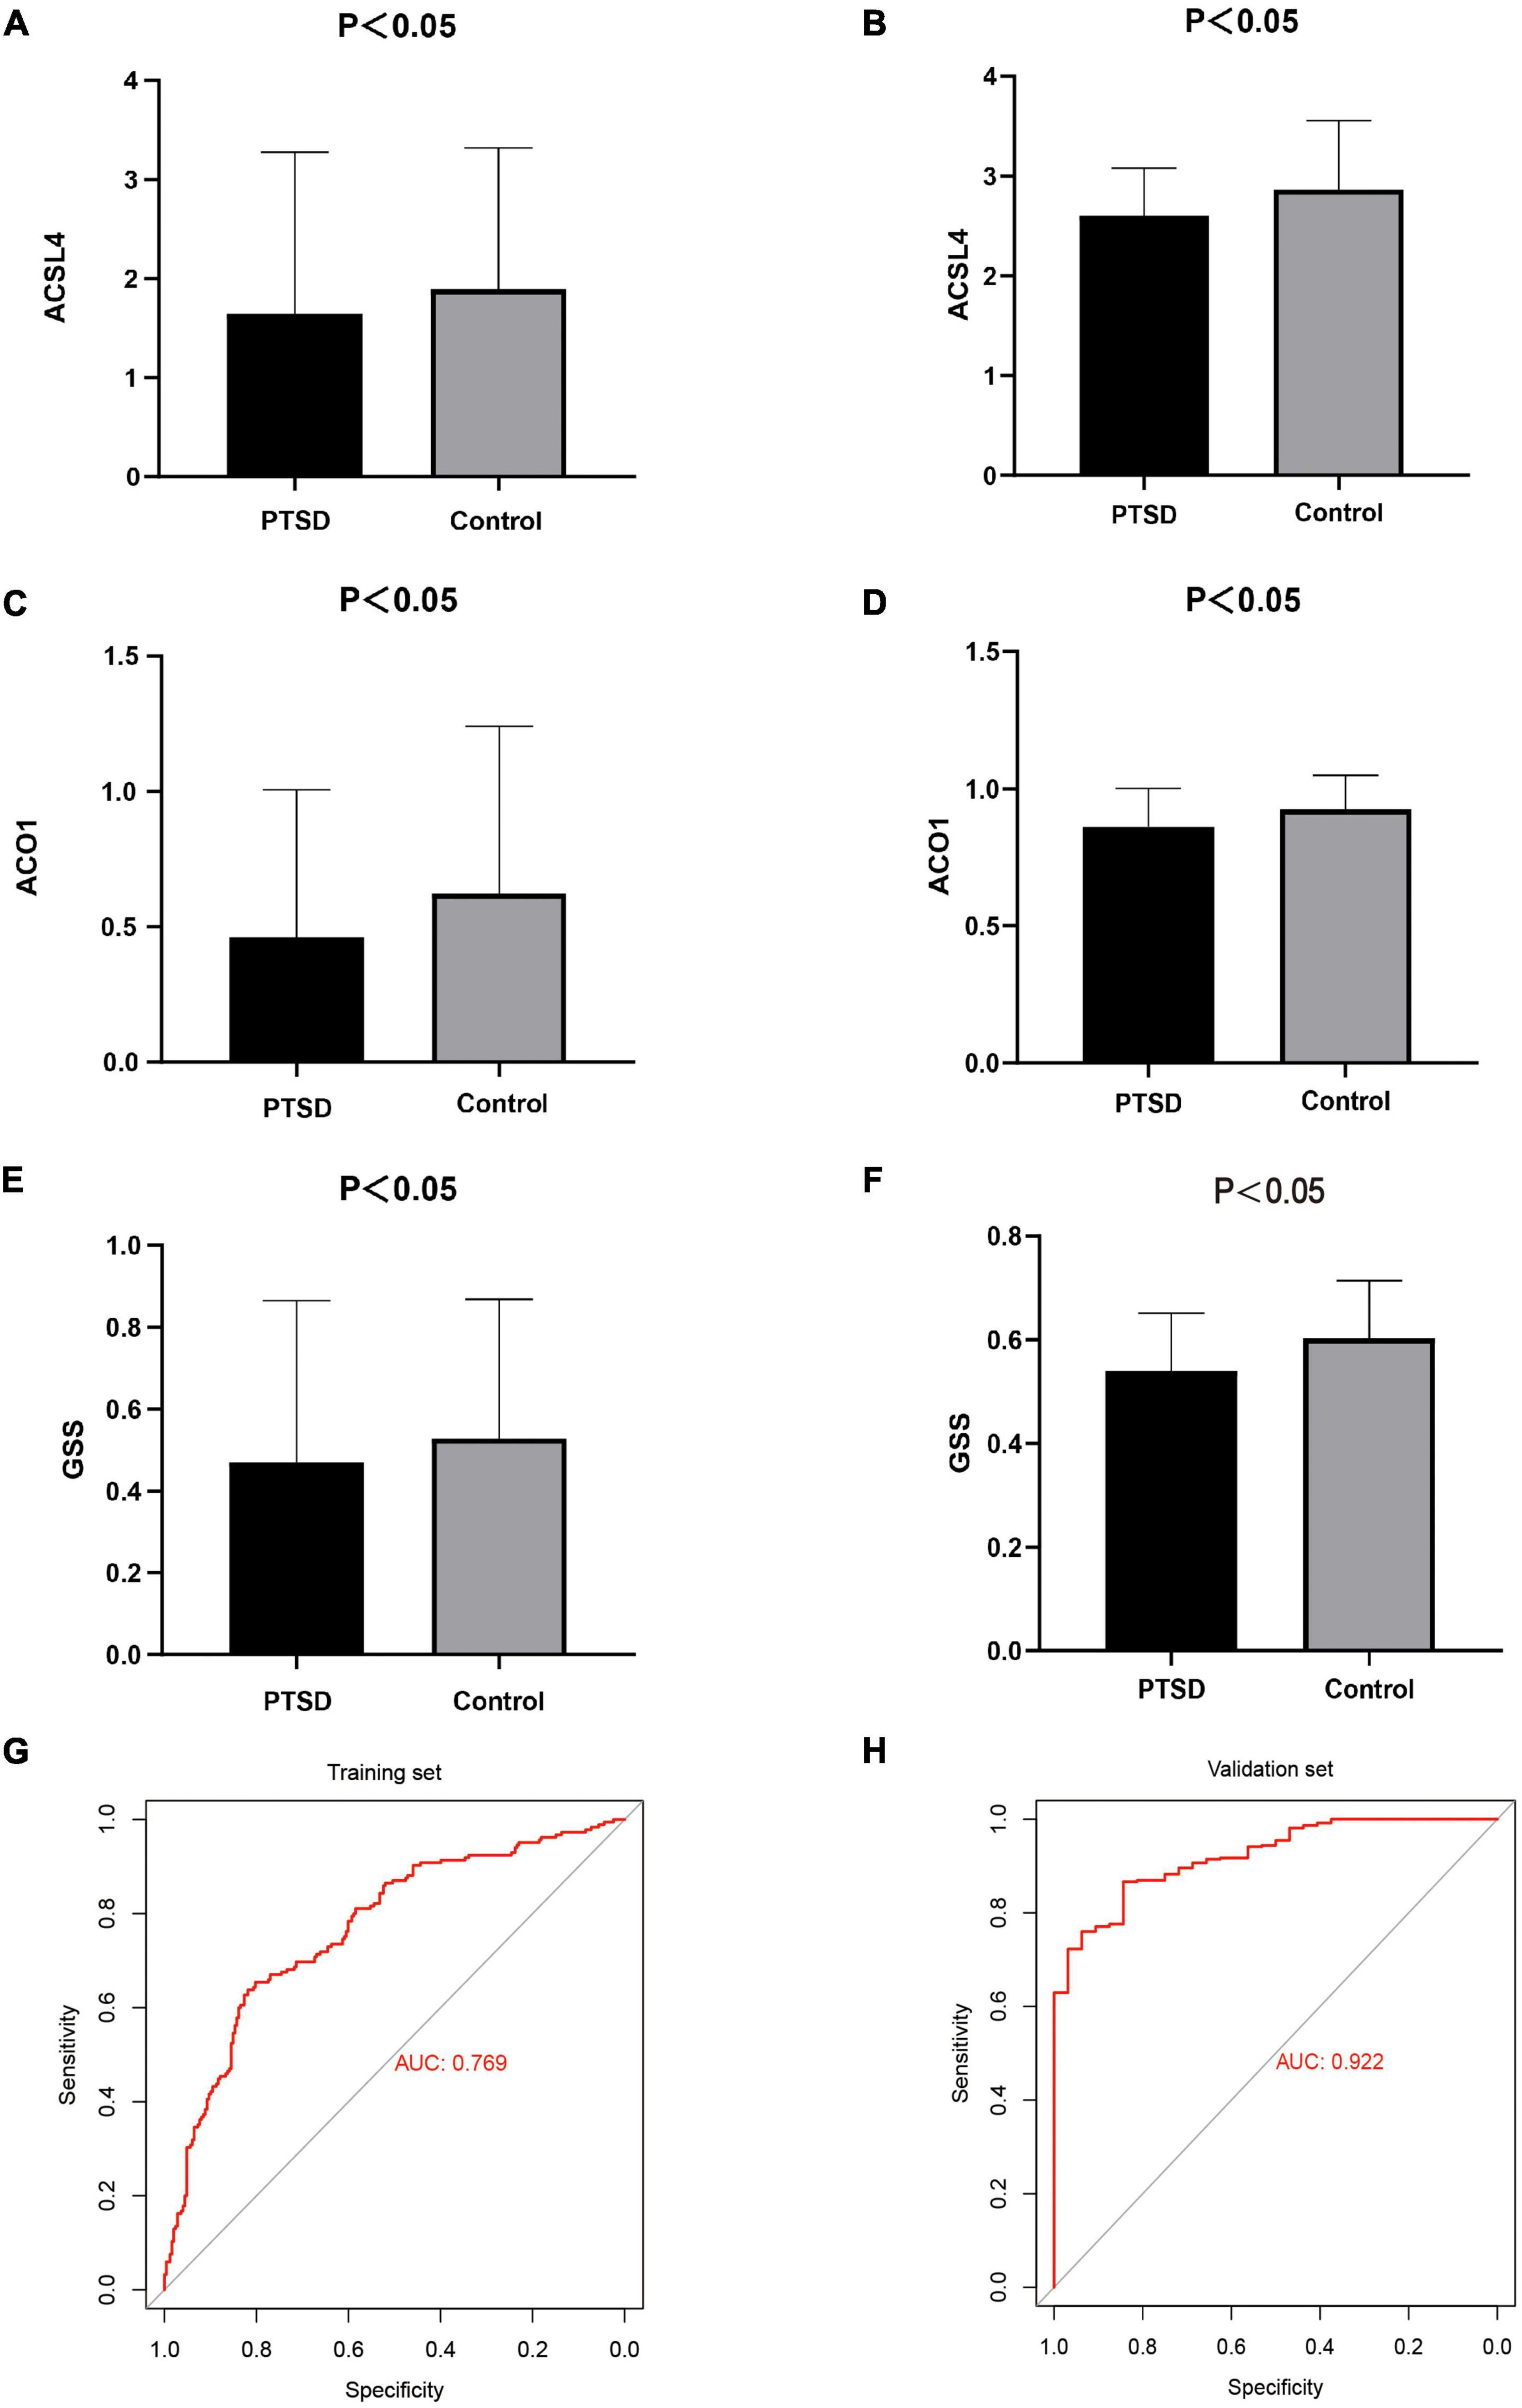
Figure 11. (A,B) t-Tests found that ACSL4 was down-expressed in the training datasets and the validation datasets. (C,D) ACO1 was down-expressed in the training datasets and the validation datasets. (E,F) GSS was down-expressed in the training datasets and the validation datasets. (G,H) The AUC of ROC curves reached 0.769 and 0.922 in the training datasets and the validation datasets, indicating the LASSO model has good diagnostic accuracy.
We quantified the ssGSEA enrichment scores of each sample and took the median value of the estimation score as the threshold to divide the high and low-risk groups. As shown in Figure 12A, elements related to antigen presentation process contents such as aDCs (activated dendritic cells), B cells, and DCs (dendritic cells) were significantly up-regulated in the high-risk group. Elements related to cellular immunity, such as neutrophils, T helper cells, NK cells, Tfh (follicular helper T cells), Th2 Cells, TIL (tumor-infiltrating lymphocytes), and Tregs (regulatory T cells), were up-regulated in the high-risk group. The antigen presentation process includes APC (antigen-presenting cell) co-inhibition, CCR (CC chemokine receptor), Check-point, Cytolytic activity, HLA (human leukocyte antigen), T cell co-inhibition, T cell co-stimulation, and Type II IFN Response were also up-regulated in the high-risk group (Figure 12B). The high-risk group showed elevated levels in cellular immunity and antigen presentation function, which may be associated with disturbances in ferroptosis.
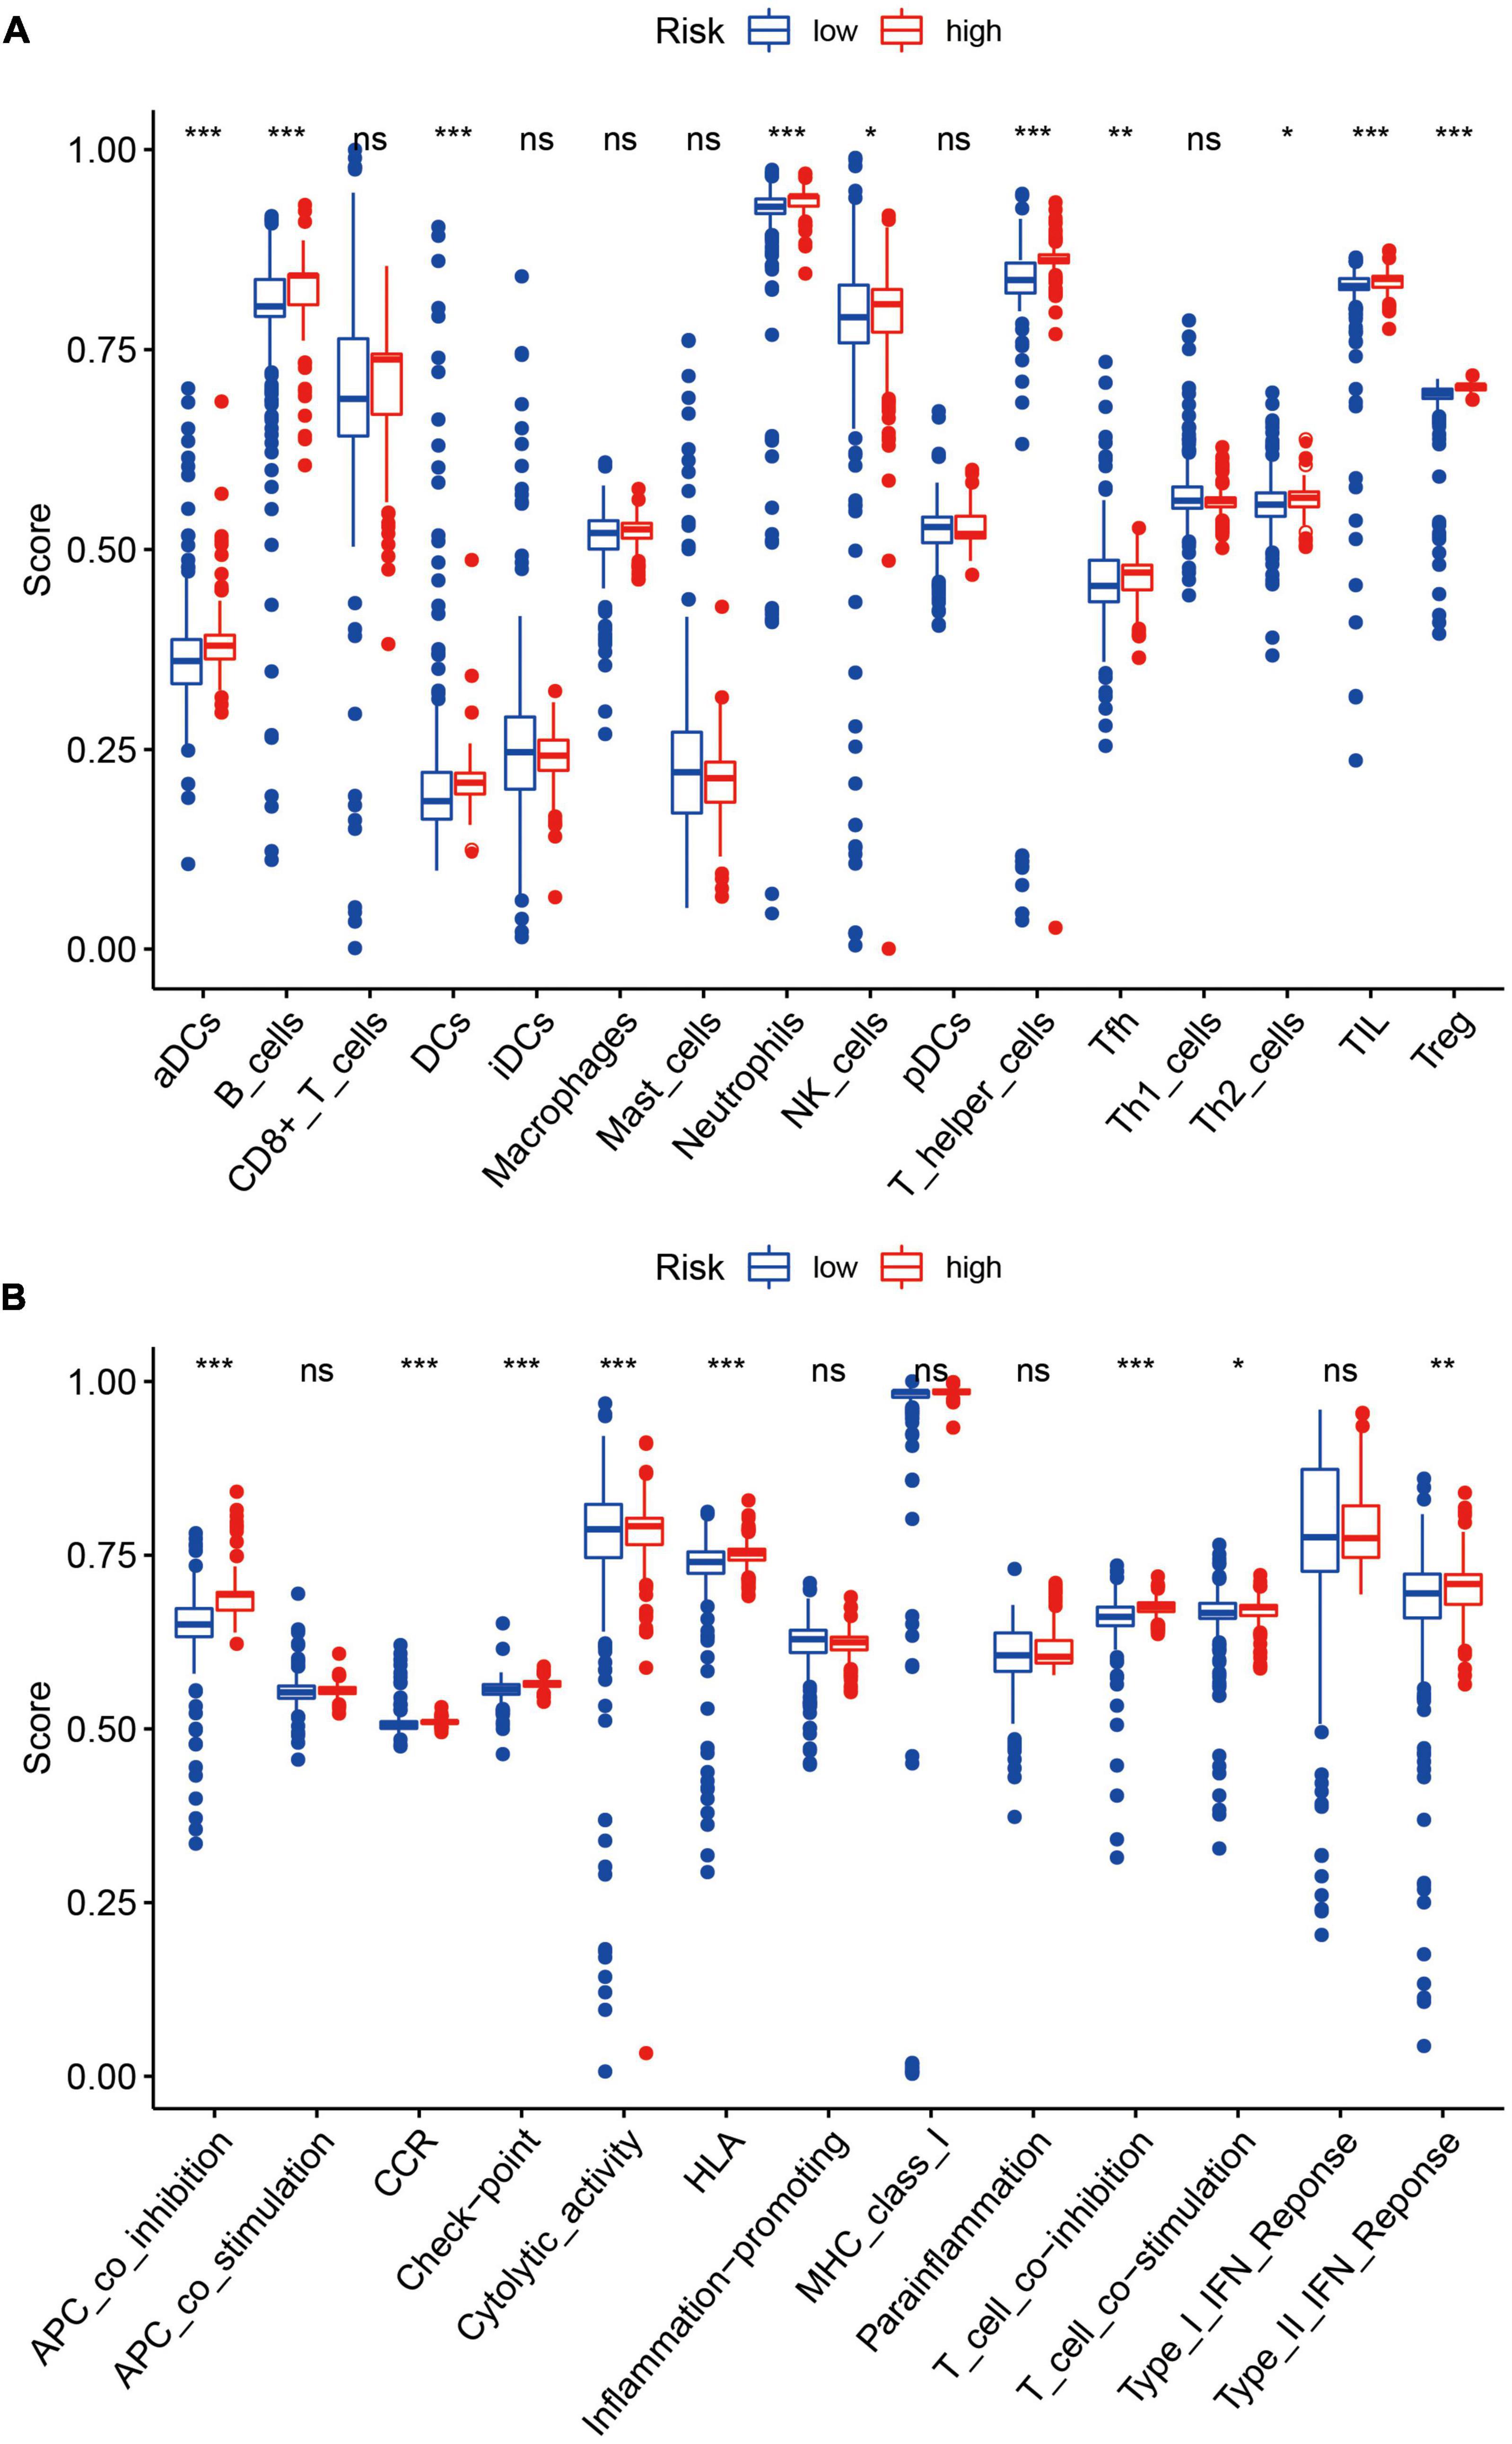
Figure 12. (A) Elements related to antigen presentation process contents such as aDCs, B cells, and DCs were significantly up-regulated in the high-risk group (all P < 0.05). Elements related to cellular immunity, such as neutrophils, NK cells, T helper cells, Tfh, Th2 Cells, TIL, and Tregs, were also up-regulated in the high-risk group. *P < 0.05; **P < 0.01; ***P < 0.001. (B) The contents of the antigen presentation process, including APC co-inhibition, CCR, Check-point, Cytolytic activity, HLA, T cell co-inhibition, T cell co-stimulation, and Type II IFN Response were significantly up-regulated in the high-risk group. *P < 0.05; **P < 0.01; ***P < 0.001.
The abundance of 22 immune cells in each sample was compared between the high- and low-risk groups. Pearson correlation coefficient was used to calculate the correlation between components. T cells follicular helper, NK cells activated, Macrophages M1, Dendritic cells resting, and Mast cells activated were excluded because they were present in zero amounts in each sample. Figure 13A displayed the correlation among the above 17 immune cell types. A total of four immune cell types were obviously correlated. Neutrophils negatively related to T cells CD4 memory resting (r = –0.46), Monocytes (r = –0.56), and NK cells resting (r = –0.40), suggesting that there may be an antagonistic relationship between neutrophils, T cells CD4 memory resting, Monocytes, and NK cells resting.
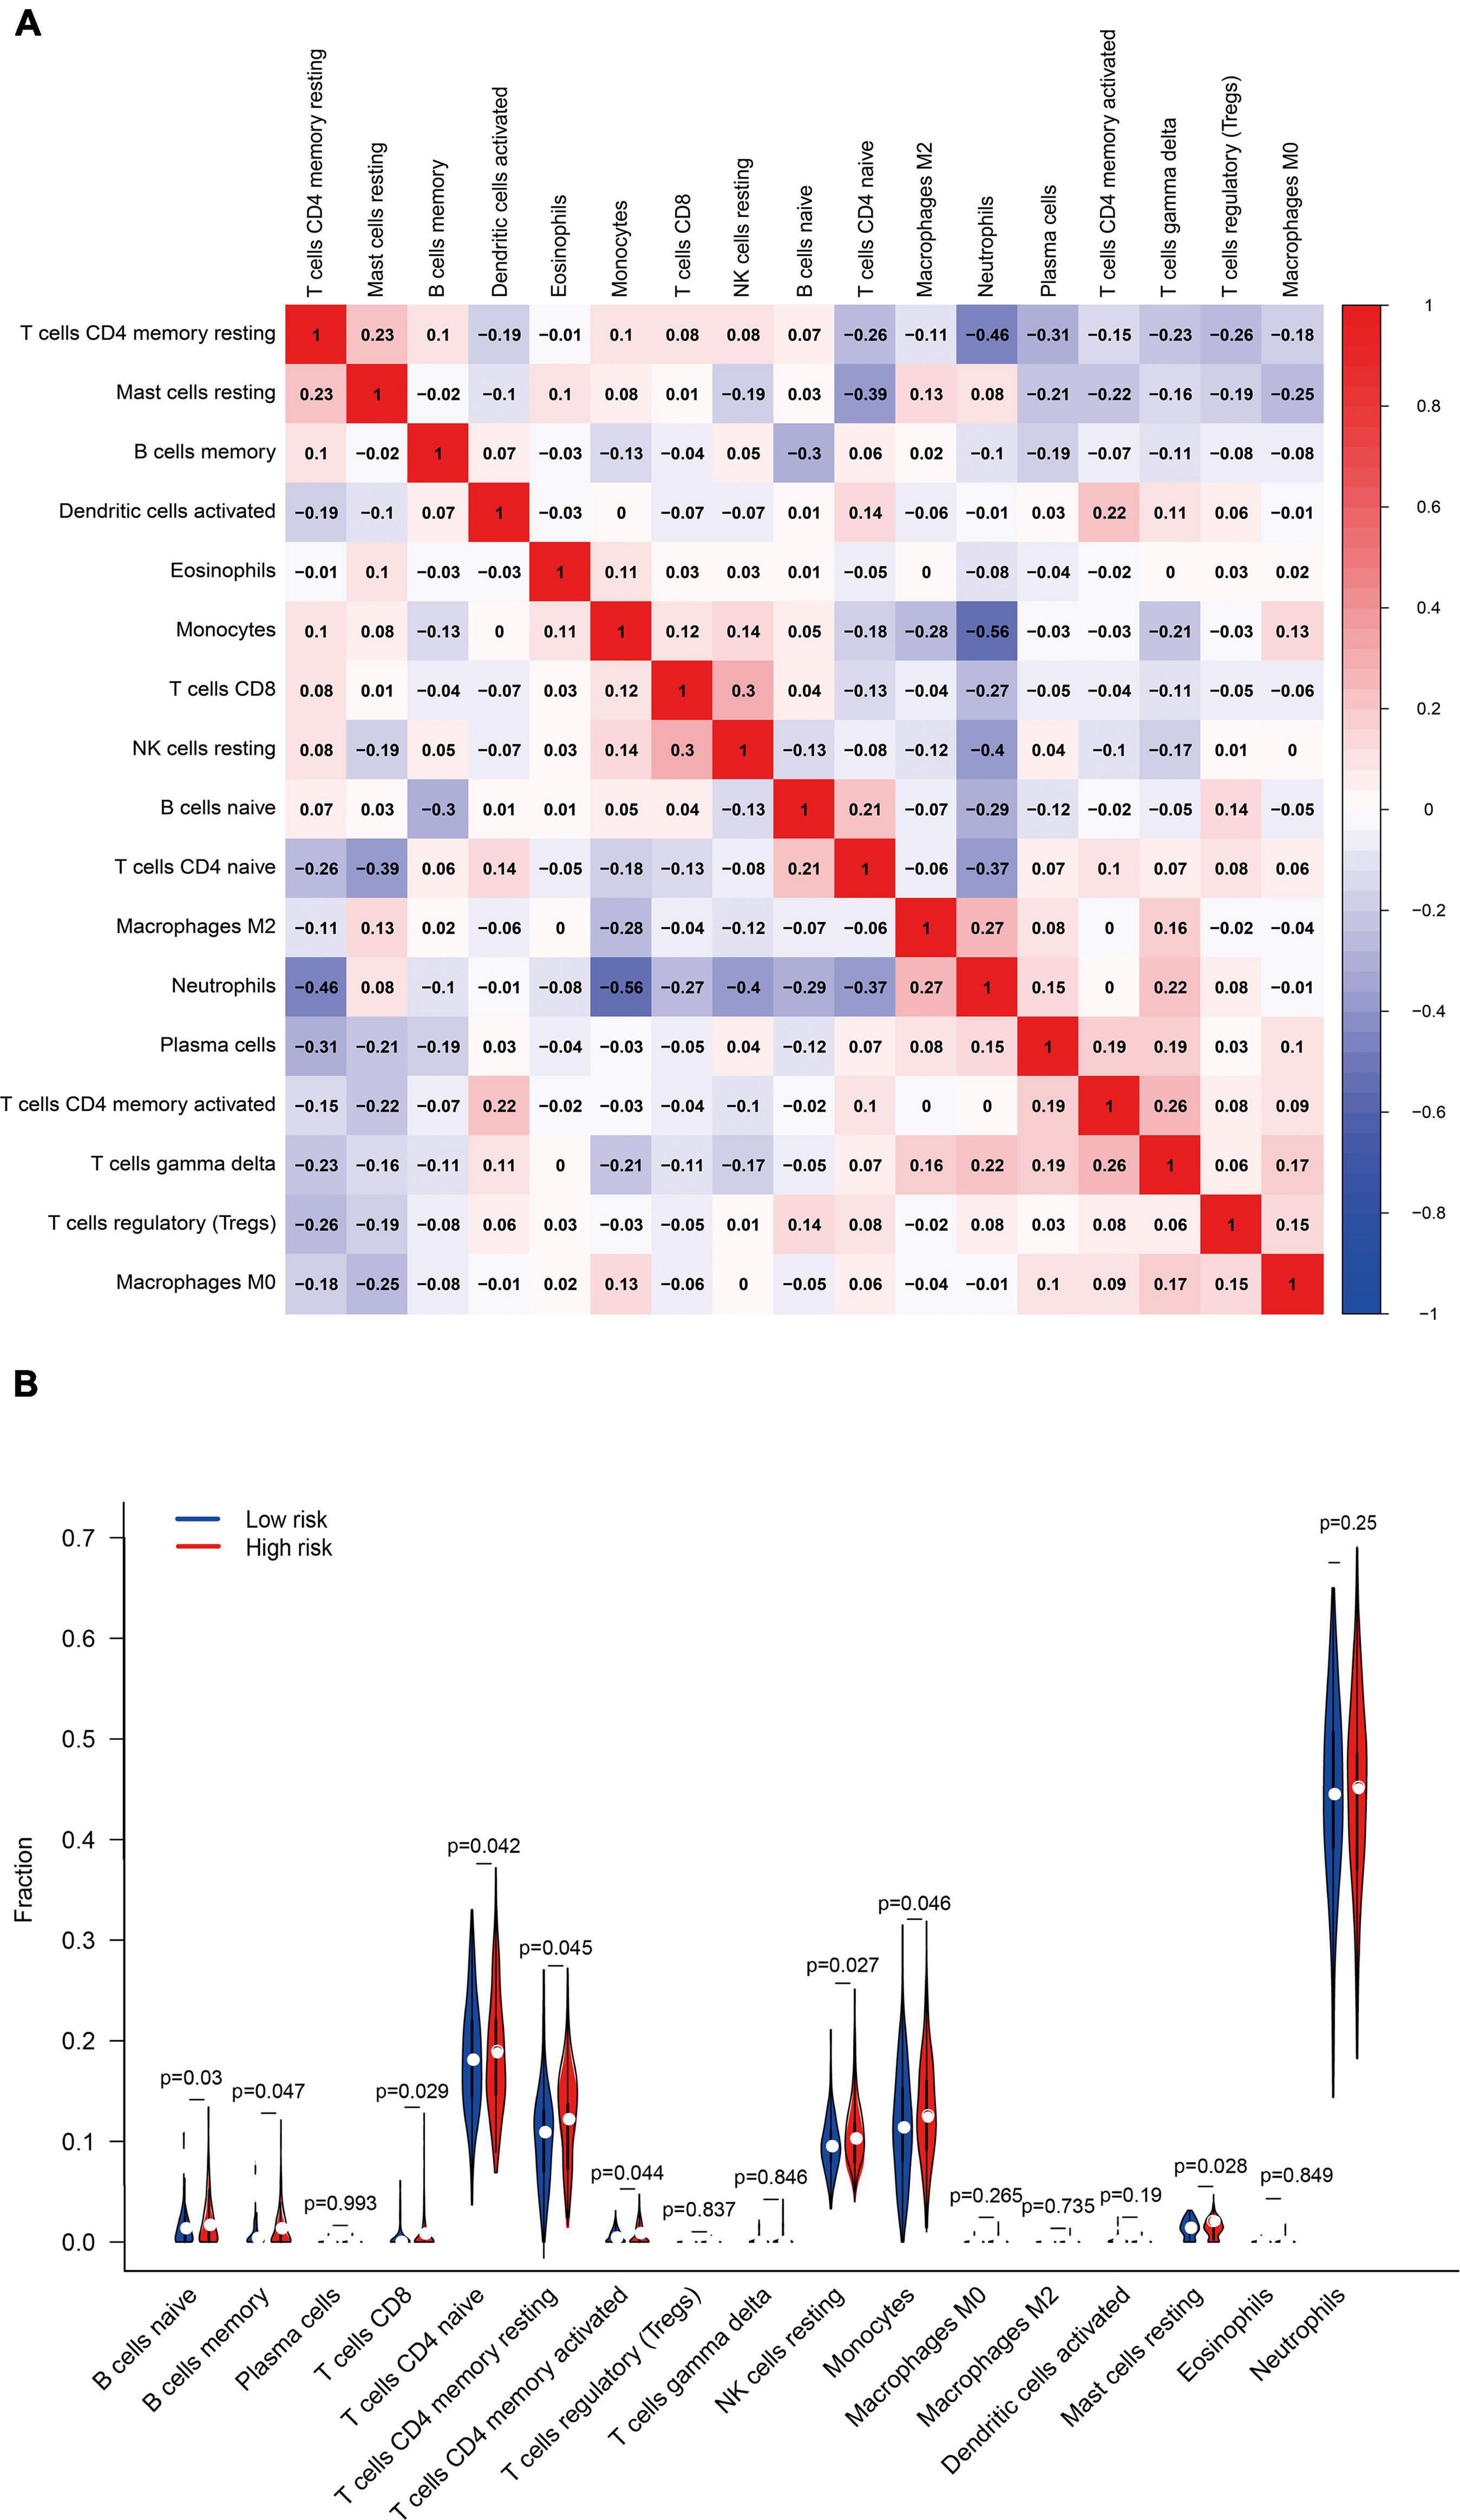
Figure 13. (A) Pearson correlation coefficient revealed the correlation between 17 immune cells. (B) The differential expression of immune cells in the high- and low-risk groups.
The differential expression of immune cells assessed by CIBERSORT was shown in Figure 13B. B cells naïve, B cells memory, T cells CD8, T cells CD4 naïve, T cells CD4 memory resting, T cells CD4 memory activated, NK cells resting, Monocytes, and Mast cells resting were up-regulated in the high-risk group, taking P < 0.05 as the threshold. These results also confirmed the ssGSEA enrichment result, indicating that ferroptosis is involved in the disorder of the immune state in PTSD patients. FRGs are potential indicators to evaluate the PTSD risk and underlying immune status.
We conducted a comprehensive transcriptome-wide analysis covering PTSD cases and control individuals by combining six independent research datasets, intending to reveal the potential involvement of FRGs in the pathophysiology of PTSD. As the first step of the study, we applied batch normalization to reduce the batch effect, allowing us to improve statistical capabilities and explicitly validate different molecular pathways in PTSD. The enrichment analysis of GO and KEGG suggested a direct relationship with glutathione metabolism, which is a critical process in ferroptosis (36). GSH is an essential intracellular antioxidant against oxidative stress (19, 37) synthesized from glutamate, cysteine, and glycine (19). Glutamate accumulation in oxidative stress inhibits the import of cysteine, resulting in GSH depletion and lipid peroxide accumulation (38, 39).
Dixon et al. first described ferroptosis (40), which was subsequently defined as iron-dependent regulated necrosis accompanied by lipid peroxidation (19). The main biochemical mechanism of ferroptosis is the catalysis of polyunsaturated fatty acids (PUFAs) that causes lipid peroxidation under the action of catalytic Fe (II) (41). Animal models of PTSD suggest increased iron in cognition-related brain regions, resulting in neuronal injury (42). Hence, high catalytic Fe (II) abundance indicates high levels of oxidative stress. PUFAs are frequently oxidized by lipoxygenases and reduced by the enzyme glutathione peroxidase 4 (GPX4) and its cofactor, GSH (20, 43). Intracellular GSH is synthesized from cysteine. Thus cysteine depletion leads to intracellular GSH exhaustion and triggers ferroptosis (40), indicating that maintaining certain cysteine levels is critical for protecting cells from ferroptosis. The requirement for cysteine for protection from ferroptosis is related to the activity of GPX4 (38, 44). Therefore, the inhibition of GPX4 and depletion of GSH results in elevated lipid peroxides and cell death induced by ferroptosis (19, 40, 43). Our study identified three crucial genes predictive for the risk of developing PTSD, which are also important components of ferroptosis. ACSL4, ACO1, and GSS regulate lipid, iron, cysteine, and glutathione metabolic processes, which participate in the complex biological interplay of ferroptosis (45).
ACSL4 (Acyl-CoA ligase 4) encodes an isozyme of the long-chain fatty-acid-coenzyme A ligase family, thereby exerting significant effects in lipid biosynthesis (46). ACSL4 helps produce arachidonic acid (AA) or adrenic acid (AdA) containing phosphatidylethanolamine, which is involved in lipid peroxidation for ferroptosis (47, 48). ACSL4 activation contributes to ferroptosis-induced brain injury and neuroinflammation in ischemic stroke (49). ACO1 (Aconitase 1) encodes an essential enzyme that can regulate iron levels inside cells, and knockdown of ACO1 can suppress ferroptosis induced by amino acid/cysteine deprivation (20, 50). Intracellular iron and ACO1 expression were found to engage in a directional cross-talk relationship in adipose tissue, simultaneously affecting its adipogenic capacity and connecting iron metabolism and adipogenesis (51). GSS (Glutathione Synthetase) is the core gene that affects glutathione synthesis and metabolism (52). Mutations in GSS cause glutathione synthetase deficiency and result in various metabolic diseases (53–55).
The enrichment analysis of highly connected module genes in WGCNA revealed immune response pathways, including the cellular response to interferon-gamma, negative regulation of T cell receptor signaling pathway, and IgG binding. Meanwhile, the ssGSEA and CIBERSORT analysis based on the FRGs model revealed specific immune status differences between risk groups, particularly in cellular immunity and antigen presentation, which primarily were up-regulated in the high-risk group. Our result is consistent with recent research that reported direct or indirect relationships between the immune response and PTSD. For example, combined data analysis extracted from five transcriptome studies found perturbed gene expression in aggregated inflammatory pathways, including cytokine, innate immune, and type I interferon (3). Immune responses are up-regulated in PTSD at baseline and down-regulated after symptom improvement (1). The pro-inflammatory cytokines in peripheral blood cells were examined, revealing that increased CRP, IL-6, TNF-α, IL-1β, and IFN-γ were related to PTSD symptoms (56). Transcriptional sequencing of peripheral blood from PTSD patients also supported roles for innate immune and interferon signaling genes in developing the pathophysiology underlying PTSD (57).
Recent work indicates that ferroptosis-related cell death is a potent activator of the innate immune system (36). Ruptured ferroptosis cells may release pro-inflammatory factors, such as damage-associated molecular patterns (DAMPs) (36), an immunogenic process that can increase the secretion of numerous proinflammation cytokines (58, 59). Moreover, ROS and oxidized lipoproteins are also key components of DAMPs. DAMPs stimulate inflammation by binding to pattern recognition receptors (PPRs), such as Toll-like receptors (TLRs), NLR families and the ALR families (12, 60). Activating these receptors further increase inflammatory responses by recruiting immune cells. Some ferroptosis cells release signals, such as PGE2, which could impact the local immune environment (44). Immunotherapy-activated CD8 + T cells have been found to promote ferroptosis-specific lipid peroxidation, which increased the efficacy of antitumor therapy in tumor diseases (61). It is thus reasonable to assume that ferroptosis could be a potential regulatory pathway in the immune changes associated with PTSD, making it a potential marker that could aid in recognizing the development of PTSD and treatment target for the disorder.
There are some limitations to our study. First, our model was established with a public database with a limited scale. Research across multiple centers will be required to verify our findings and assess their clinical utility. Second, a single hallmark to estimate the risk of PTSD development is insufficient because, as we know, the occurrence of PTSD is also related to a variety of environmental factors. The lack of time complexity is another limitation of our study. Due to the nature of the original data, cross-sectional studies were used to analyze the results. Further research is required to determine the validity of our conclusions in prospective studies. Our study suggests a potential role of ferroptosis in PTSD, even suggesting that it may serve as a therapeutic target for the treatment of PTSD. However, it should be emphasized that the link between ferroptosis and PTSD needs to be experimentally determined.
In summary, our study defined a novel model associated with PTSD. The present work also indicated the potential immunological effect of ferroptosis in PTSD occurrence. Further investigation is needed to understand the mechanisms linking ferroptosis and the development of PTSD.
This data can be found here: Public datasets were available in the GEO database (https://www.ncbi.nlm.nih.gov/geo/). The corresponding accession numbers were given in the main text.
JZ generated the original concept and performed the statistical analysis. YZ and RR helped writing the first draft of the manuscript. LS revised the entire manuscript. LS and XT supervised the entire study. All authors had full access to all study data and analyses, participated in preparing this report, and approved of its final, submitted form.
This present work was supported by the Ministry of Science and Technology of the People’s Republic of China (2021ZD0201900) and the National Natural Science Foundation of China (Grant No. 82120108002).
The authors declare that the research was conducted in the absence of any commercial or financial relationships that could be construed as a potential conflict of interest.
All claims expressed in this article are solely those of the authors and do not necessarily represent those of their affiliated organizations, or those of the publisher, the editors and the reviewers. Any product that may be evaluated in this article, or claim that may be made by its manufacturer, is not guaranteed or endorsed by the publisher.
1. Rusch HL, Robinson J, Yun S, Osier ND, Martin C, Brewin CR, et al. Gene expression differences in PTSD are uniquely related to the intrusion symptom cluster: a transcriptome-wide analysis in military service members. Brain Behav Immun. (2019) 80:904–8. doi: 10.1016/j.bbi.2019.04.039
2. Howie H, Rijal CM, Ressler KJ. A review of epigenetic contributions to post-traumatic stress disorder. Dialogues Clin Neurosci. (2019) 21:417–28. doi: 10.31887/DCNS.2019.21.4/kressler
3. Breen MS, Tylee DS, Maihofer AX, Neylan TC, Mehta D, Binder EB, et al. PTSD blood transcriptome mega-analysis: shared inflammatory pathways across biological sex and modes of trauma. Neuropsychopharmacology. (2018) 43:469–81. doi: 10.1038/npp.2017.220
4. Heinzelmann M, Gill J. Epigenetic mechanisms shape the biological response to trauma and risk for PTSD: a critical review. Nurs Res Pract. (2013) 2013:417010. doi: 10.1155/2013/417010
5. Schiavone S, Jaquet V, Trabace L, Krause KH. Severe life stress and oxidative stress in the brain: from animal models to human pathology. Antioxid Redox Signal. (2013) 18:1475–90. doi: 10.1089/ars.2012.4720
6. Uttara B, Singh AV, Zamboni P, Mahajan RT. Oxidative stress and neurodegenerative diseases: a review of upstream and downstream antioxidant therapeutic options. Curr Neuropharmacol. (2009) 7:65–74. doi: 10.2174/157015909787602823
7. Atli A, Bulut M, Bez Y, Kaplan I, Ozdemir PG, Uysal C, et al. Altered lipid peroxidation markers are related to post-traumatic stress disorder (PTSD) and not trauma itself in earthquake survivors. Eur Arch Psychiatry Clin Neurosci. (2016) 266:329–36. doi: 10.1007/s00406-015-0638-5
8. Zieker J, Zieker D, Jatzko A, Dietzsch J, Nieselt K, Schmitt A, et al. Differential gene expression in peripheral blood of patients suffering from post-traumatic stress disorder. Mol Psychiatry. (2007) 12:116–8. doi: 10.1038/sj.mp.4001905
9. Aquilano K, Baldelli S, Ciriolo MR. Glutathione: new roles in redox signaling for an old antioxidant. Front Pharmacol. (2014) 5:196. doi: 10.3389/fphar.2014.00196
10. Tang S, Gao P, Chen H, Zhou X, Ou Y, He Y. The role of iron, its metabolism and ferroptosis in traumatic brain injury. Front Cell Neurosci. (2020) 14:590789. doi: 10.3389/fncel.2020.590789
11. Fischer TD, Hylin MJ, Zhao J, Moore AN, Waxham MN, Dash PK. Altered mitochondrial dynamics and TBI pathophysiology. Front Syst Neurosci. (2016) 10:29. doi: 10.3389/fnsys.2016.00029
12. Chen Y, Zhou Z, Min W. Mitochondria, oxidative stress and innate immunity. Front Physiol. (2018) 9:1487. doi: 10.3389/fphys.2018.01487
13. Lamkanfi M, Kanneganti TD, Franchi L, Nunez G. Caspase-1 inflammasomes in infection and inflammation. J Leukoc Biol. (2007) 82:220–5. doi: 10.1189/jlb.1206756
14. Ren JX, Li C, Yan XL, Qu Y, Yang Y, Guo ZN. Crosstalk between oxidative stress and ferroptosis/oxytosis in ischemic stroke: possible targets and molecular mechanisms. Oxid Med Cell Longev. (2021) 2021:6643382. doi: 10.1155/2021/6643382
15. Weiland A, Wang Y, Wu W, Lan X, Han X, Li Q, et al. Ferroptosis and its role in diverse brain diseases. Mol Neurobiol. (2019) 56:4880–93. doi: 10.1007/s12035-018-1403-3
16. Yan HF, Tuo QZ, Yin QZ, Lei P. The pathological role of ferroptosis in ischemia/reperfusion-related injury. Zool Res. (2020) 41:220–30. doi: 10.24272/j.issn.2095-8137.2020.042
17. Yan N, Zhang J. Iron metabolism, ferroptosis, and the links with Alzheimer’s disease. Front Neurosci. (2019) 13:1443. doi: 10.3389/fnins.2019.01443
18. Borovac Stefanovic L, Kalinic D, Mimica N, Beer Ljubic B, Aladrovic J, Mandelsamen Perica M, et al. Oxidative status and the severity of clinical symptoms in patients with post-traumatic stress disorder. Ann Clin Biochem. (2015) 52:95–104. doi: 10.1177/0004563214528882
19. Stockwell BR, Friedmann Angeli JP, Bayir H, Bush AI, Conrad M, Dixon SJ, et al. Ferroptosis: a regulated cell death nexus linking metabolism, redox biology, and disease. Cell. (2017) 171:273–85. doi: 10.1016/j.cell.2017.09.021
20. Hassannia B, Vandenabeele P, Vanden Berghe T. Targeting ferroptosis to iron out cancer. Cancer Cell. (2019) 35:830–49. doi: 10.1016/j.ccell.2019.04.002
21. Bersuker K, Hendricks JM, Li Z, Magtanong L, Ford B, Tang PH, et al. The CoQ oxidoreductase FSP1 acts parallel to GPX4 to inhibit ferroptosis. Nature. (2019) 575:688–92. doi: 10.1038/s41586-019-1705-2
22. Doll S, Freitas FP, Shah R, Aldrovandi M, da Silva MC, Ingold I, et al. FSP1 is a glutathione-independent ferroptosis suppressor. Nature. (2019) 575:693–8. doi: 10.1038/s41586-019-1707-0
23. Liang JY, Wang DS, Lin HC, Chen XX, Yang H, Zheng Y, et al. A novel ferroptosis-related gene signature for overall survival prediction in patients with hepatocellular carcinoma. Int J Biol Sci. (2020) 16:2430–41. doi: 10.7150/ijbs.45050
24. Leek JT. svaseq: removing batch effects and other unwanted noise from sequencing data. Nucleic Acids Res. (2014) 42:21. doi: 10.1093/nar/gku864
25. Langfelder P, Horvath S. WGCNA: an R package for weighted correlation network analysis. BMC Bioinform. (2008) 9:559. doi: 10.1186/1471-2105-9-559
26. Zhao W, Langfelder P, Fuller T, Dong J, Li A, Hovarth S. Weighted gene coexpression network analysis: state of the art. J Biopharm Stat. (2010) 20:281–300. doi: 10.1080/10543400903572753
27. Lv CX, An SY, Qiao BJ, Wu W. Time series analysis of hemorrhagic fever with renal syndrome in mainland China by using an XGBoost forecasting model. BMC Infect Dis. (2021) 21:839. doi: 10.1186/s12879-021-06503-y
28. Ke H, Chen D, Shi B, Zhang J, Liu X, Zhang X, et al. Improving brain E-health services via high-performance EEG classification with grouping bayesian optimization. IEEE Trans Serv Comput. (2020) 13:696–708. doi: 10.1109/TSC.2019.2962673
29. Ke H, Chen D, Shah T, Liu X, Zhang X, Zhang L, et al. Cloud-aided online EEG classification system for brain healthcare: a case study of depression evaluation with a lightweight CNN. Softw Pract Exp. (2020) 50:596–610. doi: 10.1002/spe.2668
30. Franceschini A, Szklarczyk D, Frankild S, Kuhn M, Simonovic M, Roth A, et al. STRING v9.1: protein-protein interaction networks, with increased coverage and integration. Nucleic Acids Res. (2013) 41:D808–15. doi: 10.1093/nar/gks1094
31. Wang H, Lengerich BJ, Aragam B, Xing EP. Precision lasso: accounting for correlations and linear dependencies in high-dimensional genomic data. Bioinformatics. (2019) 35:1181–7. doi: 10.1093/bioinformatics/bty750
32. Barbie DA, Tamayo P, Boehm JS, Kim SY, Moody SE, Dunn IF, et al. Systematic RNA interference reveals that oncogenic KRAS-driven cancers require TBK1. Nature. (2009) 462:108–12. doi: 10.1038/nature08460
33. Xiao B, Liu L, Li A, Xiang C, Wang P, Li H, et al. Identification and verification of immune-related gene prognostic signature based on ssGSEA for osteosarcoma. Front Oncol. (2020) 10:607622. doi: 10.3389/fonc.2020.607622
34. Angelova M, Charoentong P, Hackl H, Fischer ML, Snajder R, Krogsdam AM, et al. Characterization of the immunophenotypes and antigenomes of colorectal cancers reveals distinct tumor escape mechanisms and novel targets for immunotherapy. Genome Biol. (2015) 16:64. doi: 10.1186/s13059-015-0620-6
35. Newman AM, Liu CL, Green MR, Gentles AJ, Feng W, Xu Y, et al. Robust enumeration of cell subsets from tissue expression profiles. Nat Methods. (2015) 12:453–7. doi: 10.1038/nmeth.3337
36. Proneth B, Conrad M. Ferroptosis and necroinflammation, a yet poorly explored link. Cell Death Differ. (2019) 26:14–24. doi: 10.1038/s41418-018-0173-9
37. Schulz JB, Lindenau J, Seyfried J, Dichgans J. Glutathione, oxidative stress and neurodegeneration. Eur J Biochem. (2000) 267:4904–11. doi: 10.1046/j.1432-1327.2000.01595.x
38. Friedmann Angeli JP, Schneider M, Proneth B, Tyurina YY, Tyurin VA, Hammond VJ, et al. Inactivation of the ferroptosis regulator Gpx4 triggers acute renal failure in mice. Nat Cell Biol. (2014) 16:1180–91. doi: 10.1038/ncb3064
39. Ratan RR. The chemical biology of ferroptosis in the central nervous system. Cell Chem Biol. (2020) 27:479–98. doi: 10.1016/j.chembiol.2020.03.007
40. Dixon SJ, Lemberg KM, Lamprecht MR, Skouta R, Zaitsev EM, Gleason CE, et al. Ferroptosis: an iron-dependent form of nonapoptotic cell death. Cell. (2012) 149:1060–72. doi: 10.1016/j.cell.2012.03.042
41. Jiang X, Stockwell BR, Conrad M. Ferroptosis: mechanisms, biology and role in disease. Nat Rev Mol Cell Biol. (2021) 22:266–82. doi: 10.1038/s41580-020-00324-8
42. Zhao M, Yu Z, Zhang Y, Huang X, Hou J, Zhao Y, et al. Iron-induced neuronal damage in a rat model of post-traumatic stress disorder. Neuroscience. (2016) 330:90–9. doi: 10.1016/j.neuroscience.2016.05.025
43. Seiler A, Schneider M, Forster H, Roth S, Wirth EK, Culmsee C, et al. Glutathione peroxidase 4 senses and translates oxidative stress into 12/15-lipoxygenase dependent- and AIF-mediated cell death. Cell Metab. (2008) 8:237–48. doi: 10.1016/j.cmet.2008.07.005
44. Yang WS, SriRamaratnam R, Welsch ME, Shimada K, Skouta R, Viswanathan VS, et al. Regulation of ferroptotic cancer cell death by GPX4. Cell. (2014) 156:317–31. doi: 10.1016/j.cell.2013.12.010
45. Friedmann Angeli JP, Krysko DV, Conrad M. Ferroptosis at the crossroads of cancer-acquired drug resistance and immune evasion. Nat Rev Cancer. (2019) 19:405–14. doi: 10.1038/s41568-019-0149-1
46. Wang J, Wang Z, Yuan J, Wang J, Shen X. The positive feedback between ACSL4 expression and O-GlcNAcylation contributes to the growth and survival of hepatocellular carcinoma. Aging (Albany NY). (2020) 12:7786–800. doi: 10.18632/aging.103092
47. Doll S, Proneth B, Tyurina YY, Panzilius E, Kobayashi S, Ingold I, et al. ACSL4 dictates ferroptosis sensitivity by shaping cellular lipid composition. Nat Chem Biol. (2017) 13:91–8. doi: 10.1038/nchembio.2239
48. Wenzel SE, Tyurina YY, Zhao J, St Croix CM, Dar HH, Mao G, et al. PEBP1 wardens ferroptosis by enabling lipoxygenase generation of lipid death signals. Cell. (2017) 171:628–41.e26. doi: 10.1016/j.cell.2017.09.044
49. Cui Y, Zhang Y, Zhao X, Shao L, Liu G, Sun C, et al. ACSL4 exacerbates ischemic stroke by promoting ferroptosis-induced brain injury and neuroinflammation. Brain Behav Immun. (2021) 93:312–21. doi: 10.1016/j.bbi.2021.01.003
50. Gao M, Monian P, Quadri N, Ramasamy R, Jiang X. Glutaminolysis and transferrin regulate ferroptosis. Mol Cell. (2015) 59:298–308. doi: 10.1016/j.molcel.2015.06.011
51. Moreno M, Ortega F, Xifra G, Ricart W, Fernandez-Real JM, Moreno-Navarrete JM. Cytosolic aconitase activity sustains adipogenic capacity of adipose tissue connecting iron metabolism and adipogenesis. FASEB J. (2015) 29:1529–39. doi: 10.1096/fj.14-258996
52. Al-Jishi E, Meyer BF, Rashed MS, Al-Essa M, Al-Hamed MH, Sakati N, et al. Clinical, biochemical, and molecular characterization of patients with glutathione synthetase deficiency. Clin Genet. (1999) 55:444–9. doi: 10.1034/j.1399-0004.1999.550608.x
53. Shi ZZ, Habib GM, Rhead WJ, Gahl WA, He X, Sazer S, et al. Mutations in the glutathione synthetase gene cause 5-oxoprolinuria. Nat Genet. (1996) 14:361–5. doi: 10.1038/ng1196-361
54. Dahl N, Pigg M, Ristoff E, Gali R, Carlsson B, Mannervik B, et al. Missense mutations in the human glutathione synthetase gene result in severe metabolic acidosis, 5-oxoprolinuria, hemolytic anemia and neurological dysfunction. Hum Mol Genet. (1997) 6:1147–52. doi: 10.1093/hmg/6.7.1147
55. Njalsson R, Carlsson K, Winkler A, Larsson A, Norgren S. Diagnostics in patients with glutathione synthetase deficiency but without mutations in the exons of the GSS gene. Hum Mutat. (2003) 22:497. doi: 10.1002/humu.9199
56. Passos IC, Vasconcelos-Moreno MP, Costa LG, Kunz M, Brietzke E, Quevedo J, et al. Inflammatory markers in post-traumatic stress disorder: a systematic review, meta-analysis, and meta-regression. Lancet Psychiatry. (2015) 2:1002–12. doi: 10.1016/S2215-0366(15)00309-0
57. Breen MS, Maihofer AX, Glatt SJ, Tylee DS, Chandler SD, Tsuang MT, et al. Gene networks specific for innate immunity define post-traumatic stress disorder. Mol Psychiatry. (2015) 20:1538–45. doi: 10.1038/mp.2015.9
58. Linkermann A, Stockwell BR, Krautwald S, Anders HJ. Regulated cell death and inflammation: an auto-amplification loop causes organ failure. Nat Rev Immunol. (2014) 14:759–67. doi: 10.1038/nri3743
59. Mulay SR, Linkermann A, Anders HJ. Necroinflammation in kidney disease. J Am Soc Nephrol. (2016) 27:27–39. doi: 10.1681/ASN.2015040405
60. Sellge G, Kufer TA. PRR-signaling pathways: learning from microbial tactics. Sem Immunol. (2015) 27:75–84. doi: 10.1016/j.smim.2015.03.009
Keywords: ferroptosis, post-traumatic stress disorder, transcriptome analysis, computational modeling, inflammatory pathways
Citation: Zhu J, Zhang Y, Ren R, Sanford LD and Tang X (2022) Blood transcriptome analysis: Ferroptosis and potential inflammatory pathways in post-traumatic stress disorder. Front. Psychiatry 13:841999. doi: 10.3389/fpsyt.2022.841999
Received: 23 December 2021; Accepted: 20 September 2022;
Published: 05 October 2022.
Edited by:
Masahiro Takamura, Shimane University, JapanReviewed by:
Fengqin Wang, Hubei Normal University, ChinaCopyright © 2022 Zhu, Zhang, Ren, Sanford and Tang. This is an open-access article distributed under the terms of the Creative Commons Attribution License (CC BY). The use, distribution or reproduction in other forums is permitted, provided the original author(s) and the copyright owner(s) are credited and that the original publication in this journal is cited, in accordance with accepted academic practice. No use, distribution or reproduction is permitted which does not comply with these terms.
*Correspondence: Xiangdong Tang, MjM3MjU2NDYxM0BxcS5jb20=; Larry D. Sanford, U2FuZm9yTERAZXZtcy5lZHU=
Disclaimer: All claims expressed in this article are solely those of the authors and do not necessarily represent those of their affiliated organizations, or those of the publisher, the editors and the reviewers. Any product that may be evaluated in this article or claim that may be made by its manufacturer is not guaranteed or endorsed by the publisher.
Research integrity at Frontiers

Learn more about the work of our research integrity team to safeguard the quality of each article we publish.