 Adam Pavlinek1,2
 Rugile Matuleviciute1,2
 Laura Sichlinger1,2
 Lucia Dutan Polit1,2
 Nikolaos Armeniakos1,2
 Anthony Christopher Vernon1,2*
 Deepak Prakash Srivastava1,2*
- 1Department of Basic and Clinical Neuroscience, Institute of Psychiatry, Psychology and Neuroscience, King's College London, London, United Kingdom
- 2MRC Centre for Neurodevelopmental Disorders, King's College London, London, United Kingdom
Human epidemiological data links maternal immune activation (MIA) during gestation with increased risk for psychiatric disorders with a putative neurodevelopmental origin, including schizophrenia and autism. Animal models of MIA provide evidence for this association and suggest that inflammatory cytokines represent one critical link between maternal infection and any potential impact on offspring brain and behavior development. However, to what extent specific cytokines are necessary and sufficient for these effects remains unclear. It is also unclear how specific cytokines may impact the development of specific cell types. Using a human cellular model, we recently demonstrated that acute exposure to interferon-γ (IFNγ) recapitulates molecular and cellular phenotypes associated with neurodevelopmental disorders. Here, we extend this work to test whether IFNγ can impact the development of immature glutamatergic neurons using an induced neuronal cellular system. We find that acute exposure to IFNγ activates a signal transducer and activator of transcription 1 (STAT1)-pathway in immature neurons, and results in significantly increased major histocompatibility complex I (MHCI) expression at the mRNA and protein level. Furthermore, acute IFNγ exposure decreased synapsin I/II protein in neurons but did not affect the expression of synaptic genes. Interestingly, complement component 4A (C4A) gene expression was significantly increased following acute IFNγ exposure. This study builds on our previous work by showing that IFNγ-mediated disruption of relevant synaptic proteins can occur at early stages of neuronal development, potentially contributing to neurodevelopmental disorder phenotypes.
Introduction
Human epidemiological studies and animal models suggest a link between maternal immune activation (MIA) and an increased risk for psychiatric disorders with a putative neurodevelopmental origin, including schizophrenia and autism (1). Although there are many plausible factors that are critical for establishing neurodevelopmental resilience or susceptibility to MIA (2), there is evidence to suggest that the intensity of the maternal immune response is one important factor linking maternal infection to the potential for differential brain development and behavioral phenotypes (3–5). Indeed, animal MIA models display deficits in cognitive and social behaviors (6), which are accompanied by altered synaptic plasticity, decreased synaptic protein levels, and reduced dendritic spine density, predominantly in the prefrontal cortex and hippocampus (7–11). These findings are consistent with in vivo neuroimaging evidence for reduced synaptic density, as measured by reduced binding of positron emission tomography (PET) radioligands targeting synaptic vesicle glycoprotein 2A (SV2A) in schizophrenia (12, 13), reduced dendritic spines (14), and a meta-analysis confirming decreased expression of synaptic proteins in post-mortem brain tissue from individuals with schizophrenia (15).
One key feature of the maternal immune response that shapes these phenotypes is the elevation of numerous cytokines in the maternal serum, placenta and fetal brain (16, 17). Consistent with this view, elevated levels of cytokines in the maternal serum are predictive of the risk for the affected offspring to develop schizophrenia (18). The emerging theme from such studies is that changes in maternal cytokines during pregnancy can have long-lasting consequences (19–21). However, to what extent specific cytokines are necessary and sufficient for these effects remains unclear. Moreover, the underlying molecular mechanisms the are exerted on the developing brain and on specific cell types, remain to be fully elucidated. Evidence from animal models of MIA provides support for the involvement of altered levels of interleukins, particularly interleukin-(IL)-6, IL-1beta and IL-10 but also for the cytokines TNF-alpha, and interferon-γ (IFNγ) (6, 22–24). Of these, IFNγ has been found to have increased levels in the plasma of first-episode schizophrenia patients (25). In addition to its key role in the response to viral infection, IFNγ has also been shown to induce retraction of dendrites and inhibit synapse formation in the central nervous system (26, 27). Despite these findings, it is unclear whether and how elevated levels of IFNγ impact the development of neurons, and if this could contribute to increased risk for schizophrenia.
We previously demonstrated that acute exposure of neural progenitor cells (NPCs) and neurons derived from human induced pluripotent stem cells (iPSCs) to IFNγ results in gene expression changes in genes associated with schizophrenia and autism, and altered neuronal morphology in exposed neurons (28). In particular, IFNγ treatment increased major histocompatibility complex I (MHCI) expression (28). Class I MHC family molecules are best known for their function in presenting antigens to T-cells (29). MHCI is however also expressed in neurons and neural progenitors and has been found to be important in neuronal plasticity and for the co-regulation of synapse pruning in mice (29, 30). Furthermore, MHCI negatively regulates synapse density in developing cortical neurons, with in vitro manipulations of MHCI expression inversely affecting the density of both GABAergic and glutamatergic synapses in rat and mouse cultures (31). In a mouse model of MIA, synapse number in cultured cortical neurons were decreased, and MHCI was found to be required for this MIA-induced effect on synapse density (32). Genome-wide association studies (GWAS) also demonstrate that genetic variation within the MHC loci links with schizophrenia risk (33, 34). For example, variation of complement component 4A (C4) at the MHCIII locus and human leukocyte antigen-B (HLA-B) at the MHCI locus is strongly associated with increased risk for schizophrenia (35).
In our previous work, gene expression changes following IFNγ treatment included increased expression of MHCI genes and downregulation of genes related to the gene ontology (GO) term “synapses” in exposed iPSC-neurons (28). Given that IFNγ has been shown to affect expression of synaptic genes in iPSC-neurons in the absence of glial cells, we aimed to further characterize the effect of IFNγ treatment in developing human glutamatergic neurons, and specifically on MHCI and synaptic protein expression. Using Neurogenin 2 (NGN2) optimized inducible overexpression ioGlutamatergic iNeurons (NGN2-iNs) (36), we find that acute exposure to IFNγ activates a STAT1-signaling pathway in immature NGN2-iNs. Furthermore, we observed that IFNγ exposure increased MHCI protein and HLA-B and C4A expression but decreased the expression of the synaptic proteins synapsin I and synapsin II in cell bodies without altering the expression of a select panel of synaptic genes. These data further demonstrate that elevated levels of IFNγ are capable of disrupting the expression of synaptic proteins and impacting the development of immature glutamatergic neurons in the absence of glial cells.
Methods
Human iPSC culture, neuralization, and treatment
The ioGlutamatergic male neurotypical stem cell line (36) was obtained from BitBio (Cambridge, UK) under MTA agreement. ioGlutamatergic cells were maintained in Stemflex media (Gibco; A3349401) on six-well plates coated with 1:100 Geltrex (Life technologies; A1413302). Media was changed every 48 h and passaged when 70–80% confluent with HBSS and Versene (Gibco; 15040066) at 37°C before being transferred into new Stemflex medium. Neuralization was conducted based on the protocol used by Pawlowski et al. (36). Cells for experiments were terminally plated onto 6-well-plates (for RNA and protein extraction) or glass coverslips in 24-well-plates (for immunocytochemistry) coated with Poly-D-Lysine (5 μg/ml, PDL, A-003-E; Millipore) and laminin (1 mg/ml Sigma L2020). Human iPSCs were dissociated with accutase (A11105-01; Thermo Fisher Scientific) before being diluted with medium and subsequently resuspended in N2 medium with 1 μg/ml doxycycline hyclate and 10 μM ROCK inhibitor (Sigma; Y0503). Cells were plated at a density of 900,000 cells/well for RNA extraction and 25,000 cells/well for ICC. The cells were incubated at 37°C; 5% CO2; 20% O2 with daily N2 media changes supplemented with 1 μg/ml doxycycline hyclate. Either 25 ng/ml IFNγ (Abcam, AB9659; diluted in DMEM) for treatment conditions or vehicle (DMEM) was added at day 3 to the N2 medium. The cells were incubated for 24-h before sample collection (28). For western-blotting, total protein was extracted 15 min after treatment with IFNγ or vehicle on day 3.
In parallel, the 127_CTM_01 human iPSC male neurotypical line (37) was differentiated into NPCs using a dual SMAD inhibition protocol (37, 38). Briefly, the NPCs were expanded from day 18 frozen stocks in maintenance medium (1:1 N2:B27, 10ng/ml bFGF) for seven days. Before treatments, the cells were plated on 12-well NUNCTM tissue culture plates (Thermo Scientific; 150628) at a density of 500,000 cells/well, with dedicated wells for treatment and vehicle treatments. The day after plating, the cells were exposed to 25 ng/ml IFNγ or vehicle and incubated for 24-h before sample collection.
Western blotting
Cell lysates from treated NGN2-iNs were prepared from day 3 cells following treatment. Cells were lysed in RIPA buffer (150 mM NaCl, 10 mM Tris-HCl (pH 7.2), 5 mM EDTA, 0.1% SDS (weight/volume), 1% Triton X-100 (volume/volume), 1% deoxycholate (weight/volume), and inhibitors), before being sonicated with 10 short bursts. Sample buffer was added to all samples, which were then denatured for 5 min at 95°C and stored at −80°C until used further. All samples (5 μg) were subsequently separated by SDS-PAGE and analyzed by Western Blotting with antibodies against phospho-STAT1, phosphor-ERK1/2, ERK1/2, and GAPDH (Supplementary Table 1). Western blots were visualized using Clarity Western ECL substrate (Bio-Rad) before protein detection using the ChemiDoc XRS+ imaging system using ImageLab™ software. Quantification of bands was performed by measuring the integrated intensity of each band and normalizing to the housekeeper GAPDH using ImageStudioLite.
Immunocytochemistry
Cells were fixed with 4% formaldehyde in PBS-sucrose for 10 min at room temperature, washed 2× with Dulbecco's PBS (DPBS, Gibco), and then fixed with ice cold Methanol at 4°C for 10 min, then washed 2× with DPBS. Cells were permeabilized and blocked using 2% normalized goat serum (NGS) in DPBS with 0.1% triton x-100 for 2 h. Antibody solutions (Supplementary Table 2) were prepared in 2% NGS in DPBS. The coverslips were incubated with primary antibody solution at 4°C overnight, then washed 3× with DPBS for 10 min each and incubated with secondary antibodies for 1 h at room temperature. The coverslips were washed 3× with DPBS for 10 min each and incubated for 5 min in DAPI solution, followed by two DPBS washes, then mounted onto glass slides using ProLong Gold antifade reagent (Invitrogen P36930).
Microscopy and image analysis
Coverslips were imaged using a Leica SP5 confocal microscope. The gain and other imaging parameters were set using the vehicle control and were not changed during subsequent imaging of the control and IFNγ exposed coverslips with 246.5x246.5 μm regions imaged. The Z-stack thickness was kept at 0.5 μm and Z-stacks were then maximally projected to form a single image in FIJI. Prior to measuring fluorescent intensity, the background of each image and channel was measured in FIJI by selection of 10 25×25-pixel areas of background and measuring the mean and standard deviation (SD) of staining intensity of each area. The mean of these measurements + 2SD was then subtracted from the image. Cell Profiler (39) was used to identify the nuclei, cells, cell bodies, processes, and the cytoplasm and to measure the mean intensity of the MHC and synapsin I/II channels. Mean intensity values of 0 were excluded from the analysis. The pipeline is provided as a Supplementary file.
Quantitative PCR
Cells for RNA extraction were lysed in TRI Reagent (T3809, Merck) for 5 min at room temperature and RNA was extracted from TRI Reagent according to the manufacturer's protocol. Isolated RNA was cleaned by precipitation with 3% sodium acetate in ethanol at −80°C overnight, washed as in the isolation protocol, and resuspended in H2O. A nanodrop spectrophotometer was used to measure RNA concentration and quality.
For cDNA synthesis, a mixture of 1 μl of oligo(dT)20 (50 μM) (Invitrogen; 18418020), 2 μg total RNA, 1 μl 10 mM dNTP Mix (10 mM each) (Invitrogen; 18427013), and water to make up a total of 13 μl per sample was heated to 65°C for 5 min and incubated on ice for 1 min. Next, superscript mastermix (Invitrogen; 18080093) was added to each sample (4μl 5X First-Strand Buffer, 1 μl 0.1 M DTT, 1 μl RNaseOUT Recombinant RNase Inhibitor (Invitrogen; 10777019), 1 μl of SuperScript III RT (200 units/μl)) and the mixture was incubated at 50°C for 50 min and then 70°C for 15 min. qPCR was done in a 348 well-plate, with two technical replicates per sample, and also a blank well-containing no cDNA for each primer pair (Supplementary Table 3). Three housekeeping genes (HPRT, SDHA, RPL27) were used. A mastermix consisting of 2 μl 5x qPCR Mix Plus, 1.5 μl Primer mix, and 4.5 μl RNAse free per well was added to the plate. 2 μl cDNA were added to each well. qPCR was run using a QuantStudio7 thermocycler with one cycle for 12 min at 95°C and 40 cycles of 95°C for 15s, 60–65°C for 20s and 72°C for 20 s.
The data were analyzed using the 2−ΔΔCt method (40). For each gene, the technical replicates were averaged. The three housekeeping genes were averaged and the ΔCt (difference between the housekeeper average and gene of interest average) was calculated for each gene of interest. The ΔΔCt was calculated as ΔCt-[Calibrator] where the calibrator is the average of the ΔCt of the controls. The final result is 2−ΔΔCt. This value was log-transformed prior to statistical analysis.
Statistical analysis
For both the ICC and qPCR experiments, three biological replicates (N = 3) were analyzed, where each replicate is the same cell line but with a different passage number and differentiated on a different day. The number of replicates was decided prior to the conducting of the experiments. Statistical analysis was done in Prism 9.0.2. The exposed and control mean intensity values (ICC) or log (2−ΔΔCt) values (qPCR) were compared using multiple 2-tailed unpaired t-tests, and corrected for multiple comparisons using the Holm-Šídák method.
Results
Acute IFNγ exposure downregulates presynaptic genes associated with synaptic vesicles
In the RNA sequencing data from our previous study, we found downregulation of genes related to the GO term “synapses” in human iPSC-NPCs exposed to IFNγ for 24 h (28). To explore this further, a curated database of synaptic genes, SynGO (41), was used to identify significantly enriched biological processes (BP) and cellular component (CC) ontologies related to synaptic function. Analyses were carried out with the complete list of significantly down-regulated genes in day 30 neurons acutely exposed to IFNγ (25 ng/ml, 24 h) compared with vehicle-exposed neurons. The results reveal 18 genes mapping to SynGO synaptic proteins with significant enrichment for 3 CC and 5 BP terms (Figure 1). Most of these proteins (n = 12) were annotated in the presynapse cluster with four genes enriched for the synaptic vesicle membrane term. These results suggest that acute IFNγ exposure leads to the downregulation of 18 genes that exert presynaptic functions and regulate synaptic vesicle mechanisms in iPSC-neurons.
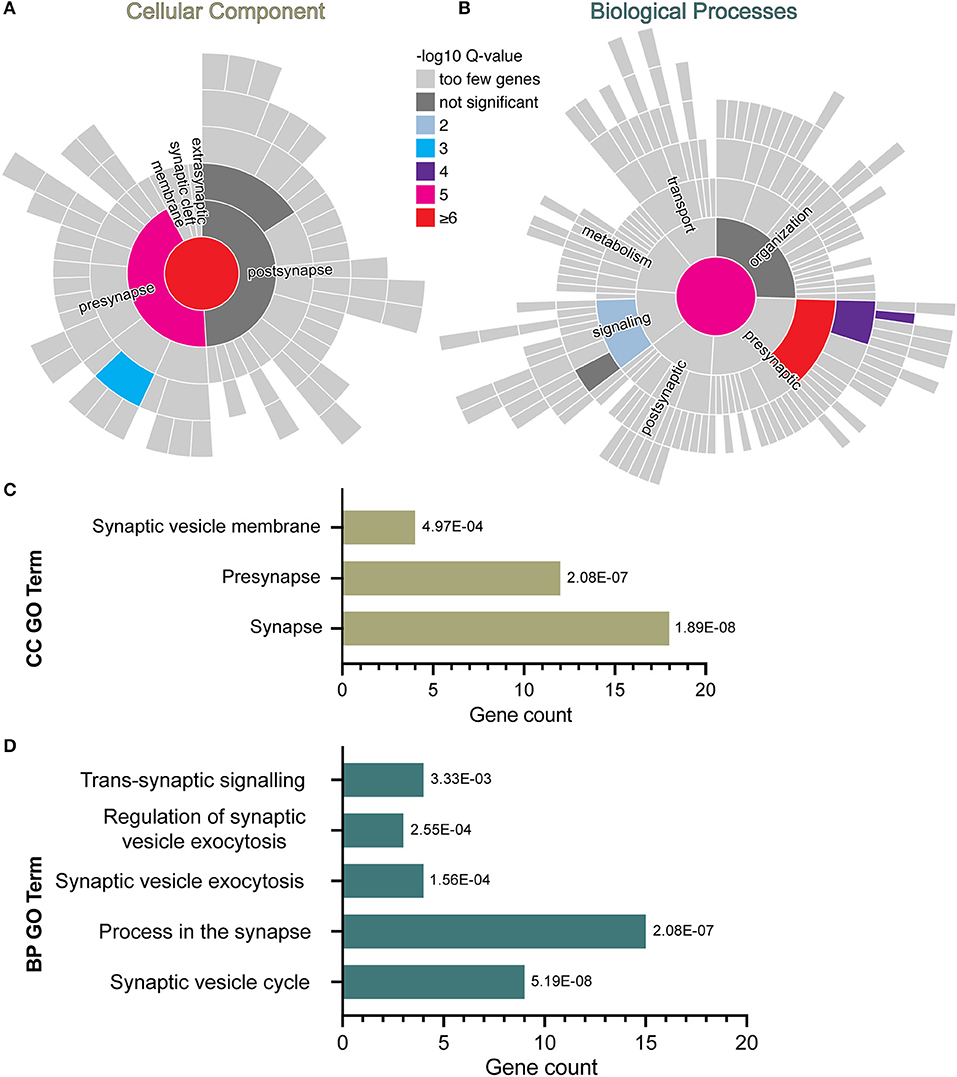
Figure 1. SynGO synaptic gene ontology analyses of down-regulated DEG in D30 neurons acutely exposed to IFNγ. The sunburst plots represent synaptic annotated ontologies for CC (B) and BP (A) terms. The key color scale indicates -log10 FDR adjusted p-values. (A) Significantly enriched CC ontologies include synapse (red) presynaptic (magenta) clusters. (B) Annotated BP terms include synaptic (magenta), presynaptic (red) and signaling (blue) terms. (C,D) Plots of synaptic GO output showing the 3 CC (C) and 5 BC (D) significantly (FDR-adjusted) enriched terms for D30 IFNγ exposed neurons. The bar length indicates the number of genes, the order of each bar and numbers adjacent to each are the FDR adj. P-value. Analysis of data previously published inWarre-Cornish et al. (28).
NGN2 overexpression generates early glutamatergic neurons at day 4
We used ioGlutamatergic line cells with NGN2 optimized inducible overexpression to allow for rapid and reliable generation of NGN2-induced neurons (NGN2-iNs) upon treatment with doxycycline (Figure 2A) (36, 42). We first validated whether the ioGlutamatergic line expresses relevant markers of glutamatergic neurons after the activation of the NGN2 gene. By day 7 of differentiation, the cells express the pan-neuronal marker microtubule-associated protein 2 (MAP2) and excitatory presynaptic marker vesicular glutamate transporter 1 (VGLUT1) (Supplementary Figure 1). After 28 days of differentiation >99% of DAPI+ cells were immune-positive for MAP2 and also expressed TBR1, VGLUT1, CAMKIIA, and SV2A, consistent with the generation of forebrain glutamatergic neurons (Supplementary Figure 2). This is consistent with evidence that the majority of mature ioGlutamatergic neurons represent cortical excitatory neurons (42, 43). Analysis was conducted on cells at day 4 of differentiation, hereafter referred to as Day 4 NGN2-iNs. At this developmental timepoint, the NGN2-iNs resemble NPCs or early neurons with synapse growth cones (43), suitable for analysis of synaptic vesicles and synapse development.
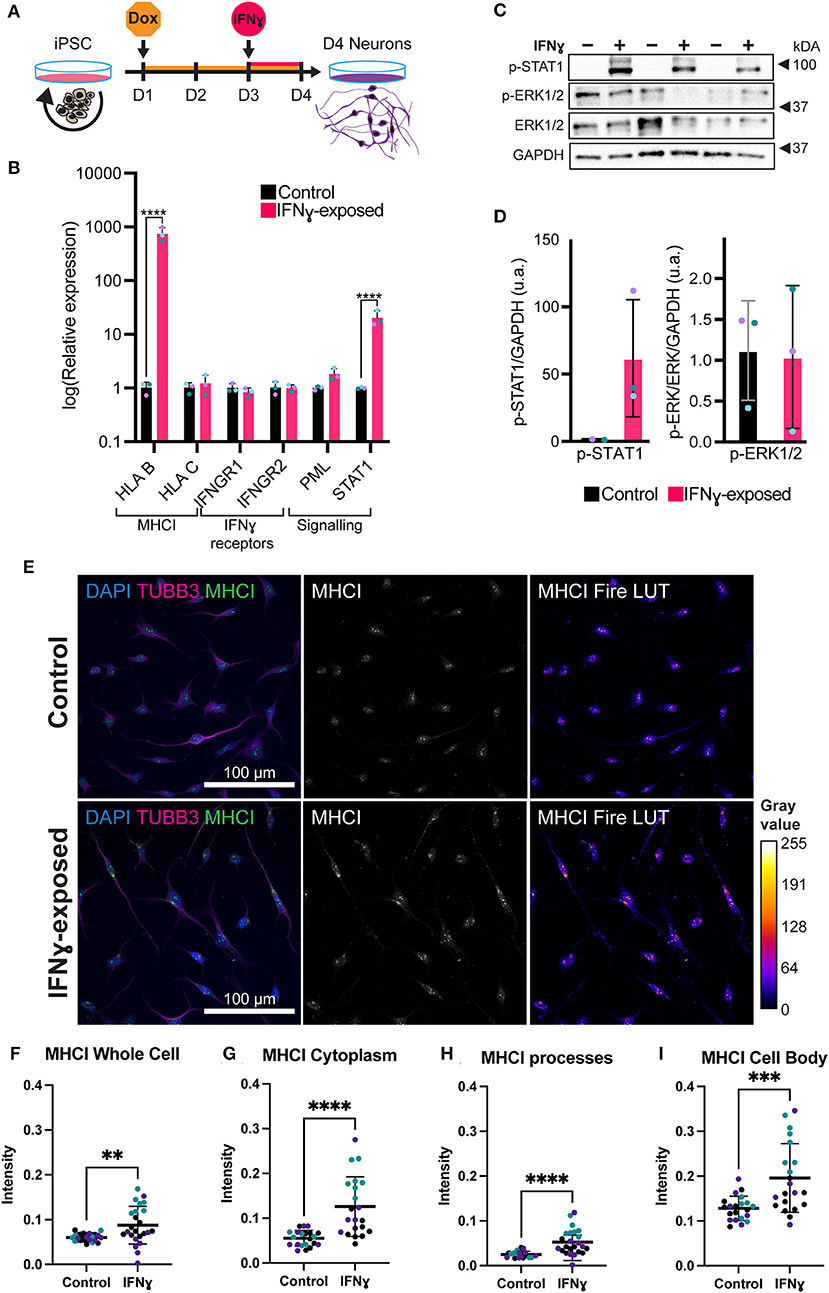
Figure 2. Exposure of neurons to IFNγ results in increased MHCI. (A) Schematic of Opti-OX neural induction and IFNγ exposure at day 3 for 24 h. (B) Bar graphs of relative expression of selected IFNγ signaling-related genes, showing increased HLA-B and C4A expression in IFNγ-exposed neurons. The bars indicate the log(2−ΔΔCt), which indicates the expression relative to housekeepers and normalized to the housekeepers of the control samples (See methods for details.) Expression in Day 4 NGN2-iNs exposed at day 3. N = 3. **** indicates P < 0.0001, *** indicates P = 0.000291 (unpaired t-test). (C) Western blot for p-STAT1, p-ERK1/2, ERK1/2, and GAPDH protein in Day 3 NGN2-iNs exposed to IFNγ (+) or vehicle (-) at day 3 for 15 min. Three biological replicates with different passage numbers are shown (D) Quantification of p-STAT1 and p-ERK1/2 blots shown in (C). The different data point colors represent biological replicates with different passage numbers. (E) ICC for MHCI. The top row shows control cells, the bottom row shows cells exposed to IFNγ at day 3 for 24hrs. The MHCI Fire LUT pseudo color shows higher intensity with warmer colors and lower intensity with cooler colors. The gray values corresponding to the colors are shown on the calibration bar on the right. (F–I) Scatter plots of MHCI intensity in control and IFNγ-exposed neurons. The horizontal bars represent the mean, the error bars represent the standard deviation. Each point in the intensity plots represents the mean intensity of one field of view i.e., image, of the respective object. The different data point colors represent biological replicates with different passage numbers. The IFNγ and control were compared using an unpaired T-test, where N = 3 and ****indicates P < 0.0001, ***indicates 0.001 <P>0.001, **indicates 0.001 <P>0.01.
We characterized Day 4 NGN2-iNs using immunocytochemistry (ICC) and quantitative PCR (qPCR). We stained for the post-mitotic neuron marker neuronal nuclei antigen (NeuN) and mature neuron marker microtubule-associated protein 2 (MAP2) and the neuroprogenitor markers nestin (NES) and PAX6. In addition, staining was conducted for the early neuron/late progenitor marker Class III β-Tubulin (TUBB3). Qualitatively, all imaged Day 4 NGN2-iNs expressed both the neuroprogenitor markers nestin and PAX6 and the neuronal markers NeuN and MAP2 (Supplementary Figure 3), indicating that the Day 4 NGN2-iNs represent early post-mitotic neurons. Morphologically, the Day 4 cells had extensive processes, and some resembled young neurons with a pyramidal cell body. Other cells had a bipolar neuroprogenitor-like morphology (Supplementary Figure 3).
qPCR for the neuronal markers NeuN, TBR1, and MAP2 and the neuroprogenitor markers nestin and PAX6 (Supplementary Figure 3) shows that neural genes had a higher expression level compared to the progenitor genes, in particular TBR1 and NeuN were highly expressed. Overall, these results indicate that Day 4 NGN2-iNs resemble early neurons.
Acute IFNγ signals through a canonical signaling pathway in NGN2-iNs
In neurons, IFNγ is thought to signal via a signal transducer and activator of transcription 1 (STAT1)-dependent pathway, which in turn regulates the transcription of target genes (44). We thus tested whether IFNγ signaled through this canonical pathway in NGN2-iNs (Figures 2C,D). First, we assessed phosphorylated STAT1 levels following 15 min of IFNγ exposure. As expected, we observed increased phosphorylation of STAT1 in NGN2-iNs after 15 min of IFNγ-exposure (Figures 2C,D). No increased phosphorylation of extracellular signal-regulated protein kinase 1/2 (ERK1/2) was observed after 15 min of IFNγ exposure. Consistent with our previous work (28), we further observed an increase in STAT1 and HLA-B expression after 24 h of treatment with IFNγ (Figure 2B). IFNγ treatment has no effect on the expression levels of the IFNγ receptors IFNGR1 and IFNGR2; a trend toward increased expression of PML was also observed (Figure 2B). We further measured the expression of downstream target genes that show a robust response to IFNγ, HLA-B and HLA-C, using qPCR. Of these, HLA-B (t(4)= 27.97, P = 0.00001) was significantly increased in the exposed neurons (Figure 2B). Together, these data indicate that IFNγ is capable of signaling via the canonical STAT1-dependent signaling pathway in NGN2-iNs.
Acute IFNγ-treatment increased MHCI but decreased synapsin I/II expression in NGN2-iNs
We next examined the distribution of MHCI in NGN2-iNs following treatment with IFNγ for 24 h. Under baseline conditions, MHCI localized to the cell body, processes, and growth cones of all Day 4 NGN2-iNs (Figure 2E). Consistent with our previous work (28), IFNγ-exposure caused a higher expression of MHCI in Day 4 NGN2-iNs compared to the control (Figure 2E). There appeared to be increased expression of MHCI in the cell body and increased MHCI localization to the processes in the IFNγ-exposed neurons. Analysis of MHCI in different sub-cellular compartments revealed that mean MHCI expression was increased by 31.2% in the cells as a whole (t(43)= 2.920, P < 0.0001); increased in the cytoplasm by 56.3% (t(40)= 4.723, P < 0.0001); cell body by 34.6% (t(40)= 3.819, P = 0.0005); and in neurite processes by 52.5% (t(40)= 4.331, P < 0.0001) (Figures 2F–I). MHC I intensity in the nucleus was not significantly different (t(43)= 1.937, P = 0.06). No change in neurite morphology was observed 24 h after IFNγ exposure (Supplementary Figure 4).
Given the effects of IFNγ on synaptic genes and particularly on synaptic vesicle mechanisms, we next directly tested the effect of acute IFNγ exposure on the synaptic vesicle regulators synapsin I and II, in Day 4 NGN2-iNs. Synapsin was selected as an early synaptic marker, since this protein is expressed in NPCs and colocalizes with constitutively recycling vesicles along the whole surface of developing axons that then localize to forming synapses (45, 46). In day 4 NGN2-iNs, synapsin I/II staining was localized to the cell body, processes, and growth cones (Figure 3A). Staining was particularly evident in the cell body, with synapsin I/II asymmetrically localized within the shaft of one process in many neurons (Figure 3A), presumably in vesicles being transported to the processes (Figure 3A, arrowhead). Synapsin I/II was primarily localized to the cytoplasm of the cell body. There were also sparse puncta of synapsin I/II within cell processes. Expression of synapsin at day 4 is thus primarily in the cell body of all cells.
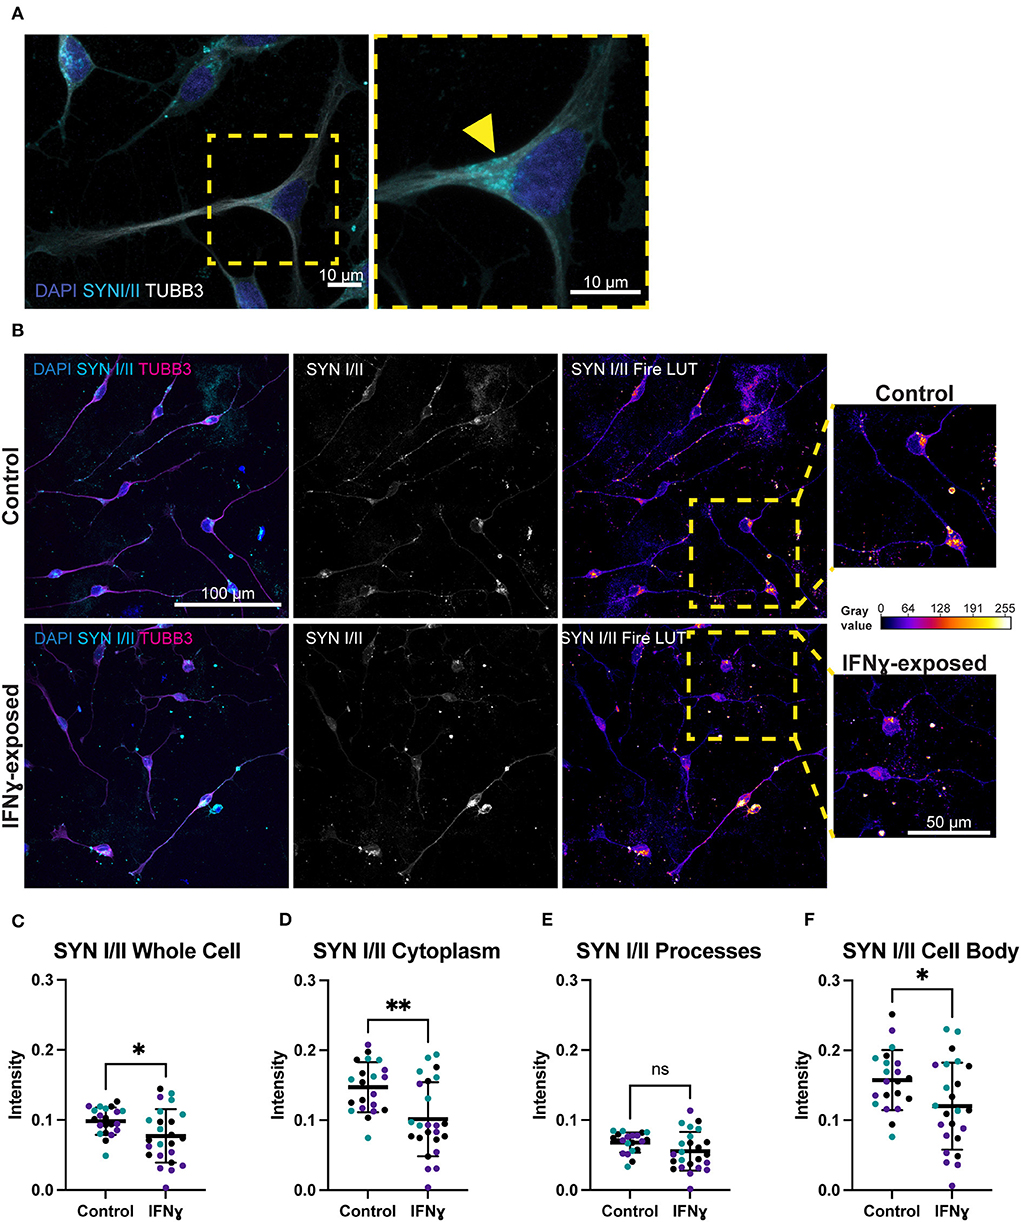
Figure 3. Exposure of neurons to IFNγ results in decreased SYNI/II intensity in the cell bodies of some cells. (A) Characteristic localization of synapsin I/II in the cell body. Right image shows a detailed view of the highlighted region. The arrowhead indicates apparent synapsin vesicles within the cytoplasm. (B) IHC for synapsin I/II. The top row shows control cells, the bottom row shows cells exposed to IFNγ at day 3 for 24hrs. The SYN1 Fire LUT pseudo color shows higher intensity with warmer colors and lower intensity with cooler colors. Detailed view shown on right. The gray values corresponding to the colors are shown on the calibration bar on the right. (C–F) Scatter plots of synapsin I/II intensity in control and IFNγ-exposed neurons. The horizontal bars represent the mean, the error bars represent the standard deviation. Each point in the intensity plots represents the mean intensity of one field of view i.e., image, of the respective object. The different data point colors represent biological replicates with different passage numbers. The IFNγ and control were compared using an unpaired t-test, where N = 3 and **indicates d0.001 <P>0.01, *indicates 0.01 <P>0.05, and ns indicates P ≥ 0.05 (not significant).
In contrast to the effects on MHCI, synapsin I/II appeared to be decreased in IFNγ-exposed neurons. Specifically, the asymmetrically localized clusters of synapsin I/II vesicles in the shaft and cell body appeared reduced in some exposed neurons, while others had intensity that is similar to control neurons (Figure 3B). Quantification showed that synapsin I/II expression was decreased in the whole cell by 21.6% (t(43)= 2.303, P = 0.0261), cell body by 23.7% (t(43)= 2.300, P = 0.0263), and cytoplasm by 31.1% (t(43)= 3.339, P = 0.0017) (Figures 3C–F). The mean intensity difference in IFNγ-exposed processes was not statistically significant (t(43)= 1.840, P = 0.0726, unpaired t-test) (Figure 3E). These results show that IFNγ increases MHCI in Day 4 NGN2-iNs but has an inverse effect on synapsin I/II, which decreases in the cytoplasm and cell body. Cytoplasmic synapsin I/II and MHCI expression in single cells are positively correlated in the vehicle condition (r = 0.57, n = 306), which did not change (P = 0.1471, z = 1.45) in the IFNγ-exposed condition (r = 0.49, n = 389).
Synaptic gene expression is unaltered in IFNγ-exposed neurons
We next were interested in understanding whether an acute exposure to IFNγ was sufficient to alter the expression of genes encoding for synaptic genes. Since synapsin I/II decreases in the cell body following IFNγ treatment, we first tested whether expression of synapsin I and other synaptic genes would be decreased following IFNγ treatment. The mean expression level for SYN1, DLG4, SV2A, and GRIN1 were not significantly different from vehicle conditions (Figure 4A). However, when we examined C4A, we observed an significant increase in expression of this gene (t(4)= 11.84, P = 0.000291). We validated these findings using dual SMAD inhibition differentiated 127_CTM iPSC line NPCs exposed to IFNγ at day 26 to ensure that the observed effects were not cell line specific. As seen in treated NGN2-iNs, IFNγ caused an increase in HLA-B (t(4)= 22.53, P = 0.000023) and C4A expression (t(4)= 6.466, P = 0.002947) in treated NPCs (Figure 4B). No change in IFNG receptor expression or of synaptic genes was observed (Figure 4B).
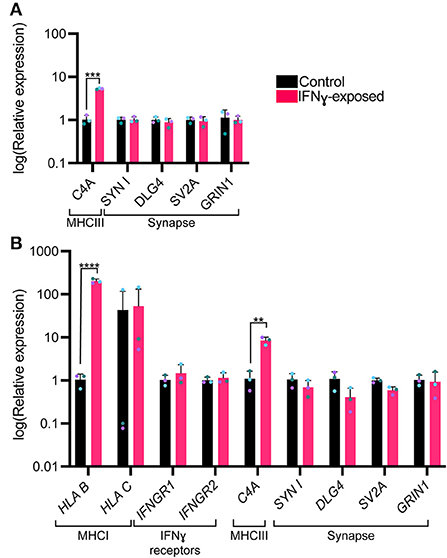
Figure 4. Bar graphs of relative expression of selected synaptic genes and C4A, showing increased C4A expression in IFNγ-exposed neurons. The bars indicate the log(2−ΔΔCt), which indicates the expression relative to housekeepers and normalized to the housekeepers of the control samples (See methods for details.) (A) Expression in Day 4 NGN2-iNs exposed at day 3. N = 3. ****indicates P < 0.0001, ***indicates P = 0.000291 (unpaired t-test). (B) Expression in day 27 conventionally differentiated 127_CTM iPSC line NPCs exposed at day 26. ****indicates P < 0.0001, **indicates P = 0.002947(unpaired t-test). The bar represents the mean, the error bars represent the standard deviation. Points of the same color represent the same biological replicate.
Discussion
In this study, we used NGN2-iNs to study the impact of acute IFNγ exposure on immature developing glutamatergic neurons. We find that IFNγ activates an interferon-mediated canonical signaling pathway in the absence of glial cells and demonstrate that synaptic protein expression is disrupted by this cytokine, building on previous studies showing IFNγ affects expression of synaptic genes in iPSC-NPCs and neurons (28).
The observation that acute IFNγ exposure reduced synapsin I/II expression and increased MHCI expression in immature glutamatergic neurons is consistent with previously published findings. For example, Glynn et al. (31) found an increased density of clusters of synaptic vesicles containing synapsin I upon siRNA knockdown of an MHCI subunit and observed significantly decreased synapsin I at inhibitory synapses when MHCI was overexpressed in rodent neurons. The decrease in synapsin observed in our study is therefore likely linked to the concurrently increased MHCI expression, although we observed a positive correlation between synapsin I/II and MHCI intensity at the single-cell level. Decreased synapsin may translate to disruptions in synapses subsequently, as synapsin is important for synapse maturation, including the correct localization of synaptic vesicles in growth cones and the regulation of vesicle recycling rate, although this remains to be tested in NGN2-iNs (46). Of note however, a gene enrichment study comparing both rat (gestational day 15, MIA) whole-brain and post-mortem human brain tissue samples from individuals with autism reported a common downregulation of genes associated with synaptic vesicle exocytosis (47). This is in line with our SynGO analysis of our IFNy RNAseq datatset (28) and the decrease in synapsin associated with synaptic vesicles observed here. Whether these changes in synaptic protein translate to altered neuronal activity, however, remains to be established. In this context, a previous study suggested that IFNγ treatment of cultured early hippocampal mouse (E15) neurons at 1–4 days in vitro had no effect on excitatory transmission, but did not investigate neither other synapse parameters nor whether treatment of NPCs has an effect (24).
Treatment with IFNγ for 24 h did not alter the expression of selected synaptic genes. This may be due to several possibilities. For example, changes in proteostasis or mRNA turnover may drive changes in protein levels without affecting mRNA levels. The observed changes in protein levels may reflects a transient change in mRNA expression that is no longer detectable after 24 h. The increase in MHCI gene and protein expression following IFNγ exposure matches our findings in a previous neuroprogenitor cell study that used the same 24-h acute IFNγ exposure of iPSC-NPCs and -neurons (28). This study also described upregulation of HLA-C and HLA-B expression; however, we only observed a significant increase in HLA-B. Consistent with our previous study, we observed no change in the expression of IFNγ receptors. MHCI is known to be involved in synaptic plasticity and learning (29, 30, 48, 49) and is important for negatively regulating synapses (50). Dysregulation of MHCI expression could thus potentially be sufficient for a downstream disruption of synapses even if no change in synaptic genes is present at the point of IFNγ exposure. MHCI has been shown to mediate reduced synaptic connectivity in a mouse MIA model by signaling through myocyte enhancer factor 2 (MEF2) (32). Future work would need to establish whether these changes in MHCI expression persist, if MEF2 is involved and whether other downstream changes arise as the neurons mature.
We also observed increased expression of the complement component C4A after acute IFNγ exposure. C4A mRNA levels are increased in post-mortem cortical brain tissue from individuals with schizophrenia and C4A variants are associated with elevated risk for schizophrenia (35). The genes downregulated upon increased C4A expression are also enriched for schizophrenia risk (51). C4A is expressed by neurons and colocalizes with synaptic markers and is thought to play a role in the pruning of synapses during brain development and maturation (35). Consistent with this view, overexpression of C4A in mice resulted in behavioral changes of relevance for schizophrenia, reduced cortical synapse density, and increased engulfment of synapses by microglia (52). Inhibition of microglial activity reverses MIA abnormalities, including synapse loss (53). Co-culture studies with microglia are required to understand if IFNγ exposure leads to increased synaptic engulfment by microglia via increased C4A expression. Deletion of C4A could be used to interrogate the role of this protein in the effects of IFNγ in neurons. Co-culture studies with microglia would thus be particularly informative for future IFNγ exposure studies.
We observed activation of the canonical STAT1 signaling pathway following IFNγ exposure but did not observe non-canonical signaling as there was no altered ERK1/2 phosphorylation. This suggests that our observed effects may be mediated by activation of STAT1 signaling, the primary signaling pathway for IFNγ responses (54–56). IFN-γ signaling through JAK/STAT signaling has been observed in vivo in multiple species, with effects that promote GABA-ergic inhibition and regulate neuronal connectivity (57). Further experiments are however required to fully interrogate the dynamics of IFNγ signaling pathways in neurons.
In conclusion, elevated levels of IFNγ were sufficient to activate a canonical interferon-signaling mechanism in immature developing neurons, an increase in MHCI proteins and complement components, and reduced synaptic vesicles in immature glutamatergic neurons. Our findings further support a possible link between IFNγ exposure in immature glutamatergic neurons and cellular phenotypes associated with neurodevelopmental disorders, although further work is needed to understand the mechanistic basis of this link.
Data availability statement
The original contributions presented in the study are included in the article/Supplementary materials, further inquiries can be directed to the corresponding author/s.
Author contributions
DS and AV: conception and design, literature searching, manuscript writing and editing, project supervision, and financial support. AP, RM, LS, LD, and NA: carried out experiments. AP: manuscript writing and editing. All authors approved the final manuscript.
Funding
AP, DS, and AV acknowledge financial support for this study from the Medical Research Council (MRC) Centre grant (MR/N026063/1). AP and RM are in receipt of the MRC-Sackler Ph.D. Programme studentship as part of the MRC Centre for Neurodevelopmental Disorders (Medical Research Council MR/P502108/1). LS was supported by the UK Medical Research Council (MR/N013700/1) and King's College London member of the MRC Doctoral Training Partnership in Biomedical Sciences. LD was supported by a research grant from the University of Pennsylvania Autism Spectrum Program of Excellence awarded to DS. DS was also supported by an Independent Researcher Award from the Brain and Behavior Foundation (formally National Alliance for Research on Schizophrenia and Depression (NARSAD) (Grant No. 25957). AV acknowledges financial support for this study from the National Centre for the Replacement, Refinement and Reduction of Animals in Research (NC/S001506/1).
Acknowledgments
The authors thank Daniel Beglin for his insightful comments on image analysis. The authors also thank the Wohl Cellular Imaging Centre (WCIC) at the IoPPN, Kings College, London, for help with microscopy.
Conflict of interest
Authors AV and DS receive research funding from bit.bio.
The remaining authors declare that the research was conducted in the absence of any commercial or financial relationships that could be construed as a potential conflict of interest.
Publisher's note
All claims expressed in this article are solely those of the authors and do not necessarily represent those of their affiliated organizations, or those of the publisher, the editors and the reviewers. Any product that may be evaluated in this article, or claim that may be made by its manufacturer, is not guaranteed or endorsed by the publisher.
Supplementary material
The Supplementary Material for this article can be found online at: https://www.frontiersin.org/articles/10.3389/fpsyt.2022.836217/full#supplementary-material
References
1. Kepińska AP, Iyegbe CO, Vernon AC, Yolken R, Murray RM, Pollak TA, et al. Schizophrenia and influenza at the centenary of the 1918–1919 Spanish influenza pandemic: mechanisms of psychosis risk. Front Psychiatry. (2020) 11:72. doi: 10.3389/fpsyt.2020.00072
2. Meyer U. Neurodevelopmental resilience and susceptibility to maternal immune activation. Trends Neurosci. (2019) 42:793–806. doi: 10.1016/j.tins.2019.08.001
3. Mueller FS, Polesel M, Richetto J, Meyer U, Weber-Stadlbauer U, Mouse models of maternal immune activation: mind your caging system! Brain Behav Immun. (2018) 73 643–60. doi: 10.1016/j.bbi.2018.07.014
4. Mueller FS, Richetto J, Hayes LN, Zambon A, Pollak DD, Sawa A, et al. Influence of poly(I:C) variability on thermoregulation, immune responses and pregnancy outcomes in mouse models of maternal immune activation. Brain Behav Immun. (2019) 80:406–18. doi: 10.1016/j.bbi.2019.04.019
5. Estes ML, Prendergast K, Macmahon JA, Cameron S, Aboubechara JP, Farrelly K, et al. Baseline immunoreactivity before pregnancy and poly(I:C) dose combine to dictate susceptibility and resilience of offspring to maternal immune activation. Brain Behav Immun. (2020) 88:619–30. doi: 10.1016/j.bbi.2020.04.061
6. Mueller FS, Scarborough J, Schalbetter SM, Richetto J, Kim E, Couch A, et al. Behavioral, neuroanatomical, and molecular correlates of resilience and susceptibility to maternal immune activation. Mol Psychiatry. (2021) 26:396–410. doi: 10.1038/s41380-020-00952-8
7. Coiro P, Padmashri R, Suresh A, Spartz E, Pendyala G, Chou S, et al. Impaired synaptic development in a maternal immune activation mouse model of neurodevelopmental disorders. Brain Behav Immun. (2015) 50:249–58. doi: 10.1016/j.bbi.2015.07.022
8. Weir RK, Forghany R, Smith SE, Patterson PH, Mcallister AK, Schumann CM, et al. Preliminary evidence of neuropathology in nonhuman primates prenatally exposed to maternal immune activation. Brain Behav Immun. (2015) 48:139–46. doi: 10.1016/j.bbi.2015.03.009
9. Zhang Z, Van Praag H. Maternal immune activation differentially impacts mature and adult-born hippocampal neurons in male mice. Brain Behav Immun. (2015) 45:60–70. doi: 10.1016/j.bbi.2014.10.010
10. Giovanoli S, Weber-Stadlbauer U, Schedlowski M, Meyer U, Engler H. Prenatal immune activation causes hippocampal synaptic deficits in the absence of overt microglia anomalies. Brain Behav Immun. (2016) 55:25–38. doi: 10.1016/j.bbi.2015.09.015
11. Pekala M, Doliwa M, Kalita K. Impact of maternal immune activation on dendritic spine development. Dev Neurobiol. (2021) 81:524–45. doi: 10.1002/dneu.22804
12. Onwordi EC, Halff EF, Whitehurst T, Mansur A, Cotel MC, Wells L, et al. Synaptic density marker SV2A is reduced in schizophrenia patients and unaffected by antipsychotics in rats. Nature Commun. (2020) 11:246. doi: 10.1038/s41467-019-14122-0
13. Radhakrishna R, Skosnik PD, Ranganathan M, Naganawa M, Toyonaga T, Finnema S, et al. In vivo evidence of lower synaptic vesicle density in schizophrenia. Mol Psychiatry. (2021) 26, 7690–7698. doi: 10.1038/s41380-021-01184-0
14. Glantz LA, Lewis DA. Decreased dendritic spine density on prefrontal cortical pyramidal neurons in schizophrenia. Arch Gen Psychiatry. (2000) 57:65–73. doi: 10.1001/archpsyc.57.1.65
15. Osimo EF, Beck K, Reis Marques T, Howes OD. Synaptic loss in schizophrenia: a meta-analysis and systematic review of synaptic protein and mRNA measures. Mol Psychiatry. (2019) 24:549–61. doi: 10.1038/s41380-018-0041-5
16. Urakubo A, Jarskog LF, Lieberman JA, Gilmore JH. Prenatal exposure to maternal infection alters cytokine expression in the placenta, amniotic fluid, and fetal brain. Schizophr Res. (2001) 47:27–36. doi: 10.1016/S0920-9964(00)00032-3
17. Garay PA, Hsiao EY, Patterson PH, Mcallister AK. Maternal immune activation causes age- and region-specific changes in brain cytokines in offspring throughout development. Brain Behav Immun. (2013) 31:54–68. doi: 10.1016/j.bbi.2012.07.008
18. Allswede DM, Yolken RH, Buka SL, Cannon TD. Cytokine concentrations throughout pregnancy and risk for psychosis in adult offspring: a longitudinal case-control study. Lancet Psychiatry. (2020) 7:254–61. doi: 10.1016/S2215-0366(20)30006-7
19. Rudolph MD, Graham AM, Feczko E, Miranda-Dominguez O, Rasmussen JM, Nardos R, et al. Maternal IL-6 during pregnancy can be estimated from newborn brain connectivity and predicts future working memory in offspring. Nat Neurosci. (2018) 21:765–72. doi: 10.1038/s41593-018-0128-y
20. Rasmussen JM, Graham AM, Gyllenhammer LE, Entringer S, Chow DS, O'connor TG, et al. Neuroanatomical correlates underlying the association between maternal interleukin 6 concentration during pregnancy and offspring fluid reasoning performance in early childhood. Biol Psychiatry Cogn Neurosci Neuroimaging. (2021) 3:7. doi: 10.1016/j.bpsc.2021.03.007
21. Graham AM, Rasmussen JM, Rudolph MD, Heim CM, Gilmore JH, Styner M, et al. Maternal systemic interleukin-6 during pregnancy is associated with newborn amygdala phenotypes and subsequent behavior at 2 years of age. Biol Psychiatry. (2018) 83:109–19. doi: 10.1016/j.biopsych.2017.05.027
22. Smith SE, Li J, Garbett K, Mirnics K, Patterson PH. Maternal immune activation alters fetal brain development through interleukin-6. J Neurosci. (2007) 27:10695–702. doi: 10.1523/JNEUROSCI.2178-07.2007
23. Lins BR, Hurtubise JL, Roebuck AJ, Marks WN, Zabder NK, Scott GA, et al. Prospective Analysis of the Effects of Maternal Immune Activation on Rat Cytokines during Pregnancy and Behavior of the Male Offspring Relevant to Schizophrenia. eNeuro. (2018) 5. doi: 10.1523/ENEURO.0249-18.2018
24. Mirabella F, Desiato G, Mancinelli S, Fossati G, Rasile M, Morini R, et al. Prenatal interleukin 6 elevation increases glutamatergic synapse density and disrupts hippocampal connectivity in offspring. Immunity. (2021) 54:2611–31.e2618. doi: 10.1016/j.immuni.2021.10.006
25. Lesh TA, Careaga M, Rose DR, Mcallister AK, Van De Water J, Carter CS, et al. Cytokine alterations in first-episode schizophrenia and bipolar disorder: relationships to brain structure and symptoms. J Neuroinflammation. (2018) 15:165. doi: 10.1186/s12974-018-1197-2
26. Kim IJ, Beck HN, Lein PJ, Higgins D. Interferon γ induces retrograde dendritic retraction and inhibits synapse formation. J Neuroscie. (2002) 22:4530–9. doi: 10.1523/JNEUROSCI.22-11-04530.2002
27. Monteiro S, Roque S, Marques F, Correia-Neves M, Cerqueira JJ. Brain interference: revisiting the role of IFNγ in the central nervous system. Prog Neurobiol. (2017) 156:149–63. doi: 10.1016/j.pneurobio.2017.05.003
28. Warre-Cornish K, Perfect L, Nagy R, Duarte RRR, Reid MJ, Raval P, et al. Interferon-γ signaling in human iPSC–derived neurons recapitulates neurodevelopmental disorder phenotypes. Sci Adv. (2020) 6:9506. doi: 10.1126/sciadv.aay9506
29. Shatz CJ. MHC class I: an unexpected role in neuronal plasticity. Neuron. (2009) 64:40–5. doi: 10.1016/j.neuron.2009.09.044
30. Lee H, Brott BK, Kirkby LA, Adelson JD, Cheng S, Feller MB, et al. Synapse elimination and learning rules co-regulated by MHC class I H2-Db. Nature. (2014) 509:195–200. doi: 10.1038/nature13154
31. Glynn MW, Elmer BM, Garay PA, Liu XB, Needleman LA, El-Sabeawy F, et al. MHCI negatively regulates synapse density during the establishment of cortical connections. Nat Neurosci. (2011) 14:442–51. doi: 10.1038/nn.2764
32. Elmer BM, Estes ML, Barrow SL, Mcallister AK. MHCI requires MEF2 transcription factors to negatively regulate synapse density during development and in disease. J Neurosci. (2013) 33:13791–804. doi: 10.1523/JNEUROSCI.2366-13.2013
33. Shi J, Levinson DF, Duan J, Sanders AR, Zheng Y, Pe'er I, et al. Common variants on chromosome 6p22.1 are associated with schizophrenia. Nature. (2009) 460:753–7. doi: 10.1038/nature08192
34. Ripke S, Neale BM, Corvin A, Walters JTR, Farh KH, Holmans PA, et al. Biological insights from 108 schizophrenia-associated genetic loci. Nature. (2014) 511:421–7. doi: 10.1038/nature13595
35. Sekar A, Bialas AR, Rivera De, Davis H, Hammond A, Kamitaki TR, et al. of the Psychiatric. Schizophrenia risk from complex variation of complement component 4. Nature. (2016) 530:177–83. doi: 10.1038/nature16549
36. Pawlowski M, Ortmann D, Bertero A, Tavares JM, Pedersen RA, Vallier L, et al. Inducible and deterministic forward programming of human pluripotent stem cells into neurons, skeletal myocytes, and oligodendrocytes. Stem Cell Reports. (2017) 8:803–12. doi: 10.1016/j.stemcr.2017.02.016
37. Adhya D, Swarup V, Nagy R, Dutan L, Shum C, et al. Atypical neurogenesis in induced pluripotent stem cells from autistic individuals. Biological Psychiatry. (2021) 89:486–96. doi: 10.1016/j.biopsych.2020.06.014
38. Shum C, Dutan L, Annuario E, Warre-Cornish K, Taylor SE, Taylor RD, et al. Δ9-tetrahydrocannabinol and 2-AG decreases neurite outgrowth and differentially affects ERK1/2 and Akt signaling in hiPSC-derived cortical neurons. Mol Cell Neurosci. (2020) 103:103463. doi: 10.1016/j.mcn.2019.103463
39. Carpenter AE, Jones TR, Lamprecht MR, Clarke C, Kang IH, Friman O, et al. CellProfiler: image analysis software for identifying and quantifying cell phenotypes. Genome Biol. (2006) 7:R100. doi: 10.1186/gb-2006-7-10-r100
40. Livak KJ, Schmittgen TD. Analysis of relative gene expression data using real-time quantitative PCR and the 2(-Delta Delta C(T)) Method. Methods. (2001) 25:402–8. doi: 10.1006/meth.2001.1262
41. Koopmans F, Van Nierop P, Andres-Alonso M, Byrnes A, Cijsouw T, Coba MP, et al. SynGO: an evidence-based, expert-curated knowledge base for the synapse. Neuron. (2019) 103:217–34.e214. doi: 10.1016/j.neuron.2019.05.002
42. Zhang Y, Pak C, Han Y, Ahlenius H, Zhang Z, Chanda S, et al. Rapid single-step induction of functional neurons from human pluripotent stem cells. Neuron. (2013) 78:785–98. doi: 10.1016/j.neuron.2013.05.029
43. Lin HC, He Z, Ebert S, Schörnig M, Santel M, Nikolova MT, et al. NGN2 induces diverse neuron types from human pluripotency. Stem Cell Reports. (2021) 16:2118–27. doi: 10.1016/j.stemcr.2021.07.006
44. Clark DN, Begg LR, Filiano AJ. Unique aspects of IFN-γ/STAT1 signaling in neurons. Immunol Rev. (2022). doi: 10.1111/imr.13092
45. Zakharenko S, Chang S, O'donoghue M, Popov SV. Neurotransmitter secretion along growing nerve processes: comparison with synaptic vesicle exocytosis. J Cell Biol. (1999) 144:507–18. doi: 10.1083/jcb.144.3.507
46. Bonanomi D, Menegon A, Miccio A, Ferrari G, Corradi A, Kao HT, et al. Phosphorylation of synapsin I by cAMP-dependent protein kinase controls synaptic vesicle dynamics in developing neurons. J Neurosci. (2005) 25:7299–308. doi: 10.1523/JNEUROSCI.1573-05.2005
47. Lombardo MV, Moon HM, Su J, Palmer TD, Courchesne E, Pramparo T, et al. Maternal immune activation dysregulation of the fetal brain transcriptome and relevance to the pathophysiology of autism spectrum disorder. Mol Psychiatry. (2018) 23:1001–13. doi: 10.1038/mp.2017.15
48. Datwani A, Mcconnell MJ, Kanold PO, Micheva KD, Busse B, Shamloo M, et al. Classical MHCI molecules regulate retinogeniculate refinement and limit ocular dominance plasticity. Neuron. (2009) 64:463–70. doi: 10.1016/j.neuron.2009.10.015
49. Adelson JD, Sapp RW, Brott BK, Lee H, Miyamichi K, Luo L, et al. Developmental Sculpting of Intracortical Circuits by MHC Class I H2-Db and H2-Kb. Cerebral Cortex. (2016) 26:1453–63. doi: 10.1093/cercor/bhu243
50. Mcallister AK. Major histocompatibility complex I in brain development and schizophrenia. Biol Psychiatry. (2014) 75:262–8. doi: 10.1016/j.biopsych.2013.10.003
51. Kim M, Haney JR, Zhang P, Hernandez LM, Wang LK, Perez-Cano L, et al. Brain gene co-expression networks link complement signaling with convergent synaptic pathology in schizophrenia. Nat Neurosci. (2021) 24:799–809. doi: 10.1038/s41593-021-00847-z
52. Yilmaz M, Yalcin E, Presumey J, Aw E, Ma M, Whelan CW, et al. Overexpression of schizophrenia susceptibility factor human complement C4A promotes excessive synaptic loss and behavioral changes in mice. Nat Neurosci. (2021) 24:214–24. doi: 10.1038/s41593-020-00763-8
53. Ikezu S, Yeh H, Delpech JC, Woodbury ME, Van Enoo AA, Ruan Z, et al. Inhibition of colony stimulating factor 1 receptor corrects maternal inflammation-induced microglial and synaptic dysfunction and behavioral abnormalities. Mol Psychiatry. (2021) 26:1808–31. doi: 10.1038/s41380-020-0671-2
54. Krause CD, He W, Kotenko S, Pestka S. Modulation of the activation of Stat1 by the interferon-γ receptor complex. Cell Res. (2006) 16:113–23. doi: 10.1038/sj.cr.7310015
55. Schindler C, Levy DE, Decker T. JAK-STAT signaling: from interferons to cytokines. J Biol Chem. (2007) 282:20059–63. doi: 10.1074/jbc.R700016200
56. Cossetti C, Iraci N, Mercer TR, Leonardi T, Alpi E, Drago D, et al. Extracellular vesicles from neural stem cells transfer IFN-γ via Ifngr1 to activate Stat1 signaling in target cells. Mol Cell. (2014) 56:193–204. doi: 10.1016/j.molcel.2014.08.020
Keywords: interferon-γ, MHCI, synapsin, iPSC, maternal immune activation, inflammation, C4A, schizophrenia
Citation: Pavlinek A, Matuleviciute R, Sichlinger L, Dutan Polit L, Armeniakos N, Vernon AC and Srivastava DP (2022) Interferon-γ exposure of human iPSC-derived neurons alters major histocompatibility complex I and synapsin protein expression. Front. Psychiatry 13:836217. doi: 10.3389/fpsyt.2022.836217
Received: 15 December 2021; Accepted: 18 August 2022;
Published: 14 September 2022.
Edited by:
Ryan W. Logan, Boston University, United StatesReviewed by:
Anilkumar Pillai, University of Texas Health Science Center at Houston, United StatesStewart Alan Anderson, University of Pennsylvania, United States
Copyright © 2022 Pavlinek, Matuleviciute, Sichlinger, Dutan Polit, Armeniakos, Vernon and Srivastava. This is an open-access article distributed under the terms of the Creative Commons Attribution License (CC BY). The use, distribution or reproduction in other forums is permitted, provided the original author(s) and the copyright owner(s) are credited and that the original publication in this journal is cited, in accordance with accepted academic practice. No use, distribution or reproduction is permitted which does not comply with these terms.
*Correspondence: Anthony Christopher Vernon, YW50aG9ueS52ZXJub25Aa2NsLmFjLnVr; Deepak Prakash Srivastava, ZGVlcGFrLnNyaXZhc3RhdmFAa2NsLmFjLnVr