 Emre Umucu
94% of researchers rate our articles as excellent or good
Learn more about the work of our research integrity team to safeguard the quality of each article we publish.
Find out more
ORIGINAL RESEARCH article
Front. Psychiatry, 26 October 2022
Sec. Social Psychiatry and Psychiatric Rehabilitation
Volume 13 - 2022 | https://doi.org/10.3389/fpsyt.2022.1020232
Higher education is a critical public health tool to achieve economic success, upward mobility, and improved quality of life. Yet, certain groups of students, including student veterans with and without disabilities (SVDs), are at high risk for course failure and dropout, partially due to challenges related to college adjustment. The purpose of this study is to develop a new college adjustment index score for SVDs. We had a total of 4 different research studies to examine the psychometric properties of our college adjustment index score. After conducting a series of psychometric analyses, we selected a total of 18-items. This 18-item tool may help clinicians and researchers conceptualize college adjustment among students through the lens of integrative Tinto’s model and positive psychology approaches. Our psychometric analyses revealed that this index tool is brief, reliable, and valid tool to capture college adjustment in SVDs.
Higher education is a critical public health tool to achieve economic success, upward mobility, and improved quality of life (1–3). This stance aligns well with research documenting that education increases average lifetime earnings, societal contributions, healthier lifestyle, and reduces poverty, tendency to commit crimes, and unemployment (4). Yet, certain groups of students, including student veterans with and without disabilities (SVDs), are at high risk for course failure and dropout, and this problem can be attributed to transitioning difficulties from military to civic life and then to college, experiencing severe disabilities and chronic conditions associated with military service, and facing with high levels of academic, social, financial, and psychosocial stressors (5–10).
Although the post–9/11 GI Bill helps many Veterans with disabilities attend school, more than 50% of SVDs are first-generation college students with minimal academic preparation compared to traditional civilian students so that SVDs experience additional challenges in coping with higher education demands (11). Many SVDs also experience academic-, transition-, and disability-related challenges and stressors, which is a significant rehabilitation, education, and public health concern (12). Literature has well-documented that factors contributing to college life and adjustment can be complex and cannot be reduced to a single factor, such as academic problems (8). For example, one research reported that college adjustment can be conceptualized as the absence of common problems (i.e., academic problems, psychological and physical health problems, substance use problems, and interpersonal relationship problems) (13). Similarly, Baker et al. (14) reported that college life adjustment consists of four subfactors including academic adjustment, social adjustment, personal-emotional adjustment, and goal commitment/institutional adjustment. The consensus is that college adjustment is a multidimensional concept with multiple components.
Like any traditional student, SVDs also experience substantial challenges related to their college adjustment [e.g., (15, 16)]. However, the magnitude of negative effects of these challenges could be stronger due to unique military-related experiences. For example, due to their previous military service, SVDs may start college later in their life, creating a significant age difference between civilian students and SVDs, which ultimately increase psychosocial and academic challenges among SVDs (5, 17, 18). Literature revealed that student veterans are more likely to be older than the 18–22 years of traditional college-age (19). In addition to age differences, unstructured college environment may be difficult to adjust for SVDs after spending time in a structured military environment. Finally, SVDs could be a transfer or part-time student or could work part-time or full-time, which all can affect their college adjustment (19, 20).
In addition to challenges and stressors reported above, disability/ies and chronic conditions associated with deployment may further negatively affect college life in SVDs (5, 12). Previous research has well-documented that physical, cognitive, and psychiatric disabilities are very common in student veterans (5, 8, 16, 17, 21–25). One research revealed that 46% of student Veteran reported having PTSD-related symptoms (21). Thomas et al. (26) reported that a significant amount of student veterans (44%) reported an existing diagnosis. Suicidal ideation is also common among student Veterans, with up to 46% of student service members/Veterans reported lifetime incidence of suicidal ideation (15, 21, 27). Besides, research revealed that 35% of student veterans experienced severe anxiety and 24% experienced severe depression (21). The 2020 Student Veterans of America Census Survey revealed that 64.5% of student veterans reported having a VA disability rating and about 4% were in the process of submitting a disability claim (22). Same survey also revealed that more than 50% of these SVDs had a 70% or more VA disability rating (22). Besides, about 75% of these disabled student veterans reported that their school was impacted by their disability (22).
Overall, literature revealed that disability and disability-related symptoms significantly increase academic and career related concerns (e.g., course dropout), substance use problems (e.g., alcohol abuse), relationship problems (e.g., social isolation, loneliness), physical health concerns (e.g., insomnia), and psychological health problems (e.g., depression) in student veterans (5, 21, 22), which may cause dropout and/or late or no academic degree, and eventually poor employment and wellbeing outcomes.
The majority of literature on higher education success focuses on academic aspects of higher education and underestimate emotional aspects of college life, which is problematic given emotional health, or we call “emotional immunity” is a critical aspect of college and academic success (28, 29). In a meta-analysis study, researchers found that psychosocial health scores (e.g., stress) were correlated with GPA (30). One research, interestingly, reported that “depressive symptoms,” “exposure to stressful life,” and “antisocial behaviors” were three consistent predictors of student retention (31). Besides, Robbins et al. (31) also highlighted the importance of protective factors (e.g., social support) in college retention. Researchers also found that academic achievement was negatively correlated with depression and anxiety and positively correlated with gratitude, social connectedness, and life satisfaction (32). Renshaw et al. (32) also reported that emotional wellbeing is a strong predictor of college student outcomes.
Since emotional injuries (e.g., PTSD) are as common as physical injuries in student veterans (5, 16, 18, 19), the majority of research has focused on psychopathology and symptomology in SVDs (8). Due to any symptom (e.g., negative emotions) associated with a service-connected disability and chronic condition (e.g., TBI), SVDs may have difficulties in completing their academic assignments, participating in school activities, and building positive relationships [e.g., (5, 16)]. Emotional immunity or strengths have not been examined thoroughly in SVDs, which is problematic to identify protective emotional factors in this sample.
Recent research examined emotions and wellbeing in SVDs disabilities and reported that higher levels of emotional character strengths were associated with higher levels GPA, optimism, hope, and resilience and lower levels of loneliness, depression, anxiety, and stress in this population (8). Researchers also examined whether pillars of wellbeing mediate the relationship between PTSD and college life adjustment and reported that positive emotions and accomplishment mediated the relationship between PTSD and college life in SVDs (12). One research examined flourishing as an emotional concept and reported that those with higher levels of flourishing had higher levels of resilience, life satisfaction, and wellbeing and lower levels of stress, anxiety, and depression in SVDs (33). Previous research, overall, revealed that emotional strengths and immunity should be carefully screened and measured in this body of students to further help them achieve their psychosocial and education goals.
Student veterans with and without disabilities experience high levels of psychosocial and academic stressors and challenges; however, SVDs are not aware of their disabilities; are not seeking help; or do not have access to seek help (9, 34). SVDs may perceive help-seeking as a weakness, a challenge for their self-esteem, and a sense of inadequacy, thus increasing self-stigma to seeking mental health services (35). In addition, due to negative beliefs about mental health and treatments, SVDs may have high levels of treatment non-compliance and non-adherence (8, 36, 37). Due to lower levels of help-seeking behaviors, untreated disability symptoms in addition to academic stressors often compromise stability, prevent SVDs from successfully graduating from college and ultimately limits the their success (8, 33, 38–40). This is very concerning given lower levels of educational attainment is closely associated with increased rates of unemployment and poverty, creating significant health disparities and challenges for SVDs (41).
Student veterans with and without disabilities may also endorse negative beliefs about treatment approaches (36) given university counseling services heavily focus on treating psychopathology (e.g., depression symptoms), often overlooking the value of strength-based counseling (e.g., increasing positive emotions). This may reinforces the negative stereotypes about interventions given veteran culture highly endorses core values of toughness and strengths (42). Therefore, it is important to measure and understand whether SVDs are willing to seek help from professionals when they face with psychosocial and academic stressors.
College adjustment has been a major interest among education and psychology researchers. There is a consensus that college adjustment is multidimensional construct and consists of multiple subconstructs [e.g., (13, 14)]. Although this concept has been a major interest among researchers, there are only few scales measuring this construct. First, the Student Adaptation to College Questionnaire (SACQ) (14, 43, 44), one of the most widely used questionnaires, was developed to measure the college adaptation among students. The SACQ consisted of 67-items measuring four subscales named academic adjustment, social adjustment, personal-emotional adjustment, and goal commitment/institutional adjustment. SACQ is not brief and not very accessible due to associated fee. Besides, some researcher reported that “without explicating the theory behind (SACQ)’s development and without clearly defining adjustment other than how well students meet the various role demands, their (44) initial validation efforts provided evidence of criterion related validity” (p.93) (45). Although its certain weaknesses, the SACQ has still been one of the most widely used tool of college adjustment.
Hoffman and Weiss (13) developed an inventory, called the Inventory of Common Problems (ICP), to measure and conceptualize college students’ problems. This scale consists of a total of 24-items measuring six categories of common problems (i.e., depression, anxiety, substance use problems, interpersonal relationship problems, physical health problems, and academic problems) (13). Based on authors’ initial findings, one can claim that the ICP is psychometrically sound and relatively shorter scale. However, authors reported that substance use problems subscale was found to have low reliability and validity compared to other five subscales. Although this scale is shorter than the SACQ, not a clear theoretical orientation was applied when developing the ICP. In addition, like SACQ, this scale also does not cover any help-seeking behaviors among college students which is critical to provide best services to college students.
This study does not aim to create a new scale or index score from scratch, instead we focused on available and widely used tools to create a college adjustment index score. First, we conceptualize college adjustment as an achievement of the final state of highest student–college congruence. The existing scales to measure college adjustment in the education and psychology literature present several limitations. For example, the SACQ captures four domains of the college adjustment, but does not directly assess potential problems experienced by the students. Besides, the SACQ has been widely used only in North American students, limiting its generalizability to other cultures (46). Besides, the SACQ 67-items which is comparatively lengthy if administering the scale in a time-limited clinical and research setting. Furthermore, both the SACQ and ICP did not have a clear theoretical background or orientation on student retention or adjustment while developing items. Given student retention is key in higher education (47), and college adjustment is predictor of retention, we aimed to develop a new, brief, theoretically oriented, and psychometrically sound index score to measure college adjustment in students, including SVDs.
Based on Tinto’s integration framework (47–49), students will not dropout if they are connected and committed to the academic and social life of the institution (50). Tinto (49) reported that although some students are successful to cope with problems of adjusting to the social and intellectual life of the higher education, many find this adjustment measurably more challenging. This adjustment approach is relatively similar to resilience and strengths approach in positive psychology. According to Tinto (51), psychosocial factors play a critical role during college adjustment since they help students integrate in academic and social environment. In their work, Napoli and Wortman (52) extended and further refined Tinto’s model by examining the mediational influences of a comprehensive set of psychosocial measures (e.g., wellbeing) on the constructs within Tinto’s model. Their results revealed that psychosocial measures had both direct and indirect effects on college persistence (52). Although Tinto’s model has widely been applied in education research, no research, to our knowledge, has been examined Tinto’s model for SVDs.
Recently, researchers have also examined whether positive psychology factors are predictors of student retention and academic success in higher education. One research examined resilience, academic self-concept, and college adjustment in college students and reported that resilience and academic self-concept were both significant predictors of college adjustment for college students (53). Another work examined hope and college adjustment and reported that hope was positively related to college adjustment in college students (54). A recent work examined wellbeing, PTSD, and college adjustment in SVDs and reported that positive emotions and sense of accomplishments mediated the relationship between PTSD and college adjustment (12). A similar research (8) reported that emotional strengths were positively associated with GPA in SVDs. Finally, Umucu (39) examined positive psychology model as a college adjustment and wellbeing model for SVD and found that positive psychology is a promising approach for SVDs given it focuses on strengths.
To our knowledge, Tinto’s model and positive psychology has never been used together to examine college adjustment and retention in college students including SVDs. As reported, university counseling services focus on treating psychopathology (e.g., depression symptoms), often overlooking the value of strength-based counseling (e.g., increasing positive emotions). This approach could be problematic given SVDs endorse negative beliefs about treatment approaches, reinforcing the negative stereotypes about interventions given veteran culture highly endorses core values of toughness and strengths (42). Therefore, the purpose of this study is to develop a new college adjustment index score for SVDs.
Upon the IRB approval of the Study 1, the researcher reached out to directors of student veteran programs across the USA to recruit participants. SVDs were recruited from several universities across the country. Participants signed the online consent form before they started the survey. Participants were sent a $15 gift card upon completing the survey. A total of 205 SVDs (Mage = 29.32, SD = 8.02) were recruited for the Study 1. The majority of sample was male (71.7%), white (80.5%), followed by 10.2% Hispanic/Latino, 2.9% African American, 2.4% bi-racial, 1.5% Asian, and 2.5% Other. Forty percent of participants served in the Army, followed by the Air Force (22.4%), Marine Corps (20.5%), Navy (16.6%), and Coast Guard (0.5%). Thirty-nine percent of participants had service-connected disabilities.
The Study 1 was used to generate the item pool from other psychometrically sound and widely used scales. These variables and domains are determined based on our previous work. Positive emotion, engagement, relationships, meaning, and accomplishment were measured by the PERMA-Profiler (55). Each pillar of the wellbeing consists of three-items, totaling 15-items. The reported Cronbach’s alpha for the subscale scores ranged from 0.71 to 0.89 for positive emotion, 0.60 to 0.81 for engagement, 0.75 to 0.85 for relationships, 0.85 to 0.92 for meaning, and 0.70 to 0.86 for accomplishment subscale scores (55). Resilience was measured using the six-item Brief Resilience Scale (BRS) (56). The Cronbach’s alpha for the BRS ranged from 0.80 to 0.91 in previous research (56). Optimism was measured using the six-item of the Life Orientation Task-Revised (LOT-R) (57). The Cronbach’s alpha of the LOT-R has been reported to be 0.78 (57). College problems were measured by the four subscales (i.e., academic problems, interpersonal relationship problems, substance use problems, and physical health problems) of the ICP (13). Each subscale consists of four-items, totaling 16-items. The internal consistency reliability coefficients were found to be 0.71 for academic problems subscale, 0.67 for interpersonal problems subscale, 0.53 for physical health problems subscale, and 0.45 for substance-use subscale (13). Depression and anxiety were measured by the four-item Patient Health Questionnaire for Depression and Anxiety (PHQ-4) (58). The Cronbach’s alpha coefficient for the scale was reported to be 0.85 (58). Stigma related to seeking psychological help was measured with the Self-Stigma of Seeking Help (SSOSH) scale (59). The Cronbach’s alpha reliability coefficient was reported to be 0.91 (59). Please see Table 1 for all items and details.
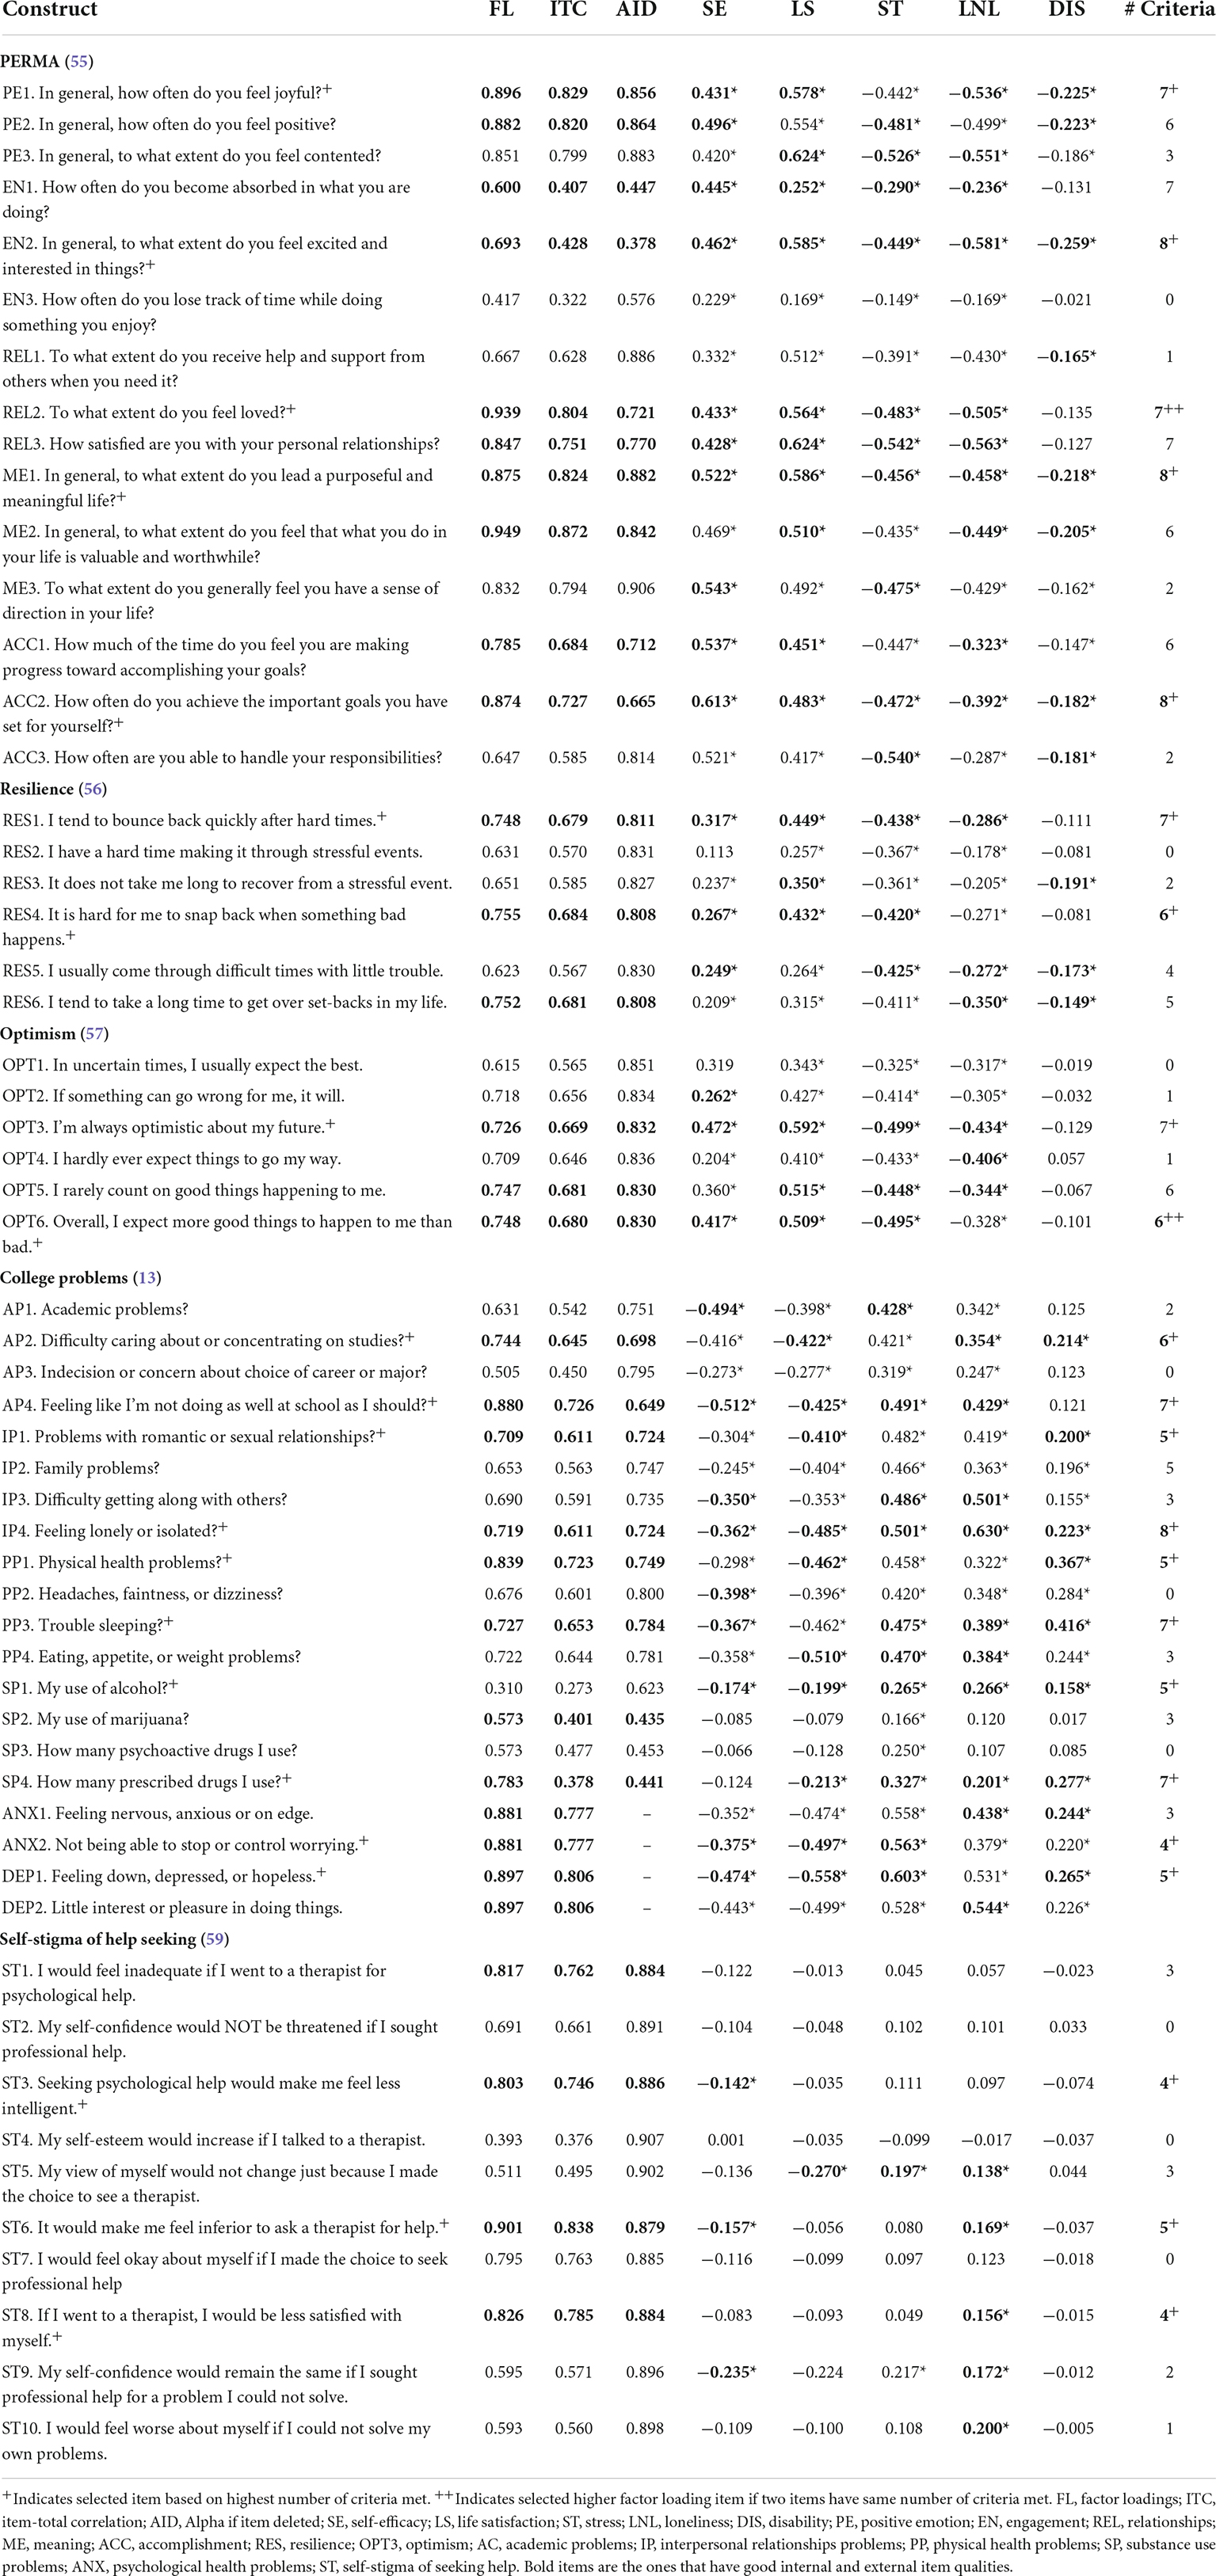
Table 1. Item pool and initial item characteristics.
For the validation purpose, we used other tools as well. GPA was measured using the following single question “What is your current Grade Point Average?” The Self-Efficacy for Academic Milestone Scale; (60) was used to measure self-efficacy. Perceived Stress Scale-4 (PSS-4) (61) was used to measure perceived stress. The PROMIS§ Scale v1.2–Global Health Mental 2a (62) was used to measure mental health quality of life. The Oslo Social Support Scale (63) was used to assess social support.
The Study 2 data, a part of funded large study, was collected from a Hispanic Serving Institution upon IRB approval. The principal investigator (PI) reached out to the Disability Center to collect data. The survey link via Qualtrics was shared electronically by disability office where students have been seeking counseling and accommodation services. All participants completed an online consent form before they started the survey. Participants received a $10 gift card upon completion of the study. We recruited 129 student veterans with disabilities (Mage = 33.05, SD = 8.80). The majority of participants were male (72.9%), white (81.4%), Hispanic (51.9%), and married (50.4%). About 97% of respondents reported they have a service-connected disability rating.
Sociodemographic variables were measured by demographic questionnaire. Grit was measured with the eight-item Grit-S (64). The Cronbach’s alpha coefficient for the Grit-S ranged from 0.83 to 0.84 (64). In the current study, the internal consistency reliability coefficient was found to be 0.69. Mental health QOL was assessed using the PROMIS ® Scale v1.2–Global Health Mental 2a (62). The Cronbach’s alpha coefficient in the present study was computed to be 0.75. Functional limitations were measured using the World Health Organization Disability Assessment Schedule II 12-item version (65). In the current study, the internal consistency reliability coefficient was found to be 0.91. PTSD symptoms were measured using the PTSD Checklist for the DSM-5 (PCL-5) (66). The Cronbach’s alpha coefficient of the PCL-5 in the present study was computed to be 0.95. Dropout decisions were measured using the five-item Intentions to Terminate University Studies or Switch Majors (67). The Cronbach’s alpha coefficient of the scale in the present study was computed to be 0.82. COVID-19 stress was measured using the eight-item Perceived Stress Questionnaire-8 (68), a shorter version of the Perceived Stress Questionnaire-20 (69). The Cronbach’s alpha coefficient of the PSQ-8 in the present study was computed to be 0.83.
After receiving IRB approval for the Study 3, a part of funded large study, we contacted the student veteran office to collect data from participants. The student veteran office shared an online survey link with potential student veteran participants through email and social media. All participants completed an online consent form prior to accessing the survey. The Participants received a $20 gift card upon completion of the survey. For the Study 3, a total of 232 student veterans with PTSD symptoms (Mage = 28.43, SD = 5.42) were recruited for this study. Majority of participants were male (84.5%), White (71.6%), followed by 14.7% Black or African American, 9.9% American Indian or Alaska Native, 1.5% Asian, and 3.9% other. About 26% of student veterans identified themselves as being of Hispanic, Latino, or Spanish origin. Besides, majority of participants had served in the Army (46.6%), were full-time students (60.8%), were working (51.3%), and were using the GI Bill (70.7%). All participants reported that they had experienced a traumatic event, with at least one PTSD symptom measured by the Primary Care PTSD Screen for the DSM-5 (PC-PTSD-5) (70).
Sociodemographic variables were measured by demographic questionnaire. Overall health (i.e., “Overall, how would you rate your–overall health?”) and mental health QOL (i.e., “Overall, how would you rate your–mental health?”) was each measured with a single item. Similarly, participants’ GPA was measured by using a single item (i.e., “What is your current Grade Point Average?”). Functional limitations were measured using the World Health Organization Disability Assessment Schedule 2.0 (WHODAS 2.0) 12-item version (65). The WHODAS 2.0 12-item version was previously used for a veterans sample and demonstrated a strong internal consistency (α = 0.91) in a previous study with a veteran sample (71). The WHODAS 2.0 12-item version scores also demonstrated a strong internal consistency (α = 0.83) in the present study.
The final Study, Study 4, a part of funded large study, was approved by the IRB. Following approval, the PI contacted the disability and accommodation support office at a university located in a Southwest state. The disability and accommodation support office shared the survey link with college students with disabilities through an email invitation. Participants received a $10 USA gift card upon completion of the survey. A total of 105 college students with disabilities were recruited; however, however, we only retrieved the Hispanic participants for this study (n = 89; Mage = 26.13, SD = 8.11). The majority of participants were female (70.8%) and White (76.4%).
Sociodemographic variables were measured by demographic questionnaire. Grit was measured with the eight-item Grit-S (64). In the current study, the internal consistency reliability coefficient was found to be 0.79. Mental health QOL was assessed using the PROMIS® Scale v1.2–Global Health Mental 2a (62). The Cronbach’s alpha coefficient in the present study was computed to be 0.80. Functional limitations were measured using the World Health Organization Disability Assessment Schedule II 12-item version (65). In the current study, the internal consistency reliability coefficient was found to be 0.83. PTSD symptoms were measured using the PTSD Checklist for the DSM-5 (PCL-5) (66). The Cronbach’s alpha coefficient of the PCL-5 in the present study was computed to be 0.96. Dropout decisions were measured using the five-item Intentions to Terminate University Studies or Switch Majors (67). The Cronbach’s alpha coefficient of the scale in the present study was computed to be 0.75. COVID-19 stress was measured using the eight-item Perceived Stress Questionnaire-8 (68), a shorter version of the Perceived Stress Questionnaire-20 (69). The Cronbach’s alpha coefficient of the PSQ-8 in the present study was computed to be 0.87.
The College Adjustment Index was created following Bandalos (72) steps in scale development. The goal of the Study 1 is to identify and create an item pool from previously developed and psychometrically sound measurements. We used following recommended steps to select the psychometrically most sound items from measures (73): (a) internal item qualities (e.g., factor loadings, item-total correlation) and (b) external item qualities (e.g., items’ correlation coefficient with measures of other constructs). Internal item qualities refer to “properties of items that are determined in reference to scale itself” (p.169) (73). External item qualities refer to the relation of an item with measures of other constructs (73).
To select psychometrically most sound items, we selected items from the PERMA-Profiler (55), the BRS (56), the LOT-R (57), the ICP (13), the Patient Health Questionnaire for Depression and Anxiety (58), the Self-Stigma of Seeking Help Scale (59) by evaluating (a) each item’s factor loading, (b) item-total correlation, (c) each item’s effect on the internal consistency reliability of each scale, and (d) correlations with college life constructs.
Regarding internal item qualities, we conducted (a) a series of exploratory factor analysis (EFA) using principal axis factoring to identify factor loadings and (b) a series of item and reliability analysis to identify item-total correlations and each item’s effect on the internal consistency reliability of each scale. Regarding external item qualities, we conducted (a) a series of correlation analysis to identify the relationships between our selected scales’ items and the external correlates e.g., self-efficacy [the Self-Efficacy for Academic Milestone Scale; (60)], life satisfaction [the Satisfaction with Life Scale (SWLS) (74)], stress [the Perceived Stress Scale-4 (PSS-4) (61)], loneliness [the Three-Item Loneliness Scale (75)], and disability (i.e., “Do you have a service-connected disability rating?”).
With Study 2, after identifying item pool from the Study 1, we conducted a series EFA with varimax rotation to identify the factor structure of the index score. Later, we conducted a parallel analysis via “psych” package (76) to identify and verify the number of factors of the index score. fa.parallel plots the eigenvalues for a principal components and the factor solution (76). Similarly, fa.parallel does the same for random matrices of the same size as the original data matrix.
The Study 3 and 4 were used to confirm construct validity of the index. The model structure of our scale was analyzed with a series of confirmatory factor analysis (CFA) via the “Lavaan” and “semPlot” packages (77, 78) for RStudio. We used all studies (Study 1–4) to confirm Study 3 factor structure. The following fit indices were used to evaluate the model fit: χ2 (not significant), the comparative fit index (CFI) (>0.90), Tucker–Lewis index (TLI) (>0.90) the standardized root mean residual (SRMR) (<0.08), and the root mean square error of approximation (RMSEA) (<0.08) (79–81). Finally, all studies were used to calculate internal consistency reliability coefficients and convergent and divergent validity.
We used all four studies to calculate coefficient omegas (ω) and coefficient alphas (α) for the sub scores and the total score. Finally, we run a correlation analysis to calculate divergent and convergent validity of the scale. Before we conducted analyses, we created z scores for all items given items were on different Likert rating scales. All statistical procedures were run via R Studio (82, 83) and SPSS 28.0.
Table 1 demonstrates the detailed findings from the Study 1. Items were sorted based on their factor loadings. Our first criterion was to select items with the highest factor loading, highest item-total correlation, and lowest effect on the internal consistency reliability. After identifying items based on first criterion, we examined each item’s relation with external correlates to further identify psychometrically most sound items. Based on both criteria, we selected (a) a single item from each positive emotion[#PE1, (FL = 0.896; ITC = 0.829; AID = 0.856)], engagement [#EN2, (FL = 0.693; ITC = 0.428; AID = 0.378)], relationships [#REL2, (FL = 0.939; ITC = 0.804; AID = 0.721)], meaning [#ME1, (FL = 0.875; ITC = 0.824; AID = 0.882)], and accomplishment [ACC2, (FL = 0.874; ITC = 0.727; AID = 0.665)], (b) two-items from resilience [#RES1, (FL = 0.748; ITC = 0.679; AID = 0.811) and #RES4, (FL = 0.755; ITC = 0.684; AID = 0.808)], optimism [#OPT3, (FL = 0.726; ITC = 0.669; AID = 0.832) and #OPT6, (FL = 0.748; ITC = 0.680; AID = 0.830)], academic problems [#AP2, (FL = 0.744; ITC = 0.645; AID = 0.698) and #AP4, (FL = 0.880; ITC = 0.726; AID = 0.649)], interpersonal relationship problems [#IP1, (FL = 0.709; ITC = 0.611; AID = 0.724) and #IP4, (FL = 0.719; ITC = 0.611; AID = 0.724)], physical health problems [#PP1, (FL = 0.839; ITC = 0.723; AID = 0.749); and #PP3, (FL = 0.727; ITC = 0.653; AID = 0.784)], substance use problems [#SP1, (FL = 0.310; ITC = 0.273; AID = 0.623) and #SP4, (FL = 0.783; ITC = 0.378; AID = 0.441)], and psychological health problems [#ANX1, (FL = 0.881; ITC = 0.777; AID = NA) and #DEP2, (FL = 0.897; ITC = 0.806; AID = NA)], and (c) three-items from SSOSH [#ST3, (FL = 0.803; ITC = 0.746; AID = 0.886); #ST6, (FL = 0.901; ITC = 0.838; AID = 0.879); and # ST8, (FL = 0.826; ITC = 0.785; AID = 0.884)].
Each selected item was found to have small to large relation with selected external correlates in theoretically oriented direction. Relationships item#2 and item#3 had same criteria score; however, we selected item#2 given it had more optimal internal item qualities (e.g., higher factor loadings). Similarly, optimism item#3 and item#6 had same criteria score; however, we selected item#6 given it had more optimal internal item qualities (e.g., higher factor loadings).
The Study 2 was used to measure factor structure of the scale via a series of EFA. The Kaiser-Meyer-Olkin value was 0.81 indicating a good degree of common variance among the variables and exceeding the minimum recommended value of 0.60 (84). The Bartlett Test of Sphericity was significant [χ2 (231, N = 127) = 1133.16, p < 0.001], indicating that correlations in the data set are appropriate for factor analysis. The Kaiser-Guttman rule (eigenvalue greater than one) was first used to determine the number of factors to be retained, followed by Cattell’s scree (85) test. Although the Kaiser-Guttman rule indicated a potential six factors, Cattell’s scree test yielded a five-factor measurement. Next, we conducted second EFA with five-factor solution. Table 2 represents results of the factor analysis. As a rule of thumb, we removed items that has multiple factor loadings (>0.40), insufficient factor loading (<0.30), and negative factor loading, resulting removing a total of four-items.
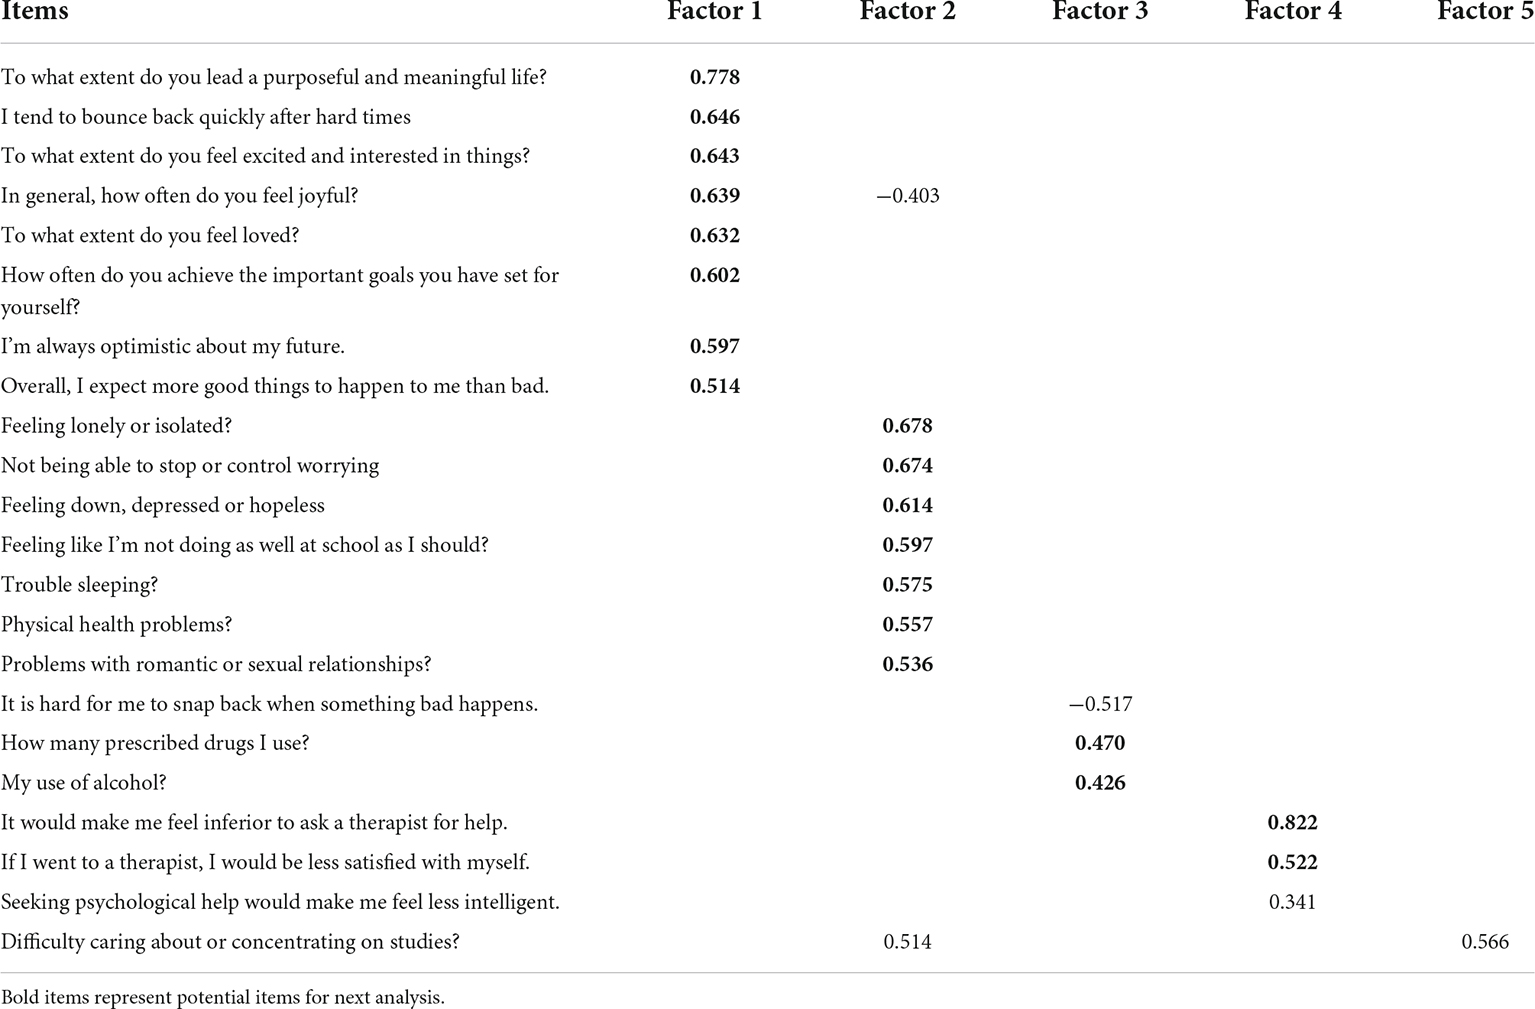
Table 2. Exploratory factor analysis (EFA) results of the student veterans with disabilities.
After removing identified items, we conducted a factor analysis, resulting in a four-factor structure; however, one factor had only one-item so that we run it again with three-factor structure. In order to confirm three-factor structure, we run a parallel analysis. The parallel analysis results yielded a three-factor structure (Please see Figure 1). Results revealed that the Kaiser-Meyer-Olkin value was 0.81 indicating a good degree of common variance among the variables and exceeding the minimum recommended value of 0.81 (84). The Bartlett Test of Sphericity was significant [χ2 (153, N = 127) = 815.36, p < 0.001], indicating that correlations in the data set are appropriate for factor analysis. The first factor was called as emotional immunity with a total of seven-items (e.g., “To what extent do you feel loved?”). The second factor was called as common challenges with a total of nine-items (e.g., “Feeling like I’m not doing as well at school as I should?”). Finally, the last factor was called as help-seeking attitude with a total of two-items (e.g., “It would make me feel inferior to ask a therapist for help.”). See Table 3 for detailed factor loadings.
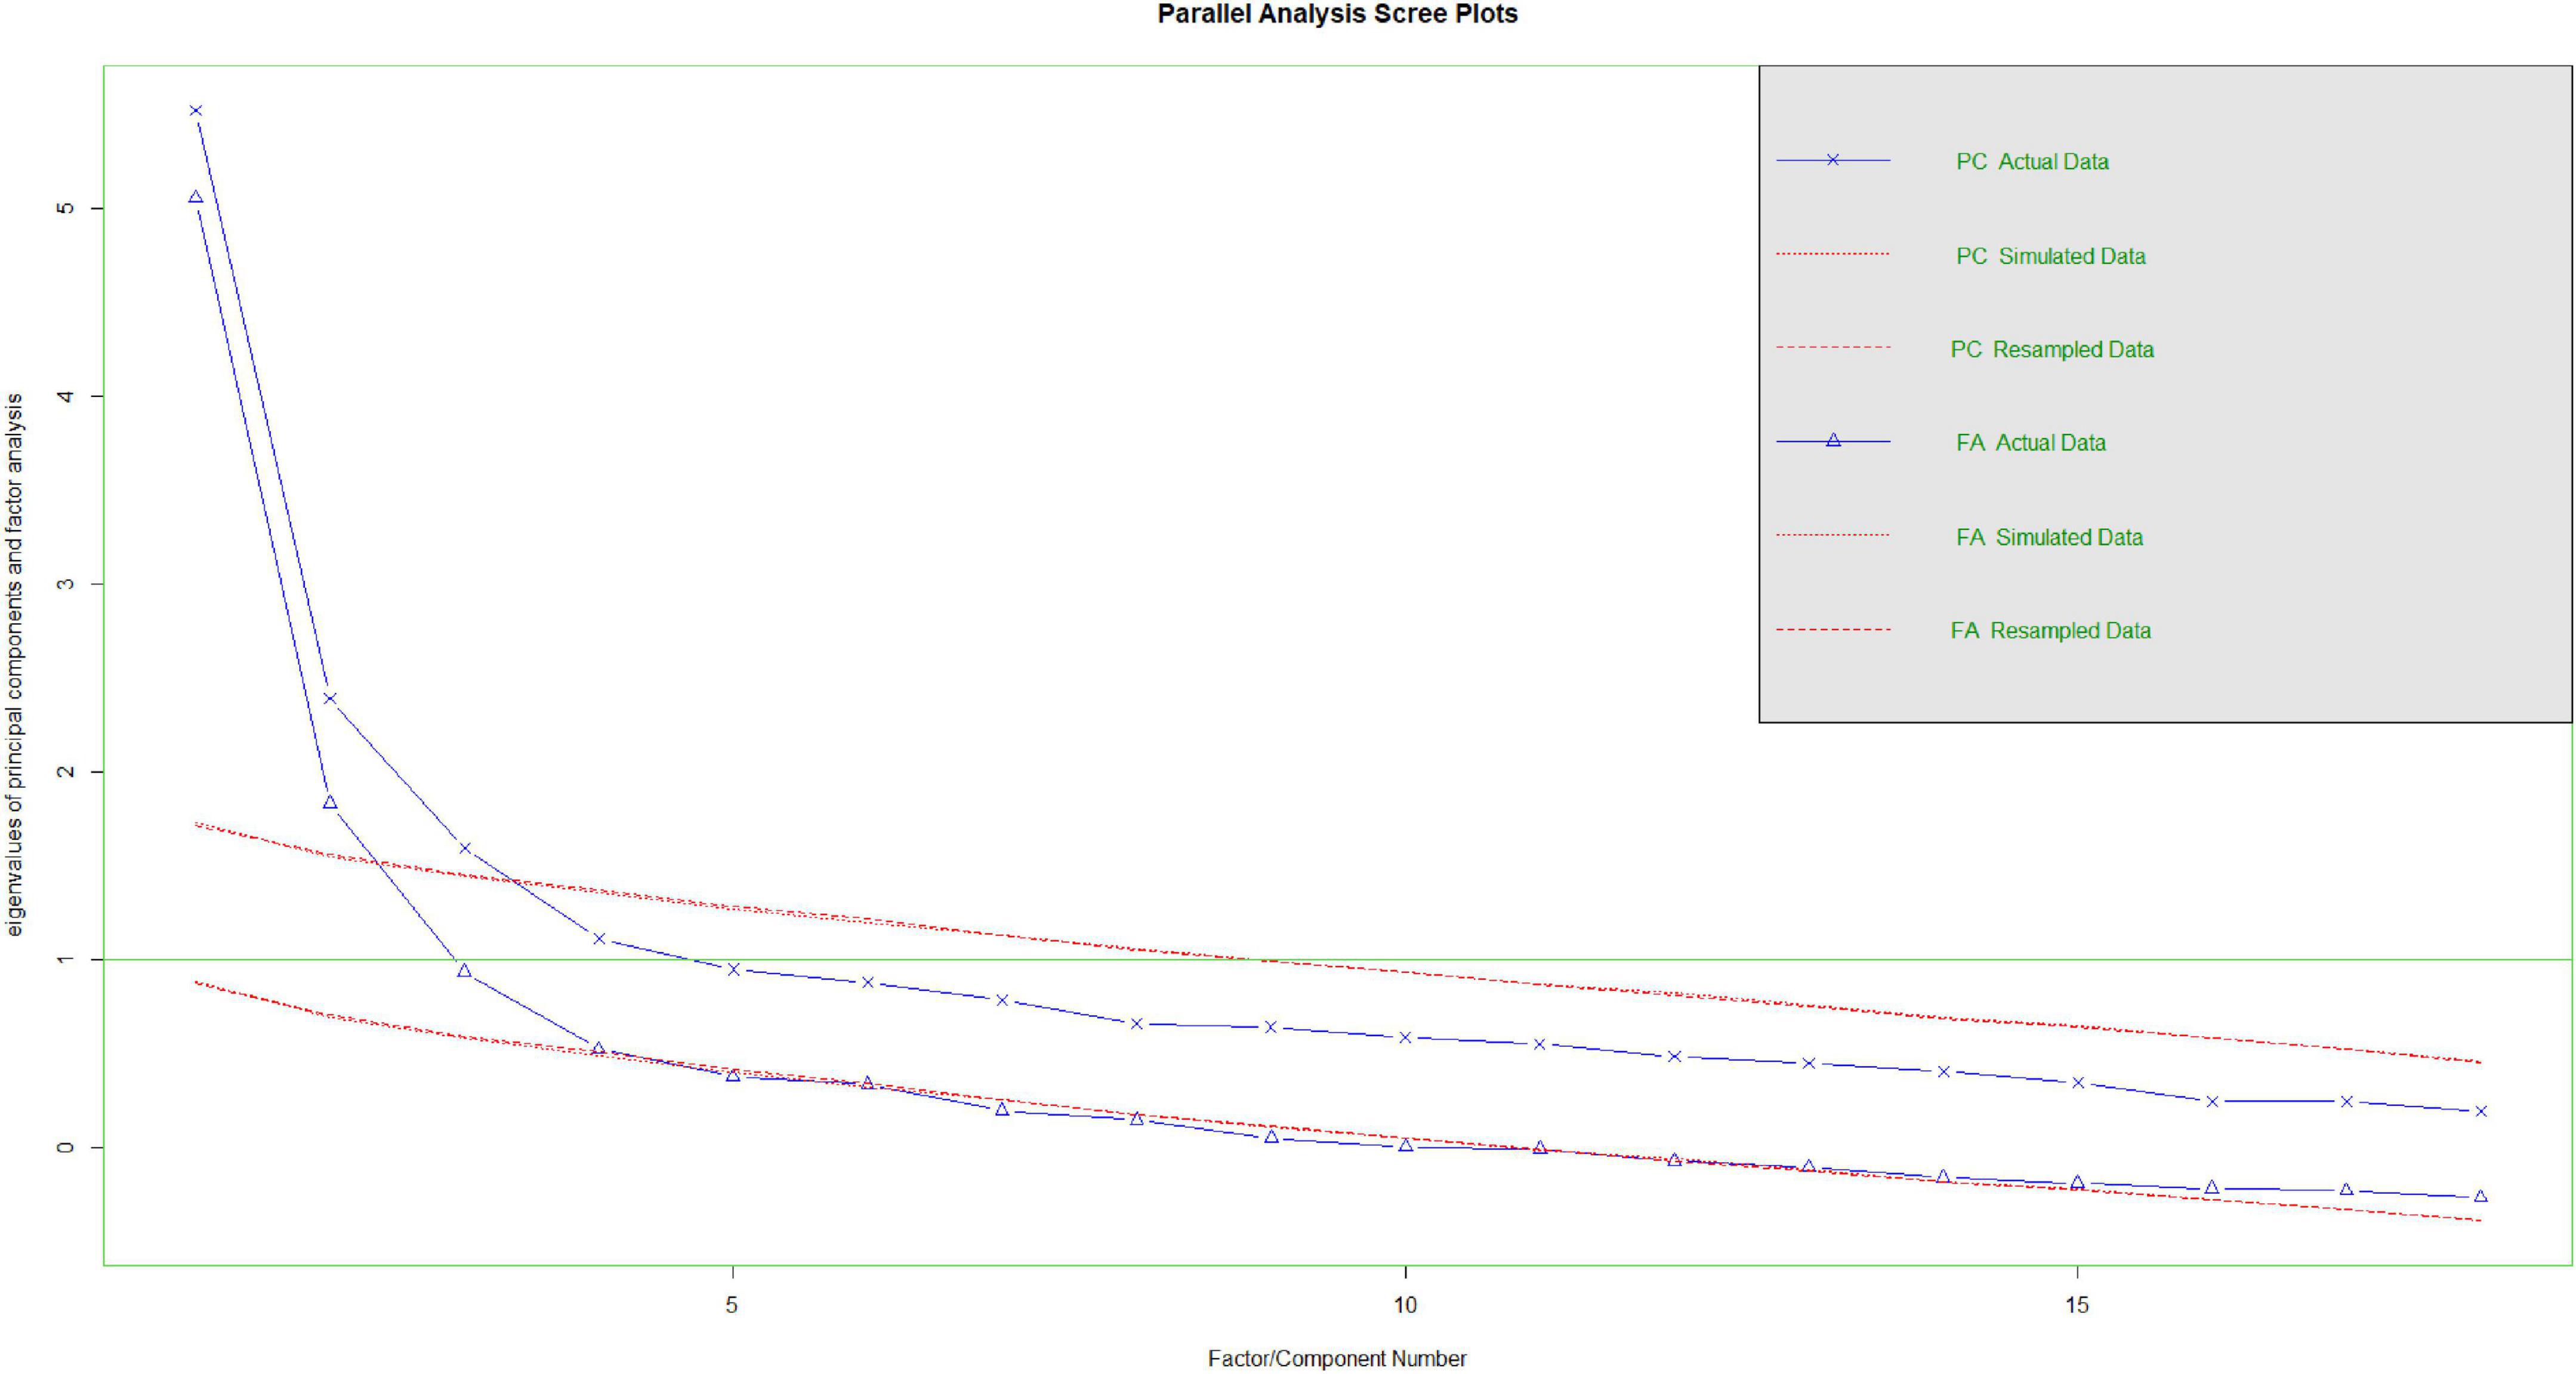
Figure 1. Parallel analysis results.
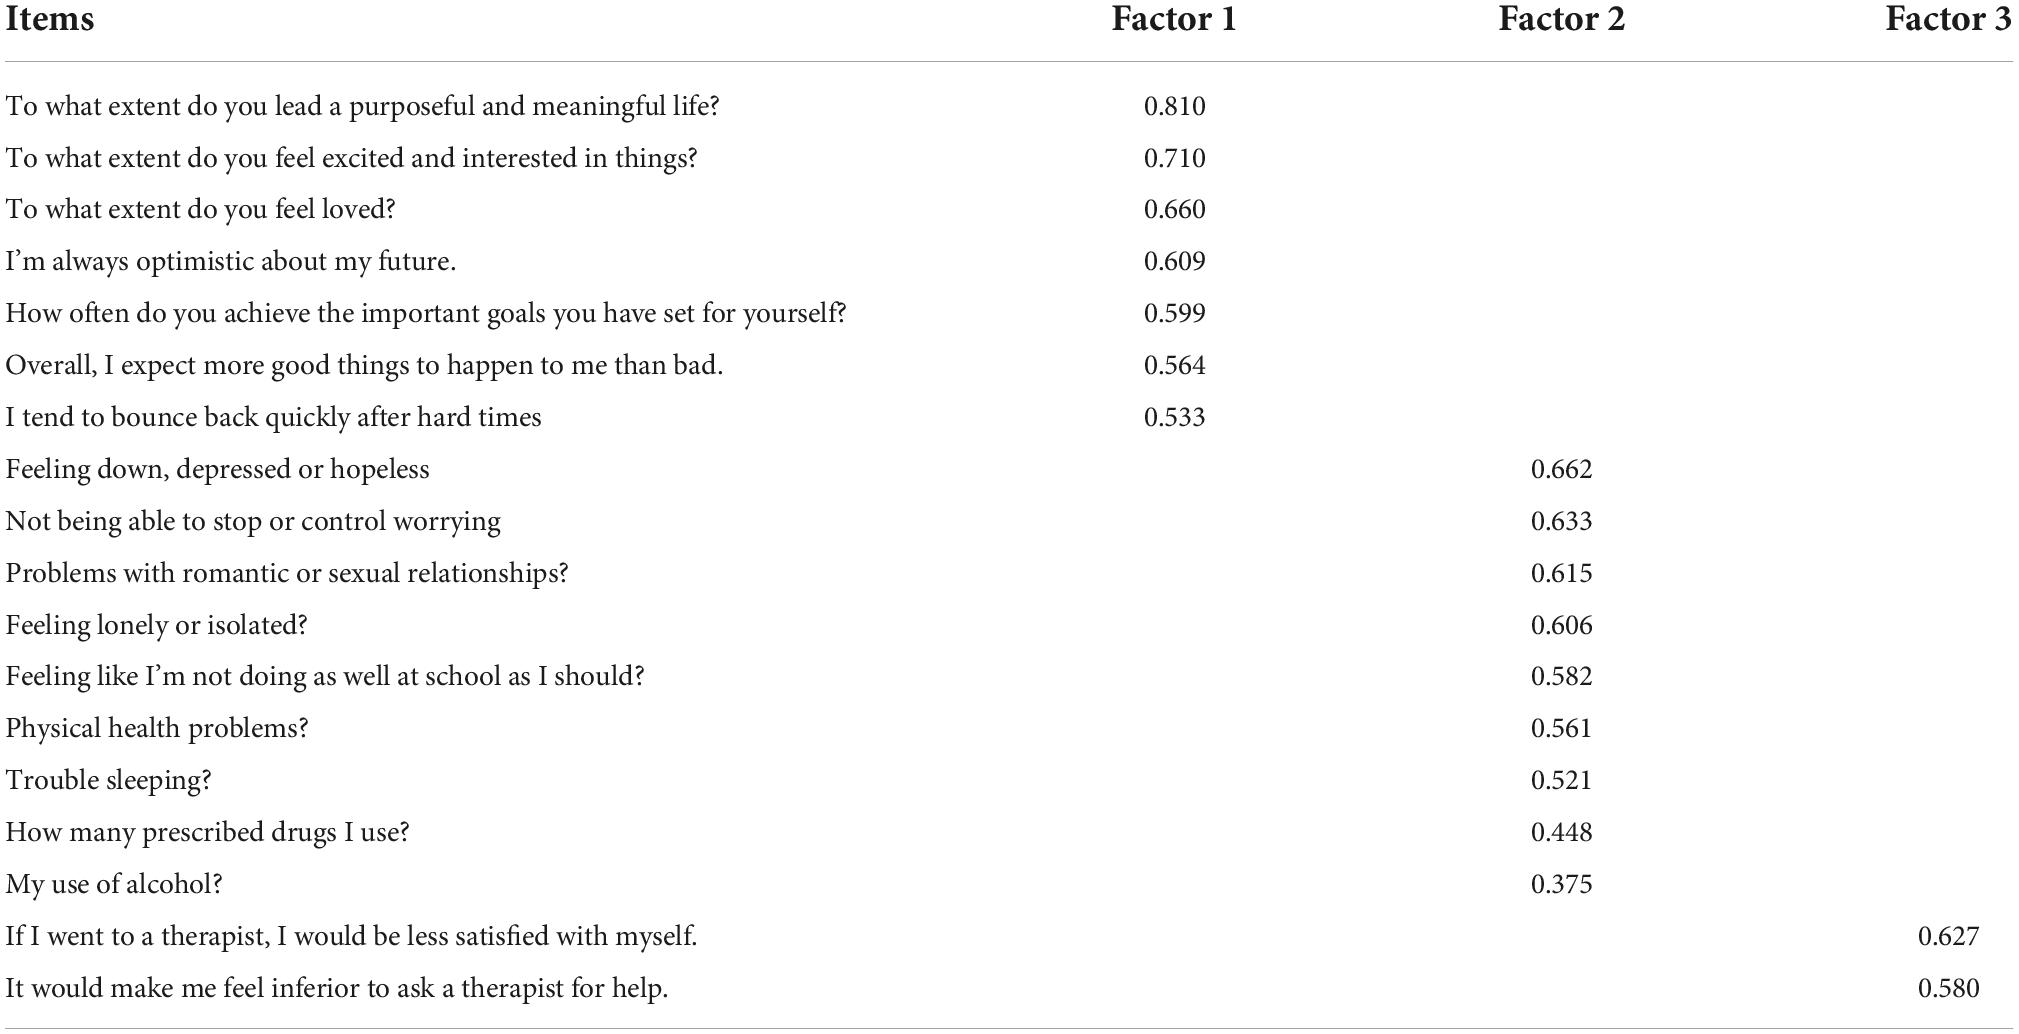
Table 3. Modified EFA results of the student veterans with disabilities.
Exploratory factor analysis results were confirmed by using a series of confirmatory factor analyses (CFA). First, we used Study 3 results to independently cross-validate our Study 2 EFA results. The three-factor model generated a poor to acceptable fit: χ2 = 214.03, df = 132, χ2/df = 1.62, p < 0.05, CFI = 0.85, TLI = 0.82, SRMR = 0.07, and RMSEA = 0.05 (90% CI [0.06, 0.09]). Based on modification indices, conceptually and empirically meaningful correlated error terms were added to the model (86). The modified three-factor model generated a better fit: χ2 = 179.61, df = 129, χ2/df = 1.39, p < 0.05, CFI = 0.91, TLI = 0.89, SRMR = 0.06, and RMSEA = 0.04 (90% CI [0.02, 0.05]). The chi-square difference test indicated that the modified three-factor model fits the data significantly better than the non-modified three-factor model (Δχ2(3) = 34.43, p < 0.001).
We conducted three more CFAs using the Study 1 (SVDs), Study 2 (student veterans with disabilities), and Study 4 (Hispanic students with disabilities). The three-factor model generated a poor fit for the Study 1 that has a sample of SVDs: χ2 = 348.97, df = 132, χ2/df = 2.64, p < 0.05, CFI = 0.89, TLI = 0.88, SRMR = 0.06, and RMSEA = 0.08 (90% CI [0.07, 0.09]). Based on modification indices, conceptually and empirically meaningful correlated error terms were added to the model (86). The modified three-factor model generated a better fit: χ2 = 289.27, df = 130, χ2/df = 2.22, p < 0.05, CFI = 0.92, TLI = 0.91, SRMR = 0.05 and RMSEA = 0.07 (90% CI [0.06, 0.08]). The chi-square difference test indicated that the modified three-factor model fits the data significantly better than the non-modified three-factor model (Δχ2(2) = 59.69, p < 0.001).
Similarly, the three-factor model generated a relatively acceptable fit for the Study 2 that has a sample of student veterans with disabilities: χ2 = 228.59, df = 132, χ2/df = 1.73, p < 0.05, CFI = 0.88, TLI = 0.86, SRMR = 0.07, and RMSEA = 0.07 (90% CI [0.05, 0.09]). Based on modification indices, conceptually and empirically meaningful correlated error terms were added to the model (86). The modified three-factor model generated a better fit: χ2 = 195.68, df = 130, χ2/df = 1.50, p < 0.05, CFI = 0.92, TLI = 0.90, SRMR = 0.06 and RMSEA = 0.06 (90% CI [0.04, 0.08]). The chi-square difference test indicated that the modified three-factor model fits the data significantly better than the non-modified three-factor model (Δχ2(2) = 32.91, p < 0.001).
Finally, we tested this model with a different student body (Hispanic students with disabilities). The three-factor model generated a relatively acceptable fit for the Study 4 that has a sample of student veterans with disabilities: χ2 = 197.17, df = 132, χ2/df = 1.49, p < 0.05, CFI = 0.88, TLI = 0.86, SRMR = 0.08, and RMSEA = 0.07 (90% CI [0.05, 0.09]). Based on modification indices, conceptually and empirically meaningful correlated error terms were added to the model (86). The modified three-factor model generated a better fit: χ2 = 182.04, df = 130, χ2/df = 1.40, p < 0.05, CFI = 0.91, TLI = 0.89, SRMR = 0.07 and RMSEA = 0.06 (90% CI [0.04, 0.08]). The chi-square difference test indicated that the modified three-factor model fits the data significantly better than the non-modified three-factor model (Δχ2(2) = 15.13, p < 0.001). Table 4 represents the CFA findings.
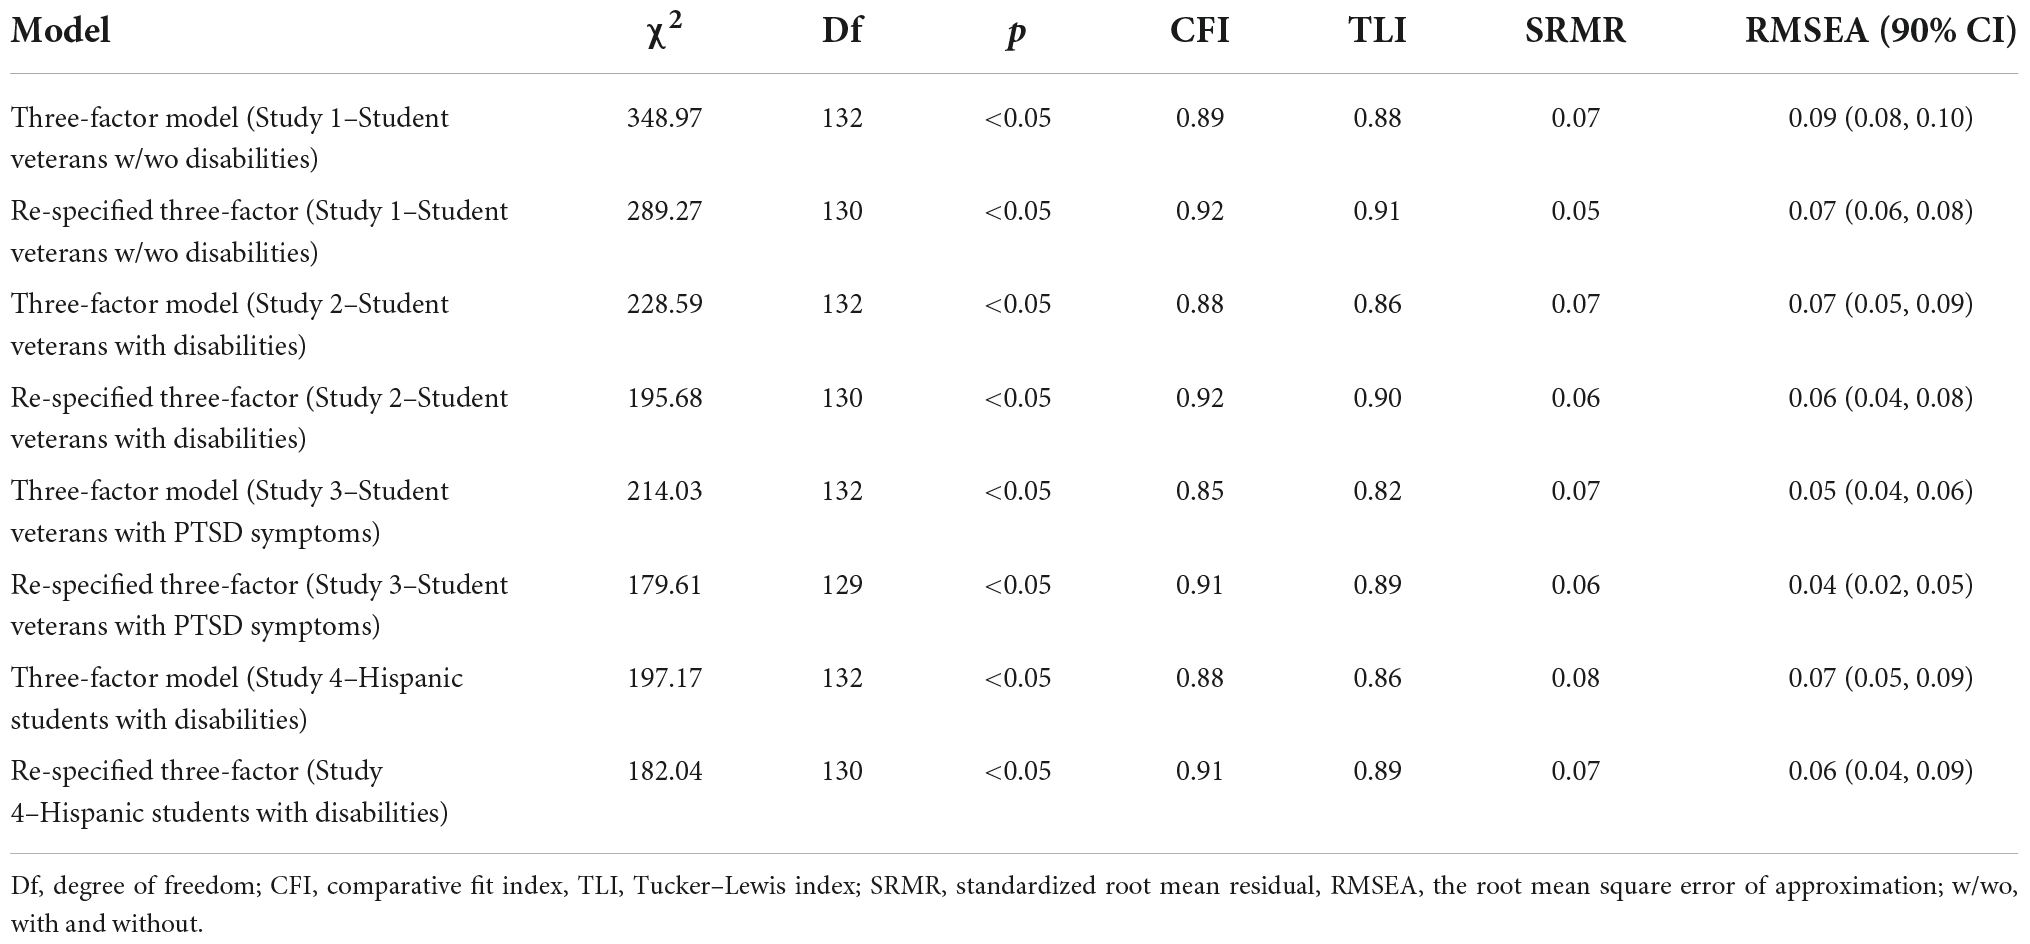
Table 4. Confirmatory factor analysis (CFA) findings.
We used all four studies to calculate coefficient omegas (ω) and coefficient alphas (α) for the subscales. The first subscale called emotional immunity had coefficient alphas of 0.89 (Study 1), 0.86 (Study 2), 0.73 (Study 3), and 0.87 (Study 4). The first subscale called emotional immunity had coefficient omegas (ω) and coefficient alphas of 0.92 and 0.89 for the Study 1, 0.86 and 0.86 for the Study 2, 0.71 and 0.73 for Study 3, and 0.89 and 0.87 for the Study 4, respectively. The second subscale called common challenges had coefficient omegas (ω) and coefficient alphas of 0.84 and 0.84 for the Study 1, 0.81 and 0.81 for the Study 2, 0.68 and 0.69 for Study 3, and 0.75 and 0.76 for the Study 4, respectively. The third subscale called help-seeking attitudes had coefficient omegas (ω) and coefficient alphas of 0.85 and 0.86 for the Study 1, 0.60 and 0.61 for the Study 2, 0.39 and 0.40 for Study 3, and 0.48 and 0.44 for the Study 4, respectively. Table 5 represents reliability findings.
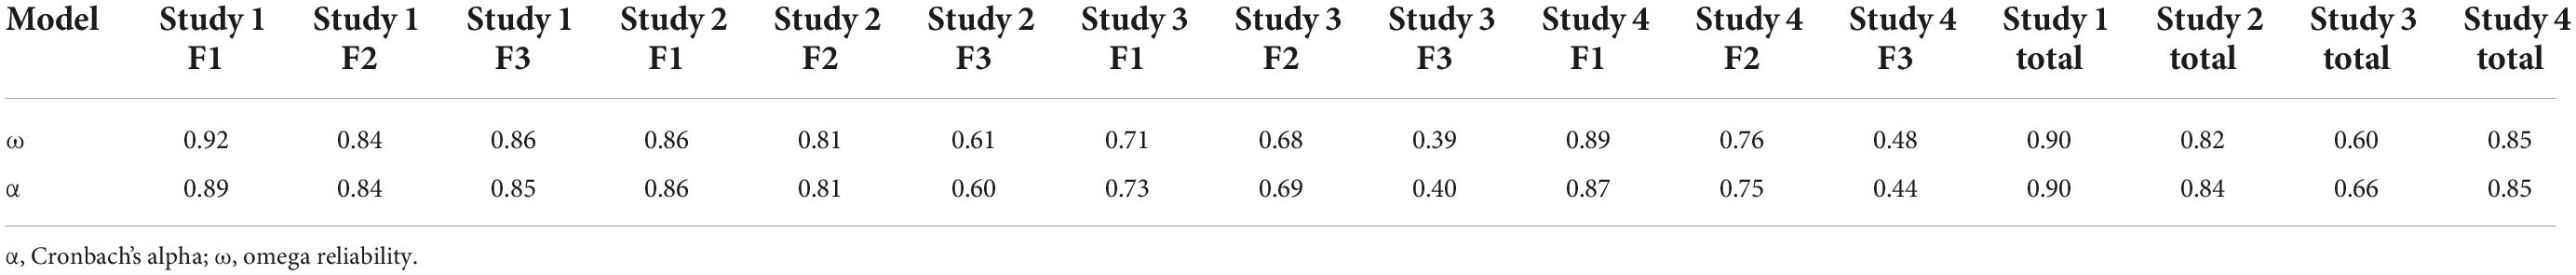
Table 5. Reliability findings.
We conducted a series of correlation analysis to calculate convergent and divergent validity. Regarding the Study 1, emotional immunity factor was related to GPA (r = 0.21, p < 0.05), self-efficacy (r = 0.58, p < 0.05), social support (r = 0.53, p < 0.05), mental health QOL (r = 0.78, p < 0.05), and stress (r = −0.58, p < 0.05); common challenges factor was related to GPA (r = −0.21, p < 0.05), self-efficacy (r = −0.46, p < 0.05), social support (r = −0.42, p < 0.05), mental health QOL (r = −0.74, p < 0.05), and stress (r = 0.67, p < 0.05); and help-seeking attitudes factor was associated with social support (r = −0.21, p < 0.05). Regarding the Study 2, emotional immunity factor was associated with grit (r = 0.33, p < 0.05), mental health QOL (r = 0.57, p < 0.05), dropout decisions (r = −0.44, p < 0.05), PTSD (r = −0.46, p < 0.05), functional limitations (r = −0.32, p < 0.05), and COVID-19 stress (r = −0.48, p < 0.05); common challenges factor was associated with grit (r = −0.33, p < 0.05), mental health QOL (r = −0.26, p < 0.05), dropout decisions (r = 0.52, p < 0.05), PTSD (r = 0.72, p < 0.05), functional limitations (r = 0.61, p < 0.05), and COVID-19 stress (r = 0.59, p < 0.05); and help-seeking attitudes was associated with dropout decisions (r = 0.21, p < 0.05). In the Study 3, emotional immunity factor was correlated with GPA (r = 0.17, p < 0.05) and functional limitations (r = −0.18, p < 0.05) and common challenges factor was correlated with functional limitations (r = 0.35, p < 0.05). Finally, in the Study 4, emotional immunity was associated with grit (r = 0.46, p < 0.05), mental health QOL (r = 0.63, p < 0.05), dropout decisions (r = −0.42, p < 0.05), PTSD (r = −0.60, p < 0.05), functional limitations (r = −0.15, p < 0.05), and COVID-19 stress (r = −0.65, p < 0.05); common challenges factor was associated with grit (r = −0.36, p < 0.05), mental health QOL (r = −0.58, p < 0.05), dropout decisions (r = 0.33, p < 0.05), PTSD (r = 0.73, p < 0.05), functional limitations (r = 0.40, p < 0.05), and COVID-19 stress (r = 0.58, p < 0.05); and help-seeking attitudes was associated with dropout decisions (r = 0.27, p < 0.05) (Please see Table 6).
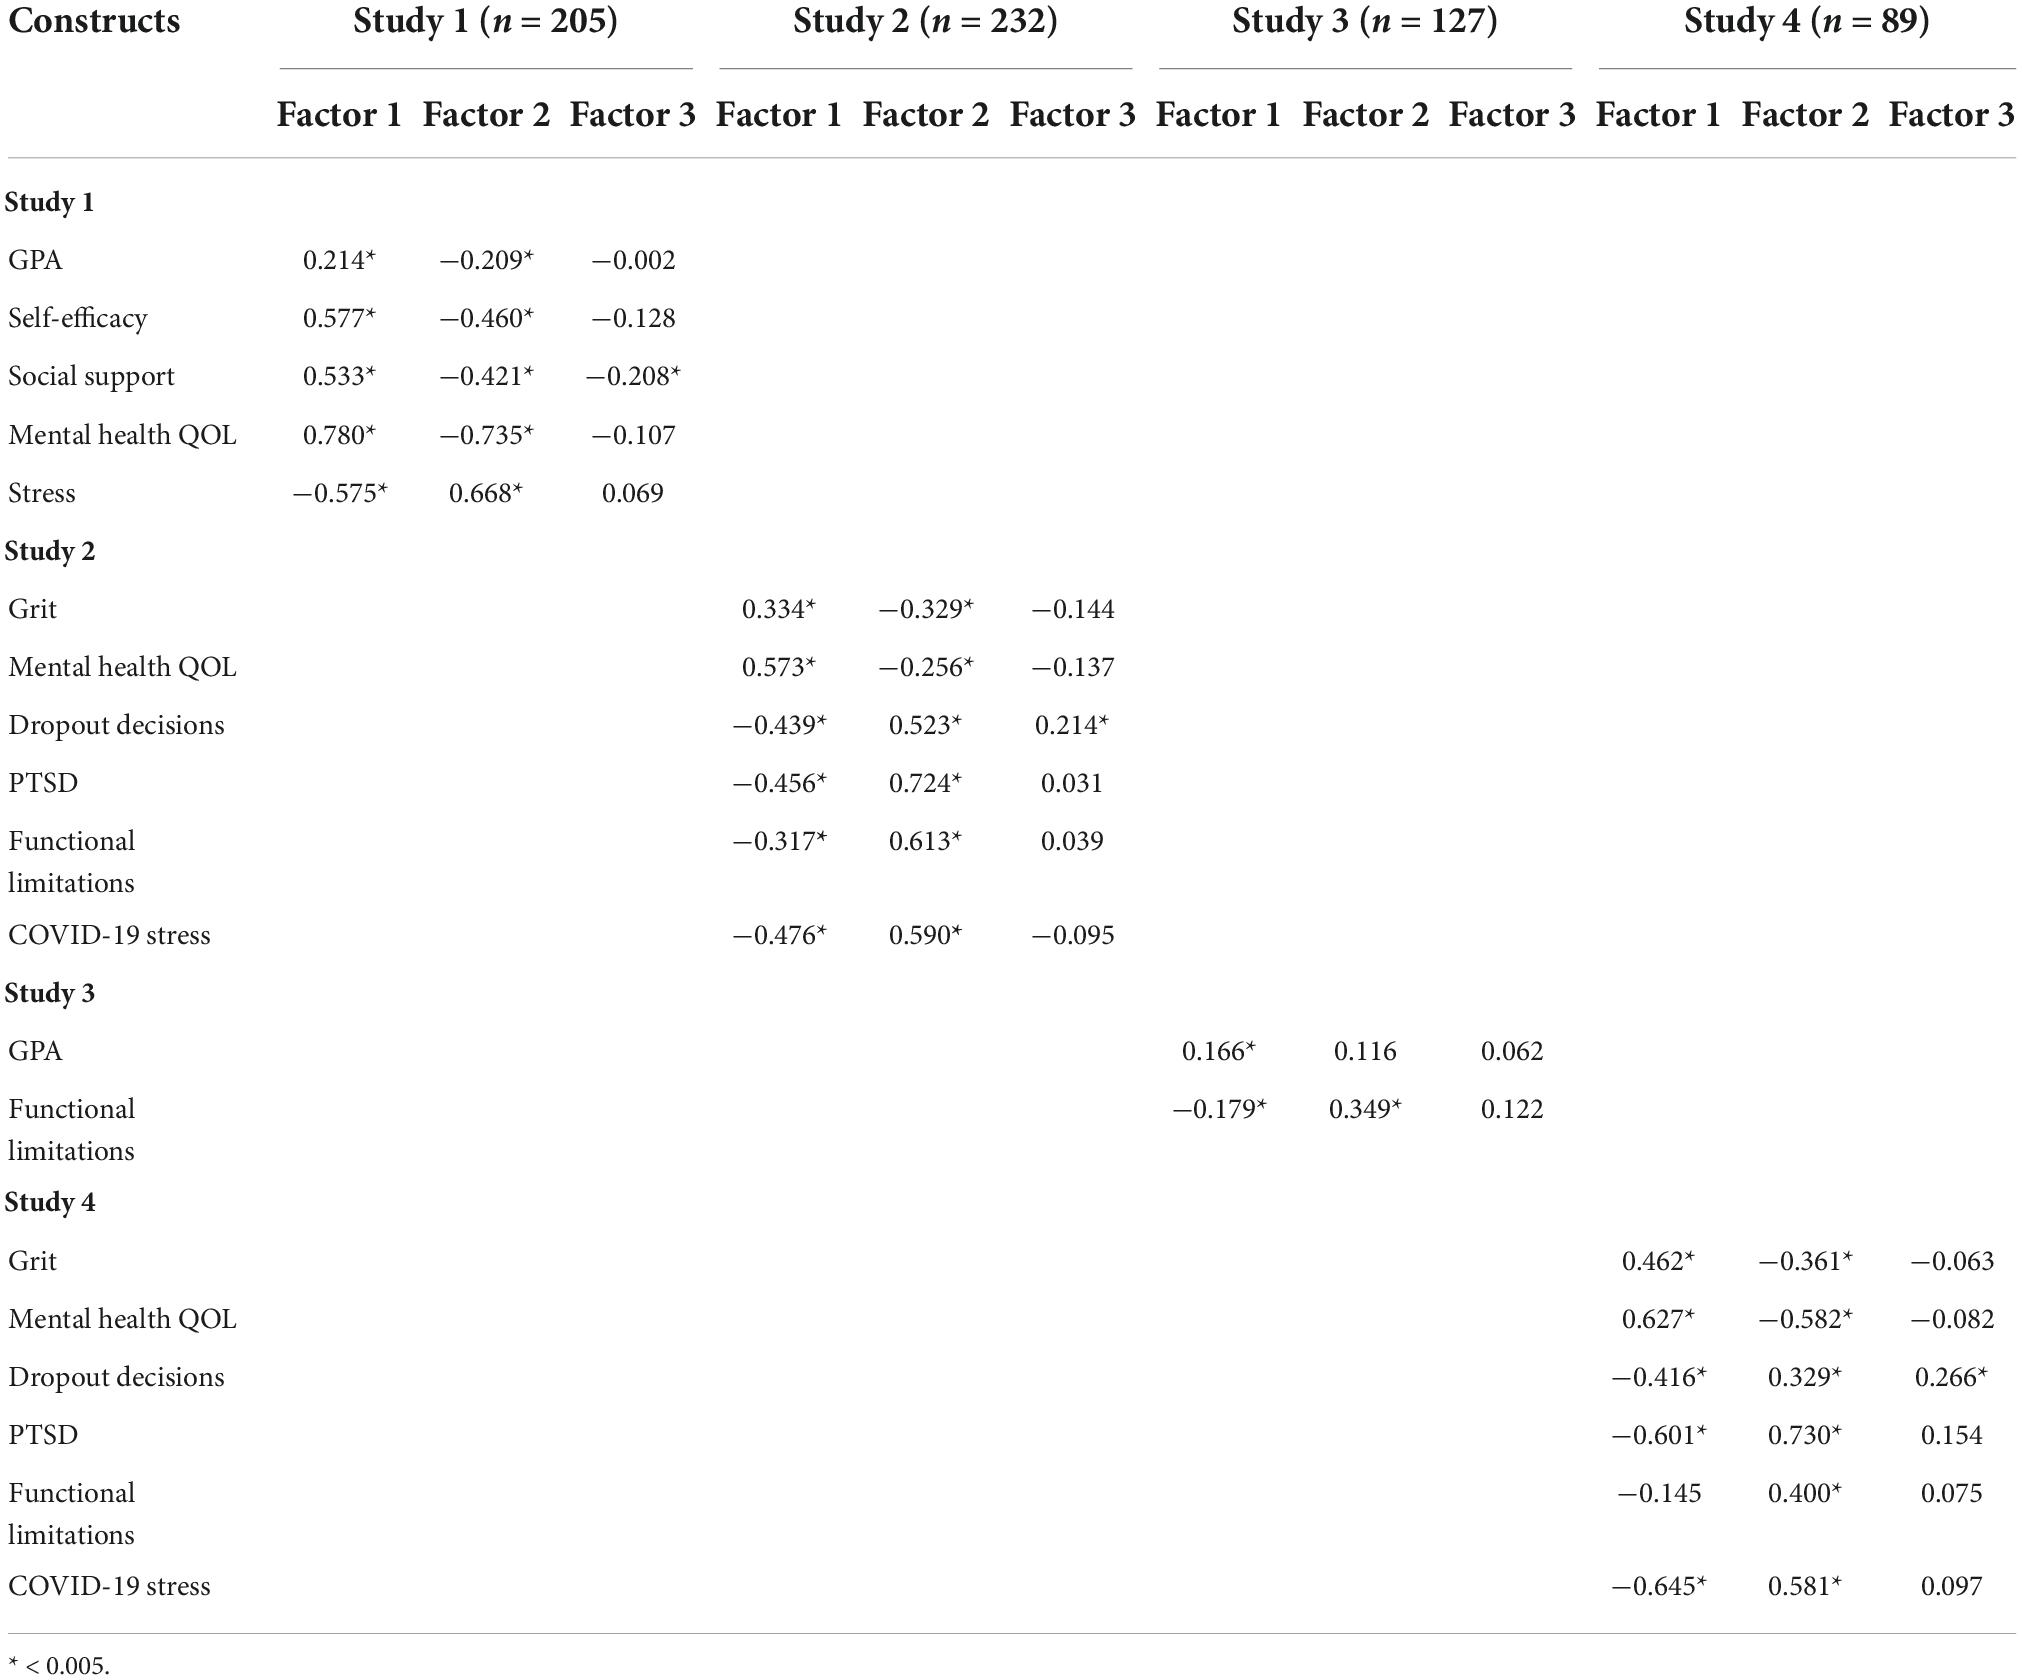
Table 6. Correlation coefficients among variables.
This study utilized both constructs from Tinto’s model and positive psychology (see Figure 2 representing our new college adjustment model called “Integrative Positive College Adjustment Model”) to develop a new college adjustment index score and model for students with disabilities specifically for SVDs, but it could be also used for any college student with further model evaluation. College adjustment is significant challenge among SVDs due to transition-, disability, and psychosocial-related stressors. We believe this scale will meaningfully contribute to the fields of education and psychology by improving college adjustment among SVDs. Given student retention is impacted by multiple psychosocial and cognitive factors (87), our new, brief, and psychometrically sound scale may help professionals and researchers working with students including SVDs.
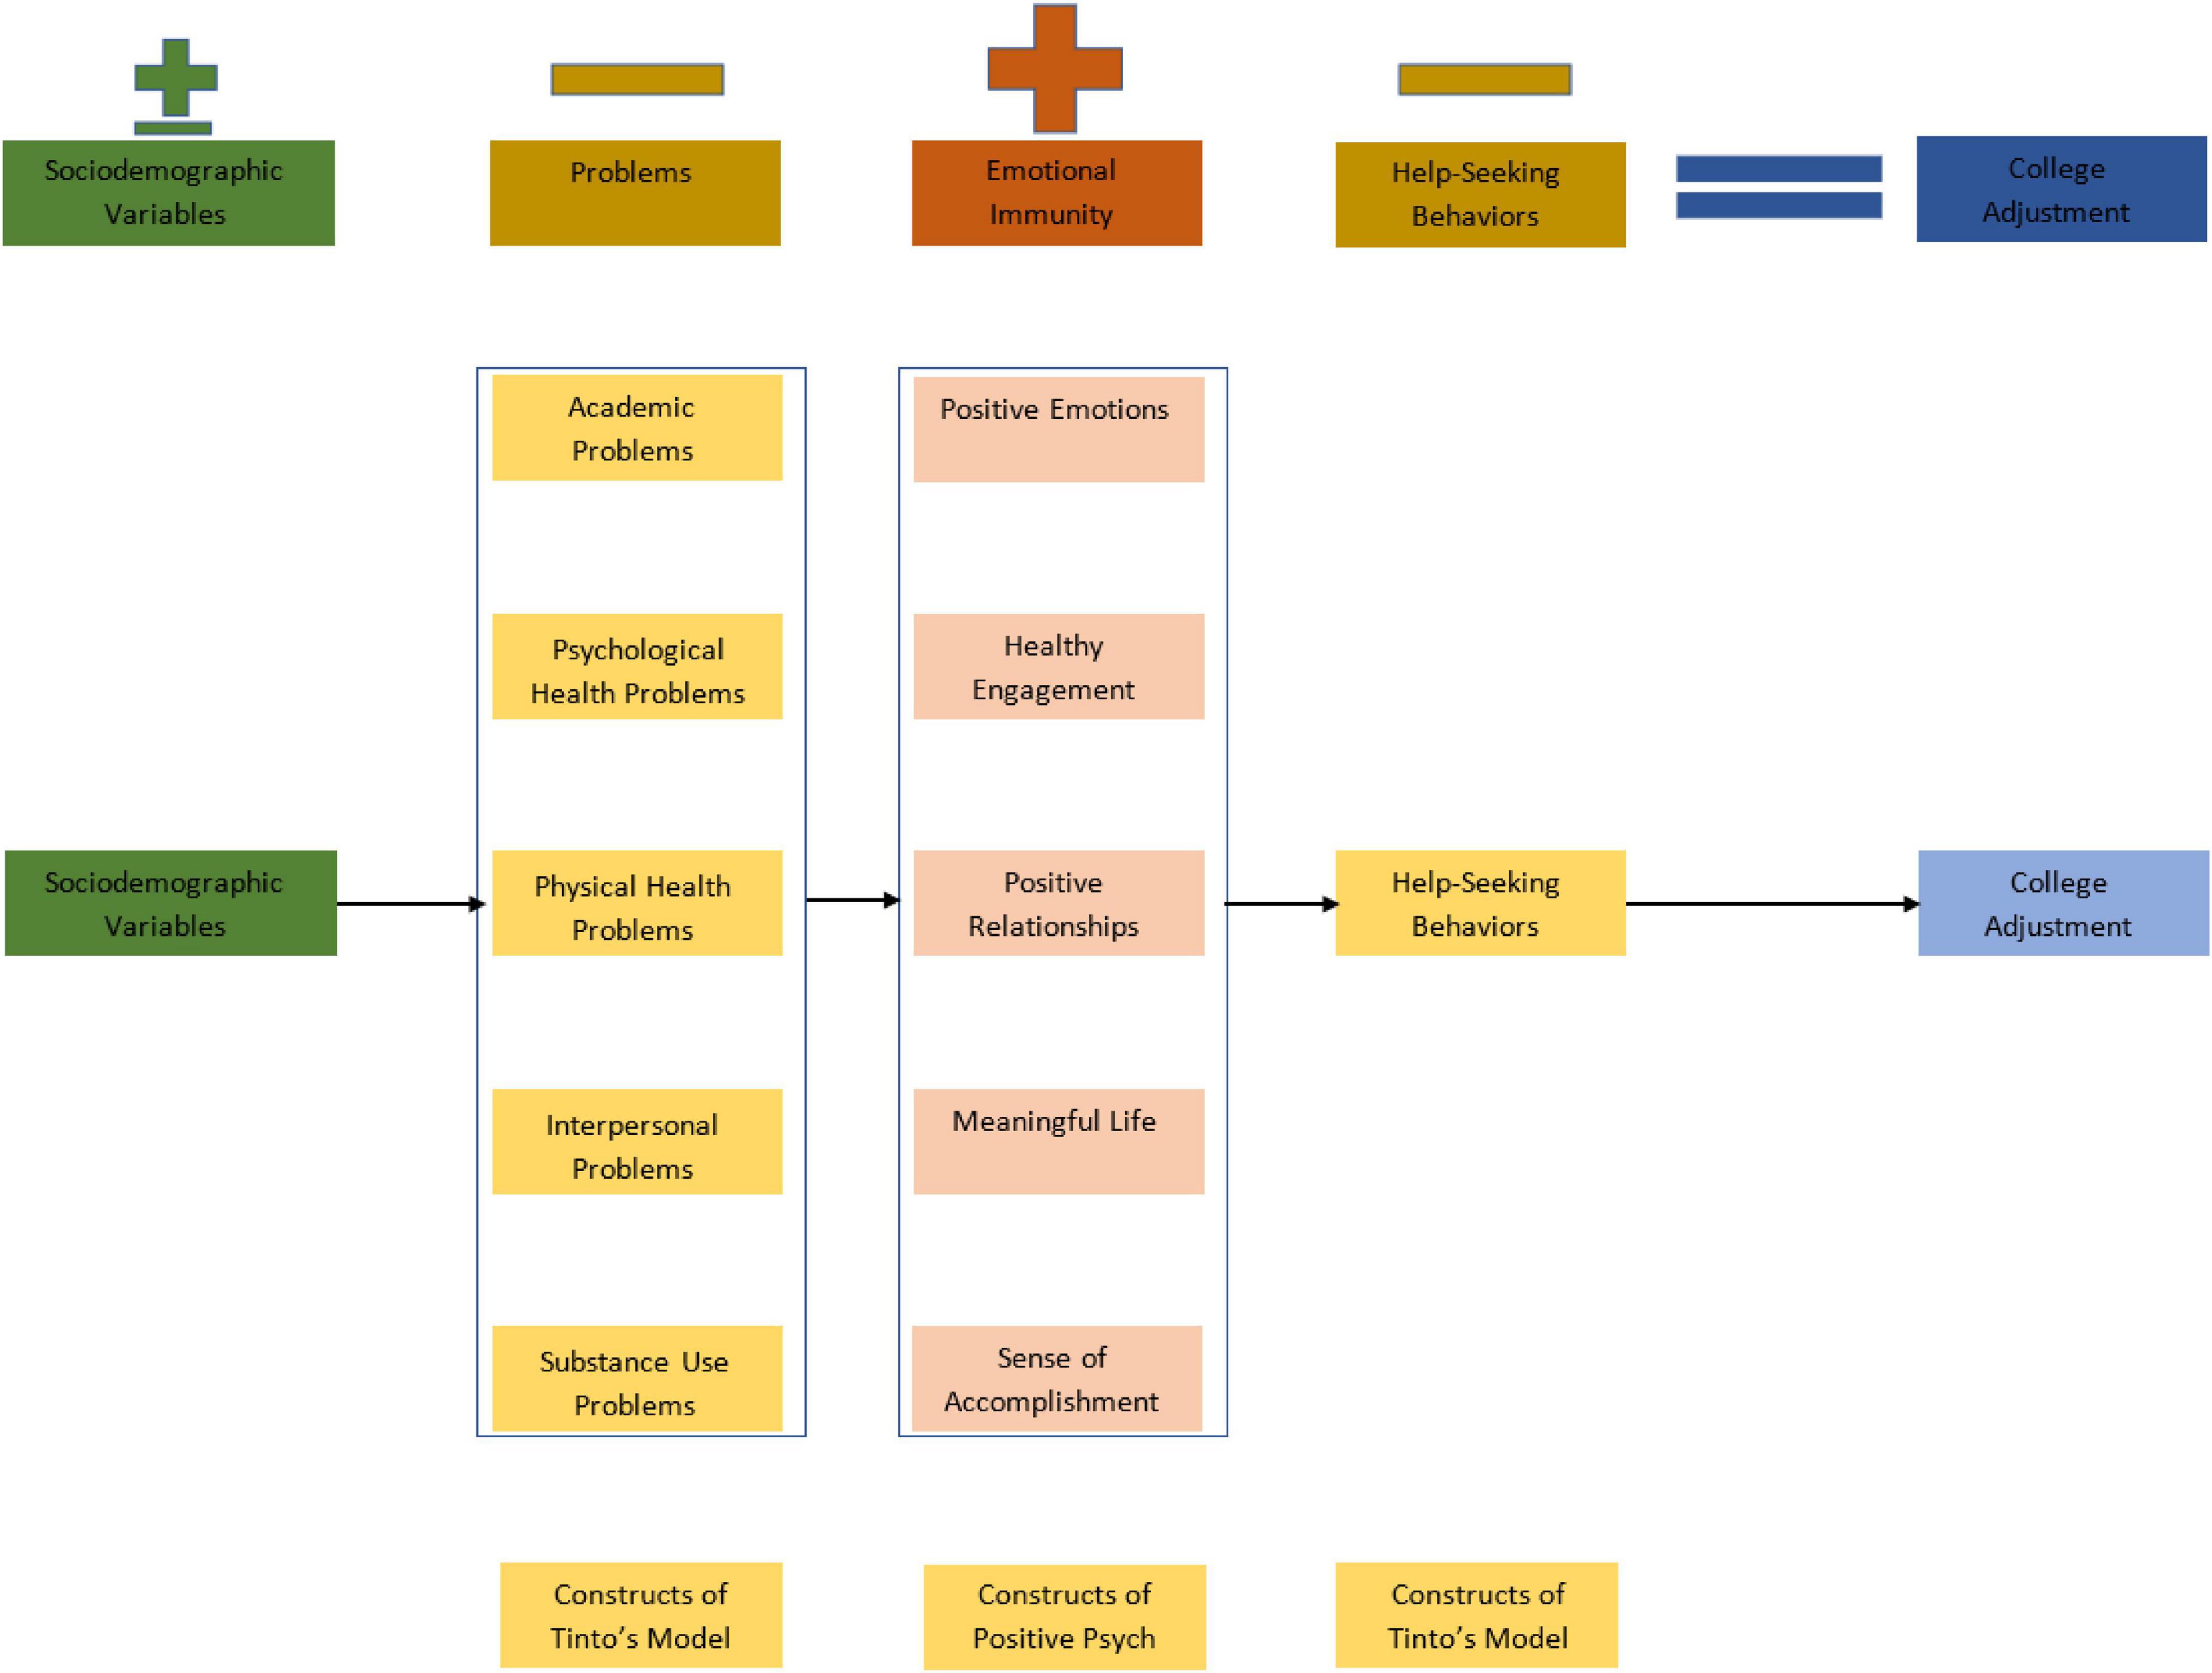
Figure 2. Extended student retention model called “Integrative Positive College Adjustment Model”. ± Represents both positive and negative impact on college adjustment; + represents positive impact on college adjustment; – represents negative impact on college adjustment.
Our multisite and multiphase study used evidence-based approaches (72, 73, 88) to develop this index score to help clinicians and researchers working with college students including SVDs. Initially, we identified certain important domains (i.e., college and academic life problems, emotional health, and help-seeking behaviors) based on our previous work. After identifying these domains, with our Study 1, we used Stanton et al. (73)’s rigorous methods to shorten scales measuring the domains we identified. These scales included: the PERMA-Profiler (55), the BRS (56), the LOT-R (57), the ICP (13), the Patient Health Questionnaire for Depression and Anxiety (58), the Self-Stigma of Seeking Help Scale (59). Given these scales have been widely used in research and clinical practice, it can be concluded that our index score has an acceptable content validity. After carefully analyzing a total of more than 50-items, we selected 22-items to further analyze with a different sample of SVDs.
With Study 2, our results revealed that some items had poor item qualities. As a rule of thumb, we removed items with cross-loadings (i.e., 0.40 or more factor loading on two or more factors) (89). Eventually, our new EFA results yielded a three-factor solution, and we named these factors as common challenges, emotional immunity, and help-seeking attitudes. Next, we cross-validated our EFA findings using Study 1 to Study 3. CFA results revealed that modified three-factor model fit data well for SVDs. We also checked whether our index also have similar model fit in culturally different college student sample (Study 4) and found that our three-factor structure also fits data well for Hispanic college students with disabilities. Overall, although we tested construct validity only via factor analysis, our EFA and CFA findings supported construct validity of the index score.
We also tested reliability of the three factors generated from EFA and CFA. We calculated both Cronbach’s alphas and omega reliability scores. Our findings revealed that common challenges and emotional immunity factors had very good to excellent reliability scores for all four study samples. Help-seeking attitudes factor had relatively lower reliability scores compared to common challenges and emotional immunity factors. This could be partially due to lesser number of items given the number of test items affect the alpha values (90). However, our total index score was found to have acceptable to excellent reliability coefficients (0.60–0.90), indicating that the index has a good reliability.
Finally, we tested whether the index score is associated with certain similar and distinct constructs to examine convergent and divergent validity. Study 1 results revealed (a) higher levels of emotional immunity was associated with higher levels of GPA, self-efficacy, social support, mental health QOL, and lower levels of stress, (b) higher levels of common challenges was associated with lower levels of GPA, self-efficacy, social support, mental health QOL, and higher levels of stress, (c) higher levels of help-seeking attitudes factor was associated with lower levels of social support. Study 2 results revealed that (a) higher levels of emotional immunity was associated with higher levels of grit, mental health QOL, and lower levels of dropout decisions, PTSD, functional limitations, and COVID-19 stress, (b) higher levels of common challenges was associated with lower levels of grit, mental health QOL, and higher levels of dropout decisions, PTSD, functional limitations, and COVID-19 stress, and (c) higher levels of help-seeking attitudes factor was associated with higher levels of dropout decisions. Results of Study 3 demonstrated that higher levels of emotional immunity were associated with higher levels of GPA and lower levels of functional limitations. Results also revealed that higher levels of common challenges were associated with higher levels of functional limitations. Finally, Study 4 results revealed that (a) higher levels of emotional immunity was associated with higher levels of grit, mental health QOL, and lower levels of dropout decisions, PTSD, functional limitations, and COVID-19 stress, (b) higher levels of common challenges was associated with lower levels of grit, mental health QOL, and higher levels of dropout decisions, PTSD, functional limitations, and COVID-19 stress, and (c) higher levels of help-seeking attitudes was associated with higher levels of dropout decisions. These findings uniquely contribute to the literature by showing that our college adjustment index score was successfully associated with psychosocial, academic, and disability related outcomes.
Overall, this study aimed to create a college adjustment index score for students, including SVDs. This 18-item tool may help clinicians and researchers conceptualize college adjustment among students through the lens of integrative Tinto’s model and positive psychology approaches. Our psychometric analyses revealed that this index tool is brief, reliable, and valid tool to capture college adjustment in SVDs. Our scale will also help researchers and clinicians have a balanced practice given our scale measures emotional immunity, college problems, and help seeking attitudes, which is a holistic approach. This will also help researchers and clinicians have strength-based research and practice focusing on positive psychology factors such as grit, character strengths, gratitude, resilience in rehabilitation practice including psychiatric rehabilitation [e.g., (71, 91–95)].
Although our study is unique and has many strengths, this study has certain limitations. First, this study data includes only student veterans and Hispanic college students. Although majority of Veterans are White in our sample, we did not have an opportunity to collect a data from a more diverse student body. Therefore, our findings should be interpreted carefully by considering our samples. Second, these four studies were not planned to create this index score. Each study was funded by different agencies for different scope of work. However, this project has been a developing idea since dissertation focused on student veterans and college adjustment. Although rigorous and objective methods were applied to create this index score, a well-planned new study design would significantly benefit our current findings. Third, some of our samples consist of small sample size. This is partially due to difficulty reaching out this student body. Fourth, we created college adjustment index score or tool by selecting items via rigorous psychometric methods. We did not create our own item pool based on a focus group. Future work may also incorporate focus group and Delphi studies to create an item pool. Finally, some of our factors have low reliability scores which could be partially due to small numbers of items in these factors. For example, our help seeking subscale has only two-items, and it is expected that scales with less items have lower levels of reliability scores.
The datasets presented in this article are not readily available because due to IRB, data is not available. Requests to access the datasets should be directed to EU, the corresponding author.
The studies involving human participants were reviewed and approved by UT-El Paso and UW-Madison IRBs. The patients/participants provided their written informed consent to participate in this study.
The author confirms being the sole contributor of this work and has approved it for publication.
The contents of Study 1 was developed with support from the Rehabilitation Research and Training Center (RRTC) on Employment of People with Physical Disabilities. The RRTC was funded by the National Institute on Disability, Independent Living, and Rehabilitation Research Grant H133B13001 to Virginia Commonwealth University. The Study 2 and 4 reported in the article was made possible by an internal grant. The Study 3 reported in the article was made possible by a grant from the Spencer Foundation (#202000033).
The author declares that the research was conducted in the absence of any commercial or financial relationships that could be construed as a potential conflict of interest.
All claims expressed in this article are solely those of the authors and do not necessarily represent those of their affiliated organizations, or those of the publisher, the editors and the reviewers. Any product that may be evaluated in this article, or claim that may be made by its manufacturer, is not guaranteed or endorsed by the publisher.
The views expressed are those of the author and do not necessarily reflect the views of the Spencer Foundation.
1. Umucu E, Chan F, Phillips B, Tansey T, Berven B, Hoyt W. Evaluating optimism, hope, resilience, coping flexibility, secure attachment, and PERMA as a well-being model for college life adjustment of student veterans: a hierarchical regression analysis. Rehabil Couns Bull. (in press).
2. Umucu E, Rios Y, Lo C, Wang A, Grenawalt T, Yasuoka M, et al. Service-connected disability and happiness in student veterans: a parallel mediation study of PERMA. Rehabil Couns Bull. (in press).
3. Tansey TN, Smedema S, Umucu E, Iwanaga K, Wu JR, Cardoso EDS, et al. Assessing college life adjustment of students with disabilities: application of the PERMA framework. Rehabil Couns Bull. (2018) 61:131–42. doi: 10.1177/0034355217702136
4. Ma J, Pender M, Welch M. Education Pays 2016: the Benefits of Higher Education for Individuals and Society. Trends in Higher Education Series. New York, NY: College Board (2016).
5. Elliott M, Gonzalez C, Larsen B. U.S. military veterans transition to college: combat, PTSD, and alienation on campus. J Stud Aff Res Pract. (2011) 48:279–96. doi: 10.2202/1949-6605.6293
6. Grenawalt TA, Lu J, Hamner K, Gill C, Umucu E. Social isolation and well-being in veterans with mental illness. J Ment Health. (2022) [Epub ahead of print]. doi: 10.1080/09638237.2021.2022625
7. Rumrill S, Castruita-Rios Y, Yasuoka M, Aydin Z, Zhou K, Umucu E. Drug use problems and academic adjustment in student veterans with disabilities: a parallel mediation study. Rehabil Couns Bull. (in press).
8. Umucu E, Wu J-R, Sanchez J, Brooks JM, Chiu C-Y, Tu W-M, et al. Psychometric validation of the PERMA-profiler as a well-being measure for student veterans. J Am Coll Health. (2020) 68:271–7. doi: 10.1080/07448481.2018.1546182
9. Umucu E. Examining the structure of the PERMA theory of well-being in veterans with mental illnesses. Rehabil Couns Bull. (2020) 64:244–7. doi: 10.1177/0034355220957093
10. Umucu E, Reyes A, Carrola P, Mangadu T, Lee B, Brooks JM, et al. Pain intensity and mental health quality of life in veterans with mental illnesses: the intermediary role of physical health and the ability to participate in activities. Qual Life Res. (2021) 30:479–86. doi: 10.1007/s11136-020-02642-y
11. Wurster KG, Rinaldi AP, Woods TS, Liu WM. First-generation student veterans: implications of poverty for psychotherapy. J Clin Psychol. (2013) 69:127–37. doi: 10.1002/jclp.21952
12. Umucu E, Chan F, Lee B, Brooks J, Reyes A, Mangadu T, et al. Well-being, PTSD, college adjustment in student veterans with and without disabilities. Front Educ. (2022) 6:793286. doi: 10.3389/feduc.2021.793286
13. Hoffman JA, Weiss B. A new system for conceptualizing college students’ problems: types of crises and the inventory of common problems. J Am Coll Health. (1986) 34:259–66. doi: 10.1080/07448481.1986.9938947
14. Baker RW, Siryk B, Trevisan DA, Bass E, Powell K, Eckerd LM. Student adaptation to college questionnaire. Meaning Life Coll Stud. (2017) 20:37–51. doi: 10.1002/jocc.12057
15. Umucu E, Lo C-L, Lee B, Vargas-Medrano J, Diaz-Pacheco V, Misra K, et al. Is gratitude associated with suicidal ideation in veterans with mental illness and student veterans with PTSD symptoms? J Nerv Ment Dis. (2022) 210:26–31. doi: 10.1097/NMD.0000000000001406
16. Umucu E, Rumrill P, Chiu CY, Ghosh A. Functional limitations, PTSD, and college adjustment in student veterans with PTSD symptoms: a mediation analysis study. Rehab Res Policy Educ. (2022) 36. doi: 10.1891/RE-21-04
17. Barry AE, Whiteman SD, MacDermid Wadsworth S. Student service members/veterans in higher education: a systematic review. J Student Aff Res Pract. (2014) 51:30–42. doi: 10.1515/jsarp-2014-0003
18. Norman SB, Rosen J, Himmerich S, Myers US, Davis B, Browne KC, et al. Student veteran perceptions of facilitators and barriers to achieving academic goals. J Rehabil Res Dev. (2015) 52:701–12. doi: 10.1682/JRRD.2015.01.0013
19. Alschuler M, Yarab J. Preventing student veteran attrition: what more can we do? J Coll Stud Ret. (2016) 20:47–66. doi: 10.1177/1521025116646382
20. Cunningham J. Veterans’ post-secondary education: keeping the promise to those who serve. Hinckley J Polit. (2012):13–20.
21. Rudd MD, Goulding J, Bryan CJ. Student veterans: a national survey exploring psychological symptoms and suicide risk. Prof Psychol Res Pr. (2011) 42:354–60. doi: 10.1037/a0025164
22. Student Veterans of America. The 2020 SVA Census Survey: student Veteran General Breakdowns. Washington, DC: Student Veterans of America (2020).
23. Umucu E, Lee B, Berwick A, Neill LE, Chan E, Chen X. Reducing the impact of perceived stress on subjective well-being of student veterans with and without disabilities: the protective role of positive traits and social support. Rehabil Couns Bull. (2022) doi: 10.1177/00343552221077942
24. Whiteman SD, Barry AE, Mroczek DK, MacDermid Wadsworth S. The development and implications of peer emotional support for student service members/veterans and civilian college students. J Couns Psychol. (2013) 60:265–78. doi: 10.1037/a0031650
25. Widome R, Laska MN, Gulden A, Fu SS, Lust K. Health risk behaviors of Afghanistan and Iraq war veterans attending college. Am J Health Promot. (2011) 26:101–8. doi: 10.4278/ajhp.090826-QUAN-278
26. Thomas KH, Albright DL, Phillips D, Roosevelt K, Crawley R, Taylor SP. Mental health status in service member and veteran students at four-year postsecondary institutions: a pilot needs assessment. Best Pr Mental Health. (2018) 14:1–14.
27. Bryan CJ, Bryan AO. Sociodemographic correlates of suicidal thoughts and behaviors among college student service members/veterans. J Am Coll Health. (2015) 63:502–7. doi: 10.1080/07448481.2014.939982
28. Umucu E, Lee B, Iwanaga K, Kosyluk K, Blake J, Bezyak J, et al. Relationships between positive human traits and PERMA (positive emotion, engagement, relationships, meaning, and accomplishments) in student veterans: a canonical correlation analysis. Rehab Res Policy Educ. (2021) 35:238–47. doi: 10.1891/RE-21-09
29. Umucu E, Moser E, Bezyak J. Assessing hope in student veterans. J Coll Stud Dev. (2020) 61:115–20. doi: 10.1353/csd.2020.0008
30. Richardson M, Abraham C, Bond R. Psychological correlates of university students’ academic performance: a systematic review and meta-analysis. Psychol Bull. (2012) 138:353–87. doi: 10.1037/a0026838
31. Robbins SB, Oh I-S, Le H, Button C. Intervention effects on college performance and retention as mediated by motivational, emotional, and social control factors: integrated meta-analytic path analyses. J Appl Psychol. (2009) 94:1163. doi: 10.1037/a0015738
32. Renshaw TL, Eklund KR, Bolognino SJ, Adodo I. Bidimensional emotional health in college students: a comparison of categorical and continuous analytic approaches. J Psychopathol Behav Assess. (2016) 38:681–94. doi: 10.1007/s10862-016-9558-6
33. Umucu E, Grenawalt TA, Reyes A, Tansey T, Brooks J, Lee B, et al. Flourishing in student veterans with and without service-connected disability: psychometric validation of the flourishing scale and exploration of its relationships with personality and disability. Rehabil Couns Bull. (2018) 63:3–12. doi: 10.1177/0034355218808061
34. Umucu E, Ghosh A, Castruita Rios Y, Yasuoka M, Choi H, Urkmez B, et al. The impact of army resilience training on the self-stigma of seeking help in student veterans with and without disabilities. Stigma Health. (2022) doi: 10.1037/sah0000403
35. Harding S. Self-stigma and veteran culture. J Transcult Nurs. (2017) 28:438–44. doi: 10.1177/1043659616676319
36. Currier JM, McDermott RC, McCormick WH. Mental health treatment-related stigma and professional help seeking among student veterans. Psychol Serv. (2017) 14:531–42. doi: 10.1037/ser0000129
37. Currier JM, McDermott RC, Sims BM. Patterns of help-seeking in a national sample of student veterans: a matched control group investigation. Gen Hosp Psychiatry. (2016) 43:58–62. doi: 10.1016/j.genhosppsych.2016.08.004
38. Barry AE, Whiteman S, Wadswroth SM, Hitt S. The alcohol use and associated mental health problems of student service members/veterans in higher education. Drugs. (2012) 19:415–25. doi: 10.1080/07448481.2015.1068173
39. Umucu E. Evaluating Optimism, Hope, Resilience, Coping Flexibility, Secure Attachment, and PERMA as a Well-Being Model for College Life Adjustment of Student Veterans: a Hierarchical Regression Analysis. Madison, WI: The University of Wisconsin-Madison (2017).
40. Umucu E, Brooks JM, Lee B, Iwanaga K, Wu J-R, Chen A, et al. Measuring dispositional optimism in student veterans: an item response theory analysis. Mil Psychol. (2018) 30:590–7. doi: 10.1080/08995605.2018.1522161
41. Sikes DL, Patterson BJ, Chargualaf KA, Elliott B, Song H, Boyd J, et al. Predictors of student veterans progression and graduation in veteran to bachelor of science in nursing (VBSN) programs: a multisite study. J Prof Nurs. (2021) 37:632–9. doi: 10.1016/j.profnurs.2021.03.008
42. Nash WP, Silva C, Litz B. The historic origins of military and veteran mental health stigma and the stress injury model as a means to reduce it. Psychiatr Ann. (2009) 39:789–94. doi: 10.3928/00485713-20090728-05
43. Baker RW, Siryk B. Measuring adjustment to college. J Couns Psychol. (1984) 31:179–89. doi: 10.1037/0022-0167.31.2.179
44. Baker RW, Siryk B. Student Adaptation to College Questionnaire (SACQ). Los Angeles, CA: Western Psychological Services (1984). doi: 10.1037/t06525-000
45. Feldt RC, Graham M, Dew D. Measuring adjustment to college: construct validity of the student adaptation to college questionnaire. Meas Eval Couns Dev. (2011) 44:92–104. doi: 10.1177/0748175611400291
46. Beyers W, Goossens L. Concurrent and predictive validity of the student adaptation to college questionnaire in a sample of European freshman students. Educ Psychol Meas. (2002) 62:527–38. doi: 10.1177/00164402062003009
47. Tinto V. Research and practice of student retention: what next? J Coll Stud Retent. (2006) 8:1–19. doi: 10.2190/4YNU-4TMB-22DJ-AN4W
48. Tinto V. Dropout from higher education: a theoretical synthesis of recent research. Rev Educ Res. (1975) 45:89–125. doi: 10.3102/00346543045001089
49. Tinto V. Stages of student departure: reflections on the longitudinal character of student leaving. J High Educ. (1988) 59:438–55.
50. Karp MM, Hughes KL, O’Gara L. An exploration of Tinto’s integration framework for community college students. J Coll Stud Retent. (2010) 12:69–86.
51. Tinto V. Stages of student departure: reflections on the longitudinal character of student leaving. J High Educ. (1988) 59:438–55. doi: 10.1080/00221546.1988.11780199
52. Napoli AR, Wortman PM. Psychosocial factors related to retention and early departure of two-year community college students. Res High Educ. (1998) 39:419–55. doi: 10.1023/A:1018789320129
53. Haktanir A, Watson JC, Ermis-Demirtas H, Karaman MA, Freeman PD, Kumaran A, et al. Resilience, academic self-concept, and college adjustment among first-year students. J Coll Stud Retent. (2021) 23:161–78. doi: 10.1177/1521025118810666
54. Liu SR, Kia-Keating M, Modir S. Hope and adjustment to college in the context of collective trauma. J Am Coll Health. (2017) 65:323–30. doi: 10.1080/07448481.2017.1312412
55. Butler J, Kern ML. The PERMA-profiler: a brief multidimensional measure of flourishing. Int J Wellbeing. (2016) 6:1–48. doi: 10.5502/ijw.v6i3.526
56. Smith BW, Dalen J, Wiggins K, Tooley E, Christopher P, Bernard J. The brief resilience scale: assessing the ability to bounce back. Int J Behav Med. (2008) 15:194–200. doi: 10.1080/10705500802222972
57. Scheier MF, Carver CS, Bridges MW. Distinguishing optimism from neuroticism (and trait anxiety, self-mastery, and self-esteem): a reevaluation of the life orientation test. J Pers Soc Psychol. (1994) 67:1063–78. doi: 10.1037//0022-3514.67.6.1063
58. Kroenke K, Spitzer RL, Williams JB, Löwe B. An ultra-brief screening scale for anxiety and depression: the PHQ–4. Psychosomatics. (2009) 50:613–21. doi: 10.1016/S0033-3182(09)70864-3
59. Vogel DL, Wade NG, Haake S. Measuring the self-stigma associated with seeking psychological help. J Couns Psychol. (2006) 53:325. doi: 10.1037/0022-0167.53.3.325
60. Lent RW, Brown SD, Larkin KC. Self-efficacy in the prediction of academic performance and perceived career options. J Couns Psychol. (1986) 33:265–9. doi: 10.1037/0022-0167.33.3.265
61. Cohen S, Kamarck T, Mermelstein R. A global measure of perceived stress. J Health Soc Behav. (1983) 24:385–96. doi: 10.2307/2136404
62. Hays RD, Schalet BD, Spritzer KL, Cella D. Two-item PROMIS§global physical and mental health scales. J Patient Rep Outcomes. (2017) 1:2. doi: 10.1186/s41687-017-0003-8
63. Kocalevent R-D, Berg L, Beutel ME, Hinz A, Zenger M, Härter M, et al. Social support in the general population: standardization of the Oslo social support scale (OSSS-3). BMC Psychol. (2018) 6:31. doi: 10.1186/s40359-018-0249-9
64. Duckworth AL, Quinn PD. Development and validation of the short grit scale (GRIT–S). J Pers Assess. (2009) 91:166–74. doi: 10.1080/00223890802634290
65. Üstün TB, Chatterji S, Kostanjsek N, Rehm J, Kennedy C, Epping-Jordan J, et al. Developing the world health organization disability assessment schedule 2.0. Bull World Health Organ. (2010) 88:815–23. doi: 10.2471/BLT.09.067231
66. Weathers F, Litz BT, Keane TM, Palmieri PA, Marx BP, Schnurr PP. The PTSD Checklist for DSM–5 (PCL-5). Washington, DC: U.S. Department of Veterans Affairs (2013).
67. Dresel M, Grassinger R. Changes in achievement motivation among university freshmen. J Educ Train Stud. (2013) 1:159–73. doi: 10.11114/jets.v1i2.147
68. Umucu E, Iwanaga K, Wu J-R, Brooks JM, Ditchman N, Flowers-Benton S, et al. Preliminary validation of a short form of the perceived stress questionnaire for use in clinical rehabilitation counseling research and practice. Rehab Res Policy Educ. (2018) 32:232–43. doi: 10.1891/0889-7018.32.4.232
69. Fliege H, Rose M, Arck P, Walter OB, Kocalevent R-D, Weber C, et al. The perceived stress questionnaire (PSQ) reconsidered: validation and reference values from different clinical and healthy adult samples. Psychosom Med. (2005) 67:78–88. doi: 10.1097/01.psy.0000151491.80178.78
70. Prins A, Bovin MJ, Smolenski DJ, Marx BP, Kimerling R, Jenkins-Guarnieri MA, et al. The primary care PTSD screen for DSM-5 (PC-PTSD-5): development and evaluation within a veteran primary care sample. J Gen Intern Med. (2016) 31:1206–11. doi: 10.1007/s11606-016-3703-5
71. Umucu E, Villegas D, Viramontes R, Jung H, Lee B. Measuring grit in veterans with mental illnesses: examining the model structure of grit. Psychiatr Rehabil J. (2021) 44:87–92. doi: 10.1037/prj0000420
72. Bandalos D. Measurement Theory and Applications for the Social Sciences. New York, NY: Guilford Press (2018).
73. Stanton JM, Sinar EF, Balzer WK, Smith PC. Issues and strategies for reducing the length of self-report scales. Pers Psychol. (2002) 55:167–94. doi: 10.1111/j.1744-6570.2002.tb00108.x
74. Diener E, Emmons RA, Larsen RJ, Griffin S. The satisfaction with life scale. J Pers Assess. (1985) 49:71–5. doi: 10.1207/s15327752jpa4901_13
75. Hughes ME, Waite LJ, Hawkley LC, Cacioppo JT. A short scale for measuring loneliness in large surveys: results from two population-based studies. Res Aging. (2004) 26:655–72. doi: 10.1177/0164027504268574
76. Revelle W. psych: Procedures for Personality and Psychological Research. Evanston, IL: Northwestern University (2021).
77. Epskamp S. semPlot: Path Diagrams and Visual Analysis of Various SEM Packages’ Output. R Package Version 1.1.2. (2019). Available online at: https://CRAN.R-project.org/package=semPlot
78. Rosseel Y. lavaan: an R package for structural equation modeling. J Stat Softw. (2012) 48:1–36. doi: 10.3389/fpsyg.2014.01521
79. Bentler PM, Bonett DG. Significance tests and goodness of fit in the analysis of covariance structures. Psychol Bull. (1980) 88:588. doi: 10.1037/0033-2909.88.3.588
80. Hu L, Bentler PM. Cutoff criteria for fit indexes in covariance structure analysis: conventional criteria versus new alternatives. Struct Eq Modeling. (1999) 6:1–55. doi: 10.1080/10705519909540118
81. Weston R, Gore PA Jr., Chan F, Catalano D. An introduction to using structural equation models in rehabilitation psychology. Rehabil Psychol. (2008) 53:340–56. doi: 10.1037/a0013039
82. R Core Team. R: A Language and Environment for Statistical Computing. Vienna: R Foundation for Statistical Computing (2021).
83. RStudio Team. RStudio: Integrated Development Environment for R. Boston, MA: RStudio, PBC (2022).
84. Kaiser HF. An index of factorial simplicity. Psychometrika. (1974) 39:31–6. doi: 10.1007/BF02291575
85. Cattell RB. The scree test for the number of factors. Multivar Behav Res. (1966) 1:245–76. doi: 10.1207/s15327906mbr0102_10
86. Byrne BM. Structural Equation Modeling with AMOS: Basic Concepts, Applications, and Programming. 3rd ed. Abingdon: Routledge (2016).
87. Thomas NS, Barr PB, Hottell DL, Adkins AE, Dick DM. Longitudinal influence of behavioral health, emotional health, and student involvement on college student retention. J Coll Stud Dev. (2021) 62:2–18. doi: 10.1353/csd.2021.0001
88. Crocker L, Algina J. Introduction to Classical and Modern test Theory. Princeton, NJ: ERIC (1986).
89. Ferguson E, Cox T. Exploratory factor analysis: a users’ guide. Int J Sel Assess. (1993) 1:84–94. doi: 10.1111/j.1468-2389.1993.tb00092.x
90. Tavakol M, Dennick R. Making sense of Cronbach’s alpha. Int J Med Educ. (2011) 2:53. doi: 10.5116/ijme.4dfb.8dfd
91. Lee B. A serial mediation model of gratitude on life satisfaction in people with multiple sclerosis: the intermediary role of perceived stress and mental health symptoms. Mult Scler Relat Disord. (2022) 58:103421. doi: 10.1016/j.msard.2021.103421
92. Lee B, McDaniels B, Grenawalt TA. Resilience as a moderator in the relationship between disability related stress and community participation in individuals with multiple sclerosis. Psychol Health Med. (2022). [Epub ahead of print]. doi: 10.1080/13548506.2022.2072915
93. Lee B, Rumrill P, Tansey TN. Examining the role of resilience and hope in grit in multiple sclerosis. Front Neurol. (2022) 13:875133. doi: 10.3389/fneur.2022.875133
94. Phillips BN, Fleming AR, Bean B, Umucu E, Lee B, Roundtree SM, et al. Relations among gratitude, adaptation to disability, and flourishing among adults with disabilities: a longitudinal mediation model. Rehabil Psychol. (2022). [Epub ahead of print]. doi: 10.1037/rep0000448
Keywords: positive psychiatry, positive psychology, college adjustment, veterans, self-efficacy, Tinto’s model
Citation: Umucu E (2022) Creating a college adjustment index score for student veterans with and without disabilities. Front. Psychiatry 13:1020232. doi: 10.3389/fpsyt.2022.1020232
Received: 16 August 2022; Accepted: 06 October 2022;
Published: 26 October 2022.
Edited by:
Antonio Vita, University of Brescia, ItalyReviewed by:
Anthony Copez-Lonzoy, Saint Ignatius of Loyola University, PeruCopyright © 2022 Umucu. This is an open-access article distributed under the terms of the Creative Commons Attribution License (CC BY). The use, distribution or reproduction in other forums is permitted, provided the original author(s) and the copyright owner(s) are credited and that the original publication in this journal is cited, in accordance with accepted academic practice. No use, distribution or reproduction is permitted which does not comply with these terms.
*Correspondence: Emre Umucu, dW11Y3VlbXJAbXN1LmVkdQ==; orcid.org/0000-0002-3945-6975
Disclaimer: All claims expressed in this article are solely those of the authors and do not necessarily represent those of their affiliated organizations, or those of the publisher, the editors and the reviewers. Any product that may be evaluated in this article or claim that may be made by its manufacturer is not guaranteed or endorsed by the publisher.
Research integrity at Frontiers
Learn more about the work of our research integrity team to safeguard the quality of each article we publish.